Lessons Learned From Large-Scale User Studies: Using Android Market As A Source Of Data
←
→
Page content transcription
If your browser does not render page correctly, please read the page content below
Lessons Learned From Large-Scale User
       Studies: Using Android Market As A Source
                        Of Data


                       Denzil Ferreira1, Vassilis Kostakos1, Anind K. Dey2
                                   1
                                     University of Oulu, Finland
                                2
                                  Carnegie Mellon University, USA


ABSTRACT
User studies with mobile devices have typically been cumbersome, since researchers have had to recruit
participants, hand out or configure devices, and offer incentives and rewards. The increasing popularity of
application stores has allowed researchers to use such mechanisms to recruit participants and conduct
large-scale studies in authentic settings with relatively little effort. Most researchers who use application
stores do not consider the side-effects or biases that such an approach may introduce. In this paper we
summarize prior work that has reported experiences from using application stores as a recruiting,
distribution and study mechanism, and also present a case study of a 4-week long study using the Android
Market to deploy an application to over 4000 users that collected data on their mobile phone charging
habits. We synthesize our own experiences with prior reported findings to discuss the challenges,
advantages, limitations and considerations of using application stores as a recruitment and distribution
approach for conducting large-scale studies.

Keywords: Computer Science, Ubiquitous Computing, Mobile Computing, Large-Scale Study,
Application Stores

INTRODUCTION
Recruiting a large number of participants for user studies in human-computer interaction (HCI) has been
challenging (e.g., participation compensation, location and time differences). Study media such as surveys
and questionnaires for data collection have taken a new form in recent years, where “in the field” has
been replaced with “online”, and automated logging devices have augmented diaries, video recorders and
cameras (e.g., Microsoft’s SenseCam (Microsoft Research, 2007), Nokia’s LifeBlog (Nokia, 2007)). This
shift represents a new trend in research methods, whereby mobile devices are used to collect data on
participants and their behaviours. Distribution channels such as Google’s Android Market or Apple’s
AppStore for iOS devices were established to allow users to find and install new applications easily on
their devices, and now offer opportunities for researchers to deploy their own applications to facilitate
their research. The popularity of mobile devices, coupled with the convenience of application stores,
makes this a rather compelling and powerful mechanism for recruiting and running large-scale mobile
computing studies.

   Mobile devices are increasingly popular and diverse, with worldwide sales approaching 1.6 billion
units, just last year (Gartner Research, 2010 & 2011). Thanks to the rapid development of wireless
technologies, smartphones allow people to be reachable anywhere and anytime. As “convergent” devices,
smartphones empower their owners with Internet access, music, audio and video playback and recording,
navigation and other communication capabilities (phone calls, SMS, MMS, etc.) (Zheng & Ni, 2006). In
addition to the benefits for end users, researchers and developers can also benefit from the powerful
devices that participants potentially carry on a daily basis. In the past, applications were developed by
researchers on demand and deployed to a small set of participants, usually on devices provided by the
researchers. Such a research method can result in misleading conclusions due to selection limitations
(Oliver, 2010); not allowing users to use their own devices increases the bias that can be introduced by
owning new hardware (McMillian, 2010). Nowadays, application stores allow the deployment of
applications to a much wider audience, potentially on a global scale, consisting of real users who carry
and own their own smart devices. As a result, researchers now can explore the potential of conducting
large-scale studies without much investment in hardware or recruitment. But resorting to application
stores as a distribution and recruiting mechanism has limitations and challenges of their own and is no
“silver bullet” for running mobile studies where a large number of widely distributed participants are
required.
This article includes a description of our use of an application store as a recruitment and distribution
mechanism for conducting such a large-scale study. The discussion is grounded in both previous work
and a case study summarizing our own experiences. The contribution of this article is an in-depth
discussion of the challenges, advantages, limitations and considerations of using application stores as a
distribution channel for conducting large-scale studies for mobile devices, grounding the discussion
sections in the context of our study and its findings.
We start by summarizing related work on conducting large-scale research, followed by a description of
our case study. The discussion section highlights our research results regarding our experiences running
the study, the challenges and how we overcame them as well as a set of important issues related to
conducting studies using application store deployments.
RELATED WORK
Mobile phones as a sensor
Researchers can use smartphones and develop applications to collect a variety of sensed data, such as that
from accelerometers, GPS, network usage, and application usage. For example, such applications can take
advantage of the sensors available on the handset, typically GPS and Internet connectivity to facilitate
context-aware applications (Corey, 2010; Oliver, 2010), accelerometers for motion tracking (Reddy et al.,
2010), Bluetooth for distance measurements from the device (Patel et al., 2006) and anomaly detection
(Buennemeyer et al., 2008; Schmidt et al., 2009).
The effort to collect this data is often substantial due to the recruitment process that needs to take place
and compensation of the participants, which is a common practice in research. The data collected from
subjects is then analyzed post-hoc in most cases, informing both researchers and industry of users’ actions
and current practices. Unfortunately, our understanding of users’ everyday practices in their natural
contexts is still very limited as the cost of performing such real-world data collections is often quite high.
Instead, insights are often derived from observations and analysis of user behavior in laboratory or staged
environments (Korn, 2010), which might suffer from reduced ecological validity.The growing functionality of smartphones requires more power to support operation throughout the
day. Processing power, feature-sets and sensor use are bottlenecked by battery life limitations, with the
typical battery capacity of smartphones today being barely above 1500 mAh (Corey, 2010). This is an
important limitation because smartphones are increasingly regarded as a gateway to one’s daily life,
providing networking access to email, social networking, and messaging, making the management of
battery life an important task for the user (Cuervo, 2010) as well for researchers.
Application stores as a distribution mechanism
If a large number of participants are required in the domain of mobile computing, application stores can
be exploited nowadays as a vehicle for research projects, moving past the limitation of a small group of
users, from which case studies can be constructed. Application stores are now regarded as an essential
element in the software distribution process, connecting developers to consumers, with the potential to
reach a wide range of consumers (Girardello & Michahelles, 2010). Application stores are no “silver
bullet” for large-scale studies, as they have inherent limitations and challenges that need addressing. For
example, considering several applications deployed on Apple’s AppStore and Google’s Android Market,
suggests that identifying a balance between a polished application or a work-in-progress can have great
impact on participants’ willingness to download and install an application (Michahelles, 2010). This
willingness is also based on reviews and screenshots of the application, description of the application,
developer’s information, etc. Furthermore, the “deploy-use-refine” approach can improve the application
as users’ feedback is received, although differences in device hardware can lead to different and
unexpected results, where users blame the developers instead of the underlying inconsistencies of the
software development kit (SDK) (Miluzzo & Lane & Lu & Campbell, 2010).
While application stores offer the potential of reaching a large number of participants, doing so
requires advertising and marketing (Rohs et al., 2010). For example, Oliver & Keshav’s (2010) work on
the Energy Emulation Toolkit (EET), which allows application developers to evaluate the energy
consumption footprints of their applications, was deployed on over 15000 Blackberry phones located all
over the world by advertising the application using a webpage, blog, posters and by sharing QRCodes.
Advertising of any kind is important for reaching users, and, when successfully managed, it can often lead
to a substantial number of users. Another challenge can be the application store itself. For example,
Apple’s AppStore review process and certification mechanisms force researchers to change their
distribution strategy to the typical and formal process for deploying iPhone applications. An ad-hoc
installation approach has proven successful (Church & Cherubini, 2010), where researchers email their
application with installation instructions to recruited subjects to install themselves. Despite having to use
this approach, Church & Cherubini (2010) were able to involve more participants and deploy more easily
than if they had to interact with each subject individually in person. Furthermore, McMillian’s (2010)
results show that using alternative unofficial repositories provide greater chances for recruiting
participants.
From a participation standpoint, conducting studies using application stores can be a challenge due to
the increased uncertainty about the actual users taking part in the study, both in terms of demographics
and their behaviors with applications. A large-scale study in which participants are engaged through the
deployment of a mobile application is quite different from previous research methodologies (Morrison et
al., 2010). It is harder to obtain and evaluate details about how a system is being used by a participant if
we do not have any means of contacting or interacting with the user. Furthermore, users often feel lessobligated to use an application they download from an application store, as there might not be any
motivation factors at all for them other than initial interest. According to the results presented by
Morrison et al. (2010), adding a fun or competitive element to the research application helps to engage
users and increase participation in the long run.
While the validity of using application stores’ users as participants in studies may be debatable, a
similar challenge has been faced in recent HCI literature that addresses the use of crowdsourcing as a
means of conducting studies. In such cases, it has been shown that although recruiting participants from a
crowdsourcing market does not provide as much control as a traditional laboratory setting, one benefit is a
greater diversity of workers that is more representative of the online population than undergraduate
college students (a common source of subjects for studies) would be (Ipeirotis, 2010). Furthermore, the
legitimacy of conducting both cognitive and social experiments with Mechanical Turk (a crowdsourcing
engine that resorts on humans to perform artificial intelligence challenging tasks (Mechanical Turk,
2005)) has been supported by multiple studies (e.g., Horton et al., 2010; Heer & Bostock, 2010; Kittur et
al., 2008)). Although the Android Market population might still not be representative of society (AdMob
Mobile Metrics, 2010), research on crowdsourcing suggests that this trend may change in the near future,
as the population changes from being mostly early adopters to everyday smartphone users.
Finally, it is important to note that the amount of data generated in the course of a large-scale study
should not be underestimated (Morrison & Chalmers, 2010). Understanding and visualizing the data that
remote participants generate can indeed be overwhelming, and, in most cases, specialized tools will be
necessary to deal with the large volume of data. At the moment, however, the use of mobile phones in
large scale studies is still in its infancy, and research methods and tools developed in the past need to be
validated and adapted to this new approach (McMillian, 2010; Morrison et al., 2010).
Given all of these previously reported challenges and recommendations, we present a case study
discussing our own experiences in exploiting the Android Market in a user study.
CASE STUDY: BATTERY CHARGING PATTERNS
From late 2010 onwards, we conducted a large-scale users study using the Android Market application
store to recruit participants and study their battery charging behavior. The study’s goal was to understand
how mobile phones’ charging was performed in real-world settings. For the results regarding this study
please refer to Ferreira et al. (2011).
Looking at how people manage and recharge their smartphones was in itself not novel. For example,
Ostendorp et al. (2004) focused on discovering how batteries can be more energy efficient and where
there are opportunities for energy savings. Zhang et al.’s (2010) work looked at how people perceive their
device’s battery and tried to provide accurate battery life estimates; Byrne (2010) claims that batteries are
as good as the way people charge them, while Corey (2010) exposes nine ways to damage a smartphone
battery. Most of the previous related work was conducted using a small number of devices. An exception
was Oliver’s (2010) large-scale study, which also discussed the challenges of managing the recruiting
effort, and the marketing and deployment of an application to a considerable amount of study participants.
Our work differed both on research goals as well as deployment method and study environment. Oliver’s
study focused on how the battery depletes while ours focused on how users charge the battery. Oliver
used multiple distribution methods such as web-distribution (e.g., webpages, blogs), and advertisements
(e.g., posters and shared QRCodes), from which correspondents would install the application on theirdevice, while we deployed the application to a large number of participants by exploring an application
store as a distribution method. In doing so, we encountered different limitations, concerns and challenges,
such as, how the reviewing capability of application stores affects the participants’ willingness to
participate in a study.
Our study began by first deploying to the Android Market an application that only displayed real-time
battery information. As soon as we deployed this application, it became apparent that stability, reliability,
usability and performance of the application were absolutely crucial for user acceptance, and therefore
our efforts initially focused on achieving these. When we initially published the application, we clearly
described the purpose of the application, and we encouraged users to provide feedback in order to
improve the application. To enhance stability and reliability, the application was initially programmed to
start automatically when a user’s device was either turned on or rebooted. The design decision to prohibit
users from manually starting or stopping the application turned out to be inappropriate, as we received
many reviews with low scores and 4 direct emails from our users:
“This app is installed but it says it isn't..please fix that...but great app by the way”
“This app can't be opened it starts after a restart”
Based on user feedback we decided to add an interface for settings where the users could decide when
to run the application [Figure 1]. The users could choose to start the application manually, set it to
automatically start when the device rebooted or turned on, or set it to run when the device begins
charging.
Figure 1. Application configuration: start at bootup (starts the application automatically when rebooted
or turned on), run on plugged (start the application automatically when connecting to charger), dock
mode (would display more battery information when charging).
We also added a small icon in the notification bar at the top of the screen to keep users informed that
data was being collected and to allow users to view further information. The initial notification icon was
red, which the users described as “alarming” or confusing when contrasted with the default battery icon.
“Nice idea but […] the red tray icon looks alarming while it isn't.”
“Why is the icon red, while the battery is green?”
Following the Android 2.0 notification design guidelines (Android’s Status Bar Icons, 2009), we
updated the application notification to the standard black on gray background, seamlessly integrating with
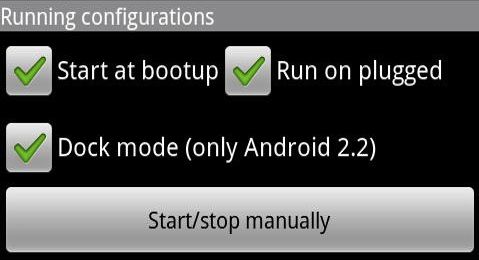
the operating system look and feel [Figure 2].Figure 2. Highlighted is the notification bar information: battery percentage, voltage, battery charging status, battery health, battery temperature and battery uptime – amount of time since last charge. The users responded positively (which increased the application rating from 3.5 to 4 out of 5 start) to the new interface. By pulling down the notification menu, the battery information could be accessed regardless of other foreground (currently visible) applications. “Very convenient battery percent in status bar! Used on G1, now on DROID. All works great!” “I love this app!! My battery NEVER goes dead!! And it really helps with my battery health.” “Great app. It gives a lot of insight about your phone's power status. The battery icon in the top-bar doesn't tell you a lot, this app changes that.” For performance, as we were collecting battery data, we made sure we were not biasing the battery information by polling the device’s battery all the time, as it can reduce battery life (Oliver, 2010; Oliver & Keshav, 2010). The Android API (Application Programming Interface) is event-driven, hence gathering the data as the operating system broadcasted changes to the current battery information had a negligible impact on regular battery life, so much so that we do not have a single report of decreased battery life from the application users’ reviews or emails. To take advantage of the application’s user base as possible study participants, we released a new version of the application that had an opt-in feature (disabled by default) for collecting a range of battery data. A short time after we released the update, we were collecting battery data as users updated and opted-in to the study. We collected battery charging patterns from 4035 out of the 17000 users of the original application. In total, more than 7 million data points of battery information were collected during the study. At any given time, participants had the option to opt-out thus removing their battery data from our servers immediately. We monitored how many participants we had per day [Figure 3].
Figure 3. Fluctuations in the number of participants of the battery charging patterns study.

   On day one we had around 700 participants and by the following day, the number of participants
increased to almost 900. The number of participants then grew exponentially on the following days, to a
peak of 4437 participants. As expected, the amount of data shared by the participants also increased
[Figure 4].

Figure 4. Amount of data points shared by the participants of the battery charging patterns study.

   The amount of data increased from an average of 50000 data points per day to almost 250000 data
points per day. On day 40, we released a new version of the application that turned off the data collection.
We then observed how long it took for us to stop receiving data from the participants; it was 159 days
until all the participants had upgraded to the non-logging version of the application.

    The participants were distributed at different locations and time zones, with the majority coming from
the US and Japan [Figure 5]. There was no monetary compensation given to the participating users. Using
the application store as a distribution mechanism made it harder to consider participation compensation,
as the users were distributed around the world and we had no monetary reward mechanism in place that
would deal with different currencies and different compensation methods (e.g., gift cards, PayPal, credit
card).

Figure 5. Distribution of the battery patterns study participants by country, a week before the end of the
study.

    As highlighted by Oliver (2010), a large-scale user study distributed across the globe requires the use
of UTC timestamps. We captured the UNIX timestamp on the participant’s device time zone, which
results in consistent times across different time zones (i.e., 8pm is the same for different users at different
time zones). These timestamps were used across all data collection and analysis operations.

    The feedback given by the users on the several iterations of our application took two different forms:
reviews on the Android Market (364 reviews) and direct emails (14 emails), with an average rating of 4/5
stars. Although the study was conducted solely with Android devices, most of the results should be
similar to other smartphone platforms regarding the battery information (Oliver, 2008 & 2010). We also
acknowledge that the users who downloaded the application and opted-in to sharing their data are
somehow concerned with the battery life on their mobile devices. Therefore, they may in fact be atypical
users, and our sample may not be representative of what all smartphone owners would do. Nonetheless,
our study served as the first large collection of battery charging patterns that exploited an application store
as a recruiting and distribution mechanism.

DISCUSSION
Here we summarize the challenges, advantages, and considerations of using application stores as a
recruitment and distribution method for conducting mobile large-scale studies. Furthermore, we discuss
how we can use application stores for running controlled studies, how to perform maintenance on the
deployed applications and what the limitations are of running a study in an application store environment.
The battery information application was already available on Android Market for 4 months, before it
was used for this study, with approximately 17 thousand users over that period. During this time, the
users became familiar with the application and, by doing so, allowed us to improve and fix any reported
problems. We then released a new version of the application that gave users the option to opt-in to sharing
their battery data anonymously as part of our study. We observed that adding the study component as an
opt-in, did not decrease the number of active installations.
The Android Market enables users to give open-ended feedback regarding an application they have
tried. In our study we found this mechanism to be extremely useful in identifying bugs and problems with
the software, allowing us to correct them. This can be especially useful during the pilot stage of a study,
and can ensure that most issues have been resolved before proceeding further with a study. For instance,
during our deployment we were able to identify handset configurations for which our software was
incompatible by analyzing user feedback, and we updated the application accordingly. Additionally, user
feedback helped us identify bugs in various handsets’ Android implementation, which was usually a
result of the manufacturers’ customization of the platform. We were able to incorporate a workaround in
our software to deal with such bugs. Despite the richness of user feedback, a crucial limitation of the
feedback mechanisms in Android Market is that application developers are not allowed to directly
respond to user comments, not even for the purpose of following up or obtaining more detailed
information. Some participants resorted to emails to communicate directly to us in case they had any
problem, as we added our email to the application’s description and motivated them to use it if required.
An important characteristic of the Android Market is that due to the lack of a centralized
authorization process, anyone is allowed to publish an application to the application store. As a result, the
community relies heavily on community feedback to identify applications that may be problematic, badly
written, or even possibly deceiving (Enck et al., 2008). The Android user community has effectively
developed a social norm for attaching high value to user comments, especially negative ones. In this case,
comments serve as a mechanism for establishing trust between users and application developers in the
absence of a trusted third party. It is therefore crucial that researchers try to avoid negative comments for
their software at all cost, otherwise the risk of attracting only a small number of participants is quite high.
Informing potential participants about what kind of data is being collected and what it is going to be used
for can also increase participation rates. As such, following Oliver’s (2010) recommendation about
transparency on the data collected for the study, we created a website which the participants could consult
and added more information to the application’s description. By doing so, on day 3 of the study we had a
tremendous increase in terms of study participants, going from 900 on day 2 to 3600 by the next day
[Figure 3], as well as an increased data flow into the server, from an average of 50000 data entries per day
to almost 250,000 per day [Figure 4]. On day 4, we introduced a new description which made it clearer
how we were using the collected data. This increased the ratio of opt-ins from existing application users
to new users (from 1:5 users to 3:5 users would volunteer battery information).
Although Android phone users regularly install and provide feedback on applications and as such
they serve as a good pool for recruiting participants for studies, the majority of Android phone users are
young males (73%) (AdMob Mobile Metrics, 2010), which can potentially lead to gender and age biased
results. This may in fact be changing now that the Android platform has surpassed all other platforms in
popularity (46,3%) (Silicon Valley Journal, 2011). In addition, users are not yet accustomed to
downloading research applications from a commercial platform (Miluzzo et al., 2010), which can make it
somewhat difficult to explain and justify the purpose of the research application. Therefore, a researchapplication needs to provide users with benefit, a reason for which they will use the application and, at the
same time, motivate them to voluntarily contribute to a study (e.g., our application provided battery
information to the user that otherwise would not be visible, and in return the user shared battery
information for further analysis). In our study, participation was voluntary and anonymous and did not
restrict in any way the regular usage of the application. This allowed us to receive reviews and feedback
from users through reviews left on Android Market, even though they were not actively participating in
the study or explicitly providing feedback.
Running Controlled Studies on Application Stores
The Android Market, and application stores in general, allow researchers to run controlled studies. One
fundamental requirement for running controlled studies is having two or more versions of a system,
which may represent experimental conditions. A combination of technological and programmatic features
and controls (i.e., multiple versions targeting different hardware versions of the devices) can help
researchers deploy software in a controlled yet rather realistic environment. For instance, an example in
the context of the software we deployed would be to assess the impact of including notifications when a
battery completed charging, on user behavior. Therefore, two versions of the system could be tested: one
that delivers notifications to users, and one that does not. One way to achieve this would be to develop a
single piece of software that upon installation or initial launch assigns the user to one of two conditions.
This could be done randomly on an ad-hoc basis, but this has the limitation that a user may uninstall and
re-install the application and thus possibly be allocated to more than one condition. Another approach
would be to rely on the device’s unique IMEI identifier and use that to allocate users to conditions (for
instance, all IMEI’s ending in an odd digit would be assigned to one condition, and the rest in another
condition). This approach fails when users own multiple devices, in which case it may be best to rely on
the user’s Google Account ID (specific to Android platforms) to allocate users to conditions. This could
ensure that the user is always allocated to the same condition regardless of how many devices they use.
In addition to hard-coding rules about which condition a user should be allocated to, the Android
platform supports a licensing mechanism that can be used to create the same effect. While the license
mechanism was developed to allow multiple versions of a single application (e.g., “free” and “premium”),
the same mechanism can be used to publish multiple versions of an application (e.g., “condition1”,
“condition2”). To ensure that both applications do not run at the same time, install-time and run-time
checks are supported by the platform to let an application know whether a different version of the same
application is installed. This way, an application can terminate itself if it detects the presence of another
version of the same application on the same handset. Besides assigning users to conditions, some
experimental designs require that only a specific group of users install the applications. There are a
number of ways to segregate and characterize the users of an application. While imposing restrictions on
who installs an application from Android Market is only possible in terms of OS requirements, it is
possible to allow only a specific group of users to run the application by simply executing a run-time
check on whether specific criteria are met. One technique is to rely on a user’s IP address, carrier, or
even real-time GPS coordinates to infer the country in which they reside. Another approach is to detect
the actual handset of the user and restrict use only to a specific handset model. Furthermore, it is possible
to target specific users by avoiding the application store approach, and instead deploying an application
independently on a personal website. This, for instance, can allow researchers to issue a screening
questionnaire to potential participants and, depending on the received answers, dynamically decide if, and
which version of the, software should be given to the participants.Finally, certain experimental designs require multiple stages (e.g., before and after an intervention) and pieces of software as part of their data collection. The use of IMEI identifiers, or Google Account ID’s in the case of Android devices, can be an effective mechanism to keep track of a specific participant across multiple stages of a study. These identifiers are the most likely to remain unique and constant throughout a study, while being pragmatically retrievable. Maintenance of Deployed Software Researchers can now reach users’ personal devices, without the need to be physically present or in the same time zone. However, the cost of using application stores to deploy research applications is far from zero. Releasing an application to the public requires significant development effort. As shown previously (Michahelles, 2010), a flawed application leads to bad reviews. That, in turn, inhibits adoption and participation in research studies. Underestimating the number of participants can also lead to servers becoming overloaded (Morrison et al., 2010). Keeping up with the latest standards is also a challenge: the Android platform’s SDK changed from 1.6 to 2.3 in a matter of months, leaving carriers with the job of issuing their customers with multiple updates. From a researcher’s perspective, upgrading of the application can lead to the loss of participants if the application itself is upgraded to a higher SDK level and the participants keep their devices on a lower level. Similarly, one’s application may break if it was written for a particular SDK level, and the carrier causes participants’ phones to upgrade to the newest level. Recent changes in the SDK libraries now allow developers to overlay compatibility packages with their applications (Android Support Package, 2011). This enables applications to gracefully enable and disable functionalities that might not be available on all devices (i.e., Wi-Fi is not available on some 3G- only devices, GPS is not available on some tablets, etc.) or run different versions of the Android API. Our experience shows that the maintenance of deployed software is relatively well supported using an application store. In our case we issued minor updates of our deployed application in order to address a number of issues with the data logging functionality. We found that a large portion of the user base very quickly updated the software on the handset, with the majority of users being reached within a few hours. This is mainly due to the fact that when a developer uploads a new version of an application to Android Market, a few minutes later, users who have installed the previous version of the application receive a notification on their handsets prompting them to update their software. We also noticed that the rate of uptake of updates is much higher than the rate of attracting new users to the application. In other words, we found that the rate at which existing users of our application installed the update we released was much higher than the rate at which first-time users were installing the application. This can be an important detail when conducting user studies, and especially in situations when a large amount of data is required in a relatively short time. Given an established participant pool already running a certain application on their phone, a strategy would be to release a software update, as we did, and have participants interact with the application thus generating feedback and useful data. Limitations of the Android Market The Android Market can be attractive for mobile computing researchers that need to run a large-scale study that is application-based: applications are not reviewed before becoming public, which means faster deployment; updates are available as soon as they are submitted; and the Android platform offers more flexibility in what can be built than other less open platforms.
Despite its advantages, the Android Market has the following shortcomings that researchers need to
consider. The number of applications nowadays available on the Android Market has increased from
2,300 applications in March 2009 (PCWorld, 2009) to over 200,000 applications in April 2011, where
64% of them are free applications (Research2Guidance April Report, 2011). This makes new
applications hard to find, as users need to know what they are looking for, forcing them to either search
or browse through the list of available applications, either on their mobile devices or online. Although the
Android Market now pushes newly released applications to a category “Newly released”, thus for a short
period of time there is public exposure to the application, it is hard to maintain visibility unless the
developer keeps pushing new updates regularly or the application becomes popular. This in turn can be
annoying for users who are already using the application, as they are constantly prompted to update the
application running on their device.

    Applications on the Android Market are publicly criticized, where public review can either result in
more users than anticipated or have the opposite effect. Unfortunately, much of this is out of the
researchers’ control as there is no mechanism in place to remove old bad reviews or reply directly to a
reviewer to follow-up on reported problems. Thus, this is a serious limitation because it makes it
impossible for researchers to directly request further information from a user. It is therefore important that
researchers offer a secondary channel of communication to allow them to interact with the users in order
to deal with users’ difficulties. One mechanism to achieve this would be a built-in feedback option, which
allow users to send a report or feedback directly from within the application, thus allowing researchers to
follow-up if appropriate and possibly avoid bad ratings on the Android Market. As another example, to
collect qualitative data, a researcher can have the application periodically contact the server to check if
researchers have posted any questions that should be delivered to the users to reply to, such as surveys or
questionnaires. Furthermore, reviews are not dependent on the version of the application deployed and are
not reset every time a new update is released, meaning that previously reported problems (thus lower
ratings) that are no longer an issue with the current version, will still be visible to other potential new
users, which might demotivate them from using the application.

    Android devices do not reach a representative part of society, as 73% of application store users are
young males (AdMob Mobile Metrics, 2010; Church & Cherubini, 2010), which can result in gender bias
in research results. A further limitation of the Android Market is the lack of detailed information
regarding the history of adoption of an application. While the developer portal allows developers to see
how many users an application currently has, including a graph with the history of the number of active
installations, exporting the data is not possible for further analysis. This can be very useful information
for researchers, and one mechanism to capture this is to provide server-side logging of each new
installation as it takes place. Additionally, empirical evidence suggests that the information on the number
of active users for a specific application provided by Android Market may be unreliable, with many
developers claiming that the number seems to change abruptly, for instance suddenly dropping by 1000 in
the course of a single day (Android Download Count Problems, 2010).

   Finally, developing a research tool to be deployed on an application market requires careful planning
and evaluation of how much time and effort is to be dedicated to implement the research tool. Deciding
which mobile platform will affect n which application market the application can be deployed, as
applications for the Android platform will not run on iPhones, Symbian devices, and others. PhoneGap
(PhoneGap, 2011) tries to solve this problem, by providing an alternative to native application
development using HTML5 web-based applications, which can be deployed nowadays on different
platforms, although with restrictions depending on the targeted platform. Still, unfortunately, each mobile
development platform offers specific limitations on which information can be harvested, especially
considering mobile sensors and other applications’ data sharing and access. The decision upon which
Android version a researcher should develop an application for will affect how many participants can be
recruited and also the data that can be collected (e.g., if Bluetooth information is required, then Android
API 1.6 or higher is necessary; if CDMA information is of interest, then Android API 2.1 or higher is
required). This can be mitigated using the compatibility overlays to make the applications compatible
with multiple configurations, although at the price of occupying more memory space on the device, plus
the amount of time spent maintaining multiple versions of the application depending on the API level.
CONCLUSION
More than ever, industry and academic researchers have an opportunity to resolve numerous issues and
conduct large-scale studies using published applications on application stores. For example, marketing
and mobile phone manufacturers study a variety of user activities, focusing on the design of new handsets
and/or new services (Patel et al., 2006). Using automatic logging, in which software automatically
captures users’ actions for later analysis provides researchers with the opportunity to gather data
continuously, regardless of location or activity the user might be performing, without being intrusive.
Asking users to anonymously collect battery information using a Android Market application was a
success: we collected more than 7 million battery information points from 4035 participating devices
from all over the world, from which we explored battery charging patterns. The results from our large-
scale deployment provided application developers and manufacturers with information about how
smartphone batteries are being charged by a large, geographically distributed population.
We believe that deploying research software for mobile user studies on application stores, when a
large number of participants and data is required, turned out to be an excellent way to reach a wider
audience and increase the scale of collected data with relatively small added cost. Application stores offer
an interesting balance between control and realism in running user studies, and while they do have a
series of limitations, they are certainly extremely useful for research purposes.
ACKNOWLEDGEMENTS
We thank all the anonymous participants that contributed for the study using our application. This work
was supported in part by the Portuguese Foundation for Science and Technology (FCT) grant CMU-
PT/HuMach/0004/2008 (SINAIS) and partially funded by the Nokia Foundation.
REFERENCES
1. AdMob Mobile Metrics (2010). January 2010 Mobile Metrics Report. Retrieved February 25,
2010 from http://metrics.admob.com/2010/02/january-2010-mobile-metrics-report/.
2. Android Developer Dashboard (2010). Retrieved September 1, 2010 from
http://developer.android.com/resources/dashboard/platform-versions.html.
3. Android Download Count Problems (2010). Android Developers Blog: Download Count
Problems. Retrieved December 2, 2011 from http://android-
developers.blogspot.com/2010/06/download-count-problems.html.4. Android Status Bar Guidelines (2009). Retrieved December 2, 2011 from
http://developer.android.com/guide/practices/ui_guidelines/icon_design_status_bar.html.
5. Android Support Package (2011). Support Package | Android Developers. Retrieved
December 2, 2011 from http://developer.android.com/sdk/compatibility-library.html.
6. Android OS (2011). Android. Retrieved February 24, 2011 from http://www.android.com
7. Byrne, J.A. (2010). The Proper Charging Of Stationary Lead-Acid Batteries. (Your Battery Is
Only As Good As How You Charge It.). Battcon’10, Hollywood, Florida.
8. Buennemeyer, T.K., Nelson, T.M., Clagett, L.M., Dunning, J.P., Marchany, R.C., Tront,
J.G. (2008). Mobile Device Profiling and Intrusion Detection using Smart Batteries.
Proceedings in the 41th Hawaii International Conference on System Sciences.
9. Church, K., Cherubini, M. (2010). Evaluating Mobile User Experience In-The-Wild:
Prototypes, Playgrounds and Contextual Experience Sampling. Ubicomp’10 workshop on
Research in the large: Using App Stores, Markets and other wide distribution channels in
UbiComp research, Copenhagen, Denmark.
10. Corey, G.P. (2010). Nine Ways To Murder Your Battery (These Are Only Some Of The
Ways). Battcon’10, Hollywood, Florida.
11. Cuervo, E., Balasubramanian, A., Cho, D., Wolman, A., Saroiu, S., Chandra, R., Bahl, P.
(2010). MAUI: Making Smartphones Last Longer with Code Offload. MobiSys 2010, San
Francisco, California.
12. Enck, W., Ongtang, M., McDaniel, P. (2008). Mitigating Android Software Misuse Before It
Happens. Networking and Security Research Center. Technical Report NAS-TR-0094-2008.
Pennsylvania State University, Pennsylvania.
13. Gartner Research (2010). Gartner Says Worldwide Mobile Device Sales Grew 13.8 Percent
in Second Quarter of 2010, But Competition Drove Prices Down. Retrieved August 12, 2010
from http://www.gartner.com/it/page.jsp?id=1421013.
14. Gartner Research (2011). Gartner Says Worldwide Mobile Device Sales to End Users
Reached 1.6 Billion Units in 2010, Smartphone Sales Grew 72 Percent in 2010. Retrieved
February 9, 2011 from http://www.gartner.com/it/page.jsp?id=1543014.
15. Girardello, A., Michahelles, F. (2010). Boostrapping Your Mobile Application on a Social
Market. Ubicomp’10, Copenhagen, Denmark.
16. Ferreira, D., Dey, A.K., Kostakos, V. (2011). Understanding Human-Smartphone Concerns:
A Study Of Battery Life. Proceedings of Pervasive’11. San Francisco, California.
17. Heer J., Bostock, M. (2010). Crowdsourcing graphical perception: Using mechanical turk to
assess visualization design. Proceedings CHI’10.
18. Horton, J., Rand, D., & Zeckhauser, R. (2010). The online laboratory: Conducting
experiments in a real labor market. NBER Working Paper w15691.
19. Ipeirotis, P. (2010). Demographics of Mechanical Turk. New York University Working
Paper.
20. Kittur, A., Chi, E., Suh, B. (2008). Crowdsourcing User Studies With Mechanical Turk. CHI
2008: Proceedings of the ACM Conference on Human-factors in Computing Systems. New
York: ACM Press.
21. Korn, M. (2010). Understanding Use Situated in Real-world Mobile Contexts. Ubicomp’10
workshop on Research in the large: Using App Stores, Markets and other wide distribution
channels in UbiComp research, Copenhagen, Denmark.22. McMillian D. (2010). iPhone Software Distribution for Mass Participation. Ubicomp’10
workshop on Research in the large: Using App Stores, Markets and other wide distribution
channels in UbiComp research, Copenhagen, Denmark.
23. Mechanical Turk (2005). Amazon Mechanical Turk. Retrieved December 2, 2011, from
https://www.mturk.com/mturk/welcome.
24. Michahelles, F. (2010). Getting closer to reality by evaluating released apps?. Ubicomp’10
workshop on Research in the large: Using App Stores, Markets and other wide distribution
channels in UbiComp research, Copenhagen, Denmark.
25. Microsoft Research (2007). Microsoft Research SenseCam. Retrieved February 14, 2010,
from http://research.microsoft.com/en- us/um/cambridge/projects/sensecam/.
26. Miluzzo, E., Lane, D. N., Lu, H., Campbell, A. (2010). Research in the App Store Era:
Experiences from the CenceMe App Deployment on the iPhone. Ubicomp’10 workshop on
Research in the large: Using App Stores, Markets and other wide distribution channels in
UbiComp research, Copenhagen, Denmark.
27. Morrison, A., Chalmers, M. (2010). SGVis: Analysis of Mass Participation Trial Data.
Ubicomp’10 workshop on Research in the large: Using App Stores, Markets and other wide
distribution channels in UbiComp research, Copenhagen, Denmark.
28. Morrison, A., Reeves, S., McMillan, D., Chalmers, M. (2010). Experiences of Mass
Participation in Ubicomp Research. Ubicomp’10 workshop on Research in the large: Using
App Stores, Markets and other wide distribution channels in UbiComp research,
Copenhagen, Denmark.
29. Nokia (2007). Nokia LifeBlog. Retrieved October 12, 2010, from
http://www.nokia.com/lifeblog/.
30. Oliver, E. (2008). A Survey of Platforms for Mobile Networks Research. Mobile Computing
and Communications Review, Volume 12, Number 4, (pp. 56-63).
31. Oliver, E. (2010). The Challenges in Large-Scale Smartphone User Studies. International
Conference On Mobile Systems, Applications And Services, Prec. 2nd ACM International
Workshop on Hot Topics in Planet-scale Measurement, San Francisco, California.
32. Oliver, E., Keshav, S. (2010). Data Driven Smartphone Energy Level Prediction. University
of Waterloo Technical Report. No. CS-2010-06.
33. Ostendorp, P., Foster, S., Calwell, C. (2004). Cellular Phones, Advancements in Energy
Efficiency and Opportunities for Energy Savings. NRDC 23.
34. Patel, S.N., Kientz, J.A., Hayes, G.R., Bhat, S., Abowd, G.D. (2006). Farther Than You May
Think: An Empirical Investigation of the Proximity of Users to Their Mobile Phones.
Dourish, P., Friday, A. (eds.) UbiComp 2006. LNCS, vol. 4206, pp. 123–140, Springer,
Heidelberg.
35. PCWorld (2009). Android Market Needs More Filters. Retrieved December 2, 2011 from
http://www.pcworld.com/article/161410/android_market_needs_more_filters_tmobile_says.h
tml.
36. PhoneGap (2011). PhoneGap Supported Features. Retrieved December 2, 2011 from
http://phonegap.com/about/features.
37. Rahmati, A., Qian, A., Zhong, L. (2007). Understanding Human-Battery Interaction on
Mobile Phones. MobileHCI’07, 9th Intl. Conf. on Human Computer Interaction with Mobile
Devices and Services (pp. 265-272), September 9-12, Singapore.38. Ravi, N., Scott, J., Han, L., Iftode, L. (2008). Context-aware Battery Management for Mobile
Phones. Sixth Annual IEEE International Conference on Pervasive Computing and
Communications.
39. Research2Guidance April Report (2011). Android Market Insights April 2011. Retrieved
December 2, 2011 from http://www.research2guidance.com/shop/index.php/android-market-
insights-april-2011.
40. Reddy, S., Mun, M., Burke, J., Estrin, D., Hansen, M., Srivastava, M. (2010). Using Mobile
Phones to Determine Transportation Modes. ACM Transactions on Sensor Networks 6(2),
article 13.
41. Rohs, M., Kratz, S., Schleicher, R., Sahami, A., Schmidt, A. (2010). WorldCupinion :
Experiences with an Android App for Real-Time Opinion Sharing during World Cup Soccer
Games. Ubicomp’10 workshop on Research in the large: Using App Stores, Markets and
other wide distribution channels in UbiComp research, Copenhagen, Denmark.
42. Schmidt, A.D., Peters, F., Lamour, F., Scheel, C., Çamtepe, S.A., Albayrak, S. (2009).
Monitoring Smartphones for Anomaly Detection. Mobile Network Applications.
43. Silicon Valley Journal (2011). Android phones, iPhones grow market share. Retrieved
December 2, 2011 from http://www.bizjournals.com/sanjose/news/2011/12/05/android-
phones-iphones-grow-market.html.
44. Zhang, L., Tiwana B., Dick, R. P., Qian, Z., Mao Z.M., Wang, Z., Yang, L. (2010). Accurate
Online Power Estimation And Automatic Battery Behavior Based PowerModel Generation
for Smartphones. CODES+ISSS’10, Scottsdale, Arizona, USA.
45. Zheng, P., Ni, L. M. (2006). Spotlight: The Rise of the Smart Phone. IEEE Distributed
Systems Online, Vol. 7 No. 3, art. no. 0603-o3003.You can also read