Capturing the Coastline - Mapping Coastlines in WA Over 75 Years Department of - Department of Transport
←
→
Page content transcription
If your browser does not render page correctly, please read the page content below
Department of
Transport

                Mapping Coastlines in WA Over 75 Years
                       Capturing the Coastline
                                          September 2018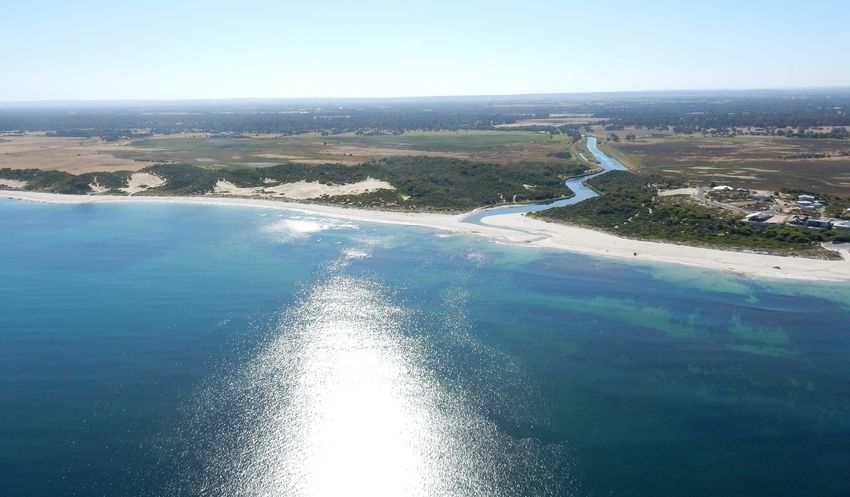
Capturing the Coastline
Prepared for Department of Transport
Prepared by Tim Stead
Date September 2018
Objective number DT/16/01027
Version control
Version No. Date Prepared by Revision or issue description Issued to
0 18/09/2018 T.Stead Final report FL, CMAG
Amendment record
This guidelines document is reviewed to ensure its continuing relevance to the systems and process that it
describes. A record of contextual revisions is listed in the following table.
Page No. Context Revision Date
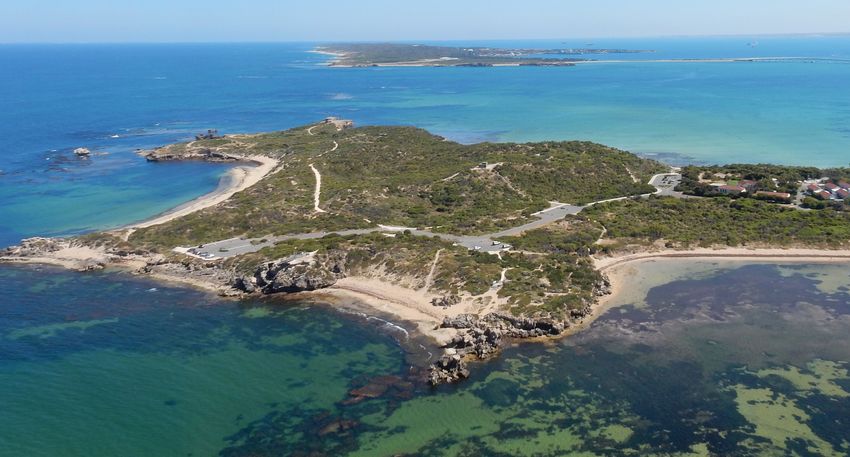
Front pages images: Point Peron (top) and Busselton (bottom)
2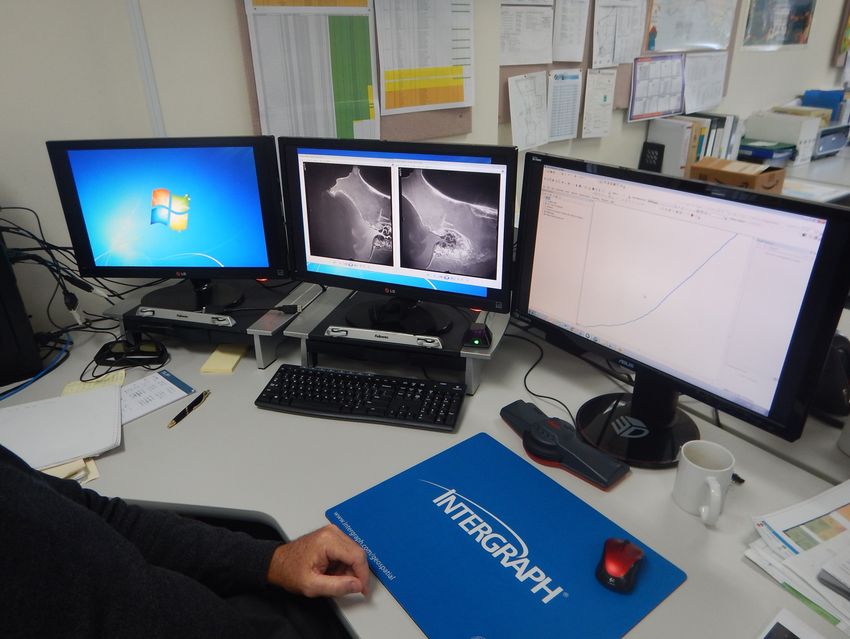
Contents
Executive Summary _____________________________________________________________________________ 4

Glossary of terms    _____________________________________________________________________________ 5

1.    Introduction   _____________________________________________________________________________ 6

1.1   Background _____________________________________________________________________________ 6
1.2   Coastline capture for coastal management_____________________________________________________ 6
1.3   Purpose        _____________________________________________________________________________ 8
1.4   Aims and objectives________________________________________________________________________ 8
2.    Methods        _____________________________________________________________________________ 9

2.1   Software and hardware_____________________________________________________________________ 9
2.2   Sourcing of aerial imagery__________________________________________________________________ 10
2.3   Digitisation of older imagery_________________________________________________________________ 11
2.4   Aerotriangulation of imagery________________________________________________________________ 11
2.5   Coastline capture_________________________________________________________________________ 12
3.    Results        ____________________________________________________________________________ 14

3.1   Coverage of created datasets_______________________________________________________________ 14
3.2   Web hosting of created datasets____________________________________________________________ 15
3.3   Dataset accuracy and ameliorations__________________________________________________________ 17
4.    Discussion     ____________________________________________________________________________ 19

4.1   Applications of improved coastline data in WA_________________________________________________ 19
4.2   Recommended direction for coastline data in WA______________________________________________ 22
References           ____________________________________________________________________________ 24

Appendix A - Coastline Dataset Information                                                           25

Appendix B - Coastal Projects Aerial Triangulation Workflow__________________________________________ 34

                                                                                                           3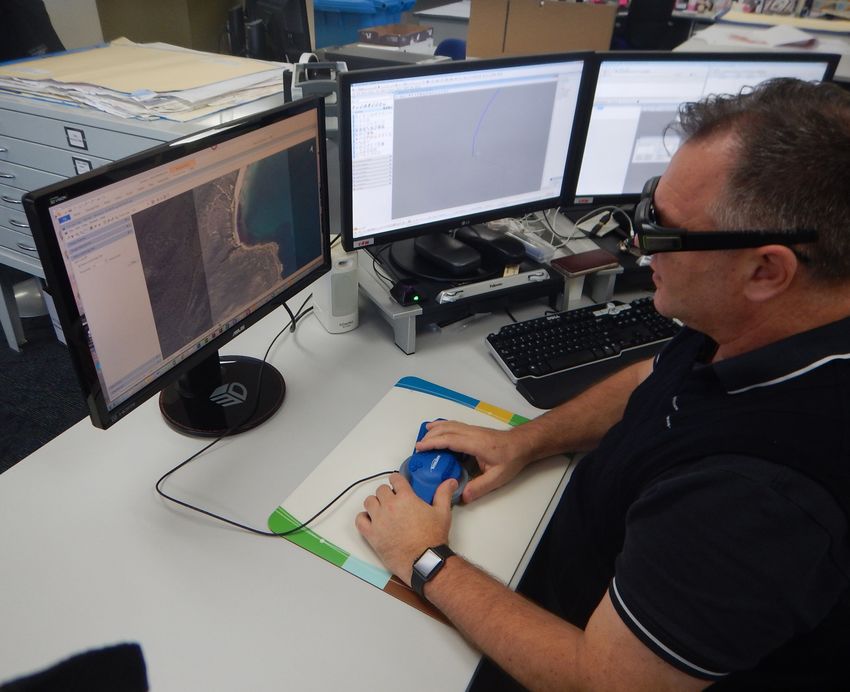
Executive Summary

    The Department of Transport (DoT), has undertaken creation of important datasets for WA coastal managers
    and planners. This work was carried out on behalf of a multi-agency working group called the Coastal
    Management Advisory Group (CMAG), which comprises State Government representatives. Historical coastline
    change information was created, allowing better planning and management of coasts under threat from erosion
    hazards. The datasets are a collection of coastal lines captured from aerotriangulated aerial photography for
    all decades from 1940 – 2016, providing a long-term systematic measure of coastline movements around the
    State with an emphasis on erosion hotspots. This project was funded by DoT over two consecutive financial
    years for 2016-17 and 2017-18.
    A coastal vegetation line represents the boundary between back beach and dune toe where vegetation first
    appears. By capturing the position of this line over the long term, a given section of coastline can be assessed
    for its evolution history over time. This coastline movement information is critical and valuable for coastal
    planning, plus it is included as a key requirement for coastal erosion allowance calculations in Schedule One
    of State Planning Policy No. 2.6 State Coastal Planning Policy (SPP 2.6). In addition, management of coastal
    erosion hotspots around WA requires coastline movement information.
    There is a large amount of aerial imagery starting from the 1940s to present covering WA’s coast. In this project,
    DoT obtained and aerotriangulated historical aerial imagery from known sources covering erosion hotspots and
    built-up coastlines. The coastline position was then captured from this imagery to provide for a holistic measure
    of WA coastline movements for coastal managers and planners.
    This project highlights the importance of continued coastline capture at regular intervals into the future through
    active budgetary and logistical planning. Key recommendations are listed below as outcomes of the project.
    These recommendations aim to ensure future generations can use this irreplaceable ground-truthed information
    to manage increasing challenges of coastal change under rising sea levels and a shifting climate.

       1. DoT to conduct annual management and sourcing of aerial photography runs across the state
       2. CMAG to source funding towards large scale aerial photography runs in intervals of no less than five
          years from Kalbarri to Israelite Bay
       3. DoT to manage ongoing and free public access to coastline movement information through public
          data hosting services

4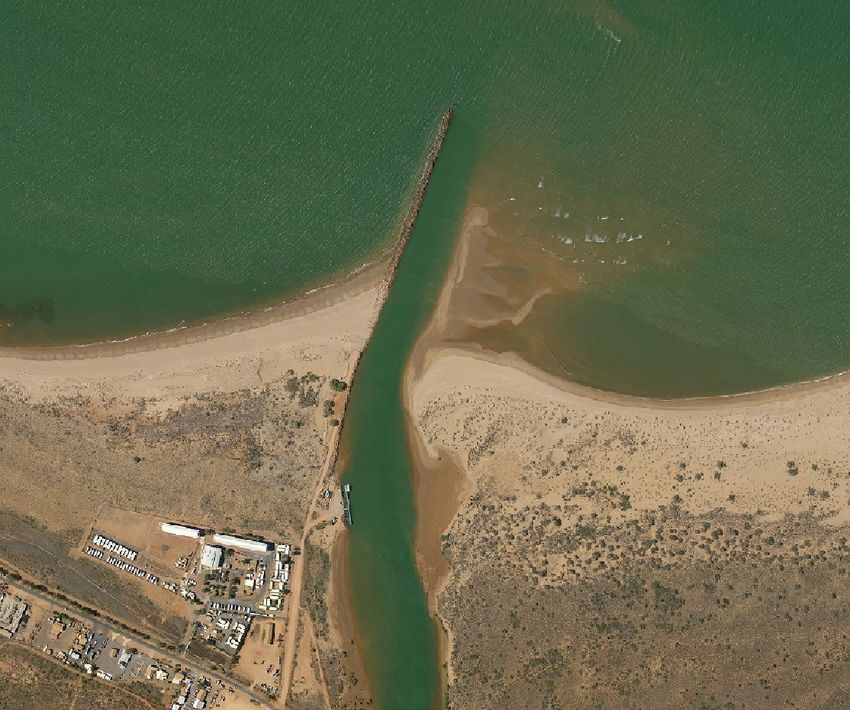
Glossary of terms

Aerial imagery:       Imagery taken by aircraft providing a plan view of land and sea below. Important
                      coastal features such as cuspate forelands, spits, river mouths, and beaches can
                      be viewed with aerial imagery.
Aerotriangulation:    A specialised workflow applied to aerial imagery to make that imagery accurately
                      placed for spatial analysis. This process uses various reference points to stich
                      aerial imagery together, and allows vegetation line capture to take place using
                      stereoplotting.
Coastline             On a sandy coast, the coastline may be identified on aerial photographs or by
                      survey as the seaward extent of ephemeral vegetation on an accreting/stable
                      coast, or the toe of the erosion scarp on an eroding coast. On a non-sandy
                      coast or a coast without a clear vegetation line, the coastline is identifiable by
                      other features such as rocky cliffs and engineered structures.
Coastline movement:   The movement of the coast between a discrete time interval in plan-view; this
                      may be approximated from aerial photography by observing the difference over
                      time when mapping the vegetation line or other boundaries (e.g. a cliff face
                      boundary). Coastlines may retreat or advance over time due to the influence of
                      natural coastal processes, anthropogenic activities, or a combination of the two.
Control bridging:     This process ascertains the spatial location of features both visible and
                      measurable on aerial imagery. The process involves passing horizontal and
                      vertical information from one aerial image to the next.
Hotspot:              A section of coastal land where erosion is highly likely to impact public and
                      private physical assets, requiring management and adaptation action within the
                      coming 25 years.
Stereomodel:          A set of overlapped aerial imagery viewable in 3D.
Stereoplotting:       The use of equipment and/or software to build a 3D image of aerial photography.
                      This process allows the vegetation line to be more accurately determined
                      from aerial imagery compared to simple tracing over an estimated 2D image
                      boundary.
Vegetation line:      This line represents an interpreted interface between the back beach/foredune
                      and the beginning of coastal heath/other vegetation along the coast. Where
                      available, the vegetation line serves as an approximated position of the coastline.
                      This vegetation line may change over time, whereby a retreating coast causes
                      vegetation to be removed and the line moves landward, or an advancing coast
                      allows vegetation to establish on new land and the line moves seaward.

                                                                                                            5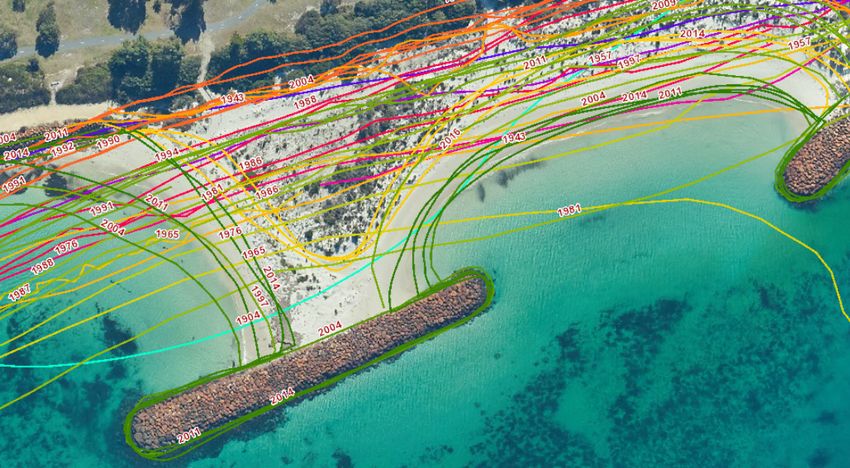
1. Introduction
    1.1     Background
    Historical coastline movement information is important for coastal adaptation planning as it:
    •   Reveals the range of natural dynamic movements in the coastline. Better understanding of this helps avoid
        ad hoc management actions immediately after severe storm erosion events, which often leads to worse
        outcomes later.
    •   Allows identification of long-term trends of erosion or accretion for SPP2.6 allowance calculations. A
        comprehensive record improves confidence in this calculation.
    •   Provides unbiased information in comprehensive records with a credible capture technique. This helps to
        avoid misinterpretation of historical erosion rates caused by skill limitation, bias from use of certain historical
        coastlines, or limited datasets.
    •   Directs the development of future adaptation solutions. In particular, the older 1940s and 1950s vegetation
        lines are rare, valuable datasets critical to understanding historic coastal change and setting context for
        coastal management.
    Coastal erosion hotspots are locations where erosion is expected to impact public and private physical assets
    that will likely require future management action. In 2016 CMAG identified a need to evaluate the scale and
    extent of coastal erosion in WA. An erosion hotspot study was completed in July 2016, with a number of
    coastal locations identified as erosion hostspots; ranging from wave-dominated coasts in the south, up to
    tide-dominated, cyclone-prone coasts in the north (Seashore Engineering, 2016). These locations, and coastal
    communities in general, require comprehensive coastline movement information to effectively plan and manage
    future erosion hazards. This report documents work conducted by DoT to improve coastline movement
    information around the State, applying funding in 2016-17 and 2017-18.
    A large amount of aerial imagery exists starting from the 1940s to present covering coastal sections of WA.
    This type of imagery is essential to create a baseline for coastline movement analyses at each coastal erosion
    hotspot. Much of the imagery has been scanned from film to digital format, although there are still some images
    that only exist on film. Older imagery on film must be digitised before modern spatial analyses can be applied.
    Once older film-based imagery has been digitised, this imagery must be aerotriangulated so that capture can
    take place of the important vegetation line datasets, plus any other important coastal features such as cliffs and
    engineered structures. In addition to older film-based imagery, there also exists other more recent imagery that
    has been digitised but still requires aerotriangulation processing before important datasets can be captured.

    1.2 Coastline capture for coastal management
    Coastline movement information is important for coastal management (see Glossary), providing proxy
    information about how a given section of coastline evolves over time (Damara, 2016). Coastline movement
    information is derived in this project from the position of a captured vegetation line for a given snapshot in
    time, which is progressively mapped over decades. Where a vegetation line could not be captured from aerial
    imagery, the coastline was defined by other significant features such as rocky cliffs and engineered structures
    (see Section 2.5).
    A vegetation line represents the boundary between back beach and dune toe where vegetation first appears.
    This project applies this line as an approximation of the coastline position. Figure 1 illustrates where the
    vegetation line is applied to for accreting, eroding, or stable beaches. If a beach is advancing (accreting),
    dunes grow and expand seaward, allowing new coastal heath to sprout seaward of established vegetation
    thus pushing the vegetation line seaward. If a beach is retreating (eroding), the toe of the fore dune is undercut,
    steepening the beach and removing vegetation to shift the vegetation line landwards.

6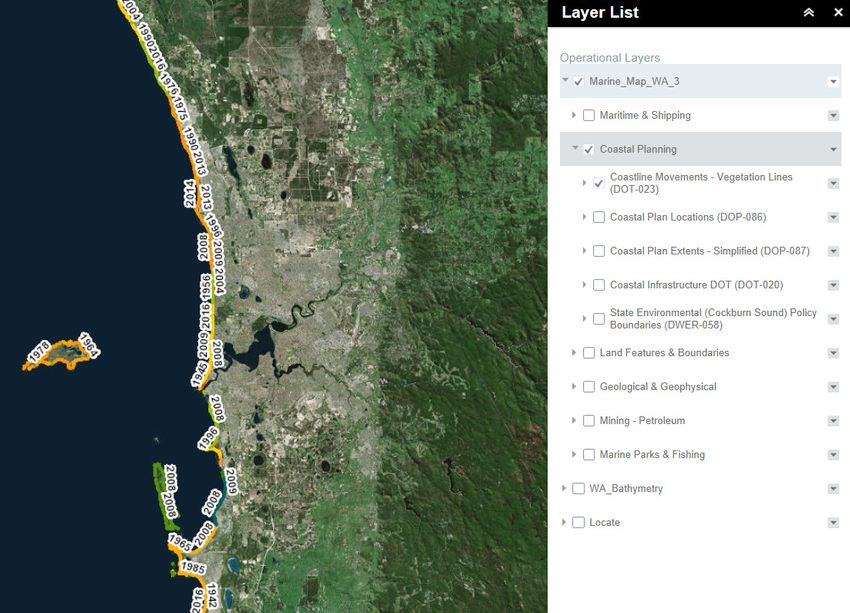
These changes in the vegetation line are known as coastline movements and can be observed in aerial
photography. Over time, changes in the vegetation line position can determine long-term trends and
approximate long-term evolution of the coastline (Damara, 2016). Continual recession of the vegetation line
represents a coast that is eroding long-term. Continual accretion of the vegetation line represents a coast that
is widening over time. A static vegetation line represents a stable coast with minimal net sand movement or
supply, while one that fluctuates back and forth over time represents a dynamic coastline whereby sand supply
and storage may oscillate.
The importance of coastline movement information can be observed by examining inclusion of historical coastal
change in coastal planning policy, such as in Schedule One from SPP 2.6 (WAPC, 2013). Coastline movement
information in the context of SPP 2.6 is discussed further in Section 4.

Figure 1: Examples of the captured vegetation line position for accreting, eroding, or stable beaches; adapted from (DoT, 2009)

                                                                                                                                  7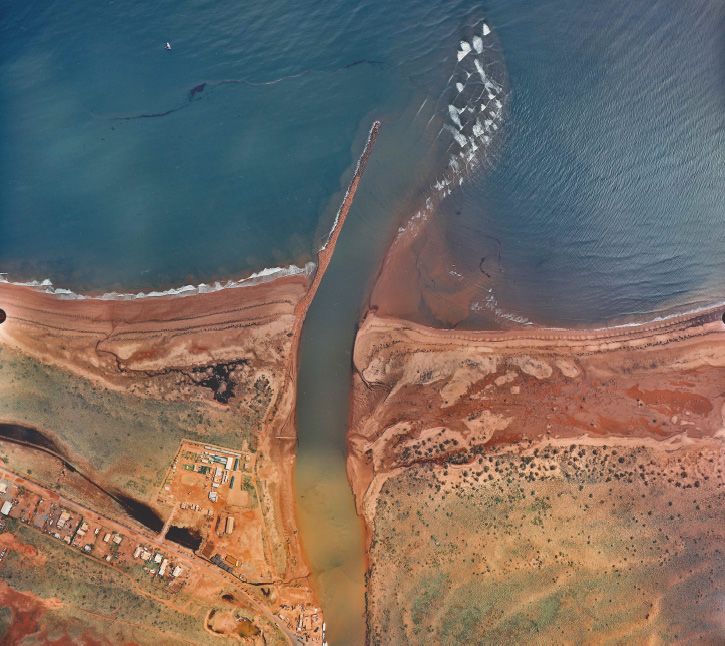
1.3 Purpose
    The purpose of this project was to improve coastal planning and management outcomes, in accordance with
    State policy and guidelines, by creating robust and comprehensive coastline movement information for WA.

    1.4 Aims and objectives
    The project aim was to provide coastline movement information for important coastal locations around the State
    by sourcing and analysing all available aerial imagery. Hotspots and areas of high urban development were the
    focus for this project, alongside other potentially important areas to manage in the future. Extensive coastline
    movement information is now available for more than 90% of WA’s coastal settlements.
    To achieve the project aim, four key steps were taken:
    1. Source historical coastal aerial imagery
    2. Digitise older aerial imagery where applicable
    3. Aerotriangulate aerial imagery where applicable
    4. Capture the vegetation line and other coastal features from aerotriangulated aerial imagery
    5. Make all datasets created by this project publicly available and free on-line.

    Point Peron, Rockingham

8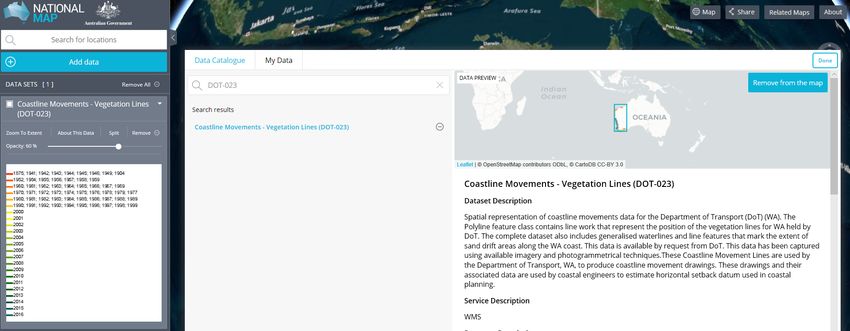
2. Methods
2.1 Software and hardware
The following key software was required to complete project objectives. These tools allow creation of a
stereomodel (see Glossary):
• Trimble INPHO Applications Master Match AT (License on loan from Landgate)
• ESRI ArcMap
• ERDAS Stereo Analyst for ArcGIS
• ERDAS Imagine
The following key hardware was required for this project (Figure 2):
• 3D capable monitor – for viewing aerial imagery in 3D
• 3D viewing glasses – for viewing aerial imagery in 3D
• ‘Topo’ mouse – for ergonomic plotting/manipulation of linework on aerial imagery
• High-end video card – for high performance requirements of the described software

Figure 2: Hardware required for the project (left to right top to bottom: 3D monitor, glasses, mouse, and video card; individual
copyright laws apply to these products)

                                                                                                                                   9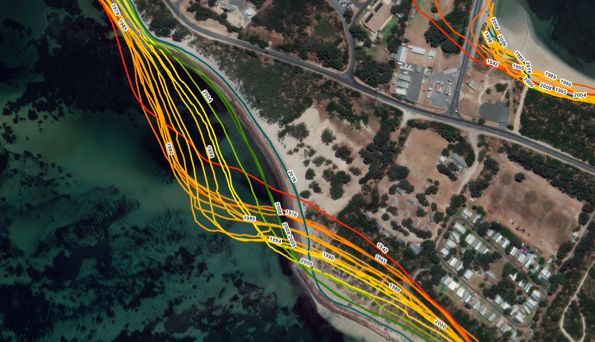
2.2 Sourcing of aerial imagery
     To build a comprehensive record of coastline movement information around WA, aerial imagery was sourced
     to provide satisfactory precision of coastline change since 1940. For the period of the 1940s to the 1980s
     inclusive, availability of scarce aerial photos dictated imagery selection. For each location at least one coastline
     per decade was targeted. From the 1990s onwards two sets of imagery were sourced per location, where
     available (e.g. imagery from 1990 and 1995 were sourced from Broome for the 1990s). The higher frequency in
     imagery sourced from the 1990s onwards allows more recent trends in coastline movements to be assessed in
     greater detail.
     Three sources were used to compile required imagery for this project. Imagery sourced externally was
     requested with accompanying aerotriangulation data for that imagery when possible:
     • DoT archives
     • Landgate through a special licence agreement
     • Photomapping (commercial entity based in New South Wales)
     Figure 3 displays the dynamic record of aerial imagery available with four examples at Beadon Creek,
     Onslow shown between the 1940s – 2010s. This basic imagery was sourced from the DoT archive, though
     aerotriangulation was needed for older photography which required additional film to be sourced from
     Photomapping.

     Figure 3: Example of aerial imagery available from the DoT archive for Beadon Creek, Onslow: top left from May 1949, top right
     from September 1971, bottom left from March 1999 (After TC Vance erosion), and bottom right from February 2015
     Some imagery required could not be sourced for this project. These images were either missing from existing
     databases, or never existed in the first place (i.e. no aerial imagery runs took place at various locations for some
     decades). A full list of imagery that could not be sourced is provided in Table A1 of Appendix A.

10
2.3 Digitisation of older imagery
Imagery stored on film was digitised by Photomapping for provision to DoT. This film is stored in a refrigerated
vault at Photomapping facilities to ensure preservation, requiring individual film removal from storage for
scanning to complete digitisation.
File sizes for data to be delivered were excessive, prohibiting digital transfer from file hosting sites. Instead, files
were downloaded onto external hard drives and sent by freight from NSW to the DoT Fremantle office. Once
imagery required had been sourced, aerotriangulation could take place.
2.4 Aerotriangulation of imagery
Aerotriangulation is a specialised workflow applied to aerial imagery to make that imagery accurately placed for
spatial analysis. This process uses various reference points to position and stitch aerial imagery together, and
allows the vegetation line to be more accurately determined from aerial imagery compared to simple tracing
over an estimated 2D image boundary. Note that some sourced imagery already had aerotriangulation data
available for this project, so this task only applied to imagery where these data were missing/did not exist.
An overview of aerotriangulation processes is provided in Appendix B. The Appendix B summary discusses that
this critical phase in photogrammetric mapping involves rectifying aerial imagery so that it is correctly positioned
on the surface of the earth. To aid this, computer processing has played a major role in driving mapping
scientists to develop rigorous and efficient mathematical protocols for improved stereomodel control. This was
achieved by use of a minimum number of strategically positioned common ground survey points.
The analytical software used in this project, as listed in Section 2.1, has built-in quality control. This has
improved the process of positioning imagery relative to the earth’s surface and the quality of photogrammetric
mapping.
Figure 4: Aerotriangulation job in progress showing required hardware (monitor and topo mouse)
11Aerotriangulation is usually accomplished via the below general sequence:
1. Collection of horizontal and vertical coordinate data for aerial imagery
2. Conduct control bridging (see Glossary)
3. Ensure geometric stability by using a minimum of four points in the imagery corners with established
horizontal and vertical locations in a full stereomodel
The specific process to conduct aerotriangulation in this project varied depending on the type of image,
whether previous aerotriangulation had been completed for that image, and the age of the image. The main
inputs for creating an aerotriangulation project in Trimble INPHO Applications Master Match AT are Global
Positioning System (GPS) photo centre points and ground control. Once these are generated for imagery
sourced in this project, aerotriangulation usually involved the specific tasks listed below:
1. Photo centre coordinates were created by either manual methods or from an existing Landgate GPS file
2. Calibration was conducted for the camera used to capture the image
3. Once the project was created in Trimble INPHO the GPS points were imported, the imagery directory was
linked to these points, and ground control was entered
4. An interior orientation was performed on all imagery
5. Manual points were used to link each stereomodel to the neighbouring one
6. Three control points at a minimum were created and then automatic point measurements were calculated
7. Post-processing was carried out repeatedly by re-reading points and adding control until the required results
(as per the previous list) were established for the project
Once aerotriangulation was completed, capture of coastline information could begin.
2.5 Coastline capture
Two photogrammetrists
conducted vegetation line
capture in-house for this
project following methods and
specifications defined here
in addition to standard DoT
workflows from (DoT, 2009).
Vegetation line creation to
capture the coastline was
conducted on all available
imagery using the software
and hardware listed in
Section 2.1. These tools were
required to ensure accurate
stereoplotting (see Glossary).
By using these tools, a 3D
image can be manipulated by a
photogrammetrist to more readily
discern the boundary between
fore dune and back beach
as described in Section 1.2.
Figure 5 illustrates the capture
of vegetation lines from aerial
Figure 5: Vegetation line capture job in progress using specialised hardware (monitor,
imagery. glasses, and topo mouse)
12Many locations around WA do not comprise sandy open coasts as described in Section 1.2. For example,
coastal areas may contain rocky cliffs, minimal vegetation on the coastline, coastal protection structures, or
rocky underlying substrate that can become intermittently or permanently exposed over time. To account for
this, capture of additional lines other than the vegetation line took place. These datasets were also captured
alongside the vegetation line where applicable:
• Hard rock/cliff face
• Sand-drift
• Reef and seagrass meadows
• AHD 0m
• Man-made/hard engineered coastlines
The method used to create these extra lines was similar to the process shown in Figure 5. Using these lines
in conjunction with the coastal vegetation line allows detailed characteristics of a given area of coast to be
identified (Figure 6). Assessment of these datasets together can build a stronger understanding of coastline
behavior rather than from interrogation of the vegetation line alone.
In some cases, the various lines captured will blend together, such as where coastal protection structures end
and a vegetated fore dune begins (e.g. the dark green lines in Figure 6). Resultantly, interpretation of coastline
movements for a section of coastline is best informed by observing all lines described above concurrently (and
sometimes by combining line types), to approximate a generalised coastline position for a given year.
Figure 6: Illustration from Albany, Emu Point of different coastal features captured alongside the vegetation line; for example, the
dark green lines capture hard rock structures that then blend into the vegetation line
133. Results
3.1 Coverage of created datasets
While capturing coastal erosion hotspot coastlines was the project goal, the final coastline datasets captured
in Section 2.5 were comprehensive enough to cover almost all coastal settlements around WA (Figure 7). Note
the dark green colouring is also accompanied by light and fluorescent green areas for locations with lower data
availability as per the inset in Figure 7. Locations with lower data availability are also outlined in Table A1 of
Appendix A. The WA coastal communities with zero coastline capture in this project were Karratha, Djarindjin,
and Wyndham.
Figure 7: Spatial coverage of coastline datasets; the inset allows easier observation of all areas covered in the State.
Note Cocos (K) Islands and Christmas Island were also covered in this project though are not viewable here
14A full list of coastlines captured for WA is in Table A2 of Appendix A. This list also provides the distance of
coastline capture undertaken for each location. From Table A2, 3,056km of WA’s coastline has been captured
specifically for these locations between the 1940s to present.
In addition to the coastlines captured in Table A2, extra capture took place for unpopulated coastlines between
Kalbarri to Israelite Bay from large-scale flight runs. Coastlines from these large-scale runs were captured for the
whole 2015-16 run and part of the 2008-09 run (i.e. from Kalbarri to Augusta). Extra distance captured in these
runs had a combined total greater than 2,553km. Thus, the total coastline distance captured in this project was
over 5,589km, clearly providing for a substantial amount of coastline movement information for planners and
managers.
3.2 Web hosting of created datasets
All datasets in this project were created in DoT offices and stored locally until internet hosting was available for
wider accessibility to the public. Three sites for data hosting were used in this project1:
1. Data WA – https://data.wa.gov.au/home
2. WA Marine Map – https://maps.slip.wa.gov.au/Marine/app/
3. National Map – https://nationalmap.gov.au/
It is noted here that datasets are simplified before upload to web hosting sites to reduce storage requirements
and improve accessibility. The main simplification includes combination of various line types described in
Section 2.5, such as the hard cliff face line and vegetation line, to provide a more generalised line of coastline
position for a given year. This was conducted to provide the closest representation achievable of the coast from
a single line. Original datasets with all types of coastline features captured are available on request from DoT.
Data hosting in this project began with upload of vegetation line data to Data WA. This host is managed by the
Western Australian Land Information Authority (WALIA). Coastline data were uploaded to this host and can be
found in dataset DOT-023 as shown in Figure 8 (WALIA, 2018).
Figure 8: Publicly available location of coastline data created in this project (WALIA, 2018)
1
All links were accurate at the time of the last document update.
15Subsequent to hosting by Data WA, development of both a State and national coastal information browser
provides greater access to data created in this project. The State level browser that hosts coastline movement
information is called the WA Marine Map (WAMM). This browser is managed by Landgate (SLIP, 2018). WAMM
is a publicly accessible spatial tool providing users the ability to view operational layers from the following
categories:
• Maritime and shipping
• Coastal planning
• Land features and boundaries
• Mining and petroleum
• Marine parks and fishing
• Bathymetry
The datasets created for this project were made available for both viewing and download in WAMM. Coastline
movement information was located under the coastal planning category (Figure 9).
Figure 9: Coastline datasets viewable in WAMM (SLIP, 2018)
16The national level browser that hosts coastline movement datasets is called the National Map. This browser is
managed by the Department of Prime Minister and Cabinet (DoPMC, 2018). The National Map is like WAMM
in that coastal information layers may be viewed and downloaded by the public. In addition to this function, the
National Map includes non-coastal information as well (such as inland terrestrial vegetation information) and
allows users to upload their own spatial information layers. Note that given the wealth of information hosted by
this browser, some users may find the National Map takes more time to navigate than the other hosts when
searching for a specific set of information.
Coastline movement information created for this project is available for viewing and download in the National
Map. The National Map is linked to Data WA; thus, searching for DOT-023 in the National Map should reveal
coastline movement information for viewing (Figure 10).
It is noted here that the file hosting services described above were representative at the time of writing. It is
acknowledged that the transient nature of online data management may result in these hosts changing or
removing coastline movement data from their service. DoT directs that coastline movement data created in this
project will still be available by request directly to DoT.
Figure 10: Coastline datasets viewable in the National Map (DoPMC, 2018)
3.3 Dataset accuracy and ameliorations
There was a wide range of accuracies expected for aerotriangulation of imagery in this project, depending on
the age of aerial imagery sourced. Factors affecting horizontal accuracy are discussed in this section, and in
Appendix B. Where possible, methods to address accuracy issues are described. Table 1 displays generalised
horizontal accuracies expected for ages of imagery sourced due to the discussed factors.
Inclusion of GPS in photo centres
The primary factor in determining accuracy was implementation of differential GPS in survey aircraft from 1992
onwards. This led to an improvement in overall accuracy of aerotriangulation projects whereby GPS coordinates
of the photo centre can be used in block calculations. For this project, photo centres of images in projects
pre-1992 were manually measured from imagery in ArcMap; these were subsequently used to get an initial
block of images imported into Trimble INPHO. This method allowed determination of basic orientation of the
photography block. In addition, further tie points were generated both manually and automatically, and these tie
points were used to connect all photos.
17Imagery control
Survey control points are the most effective means to provide horizontal and vertical control to sourced aerial
imagery. As time progresses, use of these control points becomes more difficult due to changes in man-made
and natural features (refer back to Figure 3 for a visualisation of this). To overcome this, control was derived by
highlighting the same points visible over different years in photography.
Control transfer
Some aerial imagery had control points shifted, removed, created, or replaced at different locations in the image
between different years. Error created by control transfer was compounded the further back these changes
occurred in time.
Condition of photography
Older film usually generates poorer quality scans than newer film due to inherent problems with storing acetone
based film products. Acetate film base deterioration, also known as, ‘The Vinegar Syndrome’, can affect the
quality of the image which effectively reduces resolution and/or the accuracy of identifiable features.
Table 1: Expected horizontal accuracy for imagery ages sourced (adapted from Appendix B)
Imagery Age Horizontal Accuracy
2005 - latest ± 3 to 4 pixels
1995 - 2004 ± 6 pixels
1980 - 1994 ± 8 pixels
1960 - 1979 ± 10 pixels
1940 - 1959 ± 15 pixels
In Table 1, pixels were used rather than metres to demonstrate expected accuracy of imagery due to different
resolutions of imagery flown. Some flights were taken at higher/lower altitudes compared to flights elsewhere,
occasionally creating variable spatial coverage per image at different locations from similar years. In addition,
older film produced lower resolution images2.
To exemplify the above, a flight from the 1940s flown at a scale of 1:25000 and scanned at 15μm to create
digital imagery would produce a pixel resolution equating to a 0.375m Ground Sample Distance (GSD). The
resultant accuracy of imagery scanned from this flight would be ±5.6m. The same flight captured in 2004 at
a scale of 1:25000 and scanned at a higher resolution 20μm to create digital imagery would produce a pixel
resolution equating to a 0.5m GSD. The resultant accuracy of imagery scanned from this flight would thus
improve to ±3.0m.
Most projects fell within the accuracies provided in Table 1, however a small number were worse than
expected. In these cases, the required vector information was captured from imagery and then moved into
Arcmap to register with newer projects which had a higher expected accuracy.
It is important to note here that the lower horizontal accuracy of older aerial imagery reduces achievable
precision when capturing the coastline. The result is that coastlines captured from older imagery may not define
the same level of detailed features compared to more recent imagery.
2
All non-digital (i.e. film-based) imagery supplied by Landgate was scanned at 20μm. All historical imagery supplied via
Photomapping Services from the Geoscience Australia archives was scanned at 15μm.
184. Discussion
4.1 Applications of improved coastline data in WA
The primary purpose for creating a systematic coastline dataset across WA is to inform local coastal managers,
State planners, Landgate, and DoT maritime facility planners of historical trends in coastline movement for
their coastal investigations, management needs, and planning needs. There are critical requirements in coastal
planning policy in WA and specific guidance is provided by SPP 2.6. Schedule One in this policy provides
guidance towards calculating allowances for coastal processes that cause erosion (WAPC, 2013).
For a sandy coast the allowance for erosion is calculated as the sum of:
• S1 Erosion - allowance for the current risk of storm erosion
• S2 Erosion - allowance for historical coastline movement trends
• S3 Erosion - allowance for erosion caused by future sea level rise
• Uncertainty allowance - 0.2m/yr additional allowance for uncertainty
Coastline movement information provides critical information for the S2 calculation. Figure 11 illustrates how S1,
S2, S3, and the Uncertainty allowance collectively define a total erosion allowance calculated using Schedule
One of SPP 2.6. In the Figure 11 example of a soft sandy eroding coastline, the beach has experienced long-
term erosion, so S2 provides an allowance for this erosion trend continuing.
Figure 11: Schedule One erosion allowance example on a cross-section of sandy eroding coastline; note allowances are illustrative
and necessarily not to scale
To calculate S2, SPP 2.6 directs that an annual rate of change must be derived from historical trends in
erosion or accretion. If long-term coastline movement trends reveal the coast to exhibit an erosion trend, this
annual rate is multiplied by 100 to provide a speculative 100-year coastline movement allowance for S2. The
conventional method in WA to derive an annual rate is by observing changes in the coastline from available
coastline movement information.
19The approach to allowance planning for new developments at Greenfield sites directed in SPP 2.6 has also
been used for wider applications, such as assessing hazards in already developed areas (Brownfield sites).
Therefore, this approach has important applications to the coastlines of coastal management hotspots around
the State. Applying this same method for S2 allowance planning to Brownfield sites occurs in Coastal Hazard
Risk Management and Adaptation Planning (CHMRAP) (DoP, 2014). Many such CHRMAP examples exist,
including Harvey (Damara, 2016) and Albany (EvoCoast, 2017).
Before this project was undertaken, coastline movement information around the State was created ad
hoc and with imprecise data coverage; this often causes reduced confidence in the calculation for S2. For
example, a location with a vegetation line available from only one to two decades provides limited information
about historical trends over 100 years.
By targeting as many decades as possible in this project, much higher confidence can be gained about how
a given piece of coastline is evolving. Resultantly, applying Schedule One of SPP 2.6 now provides improved
outcomes for coastal planners and developers. As an example only, Figure 12 provides a closer look at
possible planning implications around Drummond Cove (north of Geraldton), showcasing how understanding
can been improved for coastline movement trends using the more comprehensive coastline datasets
developed in this project.
N
0m 15m 30m
Figure 12: Drummond cove vegetation line coverage before (left) and after (right) this project; white transect lines are also shown;
note the dates on the left image’s lines are: left green = 2007, middle green = 2004, pink = 1995, and right green = 2013
20Using Figure 12, historical coastline trends can be derived from both the before and after images for coastline
movements. Table 2 gives a breakdown of coastline movements measured between each year from the white
transect lines in Figure 12. Note that 1940s and 1950s vegetation line capture has not been completed for
Drummond Cove at the time of writing.
Table 2: Drummond cove coastline movement analysis before the project commenced (left image of Figure 12) and with new
vegetation lines created (right image of Figure 12); please note figures are rounded to two decimals
Before Updated
Period (yr) Coastline movement (m) Period (yr) Coastline movement (m)
1965 - 1975 +2.95
1975 - 1985 +3.15
1985 - 1995 -1.84
1995 - 2004 +6.29 1995 - 2004 +6.29
2004 - 2007 -0.04 2004 - 2007 -0.04
2007 - 2008 0
2007 - 2013 -6.69
2008 - 2013 -6.69
2013 - 2016 -11.10
Net change (18yrs) -0.44m Net change (51yrs) -7.28m
Trend over last 20yrs -0.49m Trend over last 20yrs -11.40m
Net yearly average -0.02m/yr Net yearly average -0.14m/yr
100yr allowance -2.44m 100yr allowance -14.27m
The increased availability of coastline movement information in Figure 12 and Table 2 creates a different and
more informative outcome for understanding coastline movements compared to what could be achieved
previously. Before the project commenced, only four unique vegetation lines were available over an 18yr period.
At the time of writing, nine unique vegetation lines spanning 51yrs has been analysed.
For the limited record’s analysis (left image of Figure 12), Table 2 results indicate Drummond Cove might be a
generally stable coastline, with a near-zero average annual rate of change evident at -0.02m/yr (rounded). By
forecasting the trend over 20yrs, mild erosion would be expected of -0.49m as seen in Table 2.
The more complete record in the right image of Figure 12 shows a more detailed story: the annual rate of
change from Table 2 is greater at -0.14m/yr. This outcome is significant considering the coast showed net
accretion in the first 30yrs of the 51yr record. After that, erosion of -11.40m is observed when looking at the
latest 20yr trend; this erosion is ~23 times greater than the 20yr trend from the limited record. This clearly
demonstrates the differences an updated coastline movement record can entail.
A 100yr planning allowance using SPP 2.6 for S2 is calculated as 100 times the annual rate of change from
the historic record. Using the net yearly average erosion rate, an S2 allowance would calculate to -2.44m
(after rounding) using the left image of Figure 12. However, this same S2 calculation increases to -14.3m (after
rounding) when using the updated right image of Figure 12 which is almost six times greater than the limited
record’s S2 allowance. Planning implications from these markedly different results are significant. Resultantly,
the Drummond Cove example clearly demonstrates the critical importance comprehensive coastline movement
information entails.
214.2 Recommended direction for coastline data in WA
As demonstrated in Section 4.1, coastline datasets are an important tool for understanding how the WA
coastline changes over time, and how that coastline may continue to evolve in the future. A comprehensive
record of coastline movement information is clearly critical to ensure the most accurate, unbiased analysis
possible for planning and management purposes. Mindful planning is important to ensure continuous and
regular capture of these datasets into the future.
An ongoing plan for collection of aerial imagery is necessary to assist local coastal planners and managers.
DoT’s annual aerial imagery budget can only target small to medium scale flight runs, usually for maritime facility
planning and management purposes. Significant numbers of erosion hotspot locations may not be captured
unless a maritime facility already exists nearby. The DoT aerial imagery collection process has been illustrated
by a flow diagram in Figure 13; this process can also serve as a guide for other stakeholders interested in
ongoing aerial imagery collection.
Data to Draft run DoT prioritise
Annual review Requested runs
review schedule runs based on
of required Landgate
urgency and
aerial imagery
funding
flight runs
available
Requested runs Requested
(first step) runs
Feedback on (second step)
runs and funds
Low priority runs Landgate
(≥5yr frequency) review all Initiate flight
stakeholder runs to create
requests and requested
decide if more imagery
funds needed
High priority runs
(1yr – 5yr frequency)
New aerial
imagery
Collate and
Catalogued catalogue Uncatalogued
imagery imagery
DoT aerial imagery received DoT
run archive imagery then
update DoT
archive
Figure 13: Flow diagram of aerial imagery collection plan to ensure a consistent coastline movement record is captured moving
forward
Figure 13 demonstrates that management of aerial imagery collection is an ongoing and dedicated task if a
consistent and comprehensive coastline movement record is to be captured into the future. A sample of the
program can be seen in Table A3 of Appendix A. The first recommendation identified by this project is for DoT
to continue to conduct this aerial imagery collection program across the State.
A significant limiting factor evident from Figure 13 is the need for continued funds to source aerial imagery.
Some runs undertaken historically, such as the large scale run from Kalbarri to Israelite Bay ideally conducted
every five years, represent a critical funding requirement. This large-scale run provides the most complete,
consistent, and comprehensive aerial imagery record in the entire capture plan. However, its high financial cost
and resourcing requirement means ongoing commitment is needed to ensure its continuity moving forward.
22Expensive runs such as the Kalbarri to Israelite Bay run are considered highly vulnerable to budget limitations
and may be missed altogether during low budget years if adequate financial forecasting and planning do not
take place. DoT currently adopts an annual plan for sourcing imagery. However, sufficient recurrent funding
cannot be guaranteed. Resultantly, another recommendation from this project is for CMAG to plan and budget
for infrequent (~five yearly) large-scale aerial imagery projects.
At the time of writing there were three services that host DoT coastline data for free public access (Section
3.2). It is acknowledged that the transient nature of online data management may result in these hosts
changing access or removing coastline data from their service entirely. DoT notes that coastline data created
in this project will still be available via direct request to DoT if file hosting services are unavailable. However,
DoT directs that maintaining public access to these critical datasets through hosting services is the preferred
option. Regular review and communication with the entities that manage, or have potential to manage, data
hosting services is required as an ongoing task3. Therefore, the final recommendation arising from this project
is ongoing data management by DoT to ensure free public access to coastline data through online hosting
services.
In summary of this section, a list is provided below defining the key recommendations identified by this project.
1. DoT to conduct annual management and sourcing of aerial photography runs across the state
2. CMAG to source funding towards large scale aerial photography runs in intervals of no less than five
years from Kalbarri to Israelite Bay
3. DoT to manage ongoing and free public access to coastline movement information through public
data hosting services
3
It is intended that this document will be kept live to allow for updates regarding any future changes to data hosting moving forward.
23References
Damara. (2016). Shire of Harvey Coastal Hazard Risk Management and Adaptation Plan. Shire of Harvey.
DoP. (2014). Coastal Hazard Risk Management and Adaptation Planning Guidelines. WAPC.
DoPMC. (2018). National Map. Retrieved from http://nationalmap.gov.au/
DoT. (2009). Coastal Demarcation Lines for Administrative and Engineering Purposes. Department of Transport.
EvoCoast. (2017). Emu Point to Middleton Beach Coastal Adaptation and Protection Strategy, Albany. City of Albany.
Seashore Engineering. (2016). Coastal Erosion Hotspots, Preliminary Analysis Report. Department of Transport and
Department of Planning, Lands and Heritage.
SLIP. (2018). WA Marine Map. Retrieved from https://maps.slip.wa.gov.au/Marine/app/
WALIA. (2018). Data WA. Retrieved from http://data.wa.gov.au/
WAPC. (2013). State Plannng Policty No. 2.6 - State Coastal Planning Policy. Planning and Develpment Act 2005:
Western Australian Planning Commission.
Jeeaila River, Peppermint Grove Beach
24Appendix A - Coastline Dataset
Information
Table A1: Aerial imagery from older decades that could not be sourced for this project
Decade Location
Latest
Quobba Station
(>2010)
2005-2009 Coral Bay
Broome Eco Beach
1995-1999 Point Samson
Onslow
1990-1994 Broome Eco Beach
Ardyloon
Derby
1980-1989 Derby
1970-1979 Derby
1960-1969 Broome Eco Beach
Ardyaloon
Derby
1950-1959 Capel
Coogee
Point Samson
Dongara
Augusta
Coral Bay
Broome Eco Beach
Cheynes Beach
Little Grove
Quobba Station
Margaret River
Ardyaloon
Derby
1940-1949 Onslow
Geordie Bay
Dongara
Hopetoun
Esperance
Mullaloo
Bremer
25Table A2: Location and year of coasts captured from aerial imagery for this project, alongside the distance of coastline captured
for that location in the year available
Distance
Location captured Year
(Km)
Hillarys to Cottesloe 2015 21.20
Ardyaloon 2013 6.55
Ardyaloon 2007 6.55
Ardyaloon 2003 6.55
Ardyaloon 1998 6.55
Ardyaloon 1986 6.55
Ardyaloon 1975 6.55
Ardyaloon 1949 6.55
Augusta 2005 13.40
Augusta 2003 13.40
Augusta 1975 13.40
Augusta 1943 13.40
Binningup 2004 4.79
Binningup 1995 4.79
Binningup 1975 4.79
Binningup 1965 4.79
Binningup 1946 4.79
Bremer 2008 17.37
Bremer 1985 17.37
Bremer 1975 17.37
Bremer 1965 17.37
Bremer 1957 17.37
Broome 2015 28.10
Broome 2007 28.10
Broome 2000 28.10
Broome 1995 28.10
Broome 1990 28.10
Broome 1988 28.10
Broome 1970 28.10
Broome 1960 28.10
Broome 1959 28.10
Broome 1947 28.14
Broome Eco Beach 2013 1.94
Broome Eco Beach 2004 1.94
Broome Eco Beach 1998 1.94
Broome Eco Beach 1985 1.94
Broome Eco Beach 1978 1.94
Broome Eco Beach 1947 1.94
Cape Peron to Tims Thicket 2015 132.34
Capel 2015 4.11
Capel 2006 4.11
Capel 2003 4.11
Capel 1995 4.11
Capel 1990 4.11
26Capel 1985 4.11
Capel 1975 4.11
Capel 1965 4.11
Capel 1941 4.11
Carnarvon 2015 8.98
Carnarvon 2007 8.98
Carnarvon 2003 8.98
Carnarvon 1997 8.98
Carnarvon 1990 8.98
Carnarvon 1980 8.98
Carnarvon 1970 8.98
Carnarvon 1969 8.98
Carnarvon 1955 8.98
Cervantes 1975 5.39
Cheynes Beach 2015 1.48
Cheynes Beach 2005 1.48
Cheynes Beach 2003 1.48
Cheynes Beach 1995 1.48
Cheynes Beach 1990 1.48
Cheynes Beach 1985 1.48
Cheynes Beach 1975 1.48
Cheynes Beach 1965 1.48
Cheynes Beach 1946 1.48
Cockburn Sound 1990 33.53
Coogee 2015 2.20
Coogee 2003 2.20
Coogee 1995 2.20
Coogee 1965 2.20
Coral Bay 2015 7.88
Coral Bay 2002 7.88
Coral Bay 1992 7.88
Coral Bay 1968 7.88
Coral Bay 1949 7.88
Cottesloe to Coogee 1985 20.90
Dawesville 2015 5.90
Dawesville 1975 5.90
Denham 2015 2.40
Denham 2005 2.40
Denham 2001 2.40
Denham 1998 2.40
Denham 1990 2.40
Denham 1980 2.40
Denham 1978 2.40
Denham 1964 2.40
Denham 1957 2.40
Denham 1949 2.40
27Derby 2013 9.32
Derby 2006 9.32
Derby 2004 9.32
Derby 1995 9.32
Derby 1949 9.32
Dongara 2008 10.78
Dongara 2005 6.00
Dongara 2004 10.78
Dongara 2004 6.00
Dongara 1985 10.78
Drummond Cove to Separation Point 1985 25.15
Drummond Cove to Separation Point 1975 25.15
Drummond Cove to Separation Point 1965 25.15
Drummond Cove to Separation Point 1952 25.15
Drummond Cove to Separation Point 1942 25.15
Emu Point 2004 2.40
Emu Point 1965 2.40
Esperance 1990 17.96
Esperance 1975 17.96
Esperance 1956 17.96
Exmouth 2015 7.78
Exmouth 2007 7.78
Exmouth 2003 7.78
Exmouth 1990 7.78
Exmouth 1966 7.78
Exmouth 1942 7.78
Falcon 1975 7.78
Geordie Bay 2016 0.71
Geordie Bay 2006 0.71
Geordie Bay 2003 0.71
Geordie Bay 1995 0.71
Geordie Bay 1990 0.71
Geordie Bay 1985 0.71
Geordie Bay 1975 0.71
Geordie Bay 1965 0.71
Geordie Bay 1955 0.71
Gnarabup 2015 4.79
Gnarabup 2004 4.79
Gnarabup 1990 4.79
Gnarabup 1985 4.79
Grey 2015 9.58
Grey 2004 9.58
Grey 1995 9.58
Grey 1990 9.58
Grey 1985 9.58
Grey 1975 9.58
Grey 1965 9.58
Grey 1956 9.58
28Hillarys to Cottesloe 2003 21.20
Hillarys to Cottesloe 1995 21.20
Hillarys to Cottesloe 1990 21.20
Hillarys to Cottesloe 1975 21.20
Hillarys to Cottesloe 1965 21.20
Hillarys to Cottesloe 1959 21.20
Hillarys to Port Kennedy 1965 35.33
Hillarys to Woodman Point 1995 128.74
Hopetoun 2008 12.57
Hopetoun 1975 12.57
Hopetoun 1956 12.57
Horrocks 2015 13.77
Horrocks 1956 13.77
Little Grove 2015 1.36
Little Grove 2006 1.36
Little Grove 2003 1.36
Little Grove 1995 1.36
Little Grove 1990 1.36
Little Grove 1985 1.36
Little Grove 1975 1.36
Little Grove 1965 1.36
Little Grove 1943 1.36
Margaret River 2015 1.86
Margaret River 2006 1.86
Margaret River 2003 1.86
Margaret River 1995 1.86
Margaret River 1990 1.86
Margaret River 1985 1.86
Margaret River 1975 1.86
Margaret River 1965 1.86
Margaret River 1943 1.86
Monkey Mia 2012 1.20
Monkey Mia 2007 1.20
Monkey Mia 2002 1.20
Monkey Mia 1990 1.20
Monkey Mia 1984 1.20
Monkey Mia 1978 1.20
Monkey Mia 1964 1.20
Monkey Mia 1957 1.20
Monkey Mia 1944 1.20
Ocean Beach (Denmark) 2015 3.59
Ocean Beach (Denmark) 2008 3.59
Ocean Beach (Denmark) 2004 3.59
Ocean Beach (Denmark) 1995 3.59
Ocean Beach (Denmark) 1990 3.59
Ocean Beach (Denmark) 1985 3.59
Ocean Beach (Denmark) 1975 3.59
Ocean Beach (Denmark) 1965 3.59
Ocean Beach (Denmark) 1942 3.59
29Onslow 2015 9.95
Onslow 2005 9.95
Onslow 2003 9.95
Onslow 1993 9.95
Onslow 1986 9.95
Onslow 1961 9.95
Peaceful Bay 2015 7.19
Peaceful Bay 2008 7.19
Peaceful Bay 2004 7.19
Peaceful Bay 1995 7.19
Peaceful Bay 1990 7.19
Peaceful Bay 1985 7.19
Peaceful Bay 1975 7.19
Peaceful Bay 1965 7.19
Peaceful Bay 1943 7.19
Point Peron 1985 4.79
Point Samson 2014 5.00
Point Samson 2005 5.00
Point Samson 2004 5.00
Point Samson 1992 5.00
Point Samson 1987 5.00
Point Samson 1978 5.00
Point Samson 1964 5.00
Point Samson 1946 5.00
Port Hedland 2015 16.17
Port Hedland 2009 16.17
Port Hedland 2004 16.17
Port Hedland 1995 16.17
Port Hedland 1990 16.17
Port Hedland 1985 16.17
Port Hedland 1977 16.17
Port Hedland 1964 16.17
Port Hedland 1957 16.17
Port Hedland 1949 16.17
Quinns to Trigg Island 1975 31.74
Quobba Station 2007 5.59
Quobba Station 2003 5.59
Quobba Station 1999 5.59
Quobba Station 1990 5.59
Quobba Station 1983 5.59
Quobba Station 1977 5.59
Quobba Station 1963 5.59
Quobba Station 1949 5.59
30Rottnest (Thomsons Bay) 2016 3.59
Rottnest (Thomsons Bay) 2006 3.59
Rottnest (Thomsons Bay) 2004 3.59
Rottnest (Thomsons Bay) 1997 3.59
Rottnest (Thomsons Bay) 1990 3.59
Rottnest (Thomsons Bay) 1983 3.59
Rottnest (Thomsons Bay) 1978 3.59
Rottnest (Thomsons Bay) 1964 3.59
Rottnest (Thomsons Bay) 1955 3.59
San Remo 2015 3.80
Seabird 1995 7.19
Seabird 1956 7.19
South Bunbury 2015 6.10
The Cut to Casuarina 1941 6.59
Two Rocks to Cape Peron 2015 141.32
Two Rocks to Port Kennedy 1959 141.32
Two Rocks to Trigg 1942 48.50
Two Rocks to Trigg Island 1990 48.50
Two Rocks to Woodman Point 2004 141.32
Useless Loop 2011 3.24
Useless Loop 2007 3.24
Useless Loop 2002 3.24
Useless Loop 1997 3.24
Useless Loop 1990 3.24
Useless Loop 1989 3.24
Useless Loop 1972 3.24
Useless Loop 1969 3.24
Useless Loop 1957 3.24
Waikiki 1985 11.38
Wedge 2015 11.38
Wedge 2008 11.38
Wedge 2004 11.38
Wedge 1995 11.38
Wedge 1990 11.38
Wedge 1985 11.38
Wedge 1975 11.38
Wedge 1965 11.38
Wedge 1956 11.38
Wedge 1943 11.38
Windy Harbour 2008 11.00
Windy Harbour 2004 11.00
Windy Harbour 1990 11.00
Wonnerup to Dunsborough 1959 65.00
Total coastline distance captured 3035.82
31Table A3: Sample of aerial imagery collection program with scheduling, priorities, and capture record
Coastal Aerial Photography Schedule - Updated 15 March 2018 - TS
Photo areas should cover previous years extents, some areas may need to be extended depending on the purpose of the survey.
Legend
High priority
Medium priority
Low priority
Latest available in DoT archive
Only a large scale run available in DoT archive
Review of these cells required
Could not be sourced
Requested/bought but not yet on system *most 2016 runs do not appear to be in the system yet
Usual
Latest (on
Location/Facility Frequency Next Features to capture 2015 2016 2017 2018 2019 Notes
system)
(years)
Kalbarri to Israelite Bay
Large scale run 5 2015/16 2020/21 At the cost of slighlty lower resolution, this run Required for mapping coastline movements at least once every five years
covers the majority of key interest areas
Kimberley
Wyndham 5 2016 2021 Townsite and jetty
Derby 5 2016 2021 Jetty and peninsula
Ardyaloon 5 N/A 2017 Townsite and beaches
Broome 2 2016 2017 Entire point plus estuary w. townsite BBF project cancelled, potential for new works soon, continue annual capture to potentially track any cyclone damage; try to survey at low spring tide
Pilbara
Port Hedland 2 2015 2017 Finucane Island, spoil bank, town, and beaches Get yearly runs from at least 2017-2022 alongside spoil bank marina project (status of this project is uncertain now)
Point Samson 5 2017 2022 All coast east of Sams Creek Rd plus harbour
Dampier 5 2015 2020 Townsite and local coastline
Onslow 1 2017 2018 From Onslow Salt Jetty to ~2km east of Beadon 2016 run was Beadon Creek only. OMSB stage works in 2017 and 2018 so need annual photos for next few years, want to track cyclone damage as well if any occur
Creek
Gascoyne
Exmouth 3 2017 2018 Townsite, harbour, nearshore, and beaches Want 2017 and 2018 following works
Bundegi 5 2014 2019 Nearshore, ramp, and beaches
Tantabiddi 5 2014 2019 Nearshore, ramp, and beaches
Coral Bay 5 2017 2019 Townsite, boat ramp, nearshore, and beaches Annual coverage of Mauds Landing to 2020 to monitor sand buildup around the facility
Carnarvon 5 2017 2019 Townsite, Gascoyne mouth, and Fascine Ensure to capture Pelican Point sand bar, Boat Harbour, and Teggs Channel
Monkey Mia 5 2007 2017 Townsite, nearshore, and beaches Are there any existing serials for Monkey Mia in the Landgate archive that are newer than 2007 which we can buy instead to avoid making a new run?
Denham Maritime Facility 3 2017 2018 Harbour & entrance channel + beaches Want 2017 and 2018 following works
Mid West
Kalbarri 5 2017 2022 River mouth, townsite, and beaches
Port Gregory 5 2017 2022 Jetty, townsite, nearshore, and beaches
Horrocks 5 2016 2021 Townsite, nearshore, and beaches
Geraldton 1 2016 2017 Drummond Cove to Cape Burney
Port Denison 5 2016 2021 Boat harbour, townsite, and beaches
Leeman 5 2015 2020 Jetty, townsite, nearshore, and beaches
Green Head 5 2017 2022 Jetty, townsite, nearshore, and beaches
Wheatbelt
Jurien Bay 2 2018 2018 Boat harbour, townsite, nature reserve, and Capture nature reserve at least once every five years
beaches
Cervantes 5 2016 2021 Jetty, townsite, nearshore, and beaches Capture nature reserve as well
Lancelin 1 2017 2018 Jetty, townsite, nearshore, and beaches Capture yearly to monitor changes at GDP
Ledge Point 1 2017 2018 Townsite, nearshore, and beaches Capture yearly to accommodate pending boat harbour plans
Seabird 1 2017 2018 Townsite, nearshore, and beaches Try to get yearly record from at least 2017-2022 to track seawall influence on northern beaches
Guilderton 5 2016 2021 Townsite, river mouth, nearshore, and beaches
Metropolitan and Peel
North 1 2017 2018 Northern suburbs inc. Two Rocks
Central 1 2017 2018 Central suburbs inc. Perth
South 1 2017 2018 Southern suburbs inc. Mandurah
Rottnest Island 1 2017 2018 Entire island and nearshore environment
South West
Binngingup 5 2017 2018 Beach and nearshore Already captured yearly within the southern metro aerial run
Bunbury 2 2017 2018 Nearshore, townsite, and beaches inc. The Cut Capture once yearly from 2017-2022 to track Casuarina development. Capture from Dalyellup to top of Lechenault once every five years?
Capel 5 2014 2019 Only need Pepperment Grove Beach
Busselton 2 2017 2018 Coast from Wonnerup to Dunsborough 2016 was eastern Busselton and Wonnerup only; 2017 was only Port Geographe
Margaret River 5 2017 2018 Coast from Margeret River mouth to Gnarabup
Augusta 1 2017 2018 Coast from Cape Leeuwin to East Augusta Annual runs until 2020 tracking potential changes from boat harbour construction; capture mobile river mouth as well
Windy Harbour 5 2017 2022 Headland, island, townsite, and beaches
Great Southern
Peaceful Bay 5 2016 2021 Beach access ramp, caravan park, and beaches
Denmark 5 2017 2022 SLSC, nearshore, and beaches
Albany 2 2017 2018 Oyster Harbour, King George Sound, Princess Try to get two-yearly record of Middleton Beach and Emu Point; can capture all other locations discussed every five years
Royal Harbour, and Whale World
Bremer Bay 1 2017 2018 Harbour to northern edge of White Trail Rd Want 2017 and 2018 following works
Goldfields/Esperance
Hopetoun 2 2017 2018 Culham inlet to 2km east of Hopetoun point Try to get yearly record from 2017-2022 since the 2017 breach of Culham Inlet; can track longshore sediment movement towards this coastal management hotspot
Esperance beach and hydrographic survey 2 2017 2018 West Beach to Bandy Creek boat harbour Can focus on harbour and nourished beaches; ideal to capture entire Esperance and Bandy Creek coast at least once every four years
32 33You can also read