Environment International - Contents lists available at ScienceDirect
←
→
Page content transcription
If your browser does not render page correctly, please read the page content below
Environment International 146 (2021) 106262
Contents lists available at ScienceDirect
Environment International
journal homepage: www.elsevier.com/locate/envint
Protist taxonomic and functional diversity in soil, freshwater and
marine ecosystems
David Singer a, b, c, *, 1, Christophe V.W. Seppey a, d, *, 1, Guillaume Lentendu a, Micah Dunthorn e, f,
David Bass g, Lassâad Belbahri a, Quentin Blandenier a, h, Didier Debroas i, G. Arjen de Groot j,
Colomban de Vargas k, l, Isabelle Domaizon m, Clément Duckert a, Irina Izaguirre n,
Isabelle Koenig a, Gabriela Mataloni o, M. Romina Schiaffino p, Edward A.D. Mitchell a, q,
Stefan Geisen r, 1, *, Enrique Lara a, h, *, 1
a
Laboratory of Soil Biodiversity, Institute of Biology, University of Neuchâtel, Rue Emile-Argand 11, CH-2000 Neuchâtel, Switzerland
b
Department of Zoology, Institute of Biosciences, University of São Paulo, 05508-090, Brazil
c
UMR CNRS 6112 LPG-BIAF, Université d’Angers, Angers Cedex 1, France
d
Department of Arctic and Marine Biology, University of Tromsø, Framstredet 39, 9019 Tromsø, Norway
e
Department of Eukaryotic Microbiology, University of Duisburg-Essen, D-45141 Essen, Germany
f
Centre for Water and Environmental Research (ZWU), University of Duisburg-Essen, D-45141 Essen, Germany
g
Department of Life Sciences, The Natural History Museum, London, UK
h
Real Jardín Botánico de Madrid, CSIC, Plaza de Murillo 2, 28014 Madrid, Spain
i
Université Clermont Auvergne, CNRS, Laboratoire Microorganismes: Genome et Environnement, F-63000 Clermont-Ferrand, France
j
Wageningen Environmental Research, Wageningen UR, P.O. Box 47, 6700 AA Wageningen, the Netherlands
k
Sorbonne Université, CNRS, Station Biologique de Roscoff, UMR 7144, ECOMAP, 29680 Roscoff, France
l
Research Federation for the study of Global Ocean Systems Ecology and Evolution, FR2022/GOSEE, 3 rue Michel-Ange, 75016 Paris, France
m
Université Savoie Mont Blanc, INRAE, CARRTEL, 74200 Thonon-les-Bains, France
n
Departamento de Ecología, Genética y Evolución, IEGEBA (UBA-CONICET), Facultad de Ciencias Exactas y Naturales, Universidad de Buenos Aires, Buenos Aires,
Argentina
o
Instituto de Investigación e Ingeniería Ambiental (IIIA), CONICET, Universidad Nacional de San Martín, Provincia de Buenos Aires 1650, Argentina
p
Universidad Nacional del Noroeste de la Provincia de Buenos Aires, Centro de Investigaciones y transferencia del Noroeste de la Provincia de Buenos Aires (CITNOBA) –
UNNOBA-UNSAdA-CONICET, Junín 6000, Argentina
q
Jardin Botanique de Neuchâtel, Chemin du Perthuis-du-Sault 58, CH-2000 Neuchâtel, Switzerland
r
Laboratory of Nematology, Wageningen University and Research, Droevendaalsesteeg 1, 6708PB Wageningen, the Netherlands
A R T I C L E I N F O A B S T R A C T
Handling Editor: Frederic Coulon Protists dominate eukaryotic diversity and play key functional roles in all ecosystems, particularly by catalyzing
carbon and nutrient cycling. To date, however, a comparative analysis of their taxonomic and functional di
Keywords: versity that compares the major ecosystems on Earth (soil, freshwater and marine systems) is missing. Here, we
Terrestrial systems present a comparison of protist diversity based on standardized high throughput 18S rRNA gene sequencing of
Metabarcoding
soil, freshwater and marine environmental DNA. Soil and freshwater protist communities were more similar to
Microbial eukaryotes
each other than to marine protist communities, with virtually no overlap of Operational Taxonomic Units (OTUs)
Taxonomic and functional diversity
Ocean between terrestrial and marine habitats. Soil protists showed higher γ diversity than aquatic samples. Differences
in taxonomic composition of the communities led to changes in a functional diversity among ecosystems, as
expressed in relative abundance of consumers, phototrophs and parasites. Phototrophs (eukaryotic algae)
dominated freshwater systems (49% of the sequences) and consumers soil and marine ecosystems (59% and 48%,
respectively). The individual functional groups were composed of ecosystem- specific taxonomic groups.
* Corresponding authors at: UMR CNRS 6112 LPG-BIAF, Université d’Angers, Angers Cedex 1, France (D. Singer). Laboratory of Soil Biodiversity, Institute of
Biology, University of Neuchâtel, Rue Emile-Argand 11, CH-2000 Neuchâtel, Switzerland (C.V.W. Seppey). Laboratory of Nematology, Wageningen University and
Research, Droevendaalsesteeg 1, 6708PB Wageningen, the Netherlands (S. Geisen). Real Jardín Botánico de Madrid, CSIC, Plaza de Murillo 2, 28014 Madrid, Spain
(E. Lara).
E-mail addresses: david.singer@univ-angers.fr, david.singer.bio@outlook.com (D. Singer), christophe.seppey@uit.no (C.V.W. Seppey), stefan.geisen@wur.nl
(S. Geisen), enrique.lara@rjb.csic.es (E. Lara).
1
These authors contributed equally to the paper.
https://doi.org/10.1016/j.envint.2020.106262
Received 7 May 2020; Received in revised form 31 October 2020; Accepted 2 November 2020
Available online 19 November 2020
0160-4120/© 2020 The Authors. Published by Elsevier Ltd. This is an open access article under the CC BY license (http://creativecommons.org/licenses/by/4.0/).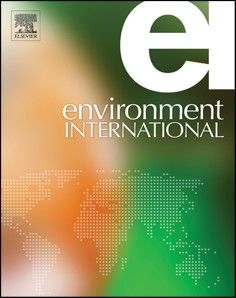
D. Singer et al. Environment International 146 (2021) 106262
Parasites were equally common in all ecosystems, yet, terrestrial systems hosted more OTUs assigned to parasites
of macro-organisms while aquatic systems contained mostly microbial parasitoids. Together, we show biogeo
graphic patterns of protist diversity across major ecosystems on Earth, preparing the way for more focused
studies that will help understanding the multiple roles of protists in the biosphere.
1. Introduction phototrophs to dominate aquatic environments.
Assessing patterns of biodiversity — how they vary among taxo 2. Material and methods
nomic groups, biomes and ecosystems — is an old (Wallace, 1876) but
still relevant question in biology (Gaston, 2000; Mora et al., 2011; Tit 2.1. Environmental samples
tensor et al., 2010; Wall et al., 2001) that provides a starting point to
understand ecosystem functioning and their associated services pro In order to compare the protist diversity in the main ecosystems that
vided by the organisms living there (Cotterill et al., 2007). Most di compose the earth biosphere, we investigated the diversity of marine
versity on Earth is microbial, and protists seem to form a substantial part plankton, freshwater plankton and soil. Our meta-analysis took advan
of this diversity (Adl et al., 2019). Estimating protist diversity is, how tage of published data as well as new samples to complete a dataset
ever, challenging because protists are mostly small and inconspicuous. composed of 122 sampling sites: 28 marine plankton, 21 freshwater
Environmental DNA-based methods have revealed a high and largely plankton and 73 soil samples (Table G.1–2). Marine plankton samples
unknown taxonomic diversity of both prokaryotic (Delgado-Baquerizo were retrieved from the Tara Oceans project (http://taraoceans.sb
et al., 2018) and eukaryotic microorganisms (de Vargas et al., 2015; -roscoff.fr/EukDiv/) and covered two depths (surface and Deep-
Tedersoo et al., 2014). Chlorophyll Maximum: DCM) from the world tropical to temperate
Protists play critical roles in Earth’s systems; for instance marine oceans. For each sample, 80 to 100 L (until filters were clogged with
photosynthetic protists (the eukaryotic part of phytoplankton) fix as biomass) of seawater were collected and the plankton was deposited on
much carbon as all terrestrial plants together (Falkowski et al., 1998). 0.8 µm mesh size filters. The filter membranes were preserved into liquid
Still heterotrophic protists, including many uncharacterized parasitic nitrogen until DNA extraction (de Vargas et al., 2015). In freshwater
and mutualistic symbionts, have recently been shown to be even more samples (ca. 5 L of surface water, until filters were clogged), plankton
diverse and abundant than their phototrophic counterparts (de Vargas was deposited on 0.2 μm polycarbonate filter. The filter-membranes
et al., 2015; Lima-Mendez et al., 2015; Seeleuthner et al., 2018). with concentrated cells were cut into ca. 1 mm2 pieces, preserved in a
Freshwater systems, with their wide variation in physical and chemical DNA preservation buffer (Lifeguard, MoBio Carlsbad CA, USA) and kept
properties may host drastically different communities (Boenigk et al., at a temperature below − 20 ◦ C prior to DNA extraction. Soil samples
2018; Debroas et al., 2017), and soil protists may champion biodiversity consisted of ca. 2 g of the upper organic horizon (0–5 cm). Samples were
due to the complex and highly dynamic distribution of water in soil taken in sterile conditions and kept in DNA preservation buffer (Life
pores that creates extremely heterogeneous environments in time and guard, MoBio Carlsbad CA, USA). No sample was kept over one month
space. This constant change of conditions promotes the activity of only a before DNA extraction, which ensures the stability of the microbial
part of the microbial community, while the rest remains inactive. This communities.
mechanism has been suggested to be key in promoting high microbial
diversity in prokaryotes (Tecon and Or, 2017), and similar mechanisms 2.2. DNA extraction, PCR assays, and high-throughput sequencing
have also been suggested for protists (Velasco-González et al., 2020).
Pioneering studies of soil protists diversity encompassing limited Soil and freshwater DNA was extracted with the MoBio PowerSoil
geographical areas and soil types, have revealed an extreme level of an extraction kit (Carlsbad, CA, USA) according to the manufacturer in
unknown diversity. Indeed as shown in three neotropical forests, only structions. This approach as already been used in several publications in
8.1% of all sequences had ≥95% similarity with known references se freshwater (Lara et al., 2015; Schiaffino et al., 2016), soils (Singer et al.,
quences (Mahé et al., 2017). How these organisms relate to those 2020; Seppey et al., 2017) and marine samples (de Vargas et al., 2015;
encountered in the better-known aquatic systems can help in better Lara et al., 2009). Marine plankton DNA was extracted with the DNA
understanding the diversity and functioning of soil protists. Thus, there Elution buffer kit (Macherey-Nagel, KG, USA) (http://taraoceans.sb
is a need for studies integrating as many ecosystems as possible. Of -roscoff.fr/EukDiv/). The SSU rRNA V9 fragments were PCR amplified
particular relevance to environmental microbiology is knowing which using the eukaryotic primers 1380f/1510r (Amaral-Zettler et al., 2009),
groups contribute to the taxonomic and functional diversity in each according to the protocols described in (Singer et al., 2016) for soil and
ecosystem, how do overall diversity compare and how variable it is in freshwater samples, and the universal primers 1389f/1510r (Amar
each ecosystem (Geisen et al., 2017). al-Zettler et al., 2009; de Vargas et al., 2015) for marine plankton. The
This study compares the diversity of protists across the marine and minor difference in primer sets is not expected to strongly impact the
freshwater sunlit and top soil ecosystems. Using both published and new taxonomic distribution between marine and freshwater/soils (Geisen
data from the same genetic marker and sequencing technology (Illumina et al. ,2019). The amplicons were sequenced with a HiSeq Illumina 2000
high-throughput sequencing of the v9 region of the 18S rRNA gene), our and 2500 sequencer for both soils and freshwater, and with an Illumina
first aim was to compare the α, β and γ diversity among the three eco Genome Analyzer for marine samples. The sequencing reads are avail
systems for the overall protists community and for 55 dominant taxa. We able through the projects PRJEB6609 (marine samples) and
expected the entire protist diversity (γ) to be highest in soil due to the PRJEB41211 for the other samples on the European Nucleotide Archive
highest habitat niche space. Furthermore, we expected the higher tem of the European Molecular Biology Laboratory.
poral and spatial heterogeneity in freshwater and soil environments to
increase protist β diversity compared to marine protists. Our second
2.3. Generation of protist operational taxonomic units (OTUs)
major hypothesis was that the taxonomic composition of protist com
munities was most dissimilar in marine samples due to the salinity
Environmental rRNA SSU V9 reads from all samples were first
barrier (Logares et al., 2009). In contrast, we tested the hypothesis that
merged with the program flash v1.2.11 (Magoc and Salzberg, 2011) and
the functional composition of protists is most dissimilar in soils due to
trimmed to remove the eukaryotic primers with a custom script (https
the dominance of lesser known consumers, whereas we expected
://github.com/cseppey/bin_src_my_prog/blob/master/perl/trim_prime
2D. Singer et al. Environment International 146 (2021) 106262
r.pl). Sequences from all samples were then dereplicated with a custom such as algal blooms, increasing the proportion of phototroph, parasites
script (https://github.com/cseppey/bin_src_my_prog/blob/master/ developing on the algae or consumers feeding on the soluble organic
cpp/derep.cpp) prior to OTU clustering performed with swarm matter left after the parasitic infection. In addition, certain groups of
v2.1.13 with the fastidious option (Mahé et al., 2015). OTUs were finally species can switch rapidly between different trophic lifestyles. Never
assigned using the global alignment option on vsearch v2.4.4 (Rognes theless, the overall signal can provide an insight of the importance of
et al., 2016) against the PR2 database v4.12.0 (Guillou et al., 2012). each function in the different ecosystems.
Chimerical sequences were removed by comparing the reads within the
dataset with the program vsearch v2.4.4 (Rognes et al., 2016). 2.5. Statistical analyses
Certain OTUs were then sorted out according to three criteria, as
originating from putative non-protists and macroscopic organisms. 1) In order to avoid bias related to 1) the number of samples per
OTUs belonging to Metazoa, Embryophyceae, Fungi and Rhodophyta ecosystem and 2) the sequencing depth, we ran the analyses on 100
were removed, as well as 2) the ones having a sequence with a length bootstraps composed of 60 samples (20 samples per ecosystems) of
below 100 nucleotides, and 3) the ones having a percentage of identity 10′ 000 reads each. The figures were selected from a bootstrap best
below 60% with the database as putative prokaryotes. representing the overall trend among the 100 bootstraps (Annex H1-5).
We acknowledge that our conservative sequence cutoff to 10′ 000 reads
2.4. Functional assignment of OTUs per sample is far from complete taxon sampling. Yet, we here did not aim
to obtain complete species inventories but rather to enable reliable
We assigned OTUs to three major functional groups, based on their community comparisons of the numerically dominant taxa across
taxonomic affiliation according to three main trophic modes: Photo ecosystems.
trophic (Archaeplastida, Ochrophyta), Parasitic (Apicomplexa, Ichtyo We estimated the γ diversity of each ecosystem with the bootstrap
sporea, MALV, Peronosporomycetes, Syndiniales), Consumers estimator of species richness (BES) and a species accumulation curve
(Ciliophora, Rhizaria, non-Fungi Opisthokonta, Amoebozoa, non- (SAC) (functions specpool and specaccum, package vegan v. 2.5–2
Ochrophyta and non-Peronosporomycetes Stramenopiles) (Table F.1). (Oksanen et al., 2018)). We also estimated the α diversity (Shannon
We considered as phototrophic any organism that used photosyn index, function diversity, package vegan v. 2.5–2, (Oksanen et al.,
thesis, independently of the capacity of the organism to also retrieve 2018)) of each of the 55 major lineages that represent the bulk of the
carbon through heterotrophy (mixotrophy). The organisms that ac known protist diversity in each type of ecosystem, respectively,
quired food through phagocytosis were labelled consumers. We decided following the same procedure as described above.
to consider as parasite any symbiont reducing the fitness of its host, We assessed the similarity patterns among protist communities
independently if the host is killed by its symbiont (parasitoid) or not. We (β-diversity) by non-metric multidimensional scaling (NMDS). NMDS
also consider all Peronosporomycetes as parasites because parasitism is was calculated on Bray-Curtis dissimilarities retrieved from the
considered as the ancestral condition of the group (Misner et al., 2014), sequence relative abundance. The significance of differences between
even though many of them often live as saprotrophs and behave as pairs of ecosystems were measured by permutation tests (10′ 000 per
facultative parasites. mutations; functions vegdist, metaMDS and envfit, package vegan v.
We verified manually the precise phylogenetic affiliation of all 2.5–2 (Oksanen et al., 2018)). To estimate which ecosystems were
Dinophyceae OTUs to infer their function. However, 55% of dinokary showing the highest β diversity, we compared the distributions of Bray-
otic OTUs were still assigned to “unknown Dinophyceae” which pre Curtis distances within ecosystem.
vented functional assignation. These organisms may range functionally We finally tested for differences among ecosystems for α and β di
from phototrophic to strictly heterotrophic consumers. In marine sys versity indices by pairwise tests for multiple comparison of mean rank
tems, it has been estimated that 58% of species are strictly consumers sums (Nemenyi test, P < 0.05; function posthoc.kruskal.nemenyi.test,
while 42% perform photosynthesis. In freshwater systems, only 12% are package PMCMR v. 4.3 (Pohlert, 2014)) in each bootstrap. We also use
consumers while 88% are phototrophic (Gómez, 2012). As phototrophy this approach to test the differences between ecosystems for the log of
is a trait that changes rapidly in dinokaryote evolution (Saldarriaga the number of reads, the log of the richness and the Shannon diversity
et al., 2004), we considered that these numbers represented both the within each of the 55 dominant taxonomic groups, as well as for the
percentage of OTUs and of reads in both marine and freshwater systems. functional groups relative abundance.
Soil dinoflagellates have been poorly described, but our results show
more similarities with freshwater communities than with marine sam 2.6. Dataset consistency
ples; therefore, we considered also that 12% of soil dinoflagellates were
consumers (Fig. A.1). This study is, to a certain extent, a meta-analysis because part of the
Chrysophyceae present different nutrient acquisition strategies data (concretely, the marine data) was derived from other studies. Thus,
ranging from phototrophic to consumers (Boenigk et al., 2005). Recent most samples were obtained with distinct methods. Thus, despite tar
works suggest that Chrysophyceae are ancestrally phototrophic, some geting the same rRNA region (V9) and using the same sequencing
groups or species having lost photosynthetic ability later during their technology (Illumina sequencing) the sampling and laboratory proced
evolutionary history (Dorrell et al., 2019). We considered as consumers ures used were not homogeneous, thus potentially producing biases. We
those OTUs assigned to Chromulinospumella, Segregatospumella, Oiko therefore tested how robust our data was to methodological biases,
monas (Clade B2), Acrispumella, Apoikia, Edaphospumella, Kephyrion, including (1) different filtration and sample preservation protocols (2)
Spumella, and Poteriospumella (Clade C), as well as the Clade F (Para use of different extraction kits and (3) use of different primer sets.
physomonas and allied genera). The rest were considered as photo
trophic. As for the Dinophyceae, many Chrysophyceae OTUs were not (1). Pore filter sizes varied between freshwater and marine samples.
functionally assignable (44% of the OTUs of the first bootstrap). To our In both cases, filter mesh sizes are below 1 μm, which corresponds
knowledge, there is no information on the consumer/phototroph ratio to the size of the smallest eukaryotes known, such as for instance
for this clade as it is for Dinophyceae in marine and freshwaters. In order Ostreococcus tauri (Chrétiennot-Dinet et al., 1995). We are
to include the functionally unknown Chrysophyceae, we calculated the confident, therefore, that we retrieved all eukaryotes in the water
ratio consumer/photroph for the functionally assigned OTUs in each column, and therefore are comparable to soil in the range of sizes
sample. Then, we pooled reads and OTUs number of functionally un that were considered.
classified Chrysophyceae according to the ratio consumer/phototroph. (2). Extraction kits differed between freshwater/soil and marine
Our sampling design did not allow us to assess temporal patterns samples. While it has been shown that slightly different protist
3D. Singer et al. Environment International 146 (2021) 106262
community profiles were retrieved by using commercial and more diverse (respectively, 5.25 ± 0.22 SE and 5.05 ± 0.08 SE) (Fig. 1B,
“homemade” protocols, the differences concerned only particular Table H.1).
groups (Santos et al., 2017). Given the differences that have been In line, 20.67 ± 0.28 out of 55 broad taxonomic groups targeted
shown between marine and freshwater/soil communities, it is showed significantly higher α diversity in soils while 9.15 ± 0.8 were
difficult to evaluate how far this bias affects the big picture pre more diverse in marine samples and 0.90 ± 0.05 were more diverse in
sented here as retrieved with two commercial kits, but differences freshwater (Fig. B.2). This probably higher α diversity in soils followed
are most likely minor. our prediction based on the co-existence of several dormant and active
(3). Primer sets differed between freshwater/soil and marine samples. organisms that differ in their ecological requirements but reactivate
However, these two sets amplify the same spectrum of the under suitable conditions.
eukaryotic diversity (Geisen et al., 2019). We tested this The high α and γ diversity in soils contrast with the low number of
assumption in silico from data that used the primers on the same described soil protist species (ca. 21′ 000 species (Mora et al., 2011)),
samples (Amaral-Zettler et al., 2009; Stoeck et al., 2009) to while estimations suggest the existence of millions (Geisen et al., 2018).
demonstrate that biases produced by different primer sets were We compared the level of knowledge for all three ecosystems based on
negligible (Appendix I). the percentage of identity between the OTU reads and the best match
with the PR2 eukaryotic ribosomal database (Guillou et al., 2012)
3. Results and discussion (Fig. C.1, Table H.2). Soil OTUs had, on average, a significantly lower
percentage of similarity with known sequences (87.28% ± 0.08 SE) than
3.1. Communities richness: α and γ diversity freshwater systems OTUs (90.56% ± 0.08 SE), with the best percentage
of identity with the database for the OTUs found in marine ecosystems
As expected, protist γ diversity predicted by BES was higher for soils (91.39% ± 0.09 SE, Nemenyi test: P < 0.05).
(16′ 337 OTUs ± 892 SE) than for the two aquatic ecosystems
(freshwater:11′ 490 OTUs ± 756, marine water: 12′ 540 OTUs ± 689) 3.2. Community heterogeneity; β diversity
(Fig. 1A, Table H.1). Gamma diversity was highest in soils in 26.3 ± 0.1
of the taxonomic groups, 11.0 ± 0.1 in marine samples and 11.7 ± 0.1 in β diversity was highest in freshwater (0.924 ± 0.006), slightly but
freshwater (Fig. 2, B.1). Even though OTU richness did not reach satu significantly lower in soils (0.894 ± 0.006) and lowest in the marine
ration, most of the SAC trends clearly discriminated the gamma diversity plankton (0.777 ± 0.009) (Fig. 1C, Table H.1). This higher biological
of the three ecosystems; trends that would likely stand with a deeper heterogeneity in freshwater and soil systems reflects their respective
sampling effort (Fig. B.1). heterogenous abiotic conditions compared to the relatively buffered
Freshwater had the lowest α diversity (3.68 ± 0.18 SE), while soils conditions in the ocean. Indeed, soil and freshwater samples vary
and marine waters did show significantly difference, soil being slightly considerably in their pH values which has a known impact on microbial
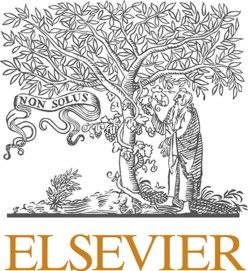
Fig. 1. General patterns of diversity of pro
tists retrieved from a sampling throughout
marine waters, freshwaters and soils. (A)
Species accumulation curves calculated from
protist communities retrieved from marine
(dark blue), freshwater (cyan) and soil (or
ange) samples. The horizontal plain and
dashed lines above the species accumulation
curves indicate the predicted number of
OTUs (bootstrap estimator of species rich
ness) and standard error associated for each
ecosystem respectively. (B) Shannon di
versity indices per ecosystem. (C) Bray-Curtis
distances within each ecosystems. (D) Ordi
nation plot (non-metric multidimensional
scaling) of OTU protists communities from
marine water (dark blue circle), freshwater
(cyan triangle) and soil (orange square).
Numbers above the distributions of sub-
figure B and C indicate significantly
different distributions (Nemenyi test P <
0.05), “1′′ representing the highest distribu
tion and “3” the lowest. (For interpretation
of the references to colour in this figure
legend, the reader is referred to the web
version of this article.)
4D. Singer et al. Environment International 146 (2021) 106262
Fig. 2. Schematic phylogenetic tree of the main pro
tist taxa and their relative abundance in three eco
systems (marine water: dark blue, freshwater: cyan,
soil: orange). Barplots represent the OTU richness of
each taxon predicted by bootstrap estimator of species
richness in each ecosystem. Predictions higher than
500 OTUs are written numerically. Numbers in front
of bars indicate significantly different groups (Nem
enyi test P < 0.05), “1′′ representing the highest dis
tribution and “3” the lowest. Pie-chart represent the
relative abundance of reads in function of each
ecosystem (marine water: dark blue, freshwater: cyan,
soil: orange). (For interpretation of the references to
colour in this figure legend, the reader is referred to
the web version of this article.)
5D. Singer et al. Environment International 146 (2021) 106262
Table H.3). While rhizarians in terrestrial systems (freshwater and soil)
were dominated by Cercozoa, marine rhizarians mostly belonged to
Radiolaria (Fig. E.2). Ciliates were overall, respectively, the richest and
second richest group of consumers in freshwater and soil ecosystems and
show the same pattern for relative abundance (Fig. E.2). Their broad
range of lifestyles is key to their evolutionary success in many ecosys
tems (Lynn, 2008) although their highly polyploid macronucleus might
somehow artificially inflate their estimated abundance in the environ
ment (de Vargas et al., 2015). Stramenopiles constituted the third most
represented major group of consumers overall (Fig. E.2). Non-
photosynthetic Stramenopiles included organisms collectively known
as MAST (Massana et al., 2004) (MArine STramenopiles, now known to
also thrive in other ecosystems), Bicoecea and Labyrinthulomycetes.
Labyrinthulomycetes were previously considered largely marine until
new deep-branching phagotrophic groups were discovered in other
ecosystems (Gomaa et al., 2013). Our data confirm their prevalence in
soil, as they present even higher α and γ diversity in these systems
(Fig. B.1-2).
Phototrophs were overall the second most abundant functional
group, and dominated freshwater systems (Fig. 3, Table H.3). Interest
ingly, their relative abundance in marine plankton was not significantly
higher than in soil (Fig. 3, Table H.3, Nemenyi test: P > 0.05). Given the
Fig. 3. Reads relative abundance from OTUs assigned to heterotrophs, photo importance of phototrophy in marine systems for global carbon fixation
trophs, parasites or unknown functional group in marine ecosystems (dark and nutrient cycling (Falkowski et al., 1998), this relative abundance
blue), freshwater (cyan) and soil (orange). Numbers at the top of the boxplot suggests a remarkable and unexpected role of microbial photosynthesis
indicate significantly different distributions within a functional groups (Nem
in soils. Although the standing biomass of soil phototrophs (“subaerial
enyi test P < 0.05), “"1′′ representing the highest distribution and “2” the
algae”) is negligible as compared with plants, their turnover is likely
lowest. (For interpretation of the references to colour in this figure legend, the
reader is referred to the web version of this article.)
much faster and accelerated by specific predation (Mann and Vanor
melingen, 2013; Seppey et al., 2017), as is well documented in the
ocean. Mostly photosynthetic dinoflagellates were extremely abundant
life and diversity, as well as nutrient amounts (Delgado-Baquerizo et al.,
in marine systems while Chrysophyceae dominated the freshwaters and
2018). The passive dispersal of soil protists, which may tend to ho
Archaeplastida were widespread in soils (Fig. E.3). Interestingly, the
mogenize diversity is likely lower than for aquatic protists, as only some
main freshwater phototrophic groups (phototrophic Chrysophyceae,
protists spread by wind and animals, many others relying on slow active
Cryptophyta, phototrophic Dinophyceae) behave also alternatively as
dispersal (Wilkinson et al., 2011). Likewise, freshwater systems are
consumers (mixotrophs). In soils, these groups are way less represented,
fragmented in the landscape which may cause barriers to dispersal
with the groups being present often having lost the capacity for photo
(Dodson, 1992; Reche et al., 2005). By contrast, protists are likely to
synthesis (such as Clade C Chrysophytes, collectively designated as
have high dispersal in marine waters due to buffered condition of
Spumella spp. (Boenigk et al., 2005). Hence, in freshwater systems the
seawater pH, ion concentrations only varying to a limited extent, and
number of strict consumers seems lower than in other systems, but this
oceans being highly connected through the global marine circulation
role may be assumed to some extent by mixotrophic phototrophs. Many
(Richter et al., 2019). The homogeneity in community composition be
dinoflagellates and Archaeplastida often form mutualistic associations
tween marine communities was also corroborated by the smaller ordi
with other protists, but also fungi and animals (LaJeunesse, 2001). Their
nation space covered in the NMDS analysis, in comparison to soil and
high abundance agrees with the immense importance of photosymbiosis
freshwater samples (Fig. 1D). The NMDS also showed that the three
at a global level.
communities were different from each other (permutation test P < 0.001
Parasitic taxa represented roughly 15 to 20% of all sequences in
in the 100 bootstraps)
marine and soil systems, but only around 5% in freshwater systems
Our results illustrated the importance of the salinity barrier as a
(Fig. 3), where taxa of the fungal phylum Chytridiomycota likely fill the
driver for protist diversity (Balzano et al., 2015; Logares et al., 2009), as
ample niche of eukaryotic parasites (Rasconi et al., 2012). Chytrids are
soil and freshwater communities differ less from each-other than they do
indeed generally well represented in environmental DNA-based di
from marine communities (Fig. 1D). This is also shown by the high
versity surveys (Debroas et al., 2017; Lepère et al., 2019). In soils,
number of OTUs shared between freshwater and soil samples (1152 ±
genuine parasites (who did not necessarily kill their host) were domi
9), while only 79 ± 1 OTUs are shared between marine and freshwater
nated by Apicomplexans, an extremely diverse and abundant group
samples, and 14 ± 0 between soil and marine samples (Fig. D.1, H.5).
known to infect Metazoans (Mahé et al., 2017; Singer et al., 2020), and
Only 25 ± 0 OTUs were recorded in all ecosystems, including small
plant parasites such as many terrestrial oomycetes and plasmodio
heterotrophic flagellates i.e. the kinetoplastid Neobodonid, and the
phorids (Fig. E.4). In marine systems the parasitoid strategy (in which
Raphid-Pennate diatoms from which genera Nitzschia and Pseudo-nitz
the host is killed to complete its life cycle) dominates with an over
schia, which are indeed known to tolerate a wide range of salinity
whelming relative abundance of Syndiniales, which lyse host cells
(Scholz and Liebezeit, 2012). However, considering the rather coarse
before spreading propagules (Fig. E.4). Freshwater systems comprised
taxonomic discrimination allowed by the 18S rRNA gene (Alverson,
parasitoid groups such as Perkinsea, Syndiniales and most certainly
2008) and the small length of the markers used in this study, it is
Chytridiomycota (Sime-Ngando et al., 2015), but also “true” parasites
possible that these ubiquitous OTUs correspond to different but rela
like Peronosporomycetes, Apicomplexa and Ichtyosporea (Fig. E.4). This
tively closely-related species.
suggests a high connectivity of terrestrial systems with the macroscopic
food web (plants and animals) whereas in aquatic systems (freshwaters
3.3. The distribution of taxonomic and functional diversity and marine waters) parasitism would affect mostly other microbes that
would be rapidly lysed, thus creating bloom dynamics which may
Consumers dominated sequence relative abundance in soil (Fig. 3, accelerate the pace of nutrient turnover (Mangot et al., 2013). The
6D. Singer et al. Environment International 146 (2021) 106262
longer lifespan of macroscopic organisms and the fact that these might and Betty Moore Foundation through grant GBMF5257 UniEuk. The
not be systematically killed by their parasites suggests different nutrient authors would like to thank all the peoples involved in the sampling and
transfer through the systems. in the laboratory and the Calculations Center of the Faculty of Science of
In spite of all differences observed among the three ecosystems, our the University of Neuchâtel as well as UNINETT Sigma2 – the National
survey revealed a remarkable functional homogeneity. Heterotrophy Infrastructure for High Performance Computing (project NN9549K) and
dominates all processes in general, taking into account that even in Data Storage (project NS9593K) in Norway for the computing facilities.
freshwater where the proportion of phototrophs is higher, many pig
mented organisms are actually mixotrophic (i.e. combining phagocy Appendix A. Supplementary material
tosis and photosynthesis (Sanders, 1991)). Phototrophs appear in lower
proportions, their standing biomass probably constrained by intense Supplementary data to this article can be found online at https://doi.
predation enhancing nutrient turnover. The action of parasites also org/10.1016/j.envint.2020.106262.
likely contributes to nutrient turnover, by lysing microbial cells through
a parasitoid strategy in aquatic ecosystems and increasing the death rate References
of macro-organisms in terrestrial ecosystems.
Adl, S.M., Bass, D., Lane, C.E., Lukeš, J., Schoch, C.L., Smirnov, A., Agatha, S., Berney, C.,
3.4. Conclusions Brown, M.W., Burki, F., Cárdenas, P., Čepička, I., Chistyakova, L., Campo, J.,
Dunthorn, M., Edvardsen, B., Eglit, Y., Guillou, L., Hampl, V., Heiss, A.A.,
Hoppenrath, M., James, T.Y., Karnkowska, A., Karpov, S., Kim, E., Kolisko, M.,
A key result of our study is that soils host the richest protist com Kudryavtsev, A., Lahr, D.J.G., Lara, E., Le Gall, L., Lynn, D.H., Mann, D.G.,
munities on Earth. Thus, while all ecosystems contain a wealth of Massana, R., Mitchell, E.A.D., Morrow, C., Park, J.S., Pawlowski, J.W., Powell, M.J.,
Richter, D.J., Rueckert, S., Shadwick, L., Shimano, S., Spiegel, F.W., Torruella, G.,
undescribed protist species, this is especially true in soils. In line with Youssef, N., Zlatogursky, V., Zhang, Q., 2019. Revisions to the classification,
our predictions, spatial and ecological heterogeneity are correlated with nomenclature, and diversity of eukaryotes. J. Eukaryot. Microbiol. 66 (1), 4–119.
diversity, as shown by the higher β diversity observed in freshwater and Alverson, A.J., 2008. Molecular systematics and the diatom species. Protist 159 (3),
339–353.
soil environments. This calls for an increased exploration of less pro Amaral-Zettler, L.A., McCliment, E.A., Ducklow, H.W., Huse, S.M., 2009. A method for
spected ecosystem types to find new diversity followed by the expansion studying protistan diversity using massively parallel sequencing of V9 hypervariable
of the existing curated and annotated databases such as UniEuk (Berney regions of small-subunit ribosomal RNA genes. PloS one 4, e6372. https://doi.org/
10.1371/journal.pone.0006372.
et al., 2017).
Balzano, S., Abs, E., Leterme, S.C., 2015. Protist diversity along a salinity gradient in a
Our estimations for functional diversity were only partially fulfilled. coastal lagoon. Aquat. Microb. Ecol. 74 (3), 263–277.
On one hand, our study underlines the importance of phagocytosis Berney, C., Ciuprina, A., Bender, S., Brodie, J., Edgcomb, V., Kim, E., Rajan, J., Parfrey, L.
through the relative abundance and diversity of consumers in all eco W., Adl, S., Audic, S., Bass, D., Caron, D.A., Cochrane, G., Czech, L., Dunthorn, M.,
Geisen, S., Glöckner, F.O., Mahé, F., Quast, C., Kaye, J.Z., Simpson, A.G.B.,
systems, and especially in soils. On the other hand, the amount of Stamatakis, A., del Campo, J., Yilmaz, P., de Vargas, C., 2017. UniEuk: Time to Speak
photosynthesizing organisms were not significantly different in marine a Common Language in Protistology! J. Eukaryot. Microbiol. 64 (3), 407–411.
and soil samples. Given the recognized importance of marine photo Boenigk, J., Pfandl, K., Stadler, P., Chatzinotas, A., 2005. High diversity of the ’Spumella-
like’ flagellates: an investigation based on the SSU rRNA gene sequences of isolates
trophs for global nutrient turnover, these results suggest that soil pho from habitats located in six different geographic regions. Environ. Microbiol. 7 (5),
totrophs might have a larger contribution to the global carbon cycle than 685–697.
previously thought. Boenigk, J., Wodniok, S., Bock, C., Beisser, D., Hempel, C., Grossmann, L., Lange, A.,
Jensen, M., 2018. Geographic distance and mountain ranges structure freshwater
protist communities on a European scale. MBMG 2, e21519. https://doi.org/
4. Authors’ contributions 10.3897/mbmg.2.21519.
Chrétiennot-Dinet, M.-J., Courties, C., Vaquer, A., Neveux, J., Claustre, H., Lautier, J.,
Machado, M.C., 1995. A new marine picoeucaryote: Ostreococcus tauri gen. et sp.
D.S, C.V.W.S, E.A.D.M and E.L designed the experiments; D.S., M.D., nov. (Chlorophyta, Prasinophyceae). Phycologia 34 (4), 285–292.
C.V., D.B., L.B., Q.B., D.D., C.D., I.D., I.I., G.M., M.R.S., E.A.D.M., A.G. Cotterill, F.P.D., Al-Rasheid, K., Foissner, W., 2007. Conservation of protists: is it needed
and E.L. provided the samples; D.S., performed the laboratory work; C. at all? In: Protist Diversity and Geographical Distribution. Springer, pp. 193–209.
de Vargas, C., Audic, S., Henry, N., Decelle, J., Mahé, F., Logares, R., Lara, E., Berney, C.,
V.W.S, D.S, G.L. and E.L. analyzed the data; D.S., C.V.W.S., S.G., E.A.D.
Le Bescot, N., Probert, I., Carmichael, M., Poulain, J., Romac, S., Colin, S., Aury, J.-
M., and E.L. wrote the first version of the manuscript, which was then M., Bittner, L., Chaffron, S., Dunthorn, M., Engelen, S., Flegontova, O., Guidi, L.,
edited by all co-authors. Horák, A., Jaillon, O., Lima-Mendez, G., Lukeš, J., Malviya, S., Morard, R., Mulot,
M., Scalco, E., Siano, R., Vincent, F., Zingone, A., Dimier, C., Picheral, M., Searson,
S., Kandels-Lewis, S., Coordinators, T.O., Acinas, S.G., Bork, P., Bowler, C., Gorsky,
Declaration of Competing Interest G., Grimsley, N., Hingamp, P., Iudicone, D., Not, F., Ogata, H., Pesant, S., Raes, J.,
Sieracki, M.E., Speich, S., Stemmann, L., Sunagawa, S., Weissenbach, J., Wincker, P.,
The authors declare that they have no known competing financial Karsenti, E., 2015. Eukaryotic plankton diversity in the sunlit ocean. Science 348,
1261605. https://doi.org/10.1126/science.1261605.
interests or personal relationships that could have appeared to influence Debroas, D., Domaizon, I., Humbert, J.-F., Jardillier, L., Lepère, C., Oudart, A., Taïb, N.,
the work reported in this paper. 2017. Overview of freshwater microbial eukaryotes diversity: a first analysis of
publicly available metabarcoding data. FEMS Microbiol. Ecol. 93, fix023. https://
doi.org/10.1093/femsec/fix023.
Acknowledgements Delgado-Baquerizo, M., Oliverio, A.M., Brewer, T.E., Benavent-González, A., Eldridge, D.
J., Bardgett, R.D., Maestre, F.T., Singh, B.K., Fierer, N., 2018. A global atlas of the
This work was supported by the Swiss National Science Foundation dominant bacteria found in soil. Science 359 (6373), 320–325.
Dodson, S., 1992. Predicting crustacean zooplankton species richness. Limnol. Oceanogr.
31003A_143960 & 31003A_163254 to E.L., P2NEP3-178543 to D.S. and 37 (4), 848–856.
31003A_182531 to E.A.D.M.; internal funding of the University of Dorrell, R.G., Azuma, T., Nomura, M., Audren de Kerdrel, G., Paoli, L., Yang, S.,
Neuchâtel to E.A.D.M.; the ‘Atracción de talentos’ from the Community Bowler, C., Ishii, K.-I., Miyashita, H., Gile, G.H., Kamikawa, R., 2019. Principles of
plastid reductive evolution illuminated by nonphotosynthetic chrysophytes. Proc.
of Madrid, project 2017-T1/AMB-5210 and the project MYXOTROPIC VI Natl. Acad. Sci. USA 116 (14), 6914–6923.
(PGC2018-094660-B-I00) from the Spanish Government to E.L.; NWO- Falkowski, P.G., Barber, R.T., Smetacek, V., 1998. Biogeochemical controls and
VENI grant from the Netherlands Organisation for Scientific Research feedbacks on ocean primary production. Science 281, 200–206. https://doi.org/
10.1126/science.281.5374.200.
(016.Veni.181.078) to S.G.; the Norwegian Research Council projects
Gaston, K.J., 2000. Global patterns in biodiversity. Nature 405 (6783), 220–227.
270252 (BiodivERsA-Climate change impacts on Arctic soil and lake Geisen, S., Mitchell, E.A.D., Adl, S., Bonkowski, M., Dunthorn, M., Ekelund, F.,
microbiomes) and 256132 (ERAnet-LAC, METHAnogenic Biodiversity Fernández, L.D., Jousset, A., Krashevska, V., Singer, D., Spiegel, F.W., Walochnik, J.,
and activity in Arctic and Sub-Antarctic Ecosystems affected by climate Lara, E., 2018. Soil protists: a fertile frontier in soil biology research. FEMS
Microbiol. Rev. 42, 293–323. https://doi.org/10.1093/femsre/fuy006.
change) to C.V.W.S.; the French Government ’Investissements d’Avenir’ Geisen, S., Mitchell, E.A.D., Wilkinson, D.M., Adl, S., Bonkowski, M., Brown, M.W., Fiore-
program OCEANOMICS (ANR-11-BTBR-0008) to C.d.V., and the Gordon Donno, A.M., Heger, T.J., Jassey, V.E.J., Krashevska, V., Lahr, D.J.G., Marcisz, K.,
7D. Singer et al. Environment International 146 (2021) 106262
Mulot, M., Payne, R., Singer, D., Anderson, O.R., Charman, D.J., Ekelund, F., Richter, D.J., Watteaux, R., Vannier, T., Leconte, J., Frémont, P., Reygondeau, G.,
Griffiths, B.S., Rønn, R., Smirnov, A., Bass, D., Belbahri, L., Berney, C., Maillet, N., Henry, N., Benoit, G., Fernàndez-Guerra, A., Suweis, S., Narci, R.,
Blandenier, Q., Chatzinotas, A., Clarholm, M., Dunthorn, M., Feest, A., Fernández, L. Berney, C., Eveillard, D., Gavory, F., Guidi, L., Labadie, K., Mahieu, E., Poulain, J.,
D., Foissner, W., Fournier, B., Gentekaki, E., Hájek, M., Helder, J., Jousset, A., Romac, S., Roux, S., Dimier, C., Kandels, S., Picheral, M., Searson, S., Pesant, S.,
Koller, R., Kumar, S., La Terza, A., Lamentowicz, M., Mazei, Y., Santos, S.S., Aury, J.-M., Brum, J.R., Lemaitre, C., Pelletier, E., Bork, P., Sunagawa, S., Karp-Boss,
Seppey, C.V.W., Spiegel, F.W., Walochnik, J., Winding, A., Lara, E., 2017. Soil L., Bowler, C., Sullivan, M.B., Karsenti, E., Mariadassou, M., Probert, I., Peterlongo,
protistology rebooted: 30 fundamental questions to start with. Soil Biol. Biochem. P., Wincker, P., de Vargas, C., Ribera d’Alcalà, M., Iudicone, D., Jaillon, O., 2019.
111, 94–103. Genomic evidence for global ocean plankton biogeography shaped by large-scale
Geisen, S., Vaulot, D., Mahé, F., Lara, E., de Vargas, C., Bass, D., 2019. A user guide to current systems. bioRxiv 867739. https://doi.org/10.1101/867739.
environmental protistology: primers, metabarcoding, sequencing, and analyses. Rognes, T., Flouri, T., Nichols, B., Quince, C., Mahé, F., 2016. VSEARCH: a versatile open
bioRxiv 850610. https://doi.org/10.1101/850610. source tool for metagenomics. PeerJ 4, e2584. https://doi.org/10.7717/peerj.2584.
Gomaa, F., Mitchell, E.A.D., Lara, E., 2013. Amphitremida (poche, 1913) is a new major, Saldarriaga, J.F., “Max” Taylor, F.J.R., Cavalier-Smith, T., Menden-Deuer, S., Keeling, P.
ubiquitous labyrinthulomycete clade. PloS one 8, e53046. https://doi.org/10.1371/ J., 2004. Molecular data and the evolutionary history of dinoflagellates. Eur. J.
journal.pone.0053046. Protistol. 40 (1), 85–111.
Gómez, F., 2012. A quantitative review of the lifestyle, habitat and trophic diversity of Sanders, R.W., 1991. Mixotrophic protists in marine and freshwater ecosystems.
dinoflagellates (Dinoflagellata, Alveolata). Syst. Biodivers. 10 (3), 267–275. J. Protozool. 38, 76–81. https://doi.org/10.1111/j.1550-7408.1991.tb04805.x.
Guillou, L., Bachar, D., Audic, S., Bass, D., Berney, C., Bittner, L., Boutte, C., Burgaud, G., Santos, S.S., Nunes, I., Nielsen, T.K., Jacquiod, S., Hansen, L.H., Winding, A., 2017. Soil
de Vargas, C., Decelle, J., 2012. The Protist Ribosomal Reference database (PR2): a DNA extraction procedure influences protist 18S rRNA gene community profiling
catalog of unicellular eukaryote small sub-unit rRNA sequences with curated outcome. Protist 168 (3), 283–293.
taxonomy. Nucleic Acids Res. 41, D597–D604. https://doi.org/10.1093/nar/ Schiaffino, M.R., Lara, E., Fernández, L.D., Balagué, V., Singer, D., Seppey, C.V.W.,
gks1160. Massana, R., Izaguirre, I., 2016. Microbial eukaryote communities exhibit robust
LaJeunesse, T.C., 2001. Investigating the biodiversity, ecology, and phylogeny of biogeographical patterns along a gradient of Patagonian and Antarctic lakes.
endosymbiotic dinoflagellates in the genus symbiodinium using the its region: in Environ. Microbiol. 18, 5249–5264. https://doi.org/10.1111/1462-2920.13566.
search of a “species” level marker. J. Phycol. 37 (5), 866–880. Scholz, B., Liebezeit, G., 2012. Compatible solutes in three marine intertidal
Lara, E., Moreira, D., Vereshchaka, A., López-García, P., 2009. Pan-oceanic distribution microphytobenthic Wadden Sea diatoms exposed to different salinities. Eur. J.
of new highly diverse clades of deep-sea diplonemids. Environ. Microbiol. 11, 47–55. Phycol. 47 (4), 393–407.
https://doi.org/10.1111/j.1462-2920.2008.01737.x. Seeleuthner, Y., Mondy, S., Lombard, V., Carradec, Q., Pelletier, E., Wessner, M.,
Lara, E., Seppey, C.V.W., González Garraza, G., Singer, D., Quiroga, M.V., Mataloni, G., Leconte, J., Mangot, J.-F., Poulain, J., Labadie, K., Logares, R., Sunagawa, S., de
2015. Planktonic eukaryote molecular diversity: discrimination of minerotrophic Berardinis, V., Salanoubat, M., Dimier, C., Kandels-Lewis, S., Picheral, M.,
and ombrotrophic peatland pools in Tierra del Fuego (Argentina). J. Plankton Res. Searson, S., Pesant, S., Poulton, N., Stepanauskas, R., Bork, P., Bowler, C.,
37, 645–655. https://doi.org/10.1093/plankt/fbv016. Hingamp, P., Sullivan, M.B., Iudicone, D., Massana, R., Aury, J.-M., Henrissat, B.,
Lepère, C., Domaizon, I., Humbert, J.-F., Jardillier, L., Hugoni, M., Debroas, D., 2019. Karsenti, E., Jaillon, O., Sieracki, M., de Vargas, C., Wincker, P., 2018. Single-cell
Diversity, spatial distribution and activity of fungi in freshwater ecosystems. PeerJ 7, genomics of multiple uncultured stramenopiles reveals underestimated functional
e6247. https://doi.org/10.7717/peerj.6247. diversity across oceans. Nat. Commun. 9 (1) https://doi.org/10.1038/s41467-017-
Lima-Mendez, G., Faust, K., Henry, N., Decelle, J., Colin, S., Carcillo, F., Chaffron, S., 02235-3.
Ignacio-Espinosa, J.C., Roux, S., Vincent, F., 2015. Determinants of community Seppey, C.V.W., Singer, D., Dumack, K., Fournier, B., Belbahri, L., Mitchell, E.A.D.,
structure in the global plankton interactome. Science 348, 1262073. https://doi.org/ Lara, E., 2017. Distribution patterns of soil microbial eukaryotes suggests
10.1126/science.1262073. widespread algivory by phagotrophic protists as an alternative pathway for nutrient
Logares, R., Bråte, J., Bertilsson, S., Clasen, J.L., Shalchian-Tabrizi, K., Rengefors, K., cycling. Soil Biol. Biochem. 112, 68–76.
2009. Infrequent marine–freshwater transitions in the microbial world. Trends Sime-Ngando, T., Lafferty, K.D., Biron, D.G., 2015. Roles and mechanisms of parasitism
Microbiol. 17 (9), 414–422. in aquatic microbial communities. Front. Microbiol. 6, 446. https://doi.org/
Lynn, D., 2008. The Ciliated Protozoa: Characterization, CLassification, and Guide to the 10.3389/fmicb.2015.00446.
Literature. Springer, Netherlands. Singer, D., Duckert, C., Heděnec, P., Lara, E., Hiltbrunner, E., Mitchell, E.A.D., 2020.
Magoc, T., Salzberg, S.L., 2011. FLASH: fast length adjustment of short reads to improve High-throughput sequencing of litter and moss eDNA reveals a positive correlation
genome assemblies. Bioinformatics 27 (21), 2957–2963. between the diversity of Apicomplexa and their invertebrate hosts across alpine
Mahé, F., de Vargas, C., Bass, D., Czech, L., Stamatakis, A., Lara, E., Singer, D., Mayor, J., habitats. Soil Biol. Biochem. 147, 107837. https://doi.org/10.1016/j.
Bunge, J., Sernaker, S., Siemensmeyer, T., Trautmann, I., Romac, S., Berney, C., soilbio.2020.107837.
Kozlov, A., Mitchell, E.A.D., Seppey, C.V.W., Egge, E., Lentendu, G., Wirth, R., Singer, D., Lara, E., Steciow, M.M., Seppey, C.V.W., Paredes, Noelia, Pillonel, A.,
Trueba, G., Dunthorn, M., 2017. Parasites dominate hyperdiverse soil protist Oszako, T., Belbahri, L., 2016. High-throughput sequencing reveals diverse
communities in Neotropical rainforests. Nat. Ecol. Evol. 1 (4) https://doi.org/ oomycete communities in oligotrophic peat bog micro-habitat. Fungal Ecol. 23,
10.1038/s41559-017-0091. 42–47.
Mahé, F., Rognes, T., Quince, C., de Vargas, C., Dunthorn, M., 2015. Swarm v2: highly- Stoeck, T., Behnke, A., Christen, R., Amaral-Zettler, L., Rodriguez-Mora, M.J.,
scalable and high-resolution amplicon clustering. PeerJ 3, e1420. https://doi.org/ Chistoserdov, A., Orsi, W., Edgcomb, V.P., 2009. Massively parallel tag sequencing
10.7717/peerj.1420. reveals the complexity of anaerobic marine protistan communities. BMC Biol. 7 (1),
Mangot, J.-F., Domaizon, I., Taib, N., Marouni, N., Duffaud, E., Bronner, G., Debroas, D., 72. https://doi.org/10.1186/1741-7007-7-72.
2013. Short-term dynamics of diversity patterns: evidence of continual reassembly Tecon, R., Or, D., 2017. Cooperation in carbon source degradation shapes spatial self-
within lacustrine small eukaryotes: Short-term dynamics of small eukaryotes. organization of microbial consortia on hydrated surfaces. Sci. Rep. 7 (1) https://doi.
Environ. Microbiol. 15 (6), 1745–1758. org/10.1038/srep43726.
Mann, D.G., Vanormelingen, P., 2013. An inordinate fondness? The number, Tedersoo, L., Bahram, M., Põlme, S., Kõljalg, U., Yorou, N.S., Wijesundera, R., Ruiz, L.V.,
distributions, and origins of diatom species. J. Eukaryot. Microbiol. 60 (4), 414–420. Vasco-Palacios, A.M., Thu, P.Q., Suija, A., Smith, M.E., Sharp, C., Saluveer, E.,
Massana, R., Castresana, J., Balagué, V., Guillou, L., Romari, K., Groisillier, A., Saitta, A., Rosas, M., Riit, T., Ratkowsky, D., Pritsch, K., Põldmaa, K.,
Valentin, K., Pedrós-Alió, C., 2004. Phylogenetic and ecological analysis of novel Piepenbring, M., Phosri, C., Peterson, M., Parts, K., Pärtel, K., Otsing, E., Nouhra, E.,
marine stramenopiles. Appl. Environ. Microbiol. 70, 3528. https://doi.org/10.1128/ Njouonkou, A.L., Nilsson, R.H., Morgado, L.N., Mayor, J., May, T.W., Majuakim, L.,
AEM.70.6.3528-3534.2004. Lodge, D.J., Lee, S.S., Larsson, K.-H., Kohout, P., Hosaka, K., Hiiesalu, I., Henkel, T.
Misner, I., Blouin, N., Leonard, G., Richards, T.A., Lane, C.E., 2014. The secreted proteins W., Harend, H., Guo, L.-d., Greslebin, A., Grelet, G., Geml, J., Gates, G., Dunstan, W.,
of Achlya hypogyna and Thraustotheca clavata identify the ancestral oomycete Dunk, C., Drenkhan, R., Dearnaley, J., De Kesel, A., Dang, T., Chen, X., Buegger, F.,
secretome and reveal gene acquisitions by horizontal gene transfer. Genome Biol. Brearley, F.Q., Bonito, G., Anslan, S., Abell, S., Abarenkov, K., 2014. Global diversity
Evol. 7, 120–135. https://doi.org/10.1093/gbe/evu276. and geography of soil fungi. Science 346 (6213), 1256688. https://doi.org/10.1126/
Mora, C., Tittensor, D.P., Adl, S., Simpson, A.G.B., Worm, B., 2011. How many species science:1256688.
are there on Earth and in the ocean? PLoS Biol. 9, e1001127. https://doi.org/ Tittensor, D.P., Mora, C., Jetz, W., Lotze, H.K., Ricard, D., Berghe, E.V., Worm, B., 2010.
10.1371/journal.pbio.1001127. Global patterns and predictors of marine biodiversity across taxa. Nature 466
Oksanen, J., Blanchet, F.G., Kindt, R., Legendre, P., Minchin, P.R., O’hara, R.B., Simpson, (7310), 1098–1101.
GL.., Solymos, P., Stevens, M.H.H., Wagner, H., 2018. Package ‘vegan’community Velasco-González, I., Sanchez-Jimenez, A., Singer, D., Murciano, A., Díez-Hermano, S.,
ecology package. See https://cran.r-project.org/web/packages/vegan/index.html. Lara, E., Martín-Cereceda, M., 2020. Rain-fed granite rock basins accumulate a high
Pohlert, T., 2014. The pairwise multiple comparison of mean ranks package (PMCMR). R diversity of dormant microbial eukaryotes. Microb. Ecol. 79 (4), 882–897.
package 27. Wall, D., Adams, G., Mooney, H., Boxshall, G., Dobson, A., Nakashizuka, T., 2001. An
Rasconi, S., Niquil, N., Sime-Ngando, T., 2012. Phytoplankton chytridiomycosis: international biodiversity observation year. Trends Ecol. Evol. 16 (1), 52–54.
community structure and infectivity of fungal parasites in aquatic ecosystems. Wallace, A.R., 1876. The Geographical Distribution of Animals. Macmillan, London.
Environ. Microbiol. 14, 2151–2170. https://doi.org/10.1111/j.1462- Wilkinson, D.M., Koumoutsaris, S., Mitchell, E.A.D., Bey, I., 2011. Modelling the effect of
2920.2011.02690.x. size on the aerial dispersal of microorganisms. J. Biogeogr. 39, 89–97. https://doi.
Reche, I., Pulido-Villena, E., Morales-Baquero, R., Casamayor, E.O., 2005. Does org/10.1111/j.1365-2699.2011.02569.x.
ecosystem size determine aquatic bacterial richness? Ecology 86 (7), 1715–1722.
https://doi.org/10.1890/04-1587.
8You can also read