Testing of photogrammetry for differentiation of soil organic carbon and biochar in sandy substrates
←
→
Page content transcription
If your browser does not render page correctly, please read the page content below
supported by
Geogr. Helv., 74, 81–91, 2019
https://doi.org/10.5194/gh-74-81-2019
© Author(s) 2019. This work is distributed under
the Creative Commons Attribution 4.0 License.

             Testing of photogrammetry for differentiation of soil
               organic carbon and biochar in sandy substrates
                  Wolfgang Fister, Nina Goldman, Marius Mayer, Manuel Suter, and Nikolaus J. Kuhn
               Physical Geography and Environmental Change Group, Department of Environmental Sciences,
                              University of Basel, Klingelbergstr. 27, 4056 Basel, Switzerland
                                Correspondence: Wolfgang Fister (wolfgang.fister@unibas.ch)

              Received: 24 June 2018 – Revised: 19 January 2019 – Accepted: 8 February 2019 – Published: 15 March 2019

       Abstract. Landforms in different environmental ecosystems are formed through selective erosion and trans-
       port mechanisms by wind and water. To understand their development, biochemical composition, and effect on
       neighbouring ecosystems, it is essential to better understand the forming processes and to be able to monitor
       the behaviour and transport of particles through the landscape. Conventional methods to track and differentiate
       between organic and inorganic particles usually involve extensive sampling campaigns that disturb the processes
       themselves. Therefore, this study aimed to prove that the method of photogrammetry, which is non-contact and
       non-invasive, is able to quantify erosion rates and can also be used to differentiate between organic and inorganic
       material. To prove this concept, a bottom-up experimental rainfall simulation set-up was conducted with sieved
       sand substrates of very narrow particle size distribution and biochar under highly controlled conditions. By using
       two-dimensional index and reflectance maps of the surface computed with the software Pix4D, the erosion of
       biochar was estimated and compared to the actual erosion amount that was transported along the plot. The results
       show that photogrammetry has the potential to distinguish between a sandy substrate and biochar. An approxi-
       mate decrease of 5 % in biochar on the plot surfaces was detected in three out of four rainfall experiments within
       the first 30 s. After these 30 s, the quality of detection was significantly reduced due to shadow effects, which
       were falsely classified as biochar as well. For future investigations on this topic, it will be necessary to improve
       the lighting of the plot and the post-processing of the images to reduce the error caused by shadows. Additional
       approaches that should be taken into account for further test experiments are the full exclusion of external light,
       which means working in the dark, and the use of hyperspectral cameras to detect different carbon types.

1   Introduction                                                    the landscape. Moving particles not only consist of inorganic
                                                                    components, but also of organic material such as litter or
The selective transport of soil particles is an important pro-      charcoal (black carbon), which becomes more and more im-
cess for the development of many different landforms and            portant against the backdrop of global climate change and
their biogeochemistry in varying ecosystems that are affected       global biochemical cycles (Cornelissen et al., 2005; Forbes
by wind or water (Kirkels et al., 2014; Shi et al., 2012). These    et al., 2006; Lehmann et al., 2008). However, due to their dif-
landforms may, for example, range from lowland agricultural         ferent properties, e.g. density and shape, the basic transport
fields (Estrany et al., 2010), over drylands (Sterk et al., 2001)   processes of organic matter are currently not well understood
and coastal areas (Williams et al., 2018), up to braided river      (Hu and Kuhn, 2014). To enable well-based quantitative as-
systems and bare glacier forefields in high-mountain or arc-        certainment and modelling on sediment, soil organic carbon
tic environments (Bernasconi and BigLink Project Members,           or black carbon transport rates, further monitoring and ex-
2008). In order to understand the development of these land-        periments are needed (Foereid et al., 2011). This research
forms it is essential to better understand the forming pro-         requires methods that facilitate the differentiation between
cesses (Schwanghart et al., 2013) and to be able to track           sediment and varying types or fractions of organic carbon.
and monitor the behaviour and transport of particles through

Published by Copernicus Publications for the Geographisch-Ethnographische Gesellschaft Zürich & Association Suisse de Géographie.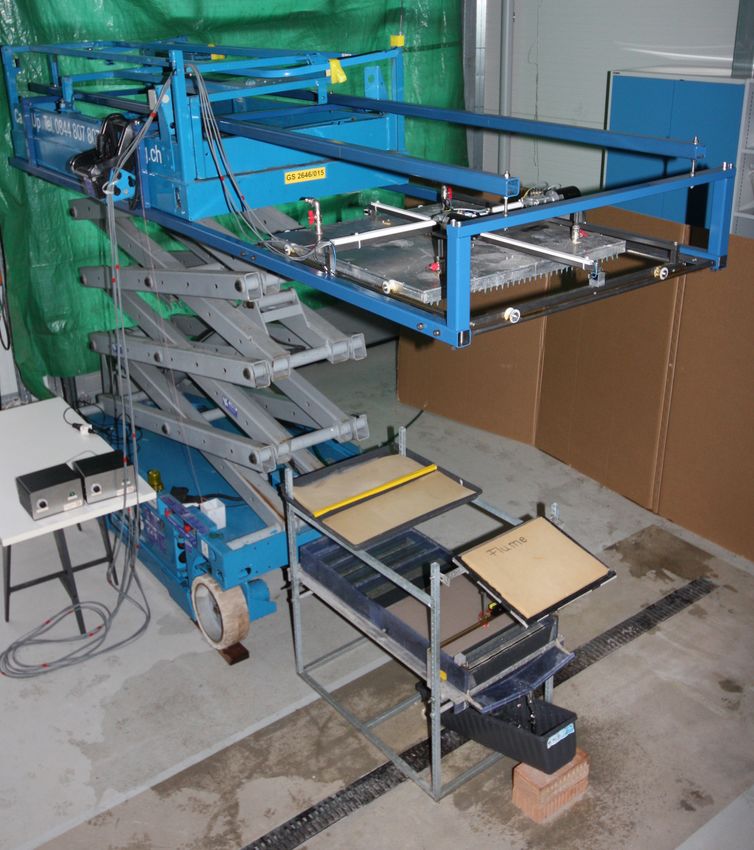
82                                                    W. Fister et al.: Differentiation of SOC and BC through photogrammetry

   The method most often used to detect and quantify soil or-      because of their controlled conditions and repeatability of the
ganic carbon is combusting the sediment. This can be done          experiments (Kuhn et al., 2014). However, a fundamental re-
by either quantifying the net weight loss before and after         quirement for this kind of research is the availability of a
combustion, e.g. in a muffle furnace (e.g. Cargua Catagña et       method that is able to differentiate between BC and regular
al., 2017), or by back-calculating the inorganic and organic       soil organic carbon (SOC) (Fister et al., 2013a; Rumpel et
carbon content by measuring CO2 emissions at different tem-        al., 2006).
perature grades in combustion analysers (e.g. Hoffmann et             Preliminary tests in our laboratory showed that none of the
al., 2014; Quijano et al., 2016). Both of these methods have       combustion methods mentioned above were able to satisfac-
been successfully used for many years. However, their ma-          torily differentiate between the two carbon types. The applied
jor drawback is that the sample itself is destroyed during the     BC contents (from the company Swiss Biochar) in the exper-
analysis and no further analyses are possible. In some situ-       iments were too low (0.1–2 wt. % BC) to show distinctive dif-
ations this issue can be overcome by taking more represen-         ferences in the measurements. The above-mentioned mixed-
tative subsamples, but if the space for taking samples or the      methods approach by Zimmermann et al. (2007) would most
amount of sediment is limited, this might not be a valid op-       probably be able to detect these differences. However, the
tion. Sample extraction from a location is always an invasive      method is laborious and time consuming, which makes it
process, which might be problematic for further experimen-         less useful when dealing with large sample numbers. These
tal investigations. This means that the surface structure (e.g.    difficulties call for the development of new methods, which
crust) of an eroding site is disturbed, or in the worst case de-   ideally would fulfil all the necessary requirements, like non-
stroyed, and the ongoing processes are altered and thus com-       contact, non-invasive preservation of the sediment sample,
promised. Often it is not possible to take samples from the        and differentiation between soil organic carbon, biochar, and
soil surface during running experiments and the valuable de-       soil substrates at low concentrations. Therefore, the aim of
velopment of the processes and their effects on the soil over      this initial pilot study, carried out in the experimental rainfall
time cannot be monitored. Another current approach deals           laboratory at the University of Basel, was to evaluate whether
with the method of thermogravimetry. It determines material        the method of photogrammetry could be used to quantify and
weight loss as a function of temperature in a controlled en-       differentiate between erosion of biochar and a sandy sub-
vironment (Leifeld, 2007). By measuring the weight loss at         strate.
certain combustion temperatures, different types of soil or-
ganic matter can be distinguished. Zimmermann et al. (2007)        2   Materials and methods
use a mixed-methods approach, which combines both physi-
cal and chemical fractionation methods and is considered the       A bottom-up experimental rainfall simulation set-up was
“best practice” approach (Stockmann et al., 2013) for frac-        chosen to conceptually verify whether photogrammetry
tioning soil organic carbon. This fractionation becomes very       could be used for this purpose. The complexity of the pro-
important when looking at carbon sequestration and varying         cesses was reduced by using sieved sand substrates of nar-
retention times of carbon in the soil, especially as carbon dif-   row particle size distribution under highly controlled, simu-
fers in stability and reactivity, which might influence its be-    lated rainfall and surface flow conditions in the laboratory.
haviour in soil erosion and transport processes.                   Using more complex soil substrates and field experiments
   A substance that has recently been looked at more closely       was avoided, because the high variability of the soils and the
with regards to the mentioned research questions is biochar        lack of control would have made it very difficult to test the
(BC). BC is a carbonaceous material which is produced              basic concept. This decision was supported by some pretests
through the heating of biomass with little or no presence of       in our laboratory with a Leica DMS 1000 microscope un-
air (low oxygen (O2 )-supply) to temperatures of 300–700 ◦ C       der ideal lighting conditions with different mixtures of quartz
(Boateng et al., 2015). BC is chemically and environmentally       sand, soil, and biochar. The results (Table 1) indicate that
highly stable, because of its polyaromatic structure (Simpson      the detection quality of biochar decreases more rapidly with
and Hatcher, 2004) and could perhaps be used to reduce the         more heterogenic and finer particles. Coarse BC can be reg-
CO2 problem by subsurface storage of C (Lehmann, 2007;             istered accurately with the semi-automated (manual thresh-
Preston and Schmidt, 2006; Seifritz, 1993; Sohi et al., 2010).     old definition) and automated (computerized threshold defi-
In order to act as a soil amendment and C-storage option,          nition) detection algorithms using the software ImageJ ver-
BC needs to stay on the field and should not be eroded and         sion 1.8.0. The observed error to the manual reference mea-
transported to neighbouring trenches or water courses (Fister      surement, using the Leica Application Suite version 4.4, was
et al., 2013a). Rumpel et al. (2015) showed that BC erosion        3.8 % for semi-automatic and 7.8 % for the automated detec-
has great influence on the C budget of BC-amended soils on         tion. The semi-automated detection also worked for quartz
one hand and on depositional sediments or soils on the other       sand with mixed BC, but produced errors up to 39 % for soil
hand.                                                              mixtures. The automated threshold definition proved unreli-
   Rainfall simulation experiments or field measurements are       able for mixed BC and both soil mixtures.
a good option for determining the reduction in BC efficacy,

Geogr. Helv., 74, 81–91, 2019                                                                   www.geogr-helv.net/74/81/2019/
W. Fister et al.: Differentiation of SOC and BC through photogrammetry                                                                                           83

Table 1. Results of photogrammetric pretests that differentiate between quartz sand (D50 350 µm), soil (D50 65 µm), and coarse (range from
500 to 1500 µm) as well as mixed (range from 0 to 1500 µm) biochar under optimal lighting conditions using a Leica DMS 1000 microscope.

  Method                            Manual1 (as reference)                       Semi-automated2                                     Automated2
                                               Coverage BC        Coverage BC              Deviation to      Error   Coverage BC    Deviation to reference   Error
  Substrate mixture                                area (%)           area (%)       reference area (%)       (%)        area (%)                 area (%)    (%)
  Quartz sand and coarse BC                              15.9               16.5                       0.6    3.8            17.1                     1.2      7.8
  Quartz sand and mixed BC                               12.0               12.6                       0.6    4.7            15.6                     3.6     29.5
  Soil and coarse BC                                     13.9               18.7                       4.8   34.4            28.9                    14.9    107.0
  Soil and mixed BC                                      13.1               18.1                       5.0   38.4            27.7                    14.6    112.0

1 Using Leica Application Suite software version 4.4. 2 Using ImageJ software version 1.8.0.

2.1    Photogrammetry

Using photogrammetry is nothing new to soil erosion re-
search, but it usually concentrates on larger features such as
gullies, rills, and badland erosion, dealing with larger topo-
graphical changes. Hänsel et al. (2016) and Prosdocimi et
al. (2017), however, used this method on small-scale flume
experiments and created digital elevation models to try to
quantify soil erosion rates. In general, results from pho-
togrammetric methods still seem to be quite variable and
therefore lack a certain reliability. One important reason for
this variability is that particles are not only transported on the
soil surface, but they can also be buried and remobilized, or
they can even be trapped for the whole erosion event. In addi-
tion, digital elevation models only provide information on the
total erosion amount by changing the topography, but do not
facilitate the differentiation between different eroded mate-
rial, for example biochar or soil organic carbon and the sub-
strate. Therefore, this study takes a slightly different multi-
temporal approach by using reflectance maps. By using re-
flectance maps, it is expected to be able to differentiate be-
tween the different types of particles. The use of photogram-
metry also solves the above-mentioned issues, because it is                                    Figure 1. Set-up of GoPro Hero4 Silver camera with annular ori-
non-invasive, which means that it could theoretically be used                                  fice.
to monitor erosion processes and thus landform development
over longer periods of time without disrupting ongoing pro-
cesses and without the need for personnel to take samples on                                   fice was mounted directly underneath the camera (Fig. 1). It
site.                                                                                          was assumed that these methods would reduce shadows on
   To create an adequate representation of the flume sur-                                      the plot to enhance picture quality.
face in this experiment, nine photos were taken on a grid                                         The pictures were loaded into the photogrammetry soft-
of three by three. A rainfall experiment lasted for 240 s and                                  ware Pix4Dmapper. The images were not georeferenced, as
the images were taken before the experiment started and                                        the flume dimensions are too small to accurately use GPS
at the intervals 30, 60, 90, 120, 150, 180, and 240 s into                                     points. GPS points are only accurate to 0.02 m, which was
the experiment. The camera height was set to 26 cm from                                        not accurate enough for the small surface area of 0.2 m2 .
lens to substrate surface. This was the shortest distance that                                 However, it is advisable to georeference plots in large-scale
yielded sharp images. The photos were taken with a GoPro                                       experiments to provide scale and orientation as well as re-
Hero4 Silver camera, which was set to medium field of view                                     duce error accumulation with ground control points (Pix4D,
(127◦ ) and 7 megapixels. Like in the study by Prosdocimi                                      2017).
et al. (2017) inhomogeneous lighting was a great challenge.                                       After uploading all the photos into the Pix4D programme,
To counteract this problem, two adjustments were made to                                       it generates a reflectance map (Fig. 2), which is a 2-D map
the set-up. Firstly, a tarpaulin was set up behind the erosion                                 that describes the reflectance of the area to be mapped. Here,
flume to reduce direct lighting and secondly, an annular ori-                                  compared to the orthomosaic, no colour balancing is applied

www.geogr-helv.net/74/81/2019/                                                                                                 Geogr. Helv., 74, 81–91, 2019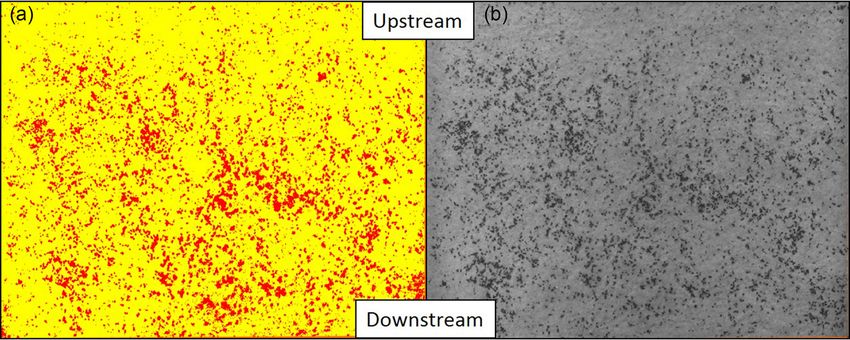
84 W. Fister et al.: Differentiation of SOC and BC through photogrammetry
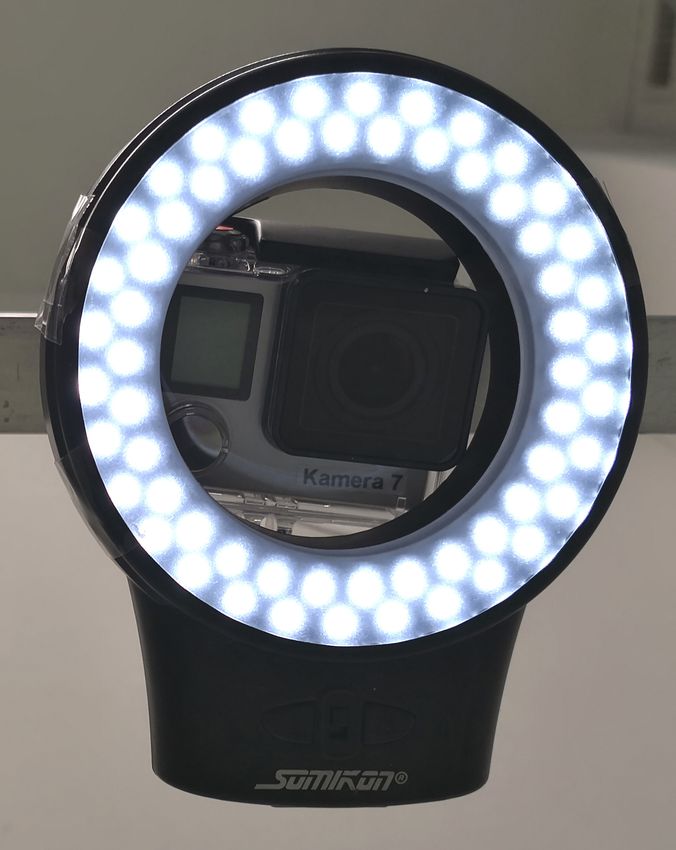
Figure 2. Example of an index map (a) and a reflectance map (b). The index map classifies 14.3 % of the marked area as biochar (red), and
85.7 % of the area as sand (yellow).
as the value of each pixel faithfully represents the reflectance BC was sieved to the fraction of 1–2 mm and showed a D50 -
from the object. The aim of the reflectance map is to as- value of 1.22 mm.
sess a particular feature based on the pixel value in the im- Quartz sand was used as a substrate to receive the best pos-
ages, which is influenced by some factors such as aperture sible contrast between the particles under investigation in this
or ISO. The Pix4Dmapper therefore uses a model to account pilot study. Apart from this more practical reason of having a
for these factors and to produce an accurate reflectance map. good contrast, sandy soils would also be the ones that could
This provides the basis for an index map, wherein the value benefit most from biochar application. Therefore, the choice
of every pixel on the map is obtained from the associated of very narrowly sized sand substrates was more represen-
reflectance map. The number of classes in the index map tative than using silt or clay sized substrates for a start. The
needed to be adjusted (from default of 5 to 2), as the ero- sand was fire dried and naturally rounded. The SiO2 content
sion substrate contained only two different materials (BC and was 97 % and it was sieved to a D50 of 0.673 mm. The mean
sand), which have different reflectance values (Pix4D, 2017). values of five replicate measurements showed a bulk density
The method of classification also needs to be changed to a of 1.51 g cm−3 .
natural-breaks optimization method, also known as Jenks,
which clusters the data to minimize the variance within a 2.3 Rainfall experiments
class and maximizing the differences between classes (Jenks,
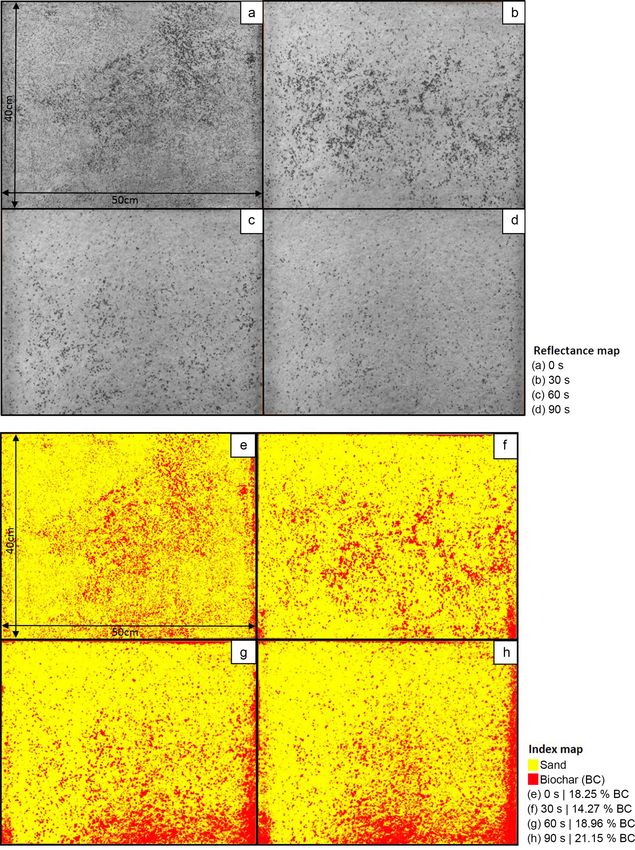
1967). In addition, the minimum and maximum of the in- A high-precision drip-type rainfall simulator (Fig. 3) was
dex range were adjusted to ignore values outside this range. used on a microscale flume with controllable surface flow
Adapting this range to a new minimum of 30 and a new max- (Fig. 4) to be able to precisely control and monitor the thin
imum of 135 yielded a more accurate result regarding the surface flows and rainfall characteristics. For the experi-
surface coverage of BC and sand. This index map gives us ments, deionized water was used to minimize clogging the
a percentage value, which shows how much of the flume’s needles with lime. Since the test material only consisted of
surface is BC and how much is sand based on the different BC and sand, the high sodium content did not matter with
reflective values of BC and sand. regards to the dispersion of particles. The fall height of the
raindrops for all experiments was 6 m. According to van
Boxel (1998) this would mean that the raindrops, with an
2.2 Characterization of test substrate
average drop diameter of 2.6 mm, would reach 90 % to 95 %
of their terminal velocity. The soil substrate was positioned
The biochar used in this study was from Swiss Biochar in the 0.4 m long test section near the end of the flume. The
GmbH and is made from wood and protein-rich stone fruits. configuration was adapted from a design originally used by
The BC was pyrolysed at 450–600 ◦ C and had a bulk density Moss and Green (1983) and further adapted and refined by
of 0.281 g cm−3 . The density is comparable to other mea- Kinnell (1988). The development of this simulator did not try
sured BC bulk density values, which can range from 0.09 to fully imitate natural rainfall, but aims to produce the high-
up to 0.5 g cm−3 (Chia et al., 2015). The particle sizes were est possible reproducibility and precise drop formation and
measured using a freefall dry feeder module (Scirocco 2000) is, therefore, well suited for process studies. Since the focus
of the Malvern Mastersizer 2000 optical bench. Particles of this paper is on the analyses of photogrammetry, please
above 2 mm cannot be measured with the wet module (Hy- refer to Greenwood et al. (2013) and Fister et al. (2013b) for
dro 2000 G) since they clog up the measuring device. The further details on the rainfall simulator.
Geogr. Helv., 74, 81–91, 2019 www.geogr-helv.net/74/81/2019/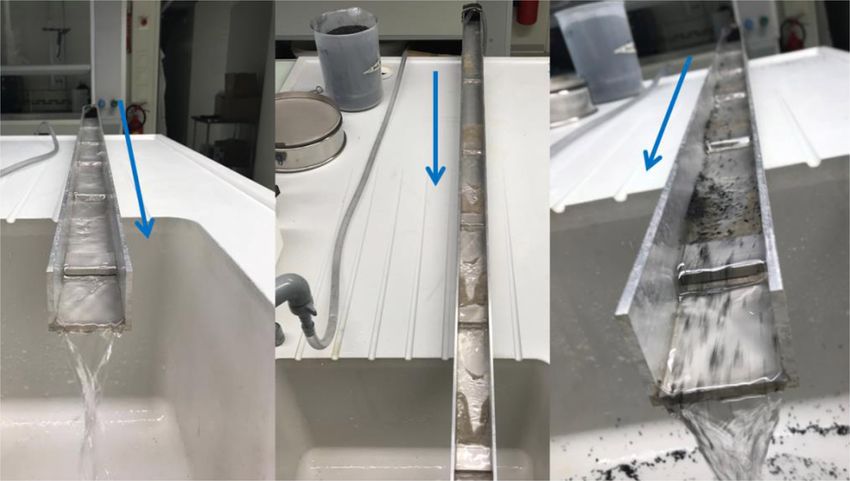
W. Fister et al.: Differentiation of SOC and BC through photogrammetry                                                                   85

                                                                         Figure 5. Sluice set-up, which separates BC from sand where the
                                                                         sand is trapped behind the step and the BC is suspended in the flow
                                                                         and carried downstream. The BC is then caught in the sieve at the
                                                                         end of the sluice and placed in a drying chamber at 40 ◦ C.

                                                                         was not collected due to its very limited amount in relation
                                                                         to the flow-driven discharge.
                                                                            In order to quantify the amount of eroded biochar in the
                                                                         sediment, it needed to be separated from the sand. The first
                                                                         method used was dry sieving. This was only possible for the
                                                                         fine-sand mixtures, because the large sand particles would
Figure 3. Rainfall simulator mounted on a hydraulic lift. The ero-       have been retained on the 630 µm sieve together with the 1–
sion flume is placed underneath.
                                                                         2 mm BC particles. The larger particles were separated using
                                                                         an inclined slope with flowing water. Based on the model of
                                                                         simple sluice boxes for washing gold, a 170 cm by 5 cm by
                                                                         4 cm sluice made from a metal U-profile was used. Five re-
                                                                         movable metal block inlets with heights of 5 mm were placed
                                                                         inside the profile at equal intervals. One end of the U-profile
                                                                         was elevated to create a gentle slope and a hose, connected
                                                                         to a tap, was attached to the upstream end. Then the material
                                                                         was added and an instant discharge of the lighter BC par-
                                                                         ticles was noticeable, while the heavier sand deposited and
                                                                         accumulated behind the metal barriers (Fig. 5). This method
                                                                         turned out to separate the materials most thoroughly without
                                                                         any loss of material.
Figure 4. Schematic model of the erosion flume. Blue arrows indi-
cates the direction of the water flow. (1) Water reservoir, (2) rough-
ness plate, (3) erosion plot, (4) sediment collection chamber, and       3     Results and discussion
(5) weir. The digital modelling is true to scale and was done with
SketchUp Pro 2018.                                                       3.1    Quantification of BC by photogrammetry

                                                                         In order to assess the accuracy of the photogrammetry
                                                                         method, the BC coverage from Pix4D was compared to the
2.4   Sampling of eroded material and separation of                      actual BC erosion amounts. We are aware that they cannot
      biochar                                                            be identical as the photogrammetry method only captures the
                                                                         surface area, whereas the BC collected at the flume outlet is
All of the eroded sand particles and most of the BC were                 also derived from the subsurface area, as mentioned in the
caught in the sediment collection chamber directly behind                introduction chapter. Nevertheless, the comparison gives a
the erosion flume. In order to avoid loss of biochar through             good indication and allows the quality of the photogramme-
the outlet, a fine sieve was placed underneath the discharge             try method to be assessed. Initial tests showed that, within the
water. After each experimental run, the material from the sed-           240 s, most of the depletion occurs within the top 2 mm from
iment chamber was siphoned out into small containers for                 the surface and only very little in the depth between 2 and
separation of particles and weighting. Material loss by splash           4 mm (Fig. 6). Wang et al. (2013) observed a depletion of the

www.geogr-helv.net/74/81/2019/                                                                           Geogr. Helv., 74, 81–91, 2019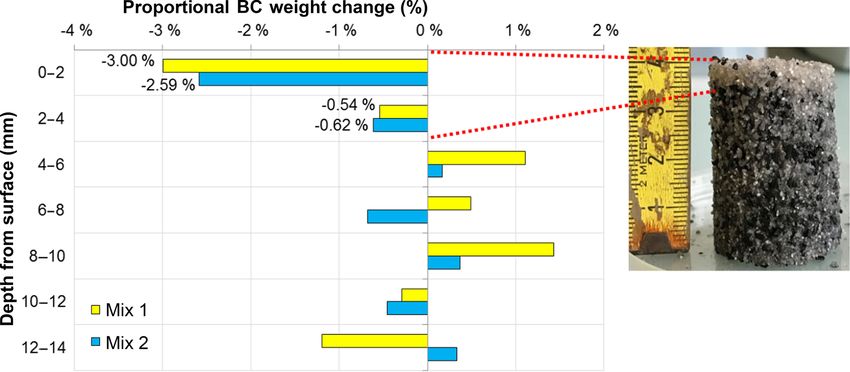
86 W. Fister et al.: Differentiation of SOC and BC through photogrammetry
Figure 6. Average values of five profile samples that were taken from the erosion plot after 240 s of rainfall at 100 mm h−1 . Two different
BC concentrations (mix 1 and 2) were tested. These profile samples were sliced into 2 mm layers. The BC and sand in these layers were then
separated by combustion in a muffle furnace. Thereby we could determine the vertical depletion of our erosion flume.
other rainfall experiments with the same substrate composi-
tion (Fig. 8) and is in agreement with the literature (e.g. Hu
et al., 2013). The actual depletion of the surface coverage in
BC was calculated from the amount of erosion by the sur-
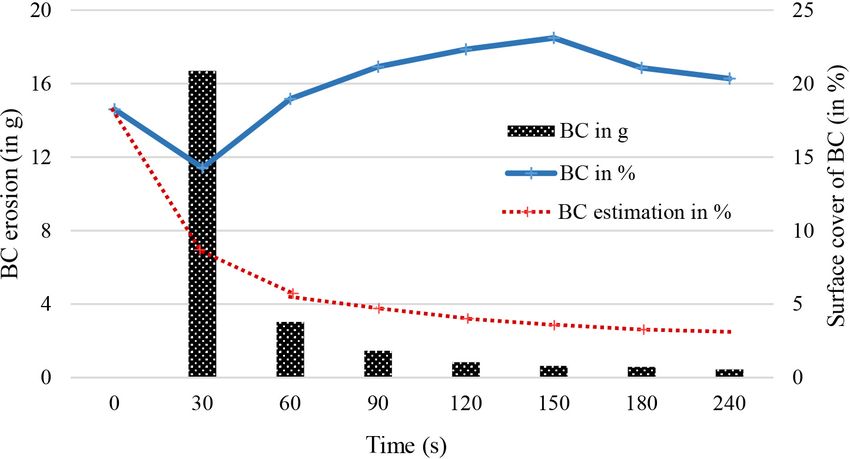
face area and is indicated by the red line. The surface cover-
age of BC, which was calculated using the index map (blue
line), also shows an initial decrease from 18.25 % at 0 s to
14.27 % at 30 s. After the 30 s measurement interval, values
increase to a maximum of 23.11 % at 150 s, which is almost
5 % higher than the BC coverage at the start of the experi-
ment. The lower erosion rate in the first 30 s is most proba-
bly caused by the fact that photogrammetry only captures the
Figure 7. Exemplary illustration of actual surface coverage as cal- BC depletion on the surface and not the subsurface depletion
culated by Pix4D (blue line) and estimated surface coverage of in the top 2 mm or even 4 mm from the surface (Fig. 6). The
BC (dotted red line) with measured BC discharge rates (in grams) observed increase in BC coverage of about 5 % cannot be
across the time series.
explained based on the erosion process itself.
Figure 8 shows four repetitions of the same rainfall experi-
ment, i.e. with the same BC and sand particle size, highlight-
top 15 mm of the surface after 4 h of rainfall. This difference ing that this behaviour is not a single artefact. Most of the
in depletion depth highlights the importance of knowing the runs show an initial decrease in surface coverage of BC (blue
rate of depletion for a given experimental set-up. Knowing line) for the first interval (average of 5.44 %), but an increase
the rate of depletion in the subsurface allows for a more ac- afterwards. Run 48 (bottom left) is an exception to this pat-
curate calculation of how much BC has been eroded, based tern and shows a severe increase of 9.88 % in BC coverage
on the photogrammetry method. in the first interval before a similarly strong decrease occurs
In Fig. 7 the photogrammetry results are compared to the in the second measurement interval. This large increase in
actual BC erosion for one exemplary rainfall experiment. It BC coverage is most likely a cause of increased exposure
shows the percentage of BC coverage calculated by Pix4D of subsurface BC due to high erosion of sand particles. The
(blue line) versus the estimated BC coverage (red line). The reflectance map shows clear evidence of higher BC surface
black columns indicate the amount of BC erosion in grams. coverage after 30 s. An additional indication for this theory
This shows that, after an initial flush containing more than is the relatively low BC erosion amount for run 48 (12.37 g).
16 g of BC, the detachment of BC decreases are less pro- For the other runs the initial flush of BC after 30 s resulted in
nounced over time. This erosion pattern over time is to be higher discharge amounts of 16.69 g for run 46, 12.49 g for
expected on a boundary-limited flume, since BC cannot be run 47, and 22.10 g for run 49.
replenished from upstream areas, as would be the case on
field sites. This erosion pattern can also be observed in the
Geogr. Helv., 74, 81–91, 2019 www.geogr-helv.net/74/81/2019/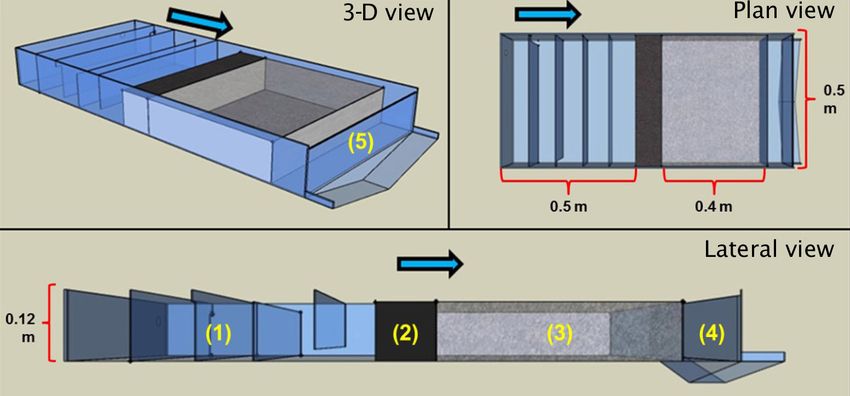
W. Fister et al.: Differentiation of SOC and BC through photogrammetry                                                         87

Figure 8. Results from the photogrammetry analysis which show the amount of BC on the surface (in %) combined with BC erosion (in
grams) for one set of runs (R46 a, R47 b, R48 c, R49 d).

   In order to see if an actual BC increase on the surface oc-     metal frames with hook-and-loop tape, for example, makes
curred during the experiment or if some other reason caused        it easy to install and uninstall the camera for usage. The ex-
the increase in BC coverage on the surface, we compared            ternal control of the camera via an application ensures that
the reflectance and the index maps for the run from Fig. 7         the camera is not moved during the experiment and ongoing
with each other. The comparison of the flume surface before        processes are not disturbed. The live preview of the images
the rainfall and after the first three intervals of 30, 60, and    being taken acts as an extra control and ensures that the pic-
90 s is shown in Fig. 9. The reflectance maps clearly show         tures depict the flume’s test section.
that the BC coverage (black dots) decreases with increasing           The handling of the image analysis software Pix4D can
rainfall duration. In contrast, the BC coverage in the index       be either learned through tutorials or with the support web-
maps (red dots) increases over time from 18.25 % before the        site. However, it is expensive, especially if multiple licences
rainfall to 21.15 % coverage after 90 s. This confirms that the    are needed. The processing power and storage capacity re-
Pix4D software overestimates the presence of BC on the sur-        quired from the work station is very high, so that processes
face. Most likely, shadowy sand particles were misclassified       are severely slowed down when used on a regular laptop, es-
as BC particles. This misclassification occurred mostly along      pecially as the identification of key points and subsequent
the flume’s boundaries. Even the additional use of a tarpaulin     merging of the images requires a powerful processor.
to reduce direct light on the plot and the use of the annular         Using the photogrammetry software Pix4D to assess the
orifice (Fig. 1) to light up the flume’s surface did not suffi-    amount of BC loss due to rainfall events showed promise,
ciently reduce the shadow effect near the flume boundaries.        but not the most accurate results. The software was able to
                                                                   reproduce the decrease in BC surface coverage in the first
                                                                   measurement interval and the deviations can be partly ex-
3.2   Usability of photogrammetry for BC and SOC                   plained by the observed processes (see above). However, for
      monitoring                                                   the later intervals with less significant changes in BC sur-
                                                                   face cover, the software seems to overestimate the real BC
The experiences obtained in this pilot laboratory study
                                                                   coverage due to shadow effects, despite the efforts to facili-
show that using photogrammetry to analyse images with re-
                                                                   tate homogenous lighting on the plot surface with a tarpaulin
flectance and index maps is relatively easy and does not re-
                                                                   and an annular orifice. For future research it will be funda-
quire expensive professional equipment. The GoPro cameras
                                                                   mental to reduce the shadows on the plot and to improve the
can be equipped with a water-resistant casing, which is ad-
                                                                   detection of BC particles. Therefore, we suggest creating a
visable when obtaining data in a rain laboratory or outdoors
                                                                   more elaborate lighting set-up that prevents shadows, espe-
to monitor SOC movement. Mounting the GoPro cases on

www.geogr-helv.net/74/81/2019/                                                                   Geogr. Helv., 74, 81–91, 2019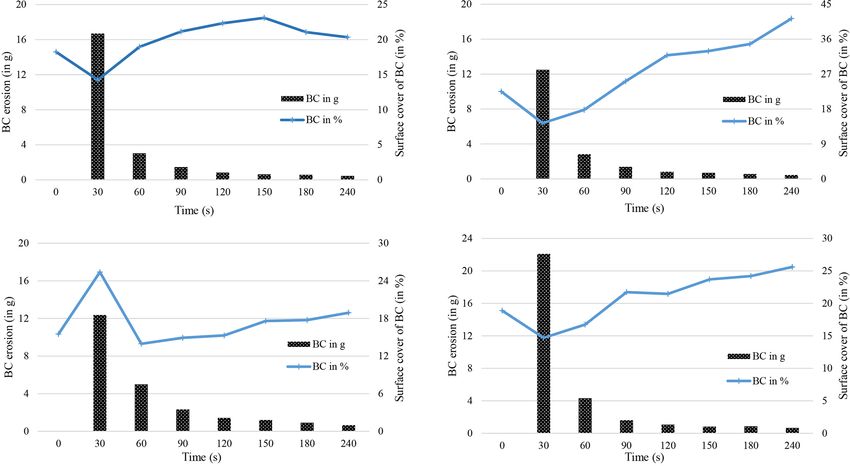
88                                                      W. Fister et al.: Differentiation of SOC and BC through photogrammetry

Figure 9. Reflectance maps (a–d) and index maps (e–h) of the run presented in Fig. 7. Surface coverage of BC is in red and sand is in yellow
across the time series. The legend shows the time and the BC coverage of the index map in %.

cially near the plot boundaries, on one hand, and reduces the           orescent tracers in small-scale plot experiments (Hardy et
sensitivity of the classification tool so it can better distinguish     al., 2017) as well as in large field experiments on soil ero-
between shadowy sand and BC, on the other hand. Instead of              sion (Hardy et al., 2019). Another very promising approach
trying to calibrate and improve Pix4D, an alternative could             comes from the field of soil spectroscopy. Using hyperspec-
be to use a different software, which is more successful in             tral images could be of special interest when using more
this respect. In the long run, there are many other options             complex substrates with soil components and SOC, which
that should be tested to evaluate their potential to increase the       are more difficult to differentiate, because of their lower con-
detection quality of BC. For example, the effect of using op-           trasts. Hobley et al. (2018), for example, used hyperspectral
tical or software filters to reduce the shadows in the captured         images with a variety of machine-learning approaches to pre-
images. Another option could be to conduct experiments in               dict organic carbon distribution in soil cores, and Burud et
the dark, which would enable full control over lighting con-            al. (2016) were able to map biochar qualitatively and quanti-
ditions. Such an approach was successfully tested with flu-             tatively in a soil monolith. With the development of simple,

Geogr. Helv., 74, 81–91, 2019                                                                         www.geogr-helv.net/74/81/2019/
W. Fister et al.: Differentiation of SOC and BC through photogrammetry                                                              89

lightweight, and portable spectro-goniometers (Anderson et         think it would be more advisable to pursue the experiments
al., 2012) it seems very likely that these devices could also be   in the dark, to have full control over lighting conditions. An-
used for soil erosion plot measurements. In order to improve       other promising option for improving the detection quality
the reliability of experiments on photogrammetry and soil          of BC and SOC in soil substrates under laboratory and field
erosion, it will also be necessary to solve the issue of burial    conditions seems to be the use of hyperspectral cameras.
and remobilization of particles during the event. An option
for future small-scale laboratory experiments could be using
the above-mentioned method to take profile samples before          Data availability. Data analysis of biochar contents is based on
and after experiments and to analyse them on their BC con-         image analysis with Pix4D. All results from image analysis and pro-
tents. Assuming that the vertical concentration change is sim-     file depth measurements are presented in the article. The original
ilar over the whole surface, which is only possible on small-      images for our own analysis can be requested from the correspond-
                                                                   ing author.
scale plots with homogenous conditions, a correction factor
for the total BC loss could be estimated.
                                                                   Author contributions. NJK instigated the initial studies on
                                                                   biochar and provided the experimental research facilities. NG and
4   Conclusion                                                     MM performed the rainfall experiments and data analysis under
                                                                   supervision of WF for their individual theses. WF developed the
The aim of this pilot study was to evaluate whether the            specific research question for the article and wrote the article with
method of photogrammetry can be used to quantify and dif-          support from NG, who also produced all figures and performed the
ferentiate between erosion of biochar and a sandy substrate.       Pix4D analysis. MS provided additional data and experiments to
This would be the first step to prove that soil organic car-       back up the results. NJK improved and commented on the experi-
bon can be monitored in the landscape via photogrammetry.          ments and manuscript throughout the process.
The results show that it was possible to quantify BC coverage
based on index maps for the first 30 s interval. Additionally,
the preferential erosion of BC could be observed and quan-         Competing interests. The authors declare that they have no con-
tified during the experiments. However, during further time        flict of interest.
steps in the rainfall experiments, the BC coverages showed
an increase and thus deviated quite significantly from the ex-
                                                                   Acknowledgements. The         authors would like to thank
pected values, which were obtained using the measured BC
                                                                   Jens Leifeld from Agroscope in Zürich for his support with
erosion. The overestimation of BC coverage is most probably        the initial thermogravimetry measurements and Ruth Strunk,
caused because of the inclusion of shadows by the Pix4D al-        Brigitte Kuhn, and Hans-Rudolf Rüegg from the University of
gorithm. The installation of a tarpaulin as protection against     Basel for their technical support in the laboratory and with the
the influence of direct light and the use of an annular orifice    Pix4D image analysis.
did not work satisfactorily. Therefore, it seems to be very
challenging to gain more accurate results with the present         Edited by: Christoph Graf
set-up.                                                            Reviewed by: two anonymous referees
    In conclusion, photogrammetry could become a very im-
portant method in landscape monitoring of soil organic car-
bon, related erosion, and transport processes, especially be-
cause it fulfils all the other important requirements, for in-     References
stance non-contact, non-invasive preservation of the sedi-
ment sample, and differentiation between soil organic carbon       Anderson, K., Croft, H., Milton, E. J., and Kuhn, N. J.: A sim-
at low concentrations. With an appropriate set-up it seems           ple spectro-goniometer for collection of multiple view angel re-
very likely that it could, for example, be possible to monitor       flectance factors, Remote Sens. Lett., 3, 131–140, 2012.
litter movement or composition through longer time periods         Bernasconi, S. M. and BigLink Project Members: Weathering, soil
and from greater distances (metres). To go even further, with        formation and initial ecosystem evolution on a glacier forefield: a
present advancements in image particle tracking, it could also       case study from the Damma Glacier, Switzerland, Mineral. Mag.,
be possible to track individual particles and calculate their        72, 19–22, 2008.
                                                                   Boateng, A. A., Garcia-Perez, M., Masek, O., Brown, R., and del
transport rates and distances travelled. However, this requires
                                                                     Campo, B.: Biochar production technology, in: Biochar for en-
more laboratory and field experiments to test and improve
                                                                     vironmental management. Science, technology and implementa-
the methodology. Advancements in optical and software fil-           tion, edited by: Lehmann, J. and Joseph, S., 2nd Edition, Rout-
ter techniques, as well as calibration of the Pix4D software or      ledge, 63–87, 2015.
the use of alternative programs, need to be evaluated on their     Burud, I., Moni, C., Flo, A., Futsaether, C., and Steffens, M.: Qual-
feasibility. Instead of trying to improve the lighting condi-        itative and quantitative mapping of biochar in a soil profile using
tions on the plot by using curtains or special illumination, we      hyperspectral imaging, Soil Till. Res., 155, 523–531, 2016.

www.geogr-helv.net/74/81/2019/                                                                      Geogr. Helv., 74, 81–91, 2019
90 W. Fister et al.: Differentiation of SOC and BC through photogrammetry
Cargua Catagña, F. E., Rodríguez Llerena, M. V., Damián Carrión, Hu, Y., Fister, W., and Kuhn, N. J.: Temporal variation of SOC en-
D. A., Recalde Moreno, C. G., and Santillán Lima, G. P.: Analyti- richment from interrill erosion over prolonged rainfall simula-
cal methods comparison for soil organic carbon determination in tions, Agriculture, 3, 726–740, 2013.
Andean Forest of Sangay National Park-Ecuador, Acta Agron., Jenks, G. F.: The Data Model Concept in Statistical Mapping, Inter-
66, 408–413, 2017. national Yearbook of Cartography, 7, 186–190, 1967.
Chia, C. H., Downie, A., and Munroe, P.: Characteristics of biochar: Kinnell, P. I. A.: The influence of flow discharge on sediment con-
physical and structural properties, in: Biochar for environmen- centrations in raindrop induced flow transport, Aust. J. Soil Res.,
tal management, Science, technology and implementation, edited 26, 575–582, 1988.
by: Lehmann, J. and Joseph, S., 2nd Edition, Routledge, 89–109, Kirkels, F., Cammeraat, L. H., and Kuhn, N. J.: The fate of soil
2015. organic carbon upon erosion, transport and deposition in agricul-
Cornelissen, G., Gustafsson, A., Bucheli, T., Jonker, M. T. O., Koel- tural landscapes. A review of different concepts, Geomorphol-
mans, A. A., and van Noort, P. C. M.: Extensive Sorption of Or- ogy, 226, 94–105, 2014.
ganic Compounds to Black Carbon, Coal, and Kerogen in Sed- Kuhn, N. J., Greenwood, P., and Fister, W.: Use of Field Exper-
iments and Soils: Mechanisms and Consequences for Distribu- iments in Soil Erosion Research, in: Geomorphological Field-
tion, Bioaccumulation, and Biodegradation, Environ. Sci. Tech- work, Developments in Earth Surface Processes, 18, edited by:
nol., 39, 6881–6895, 2005. Thornbush, M. J, Allen, C. D., and Fitzpatrick, F. A., Elsevier,
Estrany, J., Garcia, C., and Walling, D. E.: An investigation of soil Amsterdam, 175–200, 2014.
erosion and redistribution in a Mediterranean lowland agricul- Lehmann, J.: Bio-energy in the black, Front. Ecol. Environ., 5, 381–
tural catchment using caesium-137, Internat. J. Sed. Res., 25, 1– 387, 2007.
16, 2010. Lehmann, J., Skjemstad, J., Sohi, S., Carter, J., Barson, M., Fal-
Fister, W., Heckrath, G., Greenwood, P., and Kuhn, N. J.: Erodibil- loon, P., Coleman, K., Woodbury, P., and Krull, E.: Australian
ity of biochar from a sandy soil in Denmark. In: United Nations climate-carbon cycle feedback reduced by soil black carbon, Nat.
Convention to Combat Desertification: Extended abstracts of Geosci., 1, 832–835, 2008.
UNCCD 2nd Scientific Conference, UNCCD, 249–253, 2013a. Leifeld, J.: Thermal stability of black carbon characterized by ox-
Fister, W., Rüegg, H., Tresch, S., and Greenwood, P.: Eine Präzi- idative differential scanning calorimetry, Organ. Geochem., 38,
sionsanlage zur experimentellen Untersuchung von Bodenero- 112–127, 2007.
sionsprozessen, Regio Basiliensis, 54, 19–26, 2013b (in Ger- Moss, A. J. and Green, P.: Movement of solids in air and water by
man). raindrop impact. Effects of drop-size and water-depth variations,
Forbes, M. S., Raison, R. J., and Skjemstad, J. O.: Formation, trans- Aust. J. Soil Res., 21, 257–269, 1983.
formation and transport of black carbon (charcoal) in terrestrial Pix4D: Support, available at: https://pix4d.com/support/, last ac-
and aquatic ecosystems, Sci. Total Environ., 370, 190–206, 2006. cess: 14 December 2017.
Foereid, B., Lehmann, J., and Major, J.: Modeling black carbon Preston, C. M. and Schmidt, M. W. I.: Black (pyrogenic) carbon:
degradation and movement in soil, Plant Soil, 345, 223–236, a synthesis of current knowledge and uncertainties with spe-
2011. cial consideration of boreal regions, Biogeosciences, 3, 397–420,
Greenwood, P., Fister, W., Kinnell, P. I. A., Rüegg, H.-R., and Kuhn, https://doi.org/10.5194/bg-3-397-2006, 2006.
N. J.: Developing and testing a precision erosion measurement Prosdocimi, M., Burguet, M., Di Prima, S., Sofia, G., Terol, E.,
facility for elucidating mobilization mechanisms in shallow-flow Comino, J. R., Cérda, A., and Tarolli, P.: Rainfall simulation and
conditions, in: Proceedings of the 4th Conference on Desertifica- Structure-from-Motion photogrammetry for the analysis of soil
tion and Land Degradation, 19 June 2012, Ghent Belgium, edited water erosion in Mediterranean vineyards, Sci. Total Environ.,
by: Gabriels, D. and Vermang, J., 105–111, 2013. 574, 204–215, 2017.
Hänsel, P., Schindewolf, M., Eltner, A., Kaiser, A., and Schmidt, Quijano, L., Gaspar, L., and Navas, A.: Lateral and depth patterns
J.: Feasibility of high-resolution soil erosion measurements by of soil organic carbon fractions in a mountain Mediterranean
means of rainfall simulations and SfM photogrammetry, Hydrol- agrosystem, J. Agric. Sci., 154, 287–304, 2016.
ogy, 3, 1–16, 2016. Rumpel, C., Chaplot, V., Planchon, O., Bernadou, J., Valentin, C.,
Hardy, R. A., James, M. R., Pates, J. M., and Quinton, J. N.: Using and Mariotti, A.: Preferential erosion of black carbon on steep
real time particle tracking to understand soil particle movements slopes with slash and burn agriculture, Catena, 65, 30–40, 2006.
during rainfall events, Catena, 150, 32–38, 2017. Rumpel, C., Ba, A., Darboux, F., Chaplot, V., and Planchon, O.:
Hardy, R. A., Quinton, J. N., James, M. R., Fiener, P., and Pates, Movement of biochar in the environment, in: Biochar for envi-
J. M.: High precision tracing of soil and sediment movement us- ronmental management, edited by: Lehmann J. and Joseph, S.,
ing fluorescent tracers at hillslope scale, Earth Surf. Proc. Land., Science, technology and implementation, Routledge, 283–299,
https://doi.org/10.1002/esp.4557, 2019. 2015.
Hoffmann, U., Hoffmann, T., Jurasinski, G., Glatzel, S., and Kuhn, Schwanghart, W., Groom, G., Kuhn, N. J., and Heckrath, G.: Flow
N. J.: Assessing the spatial variability of soil organic carbon network derivation from a high resolution DEM in a low re-
stocks in an alpine setting (Grindelwald, Swiss Alps), Geoderma, lief, agrarian landscape, Earth Surf. Proc. Land., 38, 1576–1586,
232–234, 270–283, 2014. 2013.
Hu, Y. and Kuhn, N. J.: Aggregates reduce transport distance of soil Seifritz, W.: Should we store carbon in charcoal?, Int. J. Hydrogen
organic carbon: are our balances correct?, Biogeosciences, 11, Energ., 18, 405–407, 1993.
6209–6219, https://doi.org/10.5194/bg-11-6209-2014, 2014. Shi, Z. H., Fang, N. F., Wu, F. Z., Wang, L., Yue, B. J., and Wu, G.
L.: Soil erosion processes and sediment sorting associated with
Geogr. Helv., 74, 81–91, 2019 www.geogr-helv.net/74/81/2019/W. Fister et al.: Differentiation of SOC and BC through photogrammetry 91 transport mechanisms on steep slopes, J. Hydrol., 454–455, 123– van Boxel, J. H.: Numerical model for the fall speed of raindrops in 130, 2012. a rainfall simulator, International Centre for Eremology, Special Simpson, M. J. and Hatcher, P. G.: Determination of black carbon Report 1998/1, 77–85, 1998. in natural organic matter by chemical oxidation and solid-state Wang, C., Walter, M. T., and Parlange, J. Y.: Modeling simple ex- 13 C nuclear magnetic resonance spectroscopy, Org. Geochem., periments of biochar erosion from soil, J. Hydrol., 499, 140–145, 35, 923–935, 2004. 2013. Sohi, S. P., Krull, E., Lopez-Capel, E., and Bol, R.: A review of Williams, A. T., Rangel-Buitrago, N., Pranzini, E., and Anfuso, G.: biochar and its use and function in soil, Adv. Agron., 105, 47– The management of coastal erosion, Ocean Coast. Manage., 156, 82, 2010. 4–20, 2018. Sterk, G., Rijksen, M., and Goossens, D.: Dryland Degradation by Zimmermann, M., Leifeld, J., and Fuhrer J.: Quantifying soil Wind Erosion and its Control, Ann. Arid Zone, 40, 351–367, organic carbon fractions by infrared spectroscopy, Soil Biol. 2001. Biochem., 39, 224–231, 2007. Stockmann, U., Adams, M. A., Crawford, J. W., Field, D. J., Henakaarchchi, N., Jenkins, M., Minasny, B., McBratney, A. B., de Remy de Courcelles, V., Singh, K., Wheeler, I., Abbott, L., Angers, D. A., Baldock, J., Bird, B., Brookes, P. C., Chenu, C., Jastrow, J. D., Lal, R., Lehmann, J., O’Donnell, A. G., Parton, W. J., Whitehead, D., and Zimmermann, M.: The knowns, known unknowns and unknowns of sequestration of soil organic carbon, Agr. Ecosyst. Environ., 164, 80–99, 2013. www.geogr-helv.net/74/81/2019/ Geogr. Helv., 74, 81–91, 2019
You can also read