WHO European Childhood Obesity Surveillance Initiative: overweight and obesity among 6-9-year-old children - Report of the third round of data ...
←
→
Page content transcription
If your browser does not render page correctly, please read the page content below

WHO European Childhood
Obesity Surveillance Initiative:
overweight and obesity among
6–9-year-old children
Report of the third round of data collection 2012–2013

WHO European Childhood
Obesity Surveillance Initiative:
overweight and obesity among
6–9-year-old children
Report of the third round of data collection 2012–2013
Abstract
Surveillance data on the prevalence of overweight and obesity among children and adolescents are essential to inform
the development of effective policies and strategies to tackle the challenge of childhood obesity in the WHO European
Region. In response to this need, the WHO Regional Office for Europe established the WHO European Childhood Obesity
Surveillance Initiative (COSI) in 2007.

The third round of data collection took place during the 2012–2013 school year and included assessment of more than
250 000 primary school-aged children in 19 countries and collection of information about the participating schools. In
addition, 17 of the countries collected further data on the school environment, and 11 countries collected data on fami-
ly diet and physical activity.

The systematic collection of these data and their analysis enable intercountry comparisons and a better understanding
of the progression of childhood overweight and obesity in Europe, clearly showing that childhood obesity remains a ma-
jor public health problem in the WHO European Region.

Keywords
Child nutritional sciences
Obesity-prevention and control
Public health surveillance
Body height
Body weight
Nutrition policy
Schools - education
Cross-sectional studies
Health plan implementation

    Address requests about publications of the WHO Regional Office for Europe to:
         Publications
         WHO Regional Office for Europe
         UN City, Marmorvej 51
         DK-2100 Copenhagen Ø, Denmark
    Alternatively, complete an online request form for documentation, health information, or for permission to
    quote or translate, on the Regional Office website (http://www.euro.who.int/pubrequest).

© World Health Organization 2018

All rights reserved. The Regional Office for Europe of the World Health Organization welcomes requests for permission to reproduce or translate its
publications, in part or in full.

The designations employed and the presentation of the material in this publication do not imply the expression of any opinion whatsoever on the part
of the World Health Organization concerning the legal status of any country, territory, city or area or of its authorities, or concerning the delimitation
of its frontiers or boundaries. Dotted lines on maps represent approximate border lines for which there may not yet be full agreement.

The mention of specific companies or of certain manufacturers’ products does not imply that they are endorsed or recommended by the World Health
Organization in preference to others of a similar nature that are not mentioned. Errors and omissions excepted, the names of proprietary products are
distinguished by initial capital letters.

All reasonable precautions have been taken by the World Health Organization to verify the information contained in this publication. However, the
published material is being distributed without warranty of any kind, either express or implied. The responsibility for the interpretation and use of the
material lies with the reader. In no event shall the World Health Organization be liable for damages arising from its use. The views expressed by au-
thors, editors, or expert groups do not necessarily represent the decisions or the stated policy of the World Health Organization.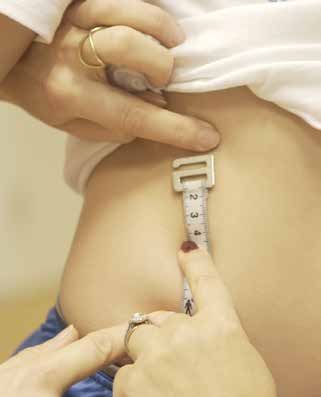
Contents
Abstract                                                                  ii
Contents                                                                 iii
Abbreviations and acronyms                                               iv
Acknowledgements                                                         iv
Contributors                                                             vi
Executive summary                                                         1
1. Introduction                                                           3
2. Methods                                                                4
   2.1 Study design and sampling strategy                                 4
   2.2 Data collection forms and procedures                               8
3. Overweight and obesity among children aged 6–9 years                  13
   3.1 Data elaboration                                                  13
   3.2 Prevalence by age group, sex and country                          14
4. Eating habits and physical activity among children aged 6–9 years     16
   4.1 Data elaboration                                                  16
   4.2 Dietary behaviour                                                 20
   4.3 Physical activity behaviour                                       26
5. School environment                                                    36
   5.1 Data elaboration                                                  36
   5.2 School characteristics                                            37
6. References                                                            43
Annex 1. Prevalence of overweight (including obesity) and obesity
(definition of the International Obesity Task Force) in boys and girls
aged 6–9 years, by age and country                                       46
Annex 2. COSI record forms                                               47

                                                                               iii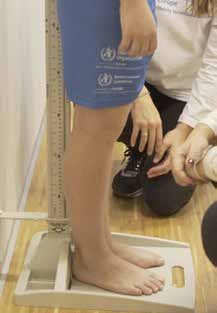
Abbreviations and acronyms
BMI      body mass index

COSI     Childhood Obesity Surveillance Initiative

SD       standard deviation

PSU      primary sampling unit

SSU      secondary sampling unit

SU       sampling unit

TSU      tertiary sampling unit

Acknowledgements
This document is the official report of the third round of data collection in the WHO European Childhood Obesity Sur-
veillance Initiative (COSI). This report was prepared by a drafting group including Wolfgang Ahrens, Joao Breda, Marta
Buoncristiano, Ana Rito, Angela Spinelli, Stephen Whiting and Norman Wirsik. Implementation of COSI during the 2012–
2013 school year was made possible by the following partners and institutions:
Albania: Institute of Public Health
Belgium: The Flemish Agency for Care and Health
Bulgaria: Ministry of Health, the National Centre for Public Health and Analyses and Regional Health Inspections; bien-
nial collaborative agreement between the Ministry of Health and the WHO Regional Office for Europе
Czechia: Institute of Endocrinology; biennial collaborative agreement between the Ministry of Health and the WHO
Regional Office for Europе
Greece: Hellenic Medical Association for Obesity; Alexander Technological Educational Institute, Thessaloniki
Ireland: National Nutrition Surveillance Centre, University College Dublin; Healthy Eating and Active Living Programme,
Health Service Executive
Italy: Ministry of Health
Latvia: Centre for Disease Prevention and Control, Ministry of Health
Lithuania: Department of Preventive Medicine, Lithuanian University of Health Sciences
Malta: Primary Health Care
Norway: Norwegian Institute of Public Health; Ministry of Health and Care Services
Portugal: Ministry of Health Institutions: Directorate General of Health; National Institute of Health Dr Ricardo Jorge;
regional health directorates of Algarve, Alentejo, Açores, Centro, Lisbon and Tagus Valley, Madeira and Norte
Republic of Moldova: National Agency for Public Health
Romania: National Institute of Public Health; public health directorates of counties
San Marino: State Secretariat for Health and Social Security
Slovenia: Faculty of Sport, University of Ljubljana

iv      WHO European Childhood Obesity Surveillance Initiative: overweight and obesity among 6–9-year-old children

Spain: Spanish Agency of Consumers Affairs, Food Safety and Nutrition
The former Yugoslav Republic of Macedonia: Ministry of Health; Institute of Public Health
Turkey: Public Health Institution, Ministry of Health; World Bank in Turkey
The WHO Regional Office for Europe gratefully acknowledges the financial support of the Government of the Russian
Federation for the preparation of this report by the WHO European Office for Prevention and Control of Noncommu-
nicable Diseases; the European Commission for financial support for round 3 of COSI; and the ministries of health of
Croatia, Greece, Malta and the Russian Federation for financial support for the meetings at which the data collection
procedures and analyses were discussed.
The WHO Regional Office for Europe also sincerely thanks Dr Harry Rutter, Oxford, United Kingdom, for overall advice on
the design of COSI and its protocol.

                                                                                                                        v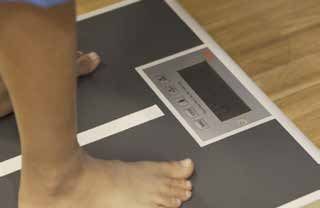
Contributors
Albania
Jolanda Hyska, Arjan Bregu, Genc Burazeri, Institute of Public Health

Belgium
Laurence Doughan, Federal Public Service of Public Health, Food Security Chain and Environment
Machtel Wauters, Flemish Agency for Care and Health

Bulgaria
Vesselka Duleva, Ekaterina Chikova-Iscener, National Centre of Public Health and Analyses

Czechia
Marie Kunesova, Institute of Endocrinology

Greece
Maria Hassapidou, Hellenic Medical Association for Obesity; Alexander Technological Educational Institute of
Thessaloniki

Ireland
Cecily Kelleher, Mirjam Heinen, National Nutrition Surveillance Centre at University College Dublin; Healthy Eating and
Active Living Programme, Health Service Executive

Italy
Angela Spinelli, Paola Nardone, National Centre for Disease Prevention and Health Promotion, National Institute of
Health
Daniela Galeone, General Directorate of Prevention, Ministry of Health

Latvia
Iveta Pudule, Biruta Velika, Centre for Disease and Prevention Control

Lithuania
Ausra Petrauskiene, Department of Preventive Medicine, Lithuanian University of Health Sciences

Malta
Victoria Farrugiaa Sant’Angelo, Primary Health Care

Norway
Anna Biehl, Jorgen Meisfjord, Ragnhild Hovengen, Norwegian Institute of Public Health

Portugal
Ana Rito, Pedro Graça, National Institute of Health Dr Ricardo Jorge

Republic of Moldova
Galina Obreja, National Agency for Public Health, State University of Medicine and Pharmacy

Romania
Constanta Huidumac Petrescu, Rodica Nicolescu, National Institute of Public Health

San Marino
Andrea Gualtieri, State Secretariat for Health and Social Security

Slovenia
Gregor Starc, Faculty of Sport, University of Ljubljana

vi      WHO European Childhood Obesity Surveillance Initiative: overweight and obesity among 6–9-year-old children

Spain
Napoleon Perez-Farinos, M Angeles Dal Re, Spanish Agency of Consumers Affairs, Food Safety and Nutrition

The former Yugoslav Republic of Macedonia
Igor Spiroski, Physiology and Monitoring of Nutrition, Institute of Public Health

Turkey
Nazan Yardim, Sibel Gogen, Şeniz Ilgaz, Faika Betül Aydin, Public Health Institution, Ministry of Health

WHO European Office for the Prevention and Control of Noncommunicable Diseases, Moscow
João Breda, Head
Enrique Loyola, Noncommunicable Diseases Surveillance Coordinator
Stephen Whiting, Technical Officer
Karen McColl, Consultant
Marta Buoncristiano, Consultant

Leibniz Institute for Prevention Research and Epidemiology, WHO Collaborating Centre, Germany
Wolfgang Ahrens, Deputy Director, Head of Department
Norman Wirsik, Scientific Manager

WHO Regional Office for Europe, Copenhagen
Gauden Galea, Division Director, Noncommunicable Diseases and Promoting Health through the Life-course
Ms Liza Jane Villas, Programme Assistant, Nutrition, Physical Activity and Obesity
Ms Jelena Jakovljevic, Consultant

                                                                                                           vii
Executive summary Childhood obesity is associated with a wide range of serious health and social consequences in childhood and higher risks of premature death and disability in adulthood. Prevention is recognized as the only feasible option for curbing the epidemic, and surveillance data on the prevalence of overweight and obesity among children and adolescents are es- sential to inform the development of effective policies and strategies. In response to the critical need for standardized surveillance data, the WHO Regional Office for Europe established the WHO European Childhood Obesity Surveillance Initiative (COSI) in 2007. This population-based system consists of stan- dardized, harmonized, systematic monitoring of the prevalence of overweight and obesity (based on measurements) among primary-school children (aged 6.0–9.9 years). The common COSI protocol establishes the main characteristics of study design and sampling strategy but, by including a combination of mandatory and voluntary components, also affords participating countries some flexibility for adapting the system to their national context. This enables the moni- toring of trends in the epidemic as well as comparisons of countries in the European Region. Thirteen Member States participated in the first round of COSI data collection in 2007–2008, and a further four coun- tries joined the second round in 2009–2010. In the first and second rounds, the prevalence of overweight among boys ranged from 19.3% and 18.0% of 6-year-olds in Belgium to 49.0% of 8-year-olds in Italy and 57.2% of 9-year-olds in Greece, respectively. In girls, the prevalence varied from 18.4% in Belgium to 42.6% of 8-year-olds in Italy and 50.0% of 9-year-olds in Greece, respectively. Data were collected for the third round of COSI in 19 countries during the 2012–2013 school year.1 All participating countries collected anthropometrics, and most (17/19) collected data about the schools on a mandatory record form. In addition, 17 countries collected data about the school environment on an optional record form. Furthermore, 11 coun- tries provided data on simple indicators of children’s dietary intakes and physical and inactivity patterns, family socioeco- nomic characteristics and co-morbid conditions associated with obesity collected on a voluntary family record form. Over 250 000 children were measured and weighed according to the COSI protocol. The prevalences of overweight and obesity were calculated by age group for children in the defined target group, with the cut-offs recommended by WHO to compute Z-scores for body mass index (BMI) for age. The prevalence of overweight (including obesity) and obesity in boys and girls aged 6–9 years in the 19 countries that participated in the third round of COSI is presented in Fig. 1. The prevalence of overweight ranged from 18% to 52% in boys and from 13% to 43% in girls, and the prevalence of obesity ranged from 6% to 28% among boys and from 4% to 20% among girls. The data suggest an increasing north−south gradient, with the highest prevalences of overweight and obesity in south- ern European countries. In the countries that collected data for more than one age group, the prevalence of overweight and obesity tended to increase with age. According to WHO definitions, more boys than girls were overweight and obese in most age groups, particularly at older ages, and in most countries. Data were also collected on eating habits and physical activity patterns, which are closely linked to the energy imbalance that results in children becoming overweight and obese. There was considerable variation among countries in the fre- quency of consumption of healthy and less healthy food items, with less difference between boys and girls within coun- tries. Countries also varied considerably in indicators of physical activity, such as going to school on foot or by bicycle, attending a sports or dance club and time spent playing outside, media consumption and sleep duration. There was little variation between boys and girls within countries. The frequency of walking or cycling to school appeared to be associat- ed with parents’ perceptions of the safety of the route and the distance to school. Given the importance of schools for promoting child health and establishing lifelong habits, data were also collected on aspects of the school environment related to nutrition and physical activity. Countries varied widely in the school nu- trition environment score, which is based on the possibility of obtaining two healthy food items and three less healthy items. The mean duration of physical education classes per week varied from 62 to 187 min, and the provision of at least 1 h of physical education per week was not realized in all schools in several countries. The proportion of schools that in- troduced healthy lifestyle initiatives or projects varied by country, ranging from 57% to over 90%. 1 Albania, Belgium (Flanders only), Bulgaria, Czechia, Greece, Ireland, Italy, Latvia, Lithuania, Malta, Norway, Portugal, Republic of Moldova, Romania, San Marino, Spain, Slovenia, the former Yugoslav Republic of Macedonia and Turkey. 1 WHO European Childhood Obesity Surveillance Initiative: overweight and obesity among 6–9-year-old children
Systematic data collection for COSI provides a better understanding of the progression of childhood overweight and
obesity in Europe and of related factors, such as eating habits, physical activity patterns and school environments. As-
sessment of more than 250 000 primary school-aged children in 19 countries during the third round of data collection
clearly shows that childhood obesity remains a major public health problem in the European Region.

Fig. 1. Prevalence of overweight (including obesity) and obesity (WHO definition) in boys and girls aged
6-9 years, by age and country, COSI round 3 (2012–2013)

                                                                                         Boys            Girls
              BEL                                                     18                         6       5                            19
6-year-olds

              MKD                                     28                            13                           10                             26
              SVN                                           25                        10                     7                             22

               BEL                                           23                          10                      9                              25
              BUL                                     30                          14                              11                             27
              CZH                                            23                          10               6                               20
              GRE                         38                            22                                                 16                                            43
               IRE                                           24                             8                7                                  25
7-year-olds

              LTU                                          26                          11                    7                             22
              LVA                                           25                          9                    7                            21
              MAT                                33                          18                                           16                              33
              MDA                                                 19                          7          4                      13
              POR                                33                               15                                 13                                        36
              SPA                   43                                      19                                         15                                           40
              SVN                                      27                             12                         9                              26
              TUR                                       25                            12                     7                                 23

               ALB                                          24                           10              5                            20
               BEL                                           22                           8               7                                23
               ITA                  44                                 23                                              15                                           40
8-year-olds

              NOR                                           24                               7               7                              24
              ROM                                      28                         14                          8                            23
              SMR                    42                                 21                                                 17                             33
              SPA              48                                     24                                                  16                                         42
              SVN                               34                               15                            10                                     31
              TUR                                           25                           9                    8                            22

               BEL                                     28                             12                         10                                  29
              GRE         52                                     28                                                             20                                       43
9-year-olds

               IRE                               32                                    12                     8                                      29
               ITA                  44                                     21                                         13                                       37
              SMR                    43                                      19                              7                                         33
              SVN                         37                                   16                                10                                   31
                     60        50         40           30              20           10               0               10              20          30            40             50   60
                                                                                              Percentage

                                               Girls obese            Boys obese             Girls overweight                    Boys overweight

                                                                                                                                                                                        2
1. Introduction Obesity in children remains an important public health problem in the WHO European Region. It is unequally distributed within and between countries and population groups (1,2). Childhood obesity is a multifactorial disease associated with a wide range of serious health and social consequences, including higher risks for premature death and disability in adulthood (3). Children with a high body mass index (BMI) often become obese adults (4). Obesity is strongly associated with risk factors for cardiovascular disease and diabetes (5), orthopaedic problems and mental health problems (3). Underachievement at school and lower self-esteem have also been linked to childhood obesity (6). Obesity arises from a combination of exposure of the child to an unhealthy, obesogenic environment (7), in which there is an imbalance between energy intake and energy expenditure, and inade- quate behavioural and biological responses to the environment (2). Prevention is recognized as the only feasible option for curbing the epidemic. Nutritional surveillance data are essential to effectively design, implement and evaluate policies and strategies for counteracting obesity (8). At the first consulta- tion of Member States (Copenhagen, October 2005) that led to the WHO European Ministerial Conference on Counter- acting Obesity (Istanbul, 15–17 November 2006), it was recognized that standardized, harmonized surveillance systems were required as a basis for policy development in the WHO European Region (8). It was acknowledged that regular assessments, based on measured weight and height, of the prevalence of overweight and obesity among children and adolescents were not commonly conducted in the Member States of the Region (9-11). In response, the WHO Regional Office for Europe and 13 Member States established the WHO European Childhood Obesity Surveillance Initiative (COSI) in 2007, for systematic collection, analysis, interpretation and dissemination of descriptive information for use in monitoring excess bodyweight and in programme planning and evaluation (12). The importance of such surveillance was reinforced in the Vienna Declaration on Nutrition and Noncommunicable Diseases in the Context of Health 2020 (13) and in the Report of the Commission on Ending Childhood Obesity (2). The establishment of COSI was the beginning of population-based monitoring of measured overweight and obesity among primary-school children in the WHO European Region. This age group (6.0–9.9 years) is important because it precedes puberty and can predict the condition in adulthood. Moreover, at the age of about 6 years, the “adiposity re- bound”, the onset of the second period of a rapid increase in body fat, begins (14,15). The aim of COSI is to measure trends in childhood overweight and obesity routinely in order to obtain a correct under- standing of the progress of the disease in this population group. Such measurements allow intercountry comparisons within the European Region, which are important for identifying effective policies to reverse the trend. Although each country is free to develop a system appropriate to its local circumstances, data must be collected according to an agreed common protocol (16) that includes a number of stipulated core items. The protocol was developed for the first COSI round (2007–2008) by 13 Member States – Belgium, Bulgaria, Cyprus, Czechia, Ireland, Italy, Latvia, Lithuania, Malta, Norway, Portugal, Slovenia and Sweden – and has been continually updated. Four new countries joined COSI for the sec- ond round (2009–2010): Greece, Hungary, Spain and the former Yugoslav Republic of Macedonia. In the first and second rounds, the prevalence of childhood overweight among boys varied from 19.3% and 18.0% of 6-year-olds in Belgium to 49.0% of 8-year-olds in Italy and 57.2% of 9-year-olds in Greece. In girls, the prevalence varied from 18.4% in Belgium to 42.6% of 8-year-olds in Italy and 50.0% of 9-year-olds in Greece (17). In both rounds, multi-country comparisons suggested the presence of a north−south gradient, with the highest prevalence of over- weight in southern European countries. Between rounds 1 and 2, the highest significant decrease in the prevalence of overweight was found in countries in which there were higher absolute BMI values in round 1 (i.e. Italy, Portugal and Slovenia), and the highest significant increase was found in countries in which there were lower BMI values in round 1 (i.e. Latvia and Norway) (18). This document is the official WHO report of the third round of COSI data collection in the 2012–2013 school year. It de- scribes the methods used and presents the main results, including trends in overweight and obesity in relation to previ- ous data collection rounds. 3 WHO European Childhood Obesity Surveillance Initiative: overweight and obesity among 6–9-year-old children
2. Methods
2.1 Study design and sampling strategy
The third COSI data collection round was conducted in 19 countries in the 2012–2013 school year. Surveillance was
conducted for the first time in five countries (Albania, Republic of Moldova, Romania, San Marino and Turkey), while the
other 14 countries had participated in at least one of the two previous rounds (Belgium (only Flanders), Bulgaria, Cze-
chia, Greece, Ireland, Italy, Latvia, Lithuania, Malta, Norway, Portugal, Spain, Slovenia and the former Yugoslav Republic
of Macedonia).2

Data were collected by a common protocol devised in 2007 by the WHO Regional Office for Europe and Member States
(19), which was slightly amended for COSI 2 and 3 (16,17). The protocol defines the limits within which each participat-
ing country can create a surveillance system that both matches its own national characteristics and allows comparisons
with those of the other countries.

The main characteristics of the study design and sampling strategy in the COSI protocol are:3

• The surveillance system target population is primary school-age children. More specifically, participating countries
      can select one or more of the following four age groups: 6.0–6.9, 7.0–7.9, 8.0–8.9 or 9.0–9.9 years.

• Primary schools are the settings for enrolment. As education is compulsory in all countries in the European Region,
      most children can easily be reached through the education system. Moreover, primary schools are of interest be-
      cause they play an important role in influencing children’s behaviour regarding nutrition and physical activity and can
      be settings for the promotion of healthy lifestyles.

• Given the differences among school systems, age at starting school, number of children held back and level of pu-
      pils’ advancement in countries, it appeared at first that it would be difficult to find a uniform – and equally appli-
      cable – approach to the selection of children. It was therefore suggested that age be the first inclusion criterion. If
      all children in the targeted age group are in the same grade, only that grade should be included. If the targeted age
      group is spread across grades, however, all grades in which the majority are children in the selected age group should
      participate.

• COSI has a semi-longitudinal design repeated at defined intervals. For each data collection round, a new cross-sec-
      tional sample of children of the same age group is selected. Countries may opt for a prospective cohort design, in
      which the initial sample of children is followed up for one round. Countries may also choose to include all children in
      the target age group, instead of selecting a sample.

• Countries that participated in a previous round of data collection can choose to select a new sample of schools or fol-
      low a sentinel site approach, i.e. involve the same schools that were selected previously.

• COSI should be integrated into existing surveillance systems if possible, to avoid duplication or an additional burden
      for countries.

Table 1 provides an overview of the main characteristics of the study design in each country that participated in COSI
round 3. Children were enrolled at primary schools in all countries except Czechia, where they were selected in paedi-
atric clinics because COSI had been integrated into the mandatory health checks performed by paediatricians. Belgium
and Slovenia targeted all four age groups, while most countries selected 7-year-old children (Bulgaria, Czechia, Greece,
Ireland, Latvia, Lithuania, Malta, Portugal, Republic of Moldova, Spain and Turkey). Albania, Italy, Norway, Romania and
San Marino targeted only older children. The former Yugoslav Republic of Macedonia is the only country that studied
only 6-year-old children. Belgium included the entire population of interest (all children in first and third grade prima-
ry-school classes), as did Malta and San Marino (all children in third-grade primary-school classes). Other countries se-
lected a nationally representative sample. Of the 14 countries that had participated in the first or second round of COSI
data collection, six adopted a sentinel approach (Bulgaria, Ireland, Lithuania, Norway, Portugal and the former Yugoslav
Republic of Macedonia). COSI was integrated into routinely monitored measurements in Belgium, Czechia, Malta and
Slovenia but was newly established in the other countries.
2
    Only Flanders participated in COSI round 3, while the data collected in all the other countries are nationally representative.
3
    More details on the COSI 2012 protocol and on previous versions are provided elsewhere (15,18).

                                                                                                                                     4
Table 1. Main characteristics of study design in each country participating in COSI round 3
Country Targeted Inclusion of a sample or of all Participation in previous Sentinel
age groups children in targeted grades of COSI rounds of data approach
primary school collection
Albania 8 Sample No –
Belgiuma 6, 7, 8, 9 All children in target grades Yes, in 2007/8 and –
2009/10
Bulgaria 7 Sample Yes, in 2007/8 Yes
Czechia 7 Sample Yes, in 2007/8 and No
2009/10
Greece 7, 9 Sample Yes in 2009/10 No
Ireland 7, 9 Sample Yes, in 2007/8 and Yes
2009/10
Italy 8, 9 Sample Yes, in 2007/8 and No
2009/10
Latvia 7 Sample Yes, in 2007/8 and No
2009/10
Lithuania 7 Sample Yes, in 2007/8 and Yes
2009/10
Malta 7 All children in target grades Yes, in 2007/8 and –
2009/10
Republic of Moldova 7 Sample No –
Norway 8 Sample Yes, in 2007/8 and Yes
2009/10
Portugal 7 Sample Yes, in 2007/8 and Yes
2009/10
San Marino 8, 9 All children in target grades No –
Romania 8 Sample No –
Spain 7, 8 Sample Yes, in 2009/10 No
Slovenia 6, 7, 8, 9 Sample Yes, in 2007/8 and No
2009/10
The former Yugoslav 6 Sample Yes, in 2009/10 Yes
Republic of Macedonia
Turkey 7, 8 Sample No –
The setting in all countries was primary schools. –, not applicable.
a
Only Flanders was involved in COSI round 3.
Table 2 shows the main features of the sampling design used in countries that did not include the whole population of
targeted children. All countries used cluster sampling; 10 of 16 used a two-stage sampling design, with primary schools
as the primary and classes as the secondary sampling units. Norway also adopted a two-stage cluster sampling design
but with counties as the primary and schools as the secondary sampling unit. Four countries implemented a simple clus-
ter sampling design: Italy selected third-grade classes, Greece and Latvia primary schools and Czechia paediatric clinics.
Spain used provinces as the primary sampling units, schools as the secondary sampling units and classes as tertiary
sampling units. Stratification was applied in 10 of 16 countries. Although they used different variables, many considered
a geographical or administrative division of the national territory and the degree of urbanization of the child’s place of
residence or school location.
5 WHO European Childhood Obesity Surveillance Initiative: overweight and obesity among 6–9-year-old childrenAll primary schools in Malta and San Marino participated in COSI round 3. The number of schools in Belgium that partici-
pated in COSI round 3 was not available.
Table 2. Main features of sampling design used in COSI round 3, by country
Country Cluster Sampling unit definition Stratification Sampling units approached
sampling and proportion that
design participated (%)
PSU/SU SSU
Albania Two-stage PSU: primary schools By degree of 104 (100.0) 208 (100.0)
stratified SSU: 2nd and 3rd grades urbanization
Bulgaria Two-stage PSU: primary schools No 185 (100.0) 191 (100.0)
SSU: 1st grade
Czechia Stratified SU: paediatric clinics By region and degree of 91 (100.0) –
urbanization
Greece Cluster SU: primary schools (2nd No 186 (97.3) –
sampling and 4th grades)
Ireland Two-stage PSU: primary schools By school size 194 (82.0) 330 (81.2)
stratified SSU: 1st and 3rd grades
Italy Stratified SU: 3rd grade By region 2 622 –
(100.0)
Latvia Stratified SU: primary schools (1st By degree of 140 (100.0) –
grade) urbanization and
language of instruction
Lithuania Two-stage PSU: primary schools By district and degree of 122 (NA)a 249 (NA)a
stratified SSU: 1st grade urbanization
Norway Two-stage PSU: counties No 10 (100.0) 131 (96.2)
SSU: primary schools (3rd
grade)
Portugal Two-stage PSU: primary schools No 200 (100.0) 440 (NA)a
SSU: 1st and 2nd grades
Republic of Two-stage PSU: primary schools No 203 (100.0) 203 (100.0)
Moldova SSU: 1st grade
Romania Two-stage PSU: primary schools By county and degree of 205 (100.0) 507 (NA)a
stratified SSU: 1st and 2nd grade urbanization
Spain Three-stage PSU: provinces By region and size of 130 (53.8) 250 (NA)
stratified SSU: schools municipal population
TSU: classes (2nd and 3rd
grades)
Slovenia Two-stage PSU: primary schools No 232 (100.0) 1333 (100.0)
SSU: 1st, 2nd and 3rd
grades
The former Two-stage PSU: primary schools By regional, centres 113 (96.5) 237 (NA)a
Yugoslav stratified SSU: 1st grade of public health and
Republic of degree of urbanization
Macedonia
Turkey Two-stage PSU: primary schools By region 216 (100.0) 216 (100.0)
stratified SSU: 2nd grade
–, not applicable; NA, not available; PSU, primary sampling unit; SSUs, secondary sampling unit; TSUs, tertiary sampling unit; SU, sampling unit.
a
Number of sampling units that participated in the survey; the number of units approached was not available.
6Table 3 shows, for each country, the number of children who were invited to participate in COSI round 3, the proportion
who took part in measurements and whose parents completed the family form and the numbers of measured children
in the targeted age groups.
According to the COSI protocol, the minimum final effective sample size4 should be 2800 children per target age group
(1400 girls and 1400 boys). In order to compensate for the eventual loss of children who do not participate in the study
or are not in the target age group, the overall number of children to be sampled should be higher. The sample size
should be considerably increased in countries that choose to make estimates for subnational levels.
In COSI round 3, the number of children selected differed by country because of differences in study design and sam-
pling strategy. The level of participation in the study was high: at least 90% of selected children took part in five coun-
tries (Albania, Italy, Malta, San Marino and Slovenia) and 80–87% in Bulgaria, Latvia, Norway, Portugal, Republic of Mol-
dova and Turkey. Ireland had the lowest level of participation (59%).5
The effective sample size varied widely among countries that used a sampling approach, ranging from around 1000
measured children per target age group in Ireland to more than 15 000 in Italy. Moreover, the sample size was much
lower than that recommended in the COSI protocol in Czechia, Ireland and Spain (1000–1800 measured children per
age group instead of 2800). In Greece, Lithuania, Portugal, Republic of Moldova, the former Yugoslav Republic of Mace-
donia and Turkey, 2100–2700 children were measured per age group; in Bulgaria and Latvia more than 3000 children; in
Romania more than 4000; and in Slovenia more than 20 000 children.
Eleven countries used the family form in the 2012–2013 data collection:6 Bulgaria, Czechia, Ireland, Italy, Lithuania, Mal-
ta, Portugal, Republic of Moldova, San Marino, Spain and Turkey. Parents’ participation in the surveillance was particu-
larly high in Italy and San Marino, where more than 95% of the parents of the selected children filled out and returned
the family form. Bulgaria and Turkey also registered a good level of participation (around 85%), followed by the Republic
of Moldova, Portugal and Lithuania (79%, 76% and 70%, respectively). Parents’ participation was nearly 70% in Lithuania
and Malta, while, in Ireland, the family form was filled in for only one in two children (50%).
Table 3. Numbers of children who were invited to participate in COSI round 3, proportions who took part
in measurements (%) and whose parents completed the family form and numbers of measured children
in the targeted age groups, by country
Country No. of children invited to participate No. of measured children with complete
information and were in the target age groups
Total Proportion who Proportion 6-year- 7-year- 8-year- 9-year-olds
participated in whose family olds olds olds
measurements form was
(%) filled in (%)
Albania 6 117 95.0 – – – 3 312 –
Belgiuma 138 322b NA – 56 245 15 208 48 470 18 395
Bulgaria 3 923 85.5 85.5 – 3 348 – –
Czechia 2 650 95.0 91.6 – 1 457 – –
Greece 11 912 78.1 – – 2 728 – 2 642
Ireland 6 270 58.6 50.3 – 1 012 – 1 129
Italy 5 1145 90.9 95.2 – – 29 045 16 502
Latvia 5 082 85.8 – – 3 481 – –
Lithuania 5 392 71.2 69.9 – 2 594 – –
Malta 3 832 91.0 68.6 – 2 064 – –
Norway 4 078 86.1 – – 2 873 –
4
The minimal effective sample size is the number of children in the targeted age group who should be measured during data collection.
5
Data on children’s participation was not available for Belgium, Czechia, Romania, Spain and the former Yugoslav Republic of Macedonia.
6
More details on the COSI family form are provided in section 2.2 and Annex 2.
7 WHO European Childhood Obesity Surveillance Initiative: overweight and obesity among 6–9-year-old childrenTable 3. contd
Country No. of children invited to participate No. of measured children with complete
information and were in the target age groups
Total Proportion who Proportion 6-year- 7-year- 8-year- 9-year-olds
participated in whose family olds olds olds
measurements form was
(%) filled in (%)
Portugal 7 430 79.9 76.4 – 2 649 – –
Republic of 4 426 87.1 78.9 – 2 575 – –
Moldova
Romania 4 348b NA NA – – 4 278 –
San Marino 305 91.8 97.4 – – 160 118
Spain 3 426b NA NA – 1 820 1 606 –
Slovenia 24 958 95.8 – 5 523 7 861 7 829 2 634
The former 3 176b NA NA 2 210 – – –
Yugoslav
Republic of
Macedonia
Turkey 5 739 86.4 87.4 – 2 613 2 345 –
–, not applicable; NA, not available; PSU, primary sampling unit; SSU, secondary sampling unit; TSU, tertiary sampling unit; SU, sampling unit.
a
Only Flanders was involved in COSI round 3.
b
Number of children who participated in the survey; the number of children approached is not available.
2.2 Data collection forms and procedures
In accordance with the agreed common protocol of the WHO Regional Office for Europe and Member States (16) for
the third round, standardized data collection procedures were followed and adapted by each country to suit its local
circumstances.
2.2.1 Organization
Each country was responsible for collecting and analysing its data, and a country coordination team was established.
This usually consisted of:
• a principal investigator responsible for overall coordination;
• supervisor(s) responsible for data collection in each sampled school;
• a data manager responsible for overall data management;
• examiners responsible for administration of the examiner’s record form and taking anthropometrics;
• data clerks responsible for entering the data into electronic data files; and
• school personnel responsible for the completing the school record forms and other relevant tasks.
In each country, these teams met regularly during the surveillance initiative to review progress, ensure uniform data col-
lection and discuss any issues that arose.
82.2.2 Period
In most countries, data were collected in the 2012–2013 school year. Countries were requested to make measurements
of all sampled children over as short a time as possible, preferably within 4 weeks and no longer than 10 weeks, avoiding
data collection during the first 2 weeks of a school term or immediately after a major holiday. Table 1 shows the period
of data collection in each country.
2.2.3 Examiners and training
In most countries, surveillance was conducted in the sampled schools in collaboration with teachers and other school
personnel. Depending on the local arrangements, circumstances and budget, countries appointed examiners to collect
the core data. The examiners were:
• school nurses, physicians or paediatricians linked to the school health system;
• other suitable school personnel, such as physical education teachers during physical education classes;
• health professionals who were taking measurements during routine comprehensive health screening or specifically
for the surveillance initiative; or
• other examiners, such as university students in the fields of health, nutrition and sports.
For the third round data collection, examiners were trained in making standardized measurements as accurately and
precisely as possible, according to the prescribed measurement techniques and instructions for examiners included in
the protocol (16).
Training included a review of the background and objectives of the surveillance system, standardized use of the forms,
making measurements as described in the protocol, supporting children who are anxious, calibrating instruments, re-
cording measurements immediately after reading them and writing legibly to reduce mistakes during data entry. Strict
adherence to the measurement techniques and recording procedures was emphasized. Attention was also paid to con-
fidentiality, the prevention of stigmatization or bullying of vulnerable children and answering questions from children,
school staff and parents.
2.2.4 Ethical considerations
The protocol (16) was in accordance with the International Ethical Guidelines for Biomedical Research Involving Human
Subjects (20) and was approved by ethical committees in each country.
All study procedures were fully explained to parents, in a letter or at a school information meeting, and they gave informed
consent for the measurements and data treatment (written in the local language) before the child was enrolled. In accor-
dance with the local legal requirements, countries could choose passive or active informed consent (see Table 4). Although
parents have the right to know their child’s body height and body weight, these were communicated only upon request.
The children’s assent was always obtained before the measurements were made. Children were never told the measure-
ments of other children. The confidentiality of all collected and archived data was assured. The children’s names and, in
some cases, the entire date of birth were not included in the electronic data files sent by the countries to the WHO Region-
al Office.
2.2.5 Data collection forms
Four data collection forms (see Annex 2) are included in the COSI manual of data collection procedures (21):
• a mandatory examiner’s record form,
• a mandatory school record form,
• a voluntary school record form and
• a voluntary family record form.
9 WHO European Childhood Obesity Surveillance Initiative: overweight and obesity among 6–9-year-old childrenThe forms include closed questions with pre-coded answers (when applicable). The child’s record form and the school
record form were accompanied by detailed instructions. The voluntary school record form was used if the country de-
cided to collect data on the schools. Table 1 shows use of each record form by country.
As the original data collection forms and instructions for their administration were prepared in English, countries were
advised to have them translated into their local languages by a professional translator. The forms were then translated
back into English and carefully checked for discrepancies with the original English version.
Mandatory examiner’s record form
Variables
The mandatory variables collected on the examiner’s record form are: date of birth (or age in months), sex, place of res-
idence, school grade, date and time of measurement, clothes worn when measured, school address, body weight and
body height.
Administration
Preparation of a private room with specific requirements, organization and preparation of children for the study, the an-
thropometric instruments and calibration and maintenance procedures, measurement techniques and administration of
the forms are described in the manual of data collection procedures (21). Examiners are advised to follow the guidance
strictly.
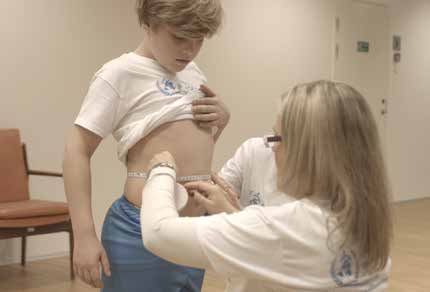
Anthropometric measurements
The mandatory anthropometric measures are body weight and height. These two measures are often used as they
are easy to measure (16) and provide anthropometric indices such as the BMI, which is a well-recognized indicator of
whether a child is underweight, of normal weight, at risk for overweight, overweight or obese (22).
Examiners are advised not to calculate the BMI at the point of measurement, because it requires time and special tools.
It is recommended that waist and hip circumferences be measured to characterize a population in terms of abdominal
fat distribution, independently of total fat (23). Of the 19 countries, seven collected additional data on waist circumfer-
ence and four on hip circumference.
Children’s weight and height are measured in a private room at school by trained examiners, preferably in the morning
before lunch, by standardized procedures (21). Countries are required to use the same anthropometric instruments
everywhere and to calibrate them, preferably every day when measurements are being made. The instruments must be
highly accurate and precise.
Body weight is measured on portable electronic (digital) scales calibrated to 0.1 kg (100 g) and measuring up to 150 kg.
These are easy to use and transport and reduce observer measurement error, as the weight is displayed electronically.
Body weight is measured and recorded in kilograms to the nearest 100 g (0.1 kg).
Height is measured on a height board mounted at a right angle between a level floor and a straight, vertical surface (if
possible with a digital counter). The height board should be made of smooth, moisture-resistant (varnished or polished)
wood, and the horizontal and vertical pieces should be firmly joined at right angles, with a movable piece as the head-
board. Height is measured in centimetres and the reading taken to the last completed millimetre (0.1 cm).
After assent, children should be measured wearing normal, light, indoor clothing. If they are not wearing light indoor
clothing, the clothes worn should be recorded. Examiners are advised to communicate with the child in a sensitive way
and to explain the measurement procedures.
Mandatory school record form
The school record form was completed by the school principal (head teacher), by the teachers in the sampled classes or
by someone else who could document and report the variables required. The variables were: the location of the school,
the number of children registered and measured (examined) per sampled class, those whose parents refused to allow
their child to be measured and children who were absent on the measuring day. Furthermore, a few school (environ-
mental) characteristics were included, such as the frequency of physical education lessons, the availability of school
10playgrounds, the possibility of purchasing a number of listed food items and beverages on the school premises and cur-
rent organized school initiatives to promote a healthy lifestyle (healthy eating, physical activity).
It was strongly recommended that the form be given to the relevant school representative on the day of the measure-
ments and that it be completed in the presence of the examiner.
Most of the countries (17/19) provided data on the mandatory school form; only Belgium and Spain did not use the
form.
Voluntary school record form
Of the 19 participating countries, 13 collected additional data on the voluntary school record form, which contained
optional questions about the school environment on, for example, the availability of safe routes to school, transport to
school, the school curriculum, school meals, vending machines and the availability of fruit, vegetable or milk schemes.
Each country could decide to answer some or all the questions on this form, and the replies could be appended to the
mandatory school form.
School principals or teachers of the classes sampled were asked to complete the form. Again, it was strongly recom-
mended that the form be completed in the presence of the examiner.
Voluntary family record
The family form was completed by 11 countries. Submission of the form was voluntary, and all or only some of the items
could be completed. The forms were filled in by parents or caregivers, and countries had to attach the letter sent to the
parents to inform them about the initiative and request their consent.
The form contains data on simple indicators of the children’s dietary intake and physical activity or inactivity patterns,
the family’s socioeconomic characteristics and comorbid conditions associated with obesity.
Table 4. Data collection period, informed consent and use of record forms in COSI round 3, by country
Country Data collection period Informed Examiner’s Mandatory Voluntary Family
consent record school school record
form record form record form form
Albania February–March 2013 Active ✔ ✔ ✔
Belgium September 2012–July 2013 NA ✔
Bulgaria April–May 2013 Passive ✔ ✔ ✔ ✔
Czechia January–June 2013 Active ✔ ✔ ✔ ✔
Greece January–June 2013 Active ✔ ✔ ✔
Ireland November 2012–February Active ✔ ✔ ✔
2013
Italy April–June 2012; October– Passive ✔ ✔ ✔ ✔
November 2012
Latvia October–December 2012 Passive ✔ ✔ ✔
Lithuania March–May 2013 Active ✔ ✔ ✔ ✔
Malta February–June 2013 Passive ✔ ✔ ✔ ✔
Norway September–December Active ✔ ✔
2012
Portugal May–June 2013; October– Active ✔ ✔ ✔ ✔
November 2013
11 WHO European Childhood Obesity Surveillance Initiative: overweight and obesity among 6–9-year-old childrenTable 4. contd
Country Data collection period Informed Examiner’s Mandatory Voluntary Family
consent record school school record
form record form record form form
Republic of May 2013 Active ✔ ✔ ✔ ✔
Moldova
Romania April–May 2013 Active ✔ ✔
San Marino May 2012 Passive ✔ ✔ ✔ ✔
Spain October–December 2013 Active ✔ ✔
Slovenia April 2013 Active ✔ ✔ ✔
The former March–June 2013 Passive ✔ ✔
Yugoslav
Republic of
Macedonia
Turkey May–June 2013 Active ✔ ✔ ✔ ✔
NA, not applicable
123. Overweight and obesity among children aged 6–9
years
3.1 Data elaboration
The cut-offs recommended by WHO in 2007 for data on school-aged children and adolescents were used to compute
BMI-for-age Z-scores and to estimate the prevalence of overweight and obesity (24,25). BMI was calculated from the
formula: weight (kg) divided by height squared (m2). Overweight and obesity were defined as a BMI-for-age value > +1
Z-score and > +2 Z-scores, respectively (24). According to WHO definitions, the estimated prevalence of overweight
includes children who are obese (26). Children for which a biologically implausible (or extreme) BMI-for-age value was
estimated were excluded from the analysis (values below –5 or above +5 Z-scores relative to the 2007 WHO growth ref-
erence median) (24). For comparison, prevalence calculated with the International Obesity Task Force cut-offs (27) are
presented in Annex 1.
All cleaned country datasets were sent to the WHO Regional Office, where they were reviewed for inconsistencies and
completeness in a standard manner and then merged for intercountry analyses. The final anthropometric dataset in-
cluded measurements for children who had given informed consent and for whom complete information on age, sex,
weight and height was available.
The prevalence of overweight and obesity among boys and girls was calculated by age group (see Table 5). Children
who were not in the defined target age groups were excluded from the analysis. As sampling weights to adjust for the
sampling design, oversampling and non-response were available for only a few countries, the analysis was performed
unweighted.7
Table 5. Numbers of children included in the analysis of overweight and obesity in COSI round 3, by coun-
try, age group and sex
Country Age group Boys (N) Girls (N) Total (N)
Albania 8-year-olds 1 706 1 606 3 312
Belgium 6-year-olds 28 372 27 810 56 182
7-year-olds 8 020 7 159 15 179
8-year-olds 24 534 23 915 48 449
9-year-olds 9 411 8 978 18 389
Bulgaria 7-year-olds 1 671 1 676 3 347
Czechia 7-year-olds 759 693 1 452
Greece 7-year-olds 1 346 1 375 2 721
9-year-olds 1 320 1 320 2 640
Ireland 7-year-olds 508 504 1 012
9-year-olds 579 550 1 129
Italy 8-year-olds 14 502 14 500 29 002
9-year-olds 8 590 7 902 16 492
Latvia 7-year-olds 1 803 1 677 3 480
Lithuania 7-year-olds 1 273 1 311 2 584
Malta 7-year-olds 1 014 1 037 2 051
7
For Greece, values were calculated by applying a weighting factor in order to correct for the unbalanced distribution of the sample by geographical
area.
13 WHO European Childhood Obesity Surveillance Initiative: overweight and obesity among 6–9-year-old childrenTable 5. contd
Country Age group Boys (N) Girls (N) Total (N)
Norway 8-year-olds 1 492 1 381 2 873
Portugal 7-year-olds 1 331 1 313 2 644
Republic of Moldova 7-year-olds 1 309 1 264 2 573
Romania 8-year-olds 2 134 2 140 4 274
San Marino 8-year-olds 85 75 160
9-year-olds 63 55 118
Slovenia 6-year-olds 2 769 2 735 5 504
7-year-olds 4 015 3 823 7 838
8-year-olds 3 975 3 834 7 809
9-year-olds 1 370 1 261 2 631
Spain 7-year-olds 870 944 1 814
8-year-olds 804 800 1 604
The former Yugoslav Republic 6-year-olds 1 125 1 070 2 195
of Macedonia
Turkey 7-year-olds 1 266 1 341 2 607
8-year-olds 1 212 1 132 2 344
3.2 Prevalence by age group, sex and country
The prevalence of overweight (including obesity) and obesity according to the WHO definition among boys and girls
aged 6–9 years in the 19 countries participating in COSI round 3 is presented in Fig. 1 in the Executive summary. The
prevalence of overweight ranged from 18% to 52% in boys and from 13% to 43% in girls and that of obesity from 6% to
28% among boys and from 4% to 20% among girls.
The data suggest the presence of an increasing north−south gradient, with the highest prevalence of overweight and
obesity in southern European countries. In the countries in which data were collected on more than one age group,
there was a tendency for an increase in the prevalence of overweight and obesity by age. According to WHO definitions,
more boys than girls were overweight and obese in most age groups, particularly at older ages, and in most countries.
14Fig. 1. Prevalence of overweight (including obesity) and obesity (WHO definition) in boys and girls aged
6-9 years, by age and country, COSI round 3 (2012/2013)
Boys Girls
BEL 18 6 5 19
6-year-olds
MKD 28 13 10 26
SVN 25 10 7 22
BEL 23 10 9 25
BUL 30 14 11 27
CZH 23 10 6 20
GRE 38 22 16 43
IRE 24 8 7 25
7-year-olds
LTU 26 11 7 22
LVA 25 9 7 21
MAT 33 18 16 33
MDA 19 7 4 13
POR 33 15 13 36
SPA 43 19 15 40
SVN 27 12 9 26
TUR 25 12 7 23
ALB 24 10 5 20
BEL 22 8 7 23
ITA 44 23 15 40
8-year-olds
NOR 24 7 7 24
ROM 28 14 8 23
SMR 42 21 17 33
SPA 48 24 16 42
SVN 34 15 10 31
TUR 25 9 8 22
BEL 28 12 10 29
GRE 52 28 20 43
9-year-olds
IRE 32 12 8 29
ITA 44 21 13 37
SMR 43 19 7 33
SVN 37 16 10 31
60 50 40 30 20 10 0 10 20 30 40 50 60
Percentage
Girls obese Boys obese Girls overweight Boys overweight
15 WHO European Childhood Obesity Surveillance Initiative: overweight and obesity among 6–9-year-old children4. Eating habits and physical activity among children
aged 6–9 years
Eating habits and physical activity patterns are closely linked to the energy imbalance that results in overweight and
obese (2). COSI collects information on some eating and physical activity behaviour to provide the information necessary
for policy-makers to design, implement and evaluate the effectiveness of policies and strategies to improve diets and
increase physical activity.
The greater availability and affordability of energy-dense, nutrient-poor foods and drinks has contributed to the obe-
sogenic environment in which many children now grow up, which encourages weight gain (2). Eating breakfast regularly
is associated with a better-quality diet and a lower risk of becoming overweight or obese (28-31). Daily consumption of
fruit and vegetables is an important component of a healthy diet, while consumption of foods such as savoury or sweet
snacks, fast foods, processed meat products and sugary soft drinks, which tend to be high in saturated fats, free sugars
or salt, should be limited (32).
The benefits of physical activity, such as active play, walking, cycling and participation in sports, for children’s physical
and mental health as well as for their academic achievement are well documented (33-35): higher levels of habitual
physical activity are associated with less overweight in children (36). WHO recommends that children have at least 60
min of moderate-to-vigorous physical activity every day (33), but only a small proportion of children currently meet this
recommendation (37,38). Active transport – walking or cycling – involves more physical activity and cardiovascular fit-
ness (39), but in many countries the proportion of children who walk or cycle to and from school has been decreasing
(37).
Concern has been raised that the time children spend watching television or using electronic media (screen time) is dis-
placing unstructured play and resulting in more sedentary time and less physical activity (37,40,41). This has prompted
some national authorities to issue guidance for parents to limit their children’s screen or sedentary time (37,42-44).
Short sleep duration is another energy-related behaviour that is independently associated with weight gain and adiposi-
ty in childhood (45,46).
4.1 Data elaboration
As mentioned in section 2.2, COSI collects limited information on eating habits and the physical activity and inactivity of
children from the questionnaire filled in by parents. Table 6 lists the items included in the analysis and the availability of
information by country.
This section presents the frequency of eating breakfast and some food and beverages items generally accepted as
healthy or as having high contents of salt, sugar, fat or trans fats and therefore unhealthy. The following eating habits
were analysed:
• eating breakfast every day;
• eating fresh fruit daily;
• eating vegetables daily;
• eating foods like potato crisps, corn crisps, popcorn or peanuts on more than 3 days a week;
• eating foods like pizza, French fries (chips), hamburgers, sausages or meat pies on more than 3 days a week;
• eating sweets or chocolate on more than 3 days a week;
• eating foods like biscuits, cakes, doughnuts or pies on more than 3 days a week;
• drinking soft drinks containing free sugar on more than 3 days a week; and
16• drinking 100% fruit juice on more than 3 days a week.
The following aspects of physical activity and sedentary behaviour were investigated:
• travelling to or from school on foot or by bicycle;
• going to a sports or dancing club on at least 2 days a week;
• playing outside for at least 1 h a day;
• watching television or videos or playing computer games for at least 2 h a day; and
• sleeping at least 9 h a day.
Table 6. Data on children’s lifestyle and categorization of answer options for behavioural analyses
Question Answer options Categorization of answer Countries that
options provided information
Breakfast frequency
“Over a typical or usual week, “Every day”; “most days Every day=“every day” Bulgaria, Czechia, Ire-
how often does your child (4–6 days)”; “some days land, Lithuania, Malta,
have breakfast?’ (1–3 days)”; “never” < 7 days/week=“most days Portugal, Republic of
(4–6 days)”; “some days Moldova, Spain and
(1–3 days)” or “never” Turkey
Food and beverage consumption frequency
“Over a typical or usual week, “Every day”; “most days Food items (i) to (ii): Bulgaria, Czechia, Ire-
how often does your child eat (4–6 days)”; “some days land, Italy (items (i)
or drink the following kinds of (1–3 days)”;” never” Every day=“every day” and (ii) only), Lithuania,
foods or beverages: (i) fresh Republic of Moldova,
fruit; (ii) vegetables (excluding < 7 days/week=“most days San Marino (only items
potatoes); (iii) foods like pota- (4–6 days)”; “some days (i) and (ii)), Spain and
to crisps, corn crisps, popcorn (1–3 days)” or “never”. Turkey
or peanuts; (iv) foods like piz-
za, French fries, hamburgers,
sausages or meat pies; (v)
Food items (iii) to (viii):
foods like sweets or choco-
late; (vi) foods like biscuits,
> 3 days/week=“every day”
cakes, doughnuts or pies; (vii)
or “most days (4–6 days)”
soft drinks containing sugar;
(viii) 100% fruit juice”?
≤ 3 days/week=“some days
(1–3 days)” or “never”
17 WHO European Childhood Obesity Surveillance Initiative: overweight and obesity among 6–9-year-old childrenYou can also read