Processes culminating in the 2015 phreatic explosion at Lascar volcano, Chile, evidenced by multiparametric data - Nat. Hazards Earth Syst. Sci.
←
→
Page content transcription
If your browser does not render page correctly, please read the page content below
Nat. Hazards Earth Syst. Sci., 20, 377–397, 2020
https://doi.org/10.5194/nhess-20-377-2020
© Author(s) 2020. This work is distributed under
the Creative Commons Attribution 4.0 License.

Processes culminating in the 2015 phreatic explosion at Lascar
volcano, Chile, evidenced by multiparametric data
Ayleen Gaete1 , Thomas R. Walter1 , Stefan Bredemeyer1,2 , Martin Zimmer1 , Christian Kujawa1 , Luis Franco Marin3 ,
Juan San Martin4 , and Claudia Bucarey Parra3
1 GFZ  German Research Centre for Geosciences, Telegrafenberg, 14473 Potsdam, Germany
2 GEOMAR     Helmholtz Centre for Ocean Research Kiel, 24148 Kiel, Germany
3 Observatorio Volcanológico de Los Andes del Sur (OVDAS), Servicio Nacional de Geología y Minería (SERNAGEOMIN),

Temuco, Chile
4 Physics Science Department, Universidad de la Frontera, Casilla 54-D, Temuco, Chile

Correspondence: Ayleen Gaete (agaete@gfz-potsdam.de)

Received: 13 June 2019 – Discussion started: 25 June 2019
Accepted: 5 December 2019 – Published: 4 February 2020

Abstract. Small steam-driven volcanic explosions are com-          marole on the southern rim of the Lascar crater revealed a
mon at volcanoes worldwide but are rarely documented or            pronounced change in the trend of the relationship between
monitored; therefore, these events still put residents and         the CO2 mixing ratio and the gas outlet temperature; we
tourists at risk every year. Steam-driven explosions also oc-      speculate that this change was associated with the prior pre-
cur frequently (once every 2–5 years on average) at Lascar         cipitation event. An increased thermal anomaly inside the ac-
volcano, Chile, where they are often spontaneous and lack          tive crater as observed in Sentinel-2 images and drone over-
any identifiable precursor activity. Here, for the first time at   flights performed after the steam-driven explosion revealed
Lascar, we describe the processes culminating in such a sud-       the presence of a ∼ 50 m long fracture truncating the floor
den volcanic explosion that occurred on 30 October 2015,           of the active crater, which coincides well with the location
which was thoroughly monitored by cameras, a seismic net-          of the thermal anomaly. This study presents the chronology
work, and gas and temperature sensors.                             of events culminating in a steam-driven explosion but also
   Prior to the eruption, we retrospectively identified unrest     demonstrates that phreatic explosions are difficult to predict,
manifesting as a gradual increase in the number of long-           even if the volcano is thoroughly monitored; these findings
period (LP) seismic events in 2014, indicating an enhanced         emphasize why ascending to the summits of Lascar and sim-
level of activity at the volcano. Additionally, sulfur diox-       ilar volcanoes is hazardous, particularly after considerable
ide (SO2 ) flux and thermal anomalies were detected before         precipitation.
the eruption. Then, our weather station reported a precipita-
tion event, followed by an increase in steaming and a sud-
den volcanic explosion at Lascar. The multidisciplinary data
exhibited short-term variations associated with the explo-         1   Introduction
sion, including (1) an abrupt eruption onset that was seis-
mically identified in the 1–10 Hz frequency band, (2) the          Volcanoes possessing an identified region of shallow magma
detection of a 1.7 km high white-gray eruption column in           storage often allow the close monitoring of changes associ-
camera images, and (3) a pronounced spike in SO2 emis-             ated with deformation, seismicity and degassing activity, and
sion rates reaching 55 kg s−1 during the main pulse of the         data on all of these processes are highly beneficial for erup-
eruption as measured by a mini-differential optical absorp-        tion forecasting or early-warning systems (Sparks, 2003).
tion spectroscopy (DOAS) scanner. Continuous carbon diox-          Nevertheless, many volcanic eruptions still occur without
ide (CO2 ) and temperature measurements conducted at a fu-         clear precursors, highlighting the need to further investigate
                                                                   the types of volcanoes generating such eruptions. For in-

Published by Copernicus Publications on behalf of the European Geosciences Union.
378                         A. Gaete et al.: Processes culminating in the 2015 phreatic explosion at Lascar volcano, Chile

stance, unexpected and sudden phreatic eruptions occurred          tic city of San Pedro de Atacama. Lascar is an andesitic–
in 1979 at the Diëng Plateau (Le Guern et al., 1982) and           dacitic stratovolcano that consists of two overlapping cones,
in 2014 at Mt. Ontake (Oikawa et al., 2016), killing 142 and       which are aligned ENE–WSW, and hosts five summit craters
64 people, respectively. Approximately 85 % of the phreatic        (Gardeweg et al., 1998) that partially overlap (de Zeeuw-
explosions that occur worldwide are not followed by the ex-        van Dalfsen et al., 2017). Activity of Lascar is characterized
trusion of magma (Barberi et al., 1992). Thus, the occurrence      by the continuous emission of volcanic gases, smaller steam-
of such surprising eruptions implies that the responsible pro-     driven explosions, the generation of thick lava flows and the
cesses and their scales are not easily detectable by conven-       expulsion of major ash-loaded clouds during the climax of
tional geophysical and geochemical instrumentation (Barberi        an eruption (Gardeweg et al., 2011).
et al., 1992). Volcano monitoring networks are commonly de-           The historical record of Lascar’s activity comprises ap-
signed to detect precursor activity at depth, where the move-      proximately 27 eruptions, almost half of which have occurred
ment of magma causes detectable gravity changes, seismic-          in the springtime (mid-September to mid-December; see Ta-
ity, deformation or degassing. Accordingly, eruptions that are     ble 1). The eruptions range from effusive to explosive events,
associated with very shallow processes, such as phreatic ex-       often with phreatic characteristics and the ejection of gas,
plosions, are naturally difficult to monitor beforehand, since     ash and debris kilometers high into the atmosphere. Addi-
water steam explosions may occur spontaneously, as was             tionally, dome building and collapse have been observed (for
identified during the phreatic eruptions at Bandai volcano         further details, see Table 1). The most recent large eruption
(Yamamoto et al., 1999), Mt. Ruapehu (Christenson et al.,          had a volcanic explosivity index (VEI) of 4 and occurred on
2010), Mayon volcano (Newhall et al., 2001), Aso volcano           19–20 April 1993 (González-Ferrán, 1995; Matthews et al.,
(Kawakatsu et al., 2000) and elsewhere (Barberi et al., 1992;      1997; Siebert et al., 2010). The 1993 eruption was identified
Mastin, 1995). Most of the aforementioned volcanoes exhibit        as the climax of a longer episode characterized by four cy-
a steep morphology, high elevations and/or hazardous access        cles of activity initiating in 1984; each cycle was separated
conditions, and hence establishing conventional monitoring         by explosive Vulcanian eruptions that commenced with mi-
systems close to their craters is a challenging task.              nor phreatic activity until the cycle eventually culminated
   Possible precursory signs of phreatic eruptions, if identi-     in a large explosion that ejected incandescent material into
fied, generally occur with short notice and may manifest as        the air and produced plinian to subplinian eruption clouds
seismic tremors (Martinelli, 1990), very long period (VLP)         (Matthews et al., 1997). By 1992, a lava dome was identified
events (Jolly et al., 2010), inflation (Nakamichi et al., 2009),   inside the active crater of Lascar; after the 1993 plinian erup-
and/or changes in the gas chemistry and temperature of fu-         tion, a new dome with an andesitic–dacitic composition grew
marolic emissions (de Moor et al., 2016) only minutes, hours       inside the crater (González-Ferrán, 1995). Smaller phreatic
or days prior to an eruption. The detection of such sudden         and Vulcanian eruptions followed in December 1993 and
changes requires monitoring by means of an instrument net-         February 1994. The short-lived explosive eruption in Decem-
work close to the summit that combines different geophysical       ber 1993 was accompanied by seismic activity with an inten-
and geochemical techniques (Scarpa and Tilling, 2012).             sity of 3 on the Modified Mercalli Intensity Scale (Global
   Lascar, Chile (23◦ 220 S, 67◦ 440 W, 5590 m), is a steep        Volcanism Program, 1994). In contrast, the seismic activity
volcano with relatively easy access that has repeatedly ex-        associated with the other eruptions was only scarcely felt in
hibited steam-driven explosions. The explosions at Lascar          the nearby village of Talabre at a distance of 17 km from Las-
have scarcely been studied, and therefore little knowledge         car (Global Volcanism Program, 1994), implying only low-
exists regarding whether these events are characterized by         magnitude seismicity. Following the 1993 eruptive cycle, his-
precursor activity. In an effort to better comprehend this         torical reports document explosions every 2–3 years on av-
hazardous type of eruption, a monitoring network was in-           erage (Table 1), with a frequent occurrence of steam-driven
stalled in 2010. A well-monitored volcanic explosion oc-           explosions. This kind of explosion commonly occurred with-
curred in 2015, which is discussed in detail in this paper.        out any evidence of precursor activity (e.g., seismicity), due
                                                                   to either the lack of precursors or the lack of a sufficiently
                                                                   dense deployment of instrumentation.
2   Study area and explosive history of Lascar volcano                This type of eruption is poorly understood for numerous
                                                                   potential reasons; among them, prior to 2010, ground-based
Lascar volcano, the most active volcano in northern Chile          monitoring studies were conducted only sporadically at Las-
and within the Andean Central Volcanic Zone (Francis and           car and were restricted to only short-term (weeks to months)
Rothery, 1987; Gardeweg et al., 1998; Tassi et al., 2009),         campaign-based fieldwork. Therefore, the preparation phases
formed in association with the subduction of the Nazca Plate       and periods preceding steam-driven explosions were not doc-
beneath the South American Plate (Jordan et al., 1983). This       umented with adequate instrumentation. Remote sensing, on
volcano is located in the Antofagasta region and lies ap-          the other hand, was able to provide evidence distinguish-
proximately 17 and 34 km from the small towns of Tal-              ing some unrest periods preceding notable events, such as
abre and Toconao, respectively, and 68 km from the touris-         the 2000 eruption, which was associated with a short-term

Nat. Hazards Earth Syst. Sci., 20, 377–397, 2020                            www.nat-hazards-earth-syst-sci.net/20/377/2020/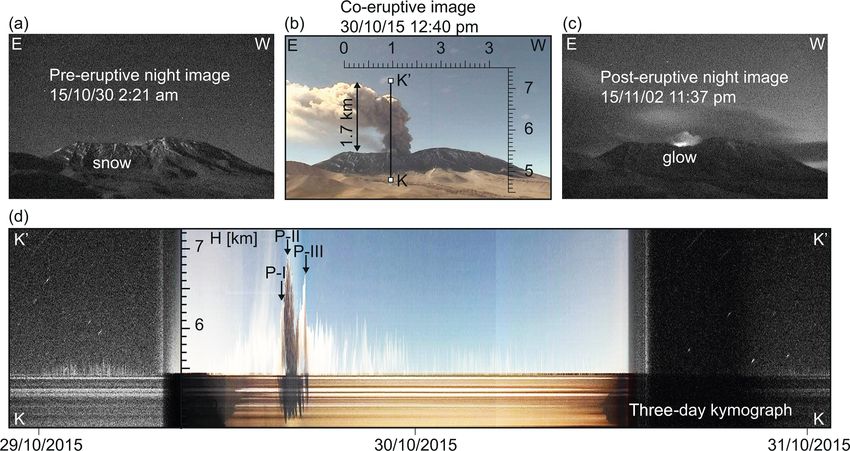
A. Gaete et al.: Processes culminating in the 2015 phreatic explosion at Lascar volcano, Chile                                                            379

Table 1. Historical record of activity at Lascar volcano (Global Volcanism Program, 2013; González-Ferrán, 1995; Siebert et al., 2010).

  Start         Duration            Type extrusion                                                       Explosive                                   VEI
  1902          –                   –                                                                    Y                                           2?
  9 Oct 1933    3 months            –                                                                    Y                                           2
  1940          –                   –                                                                    Y                                           2
  16 Nov 1951   3 months            –                                                                    Y                                           2?
  16 Jun 1954   1 month             –                                                                    N                                           2?
  16 Nov 1959   7 years, 2 months   –                                                                    Y – phreatic                                2
  16 May 1969   –                   –                                                                    N                                           1
  2 Jul 1972    –                   –                                                                    ?                                           2?
  16 Jul 1974   2 months            –                                                                    ?                                           1
  16 Dec 1984   7 months            dome building                                                        N                                           0
  14 Sep 1986   2d                  15 km ash column                                                     Y                                           3
  16 Nov 1987   2 years, 5 months   dome building and ash cloud                                          Y – phreatic                                3
  24 Nov 1990   1d                  1.5 km eruption columns                                              Y                                           1
  21 Oct 1991   7 months?           dome collapse, dark plume and ashfall                                Y                                           2
  30 Jan 1993   7 months            dome collapse, plinian column, bombs ejection and pyroclastic flow   Y – phreatic Strombolian explosions         4
  17 Dec 1993   2 months            dark-gray plume                                                      Y – phreatic                                2
  20 Jul 1994   6d                  dark and brown columns and small ashfall                             Y – Vulcanian activity                      2
  13 Nov 1994   8 months            vapor and ash plumes, black plume                                    Y – Vulcanian and small phreatic eruption   2
  18 Oct 1996   1d                  white-bluish vapor emission                                          Y                                           2
  20 Jul 2000   6 months            ash emission                                                         Y                                           2
  17 May 2001   2 months            –                                                                    N                                           –
  16 Oct 2002   2d                  1.5 km ash plume                                                     Y                                           2
  9 Dec 2003    1d                  fine ash from fumarole                                               ?                                           1
  4 May 2005    1d                  10 km ash cloud                                                      Y – Vulcanian eruption                      3?
  18 Apr 2006   1 year, 3 months    white-gray plumes and ash emission                                   Y – phreatic                                3
  2 Apr 2013    7 months            seismicity, glow and gray plume                                      Y                                           1
  30 Oct 2015   21 d                2.5 km ash plume variable seismicity                                 Y                                           2

reduction of thermal emission and a change in the dimen-                       the increase in long-period (LP) events preceding an eruption
sions of the dome area (Wooster, 2001). Similarly, satellite-                  (González et al., 2016).
based observations were employed to assess the dispersion                         Since the end of 2010, a volcano monitoring network has
of eruption products during the 2003 and 2005 unrest peri-                     been gradually deployed around Lascar, providing a reliable
ods (Aguilera et al., 2006; Viramonte et al., 2006); unfortu-                  database which allowed us to investigate the 2015 eruption.
nately, these studies lacked the ability to identify precursors.               In an attempt to better understand the most recent and un-
Matthews et al. (1997) proposed a continuous deepening of                      expected 2015 eruption, we compiled a multiparametric data
the crater floor associated with a high rate of degassing from                 set to study the details of the period preceding this eruption
fumaroles within the active crater; this deformation was de-                   and describe the processes associated with this event. Our
termined by an InSAR investigation (Pavez et al., 2006). Re-                   study also aspires to demonstrate why this type of volcanic
cent InSAR studies also showed that the deformation rate ap-                   hazard is generally so challenging to forecast.
peared to be largely unaffected by the most recent explosive
eruptions in 2013 and 2015 (Richter et al., 2018).
   Retrospectively, other studies have been able to iden-
                                                                               3    Data and analysis methods
tify precursory activity associated with unrest periods.
Wooster (2001) described the rapid cooling behavior of the
                                                                               Lascar has been monitored by a network consisting of broad-
Lascar dome as precursor activity following the 1993 erup-
                                                                               band seismometers, fixed cameras, permanent gas monitor-
tion, while a recent study of the 2013 explosion utilized
                                                                               ing equipment and a local weather station. Data from this
seismic wave interferometry to depict variations in the seis-
                                                                               network have been further complemented by satellite-based
mic velocity and consequently speculated about the pre-
                                                                               infrared observations and images of the crater acquired by an
eruptive deformation of a magmatic/hydrothermal reservoir
                                                                               unmanned aerial vehicle (UAV). The locations of all ground-
(González et al., 2016). A shallow hydrothermal system as
                                                                               based stations and the period analyzed in this study are il-
depicted by magnetotelluric and seismic data (Díaz et al.,
                                                                               lustrated in Fig. 1. The data treatment and analysis methods
2012; Hellweg, 2000) influences the degassing activity of
                                                                               implemented in this study focused on the temporal evolution
Lascar (Bredemeyer et al., 2018; Tassi et al., 2009). These
                                                                               of seismic volcano-tectonic (VT) and LP events, SO2 fluxes,
degassing processes have been suggested to be the source
                                                                               CO2 mixing ratios, and temperatures of fumarolic emissions
of the tremors observed during the 1994-1995 period of un-
                                                                               and changes in the brightness of these emissions, thermal
rest (Hellweg, 2000), and they are probably associated with
                                                                               changes in the crater, and changes in the surface features of

www.nat-hazards-earth-syst-sci.net/20/377/2020/                                            Nat. Hazards Earth Syst. Sci., 20, 377–397, 2020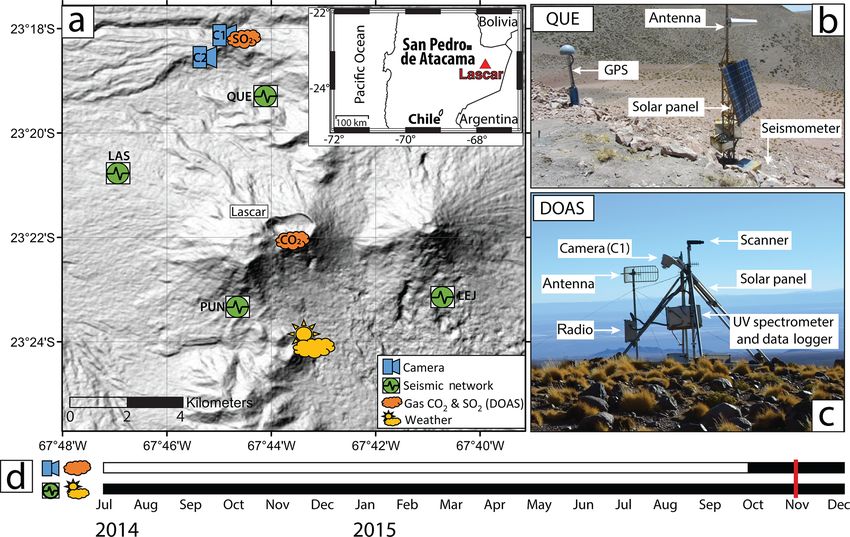
380                          A. Gaete et al.: Processes culminating in the 2015 phreatic explosion at Lascar volcano, Chile

Figure 1. (a) Locations of Lascar and the deployed equipment applied in this study. (b) Setup of the seismic station QUE. (c) Setup of the
camera (C1) and the mini-DOAS station to measure SO2 emissions. (d) Time bars depicting the period analyzed in this study for each data
set (shown in black). The red line indicates the eruption on 30 October.

the crater. The instrumentation, data and analysis methods             volcanic tremor (TR), hybrid (HB) and explosion (EX) sig-
are described in detail below.                                         nals (Chouet, 1996). For our analysis, we considered VT and
                                                                       LP events because they were the most abundant events that
3.1   Seismic monitoring                                               occurred during the pre-eruptive phase. Although QUE was
                                                                       the only operational station during October 2015, it provided
The network consists of five permanent seismic stations op-            clear signal records with a sufficiently high signal-to-noise
erated by the Observatorio Volcanológico de Los Andes del              ratio (Gaete et al., 2019) to distinguish VT and LP signals on
Sur (OVDAS), the national volcano observatory that contin-             the basis of their characteristic spectral contents. Based on
uously monitors over 40 active volcanoes in Chile. The OV-             these data, we visualized the temporal evolution and charac-
DAS stations are equipped with broadband REF TEK 151-                  terized the precursor VT events and the eruption signal. This
30A sensors and REF TEK 130B data loggers that record                  event analysis provided us with a fundamental overview of
ground motions at a sampling rate of 100 Hz. Four of these             the stage of activity at Lascar volcano. For a more in-depth
five stations were used to study the evolution of seismicity           seismic analysis, the reader is referred to Gaete et al. (2019).
in the period from July 2014 to December 2015, and their
locations are illustrated in Fig. 1. However, as three of these        3.2   Camera data
stations stopped functioning before October 2015, only one
seismic station was operational throughout the month of the
eruption and was useful for assessing the timing and charac-           Solar-powered time-lapse camera stations were installed at
teristics of the explosion, as well as for performing a simple         two fixed locations to take pictures of the volcanic edifice
event classification for October 2015 (station QUE; Fig. 1).           at regular time intervals. Cameras C1 and C2 look towards
   To investigate the evolution of seismicity at Lascar, we            the northern flank of Lascar. C1 is a streaming webcam oper-
used the entire available earthquake catalog from the vol-             ated by OVDAS and is programmed to capture images at an
cano observatory. The catalog was constructed by real-time             interval of one image every minute (768 px × 576 px resolu-
scanning following Lahr et al. (1994) through visual classifi-         tion). Camera C2 is a high-resolution digital single-lens re-
cation performed by OVDAS analysts. The volcanic signals               flex (DSLR) camera (2048 px × 1536 px resolution) installed
were classified according to their spectral content, harmonic          by the GFZ and takes images at an interval of 60 min. Data
signature, phase arrival times and event duration into one of          from C1 and C2 (see Fig. 1 for their location) were used to
six categories of signals observed at Lascar: VT, LP, VLP,             assess the height and duration of volcanic plumes using a

Nat. Hazards Earth Syst. Sci., 20, 377–397, 2020                                 www.nat-hazards-earth-syst-sci.net/20/377/2020/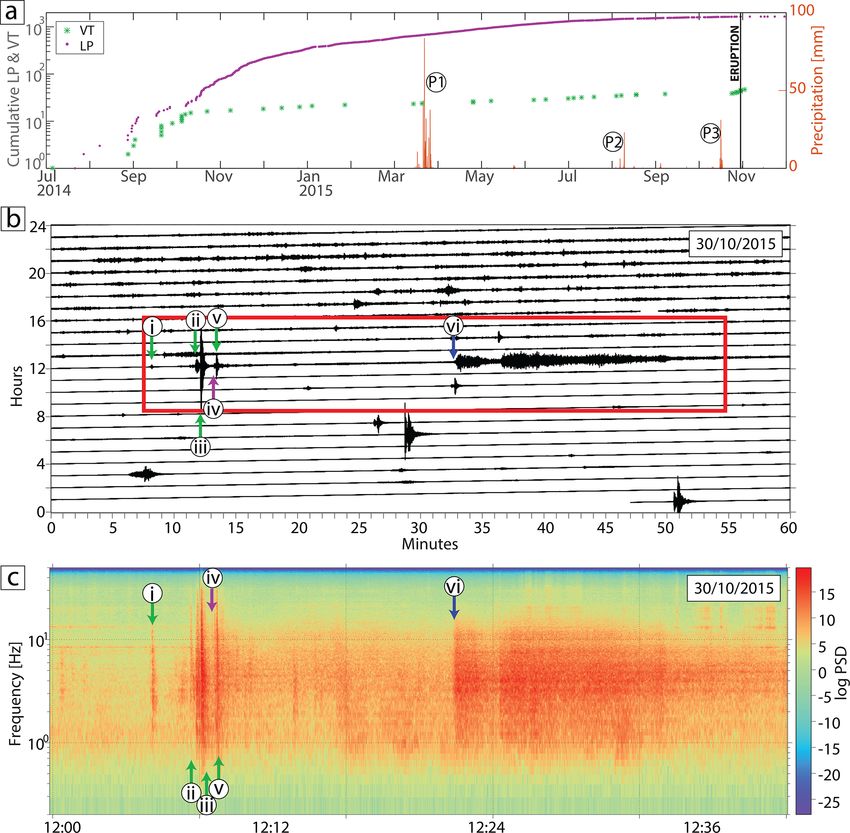
A. Gaete et al.: Processes culminating in the 2015 phreatic explosion at Lascar volcano, Chile                               381

kymograph in conjunction with pixel brightness analysis, as        3.3   Gas emissions
explained below.
   Vision-based techniques have revealed the value of video        Measurements of the CO2 concentration and gas tempera-
data in a variety of applications, such as in smoke and fire       ture were conducted at a low-temperature fumarole on the
detection (Çetin et al., 2013; Healey et al., 1993; Verstockt et   southeastern crater rim of Lascar volcano (Fig. 1). The gas
al., 2009). Camera-based monitoring networks have similarly        temperature was monitored by means of thermocouples us-
become useful for observing plumes, lava movement and the          ing an industrial platinum resistance temperature detector
ejection of particles during an eruptive episode (Brook and        (RTD, PT 100, Labfacility, UK), and the CO2 concentration
Moore, 1974; Chouet et al., 1974); in particular, the use of       was measured by means of a Vaisala CARBOCAP® Car-
camera-based networks has increased dramatically in many           bon Dioxide Probe (GMP343, Vaisala Oyj, Finland). The
fields of volcano research since the image quality and means       data from both sensors were recorded at 1 min intervals
of data transmission are continuously improving, thereby al-       with an ADL-MX Advanced Datalogger (Meier-NT GmbH,
lowing nearly continuous monitoring (Orr and Hoblitt, 2008;        Germany). The analog digital converter has an accuracy of
Paskievitch et al., 2006; Salzer et al., 2016; Walter, 2011).      0.01 %.
Water vapor is the major component of gases emitted from              The CO2 sensor, which has an accuracy of ±5 ppm, was
volcanoes, and the brightness of a volcanic plume has been         successfully used in Chile in a previous study to correlate
shown to increase with the upwelling of new magma (Girona          volcanic activity with atmospheric changes (Zimmer et al.,
et al., 2015). To analyze the pixel brightness and variations in   2017). The temperature sensor, which can be applied in a
gas plumes, we applied a correction using digital image cor-       range between −50 and +450 ◦ C at an accuracy of ±0.06 ◦ C,
relation to ameliorate the shaking of the camera due to strong     was inserted to a depth of ∼ 35 cm into the fumarole. Resid-
winds. Subsequently, we applied a masking operation to gen-        ual temperatures were calculated by subtracting the mean
erate an image containing only the gas plume (see Fig. S1).        temperature from the actual reading.
Each of these images was converted to grayscale and then              Additionally, SO2 emission rates were remotely monitored
transformed into a matrix, the elements of which represent         using a scanning mini-differential optical absorption spec-
the intensity values. We summed these matrix elements and          troscopy (DOAS) station deployed by OVDAS 6.75 km north
normalized the values by the matrix size to compute the to-        of the active crater (Fig. 1); the mini-DOAS station yielded
tal brightness of one image. The results provided a measure        one complete scan across the gas plume every 5–15 min de-
of the pixel brightness variations occurring within the gas        pending on the light conditions.
plume at Lascar volcano. To analyze 2 months of data, we              SO2 slant column densities (SCDs) along the viewing
utilized daily images captured at noon, which is when the          direction of the mini-DOAS scanner were retrieved in the
visibility of the gas plume is the clearest and the position       wavelength range of 310–325 nm by means of DOAS (Galle
of the sun is constant. To perform a more detailed analysis,       et al., 2010; Platt and Stutz, 2008); the spectra measured in-
we used images produced every hour. The pixel brightness           side the gas plume were compared with a gas-free spectrum
can provide a useful visual constraint on the activity state       and the pixel-wavelength-calibrated SO2 absorption spec-
of a volcano, even though the brightness alone may depend          trum from Vandaele et al. (1994), which was convolved with
strongly on the position of the sun, presence and strength of      the slit function of the spectrometer. Furthermore, we incor-
condensation, and atmospheric conditions.                          porated an O3 absorption spectrum (Voigt et al., 2001) and
   We further performed kymograph analysis by extracting           a ring spectrum in the DOAS fit to avoid interference with
the RGB values along a vertical line across the center of          absorption by ozone and scattering effects. Plume transport
the volcano and displaying these values in a time series plot      velocities and plume altitudes, which are required to calcu-
with a data point every minute. The coloration, timing, dura-      late the gas flux from SO2 SCD profiles, were estimated us-
tion, and height of discrete gas emission pulses and eruption      ing the wind speeds derived from archived weather data pro-
columns can be visualized with kymographs created in this          vided by the National Oceanic and Atmospheric Administra-
fashion, and thus they have already been extensively used for      tion’s (NOAA) Global Forecast System and using informa-
the analysis of volcano video data in previous investigations      tion obtained from pictures taken by the time-lapse cameras,
(e.g., Munoz-Saez et al., 2015; Witt and Walter, 2017). A ge-      respectively. The direction of plume transport was further de-
ometric conversion from the pixel scale to the meter scale         termined by means of triangulation using the SCD profiles in
was performed using the high-resolution Pleiades-1 digital         combination with plume height estimates.
elevation model presented by Richter et al. (2018). Due to the
large distance from the cameras to the active volcano crater       3.4   Thermal anomalies
(6.75 and 6.42 km for C1 and C2, respectively), we applied
a constant scaling factor to all pixels; thereafter, distortions   To investigate thermal anomalies, we used satellite images
arising from the lens, camera sensor or field of view were not     acquired by Sentinel-2, an Earth-observation satellite from
considered.                                                        the European Unions (EU) Copernicus program. Sentinel-2
                                                                   was launched on 23 June 2015 and became operational later

www.nat-hazards-earth-syst-sci.net/20/377/2020/                             Nat. Hazards Earth Syst. Sci., 20, 377–397, 2020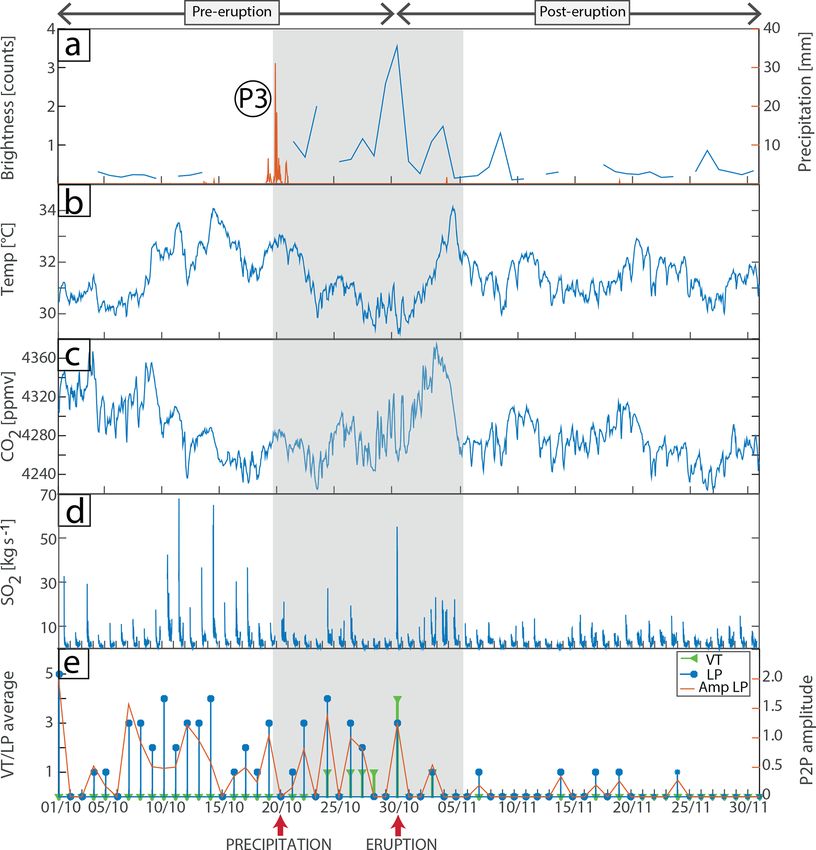
382                         A. Gaete et al.: Processes culminating in the 2015 phreatic explosion at Lascar volcano, Chile

in 2015; since August 2015, it has systematically acquired         tation at a sampling rate of one measurement per minute. The
imagery of Lascar volcano at a high spatial resolution (up         data acquisition was temporally synchronized by means of a
to 10 m). Sentinel-2 acquires multispectral data comprising        Global Positioning System (GPS) device, and the data were
13 bands in the visible, near-infrared and shortwave infrared      collected in the field by a Wi-Fi network and transmitted both
range of the electromagnetic spectrum. In this study, we uti-      to GFZ in Germany and to OVDAS in Chile.
lized bands from the near-infrared part of the spectrum to            We considered the intensity and accumulated amount of
ascertain the variations in the appearance and dimensions of       precipitation measured in a 1 min running average of rain
the thermal anomaly inside the currently active crater of Las-     and hail derived from samples acquired every 10 s. The rain-
car.                                                               fall is measured as the cumulative amount of water impact-
   Here, we processed the Sentinel-2 data using the SNAP           ing on a 60 cm2 collecting area with a measurement range of
toolbox (S2TBX), which is freely provided by the European          0 to 200 mm h−1 , whereas hail is measured as the cumulative
Space Agency (ESA), and we used the 12-11-8A band com-             amount of hits against the collecting surface. This instrument
bination to derive a false-color RGB image representing the        is not designed to measure snowfall. The data were compared
apparent temperature of the ground. These bands allow the          with the other observations to identify a rare precipitation
perimeter of the thermal anomaly located inside the Lascar         event shortly before the 2015 explosion.
crater to be mapped and further reveal the presence (or ab-
sence) of snow at the volcano summit.
                                                                   4     Results
3.5   Aerial photography
                                                                   First, we describe the gradual changes leading up to the erup-
UAVs were employed to obtain high-resolution nadir pho-            tion; second, we document the changes associated directly
tographs of the Lascar crater, which is partially hidden from      with the eruption; and, finally, we discuss the data retrieved
the human eye by the rim of the crater. Due to the high            in the aftermath of the eruption.
elevation of the volcano (> 5500 m), the first successful
drone flight, that is, the first drone that did not crash, was     4.1    Gradual changes prior to the eruption
launched in November 2017. The motivation of this over-
flight was to determine the morphological features of the ac-      We analyzed the seismic catalog over the period from
tive Lascar crater. We used a DJI Mavic Pro Platinum quad-         July 2014 to December 2015 to obtain an overview of the
copter drone equipped with a 12 MP cropped-sensor cam-             activity preceding the eruption at Lascar (Fig. 2a). In total,
era (4000 px × 3000 px 35 mm focal length, ISO 100), which         1654 LP events (purple dots in Fig. 2a) and 47 VT events
was programmed to take images at an interval of 2 s, and the       (green stars in Fig. 2a) were identified during this observa-
flight speed was 5 m s−1 . The drone was launched from the         tion period. A gradual increase in the number of LP events
southern rim of the active crater at 5502 m a.s.l. (above sea      started in October 2014, i.e., approximately 1 year before the
level), after which it was flown to an altitude of 5700 m a.s.l.   eruption. This increase in LP events was not associated with
and then over the crater in a northerly direction. From the        any relevant changes in the VT event rate. The peak in the
250 drone images acquired during the flight, we constructed        LP event rate was found during April–July 2015, i.e., approx-
a photomosaic and a hillshade using the structure from mo-         imately 3–6 months before the eruption. In these months,
tion (SfM) workflow implemented in the Agisoft Metashape           the LP activity declined from ∼ 11 events to ∼ 1 event per
Professional software package. Over 20 000 tie points were         day. At the same time, the persistent thermal anomaly on the
identified for image matching, allowing us to generate a           crater floor observed in the Sentinel-2 imagery gradually de-
dense cloud consisting of over 7 million points; from this         creased in both size and intensity (Fig. 3a and c), confirming
point cloud, a digital elevation model with a 20 cm resolution     an apparent decrease in thermal activity.
and an orthomosaic map with a 7 cm resolution were pro-               Precipitation is rare in this desert area with an annual aver-
duced. As no ground control could be obtained, we relied on        age below 100 mm (Messerli et al., 1993). Nevertheless, from
the geolocations of the DJI geotagged camera images only,          the continuous precipitation records recorded at the weather
leading to an apparent image error estimate of 0.6–1.3 m and       station situated at the base of the volcano, we observed three
a total error of 1.25 m.                                           precipitation events occurring in the period analyzed in this
                                                                   study (P1–P3, Fig. 2a). All three precipitation events were
3.6   Weather data                                                 associated with abundant snowfall as was observed by our
                                                                   cameras. Our weather station detected considerable amounts
Hydrometeorological conditions were monitored by a                 of precipitation (rain, hail) during events P1 and P2, which
weather station (Vaisala WXT520) located at the base of the        occurred in the middle (March 2015) and end (August 2015)
volcano (Fig. 1); this station recorded the atmospheric pres-      of the increasing LP activity phase, respectively. The same
sure and temperature conditions, wind direction, wind speed,       was true for event P3, which occurred from 19 to 21 Oc-
humidity, and intensity and accumulated amount of precipi-         tober 2015 with 112 mm of accumulated precipitation and

Nat. Hazards Earth Syst. Sci., 20, 377–397, 2020                             www.nat-hazards-earth-syst-sci.net/20/377/2020/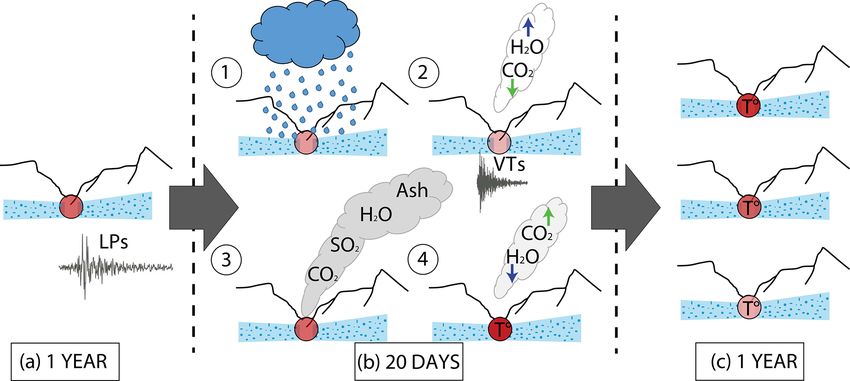
A. Gaete et al.: Processes culminating in the 2015 phreatic explosion at Lascar volcano, Chile                                            383

Figure 2. (a) Temporal evolution of seismicity characterized by LP (purple dots) and VT (green stars) events, and precipitation events from
July 2014 to December 2015. Cumulative LP events show a permanent increase starting 1 year before the eruption and a slight decrease
3 months before the eruption. VT events do not show any evolution pattern but cluster around the eruption. P1–P3 represent three exception-
ally strong precipitation events that occurred during the study period; P3 is the suggested trigger of the eruption. (b) Seismic record from
30 October 2015. The red box indicates the window covered in (c) and shows the VT (i, ii, iii, v green arrows) and LP events (iv purple
arrow) preceding the eruption and the eruption signal (vi blue arrow). (c) Spectrogram depicting the frequency band covered by the VT and
LP events as well as the eruption tremor. The events that occurred early in the morning outside the red box in (b) are regional tectonic events
located more than 100 km away from the volcanic area; therefore, there is no certainty that they could have affected the volcanic system.

reached 13 mm h−1 on 20 October 2015, only 10 d before                    the event P3, the pixel brightness suddenly increased, indi-
the eruption. The latter precipitation event was forecasted by            cating the presence of abundant condensed water within the
the Chilean meteorology agency, prompting an emergency                    gas plume on 21 October 2015 (Fig. 4a), and the maximum
alert on 18 October from the Chilean National Emergency                   pre-eruptive peak was reached on 23 October 2015. These
Office (ONEMI) due to the severe weather warning through-                 findings were confirmed upon closer inspection of the hourly
out the entire region of Antofagasta. Indeed the maximum                  variations in the brightness (Fig. S2), and the maximum value
level of precipitation that was recorded in the Andes was ob-             was revealed to be 4 times the normal state. Figure S2 also
served in the first 12 h of 19 October 2015 (ONEMI, 2015).                displays the daily cyclic fluctuations of the pixel brightness;
   Events P1 and P2 did not lead to detectable changes in                 these fluctuations were confirmed through visual analysis of
volcanic activity. In contrast, event P3 entailed a pronounced            the height and brightness of the plume in Fig. 5d, in which
increase in plume visibility, as reflected by the strongly en-            a stronger signal is observed during the morning hours be-
hanced pixel brightness in the atmospheric column above the               fore transitioning to a slight manifestation of the plume in
active crater. Thus, focusing our analysis of the daily changes           the afternoon.
of the plume to 1 month before and after the eruption on                     Furthermore, the temperature of the fumarolic gas emis-
30 October 2015, we observed low pixel brightness varia-                  sions clearly dropped from 33 to 29.2 ◦ C, and some slight
tions during the pre-precipitation phase (Fig. 4a). Just after            variations were evident in the CO2 concentration after pre-

www.nat-hazards-earth-syst-sci.net/20/377/2020/                                     Nat. Hazards Earth Syst. Sci., 20, 377–397, 2020
384                          A. Gaete et al.: Processes culminating in the 2015 phreatic explosion at Lascar volcano, Chile

Figure 3. Satellite thermal anomalies (high temperatures are shown in red, while cold temperatures and snow are shown in blue) retrieved
from Sentinel-2. The availability of data is irregular in 2015, but the data show a gradual decrease in the thermal anomaly in August 2015
and a later increase in the thermal anomaly on 6 December 2015, followed by a gradual decrease. Note that between 28 August 2015 and
6 December 2015 no clear Sentinel-2 images were acquired. (g) shows the thermal anomaly during the time of our UAV field campaign
shown in Fig. 7. Data provided by the European Space Agency (ESA).

cipitation event P3; both of these trends seemed to be in-             sion expelled an ash plume that rose to approximately 1.7 km
significant with respect to the amplitude variations in the            above the crater and then drifted towards the northeast, as re-
long-term trends of their corresponding time series (Fig. 4b           vealed by the webcam and kymograph (Fig. 5b).
and c). Similar to the fumarolic temperature, the SO2 emis-               Approximately 25 min before the explosive eruption, a
sion rates during October decreased from an average of                 cluster of four VT events was recorded within a 5 min time
4.14 kg s−1 SO2 in the period prior to event P3 to merely              window (Fig. 2b). These VT events lasted for less than 10 s
2.33 kg s−1 SO2 in the 8 d following event P3 (Fig. 4d). A             each, and the corresponding signals displayed characteris-
renewed pulse of VT events began on 23 October and con-                tic frequencies in the range from 1 to 30 Hz. The eruption
tinued during the following days until the eruption, whereas           was characterized by the sudden onset of a harmonic tremor
LP events continued to follow the declining trend observed             signal that lasted for approximately 50 min, with the most
in the preceding 3 months (Fig. 4e).                                   energetic phase occurring during the first 20 min (Fig. 2b
                                                                       and c). This signal was characterized by a frequency content
4.2   The phreatic eruption on 30 October 2015                         between 1 and 10 Hz and a dominant frequency of 4 Hz. The
                                                                       eruption signal featured two parts, and the transition between
The phreatic eruption that occurred on 30 October 2015 was             the two seems to indicate two phases (Fig. 2c). The first part
reported at 09:32 LT (local time) (12:32 UTC); the explo-

Nat. Hazards Earth Syst. Sci., 20, 377–397, 2020                                 www.nat-hazards-earth-syst-sci.net/20/377/2020/
A. Gaete et al.: Processes culminating in the 2015 phreatic explosion at Lascar volcano, Chile 385 Figure 4. Two months of daily variations shown in multiparametric plots of data. (a) Brightness (blue curve) of the fumarole computed at noon and precipitation event P3 (orange curve for P3; see Fig. 2), (b) fumarole (blue) temperature, (c) CO2 mixing ratio, (d) SO2 emission rate (note that the data show a peak during the eruption), and (e) VT and LP seismic-event average and LP peak-to-peak amplitude (orange curve). Precipitation event P3 and day of eruption are indicated with arrows at the bottom. The shaded box indicates the period covered from the onset of precipitation event P3 to a few days after the eruption, during which high variability was observed in the gas plume and seismicity. of the eruption signal lasted for 5 min and decreased strongly considerably from 200 to 650 ppmm (parts per million me- both in amplitude and in energy during the last 2 min. The ters) approximately 15 min before the eruption and reached second part lasted for approximately 10 min and was char- a maximum of 766 ppmm approximately 5 min in advance acterized by a modulation, i.e., a slowly decreasing ampli- of the ash emissions (Table S1 in the Supplement). Thus, tude (Fig. 2b and c). Throughout the remaining 30 min of the the four VT events that occurred between 25 and 20 min eruption, the tremor exhibited a low energy and amplitude. before the eruption were almost immediately followed by The phreatic eruption was accompanied by a degassing a vigorous increase in degassing activity. Subsequently, the pulse, which was reflected by an 8-fold increase in the SO2 SO2 flux reached a second maximum of 44.38 kg s−1 at emission rate (Figs. 4d and 5d). The average SO2 emis- 10:05 LT (13:05 UTC), approximately 32 min after the on- sion rate was 6.76 kg s−1 during the morning hours prior set of the eruption, and then gradually declined until it to the eruption event, and the first SO2 emission peak of eventually returned to its pre-eruptive value of 6.7 kg s−1 at 55.14 kg s−1 was reached at 09:26 LT (12:26 UTC), which 10:59 LT (13:59 UTC), i.e., approximately 29 min after the was approximately 6 min prior to the onset of the phreatic eruption tremor ceased. The corresponding SO2 SCDs simi- explosion. The corresponding optical SO2 densities in the larly reached a second maximum of 650 ppmm concurrently plume center (i.e., the SO2 concentrations along the view- with the fluxes before gradually diminishing to usual val- ing direction of the mini-DOAS scanner) started to increase ues. In contrast, the CO2 concentration and temperature of www.nat-hazards-earth-syst-sci.net/20/377/2020/ Nat. Hazards Earth Syst. Sci., 20, 377–397, 2020
386                           A. Gaete et al.: Processes culminating in the 2015 phreatic explosion at Lascar volcano, Chile

Figure 5. Camera data analysis allowing the eruption duration and height to be estimated from a camera looking from north to south (C1; see
Fig. 1 for location). (a) Pre-eruptive nighttime image (29 October 2015, at 23:21 UTC) of the snow-covered edifice. Local time is given in the
image. (b) Co-eruptive daytime image (30 October 2015, at 15:40 UTC) with a 1.7 km high ash-loaded eruption column. (c) Post-eruptive
image (3 November 2015, at 02:37 UTC) showing increased glow. (d) Three-day kymograph extracted from 2880 images along vertical
profile K − K 0 (see vertical line in b); the height scale (H ) is shown in kilometers above sea level. P-I, P-II and P-III are the three phases
exhibited by the eruptive plume.

the summit fumarole abruptly decreased from respective val-               4.3    Post-eruptive observations
ues of 4320 ppm CO2 and 31.2 ◦ C, in the evening hours of
29 October; reached local minima of 4250 ppm CO2 and
                                                                          The seismic, thermal and degassing anomalies detected
29.2 ◦ C throughout the duration of the eruption; and subse-
                                                                          shortly before and during the 30 October 2015 eruption very
quently increased again to 4320 ppm CO2 and 30.8 ◦ C in the
                                                                          quickly returned to their background levels. For instance, the
evening hours of 30 October (Fig. 4b and c). The co-eruptive
                                                                          number of LP seismic events per day decreased to few or
CO2 minimum was further accompanied by a pixel bright-
                                                                          no events and displayed a very low peak-to-peak amplitude
ness peak, exhibiting the presence of condensed water in the
                                                                          (Figs. 2a and 4e). The Sentinel-2 data show a hot spot cen-
eruptive plume (Fig. S2); this dynamic is a recurrent feature
                                                                          tered in the active crater and that the size and intensity of
in the entire period illustrated in Fig. S2.
                                                                          the surface thermal anomaly on the crater floor had increased
   A strong steam signal was observed in the two cameras
                                                                          in the first acquisition after the eruption (recorded on 6 De-
beginning early in the morning of 30 October, as was also
                                                                          cember 2015; Fig. 3d). This initial high temperature of the
depicted by kymographic analysis (Fig. 5d). A cyclic daily
                                                                          crater floor is also reflected by the camera images showing a
variation in the steam plume, which decayed in height and
                                                                          glow at night after the eruption (Fig. 5c). The dimensions
intensity from late morning to afternoon, was evident. Dur-
                                                                          and strength of the thermal anomaly slowly declined dur-
ing the explosion, the plume turned gray and exhibited three
                                                                          ing 2016, as observed in the Sentinel-2 data (Fig. 3e–h). By
phases based on changes in the color and altitude. At the
                                                                          the end of 2017, the thermal anomaly had returned to lev-
start of the eruption, there was a short lapse when the plume
                                                                          els approaching those observed prior to the 2015 eruption
was light gray and reached ∼ 6.3 km a.s.l. (P-I in Fig. 5d).
                                                                          (Fig. 3i and k).
This phase was followed by the main eruptive phase, during
                                                                             The gas data from the monitored fumarole on the crater
which a dark-gray and taller plume (∼ 7 km a.s.l.) with a high
                                                                          rim displayed pronounced changes. We first found an in-
ash content was expelled (P-II in Fig. 5d). These two pulses
                                                                          crease in the temperature from 29.2 to 34.2 ◦ C in the 3 d
were associated with the two parts we observed in the erup-
                                                                          after the eruption until 2 November 2015 and an increase
tive tremor signal described above. The final phase consisted
                                                                          in the CO2 concentration from 4250 to 4370 ppm until
of an isolated light-gray pulse that reached ∼ 6.7 km a.s.l. (P-
                                                                          5 November 2015, both of which gradually approached
III in Fig. 5d). This third pulse seems to stand alone, and no
                                                                          background levels again ∼ 5 d after the eruption (Fig. 4b
change in the seismic signal was registered in this regard.
                                                                          and c). According to an analysis of the camera bright-
                                                                          ness, the degassing also gradually returned to its background
                                                                          level by 9 November 2015, when it dropped to usual pre-
                                                                          precipitation values (Fig. 4a). The SO2 fluxes during the pe-
                                                                          riod of 2–5 November 2015 were measured at an average of

Nat. Hazards Earth Syst. Sci., 20, 377–397, 2020                                    www.nat-hazards-earth-syst-sci.net/20/377/2020/
A. Gaete et al.: Processes culminating in the 2015 phreatic explosion at Lascar volcano, Chile 387
4.42 kg s−1 and were therefore slightly higher than the aver- by a reduction in the apparent temperature anomaly located
age (2.32 kg s−1 ) during the entire post-eruptive period con- inside the active crater (Fig. 3a–c), which was likely associ-
sidered here (31 October to 31 November 2015) (Fig. 4d). ated with a general decline in fumarole activity. Similar de-
Our UAV overflight performed on 27 November 2017 re- creases in the area and intensity of hot spots have previously
vealed the presence of a circular feature located at the base been observed preceding certain eruptions, such as those oc-
of the deep crater floor with a diameter of ∼ 57 m and partly curring in the periods 1992–1995 and 2000–2004 (see Ta-
covered by rockfall deposits from the crater walls (Fig. 7a ble 1), which were interpreted to be associated with a seal-
and c). The circular feature on the crater floor may repre- ing of the degassing path due to crater subsidence (González
sent the surface expression of the underlying conduit and/or et al., 2015; Wooster and Rothery, 1997). The details of our
the remnants of a dome-like protrusion of magma, with a findings, the limitations and interpretations of this study, and
mound-like outline, morphology and blocky appearance at a conceptual model are discussed below.
the surface. We compared the location of the circular fea-
ture to a Sentinel-2 map acquired during the 2015 erup- 5.1 Water infiltration into the hydrothermal system of
tion, and good agreement was observed between the region Lascar
covered by blocky material and the thermal anomaly region
(Fig. 7a and b). Close-up views enabled by high-resolution Different processes may drive phreatic eruptions; for exam-
drone photogrammetry further revealed the presence of a lin- ple, magma may intrude wet sediments and aquifers, lava
ear structure oriented NE–SW dissecting this circular fea- or pyroclastic flows may interact with surface water, or
ture but not dissecting the apparently younger rockfall de- hydrothermal systems may form during periods of repose
posits (Fig. 7d). The explosive dissection of crater floors and (Barberi et al., 1992; Rouwet et al., 2014). Moreover, evi-
lava domes by linear structures has been observed elsewhere dence that precipitation can trigger volcanic activity has also
following steam-driven explosions (Darmawan et al., 2018a; been documented, such as the dome collapse at Soufrière
Walter et al., 2015). Therefore, we speculate that the linear Hills volcano, Montserrat (Carn et al., 2004; Matthews et
NE–SW-striking structure developed during the 2015 steam- al., 2002); a seasonal response of seismic velocity (Sens-
driven explosion of Lascar volcano. Schönfelder and Wegler, 2006); the increase in seismicity
associated with the precipitation-influenced degassing pro-
cess at Merapi volcano (Richter et al., 2004); and possible
5 Discussion phreatic eruptions that induce dome collapse (Darmawan et
al., 2018a).
The steam-driven explosive eruption of Lascar on 30 Octo- The hydrothermal system of Lascar has previously been
ber 2015 was the first to be densely monitored. The erup- extensively studied (Menard et al., 2014; Tassi et al., 2009).
tion was studied by utilizing different data sets, the results of Gas emissions occurring at the crater floor have been pre-
which suggest that (i) no magma movements within a shal- viously characterized by the discharge of fluids fed by a
low magma reservoir were identifiable immediately prior to deep magmatic source. Lascar hosts an extended hydrother-
the explosion although significant changes in degassing ac- mal system feeding the fumaroles located on the inner crater
tivity were observed and (ii) the spontaneous steam-driven walls and the upper rim of the crater (González et al., 2015).
explosion was directly associated with a brief degassing The gas emissions from these fumaroles show an increasing
pulse and the development of a fractured circular feature on hydrothermal chemical signature with increasing distance
the crater floor. We ascertained that the volcano was in an from the magmatic body. Therefore the hydrothermal sys-
elevated stage of activity, as the steam explosion was pre- tem encompasses a central magma-dominated system and a
ceded by ∼ 1 year of enhanced LP seismic activity, thus fa- peripheral meteorically dominated system which is suscepti-
voring a potential gradual pressure buildup within the shal- ble to interactions with meteoric water added to the system
low volcanic system. However, as the seismic activity gradu- (Tassi et al., 2009). Our study supports a link between these
ally declined approximately 4 months prior to the explosion two systems, as we show evidence that fumarole measure-
(Fig. 2a), a direct and causal relationship is debatable. Nev- ments taken on the outer crater rim display changes related
ertheless, similar long-term trends in LP activity have been to both the precipitation event and the steam-driven explo-
observed prior to eruptions of Mt. Etna, where variation in sion that occurred deep in the crater (see Sect. 5.4). There-
the trends was associated with replenishment with gas-rich fore the outer and inner hydrothermal systems appear to be
magma (Patanè et al., 2008). If this was also the case at Las- dynamically linked, either to eruption occurrences or to pre-
car, this would imply a considerable input of deep gas/fluid cipitation events, or to both as our study suggests (see also
into the system and that the release of this gas/fluid may Fig. 6). This finding has important implications, as monitor-
eventually have been obstructed by a reduction in permeabil- ing the outer system, which is easy to access, may indirectly
ity of the degassing path in response to precipitation (Heap et reflect the inner hydrothermal system.
al., 2019), increasing the pressure in the volcanic system. We Nevertheless, we note that the historic activity of Lascar
noticed that this decline in seismic activity was accompanied provides evidence for at least six phreatic eruptions and that
www.nat-hazards-earth-syst-sci.net/20/377/2020/ Nat. Hazards Earth Syst. Sci., 20, 377–397, 2020388 A. Gaete et al.: Processes culminating in the 2015 phreatic explosion at Lascar volcano, Chile
and snow cover was still visible even after 10 d. The precipi-
tation associated with the P3 event likely percolated into the
shallow hydrothermal system, triggering a phreatic explo-
sion during a period of low seismic activity. Similarly, major
explosive eruptions elsewhere have not necessarily occurred
during peak volcanic activity and maximum precipitation but
occurred during a period when the deep percolation of water
was no longer inhibited by lava extrusion (Darmawan et al.,
2018b).
Our analysis of different data sets over the 1 month prior to
the eruption and the 1 month after the eruption allowed us to
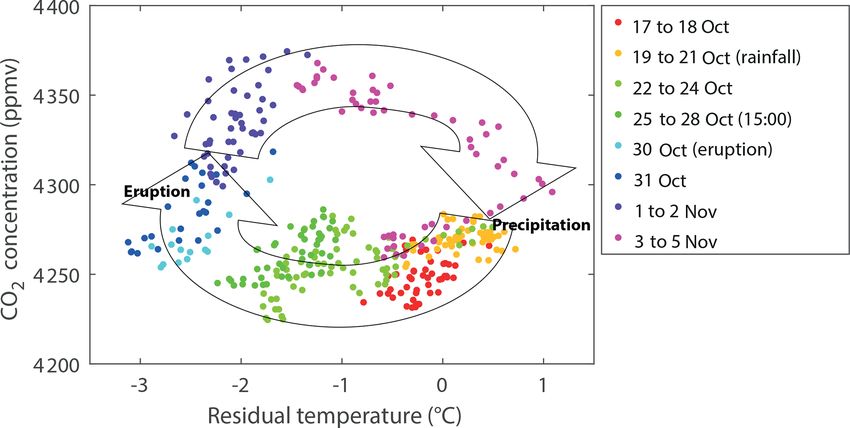
Figure 6. Evolution plot of the CO2 mixing ratio versus the gas recognize precursory anomalies in the VT seismicity and the
temperature measured at a Lascar fumarole from 17 October to brightness of the volcanic plume; these anomalies led us to
5 November 2015. The distinctively colored dots represent key suggest a relationship with the precipitation of event P3. The
stages in the evolution of these parameters characterized by a clock- maximum pre-eruptive brightness was followed by the reac-
wise behavior. This cyclic behavior was induced by precipitation
tivation of VT activity, which was delayed by 1 d, and was
event P3 (19–21 October; orange dots), causing (1) the gas outlet
temperature to decrease following the rainfall event and (2) the CO2
accompanied by continuous fumarole cooling in response to
mixing ratio and outlet temperature to gradually rise after the erup- the infiltration of external water; during this period, the cool-
tion (30 October; cyan dots). The cycle closes during the period of ing rate and depth of penetration were correlated with the
3–5 November (magenta dots), during which the CO2 concentration amount of precipitation and soil cracks (Zimmer et al., 2017).
and gas outlet temperature returned to their pre-eruptive values. Phreatic volcano explosions typically occur without any
precursors (Stix and de Moor, 2018). These types of erup-
tions are similarly believed to occur without precursors
approximately 50 % of all recorded eruptions occurred in the at Lascar, a volcano with frequent and well-documented
period from mid-September to mid-December possibly fol- phreatic explosions. Two different endmembers of phreatic
lowing precipitation events (Table 1), thereby showing a pos- eruptions have been identified by Stix and de Moor (2018):
sible seasonal dependence similar to that observed elsewhere those associated with a deeper hydrothermal system (type 1)
in the Andes (Bredemeyer and Hansteen, 2014; Mason et and those associated with a near-surface hydrothermal sys-
al., 2004). Likewise, the October 2015 eruption falls within tem (type 2) that also includes surface waters. Lascar vol-
this period and occurred only a few days after a precipitation cano is known for its lively history of violent hydrothermal
episode. Another seasonality effect of volcano eruptions was explosions, and our observations suggest that the 2015 erup-
also inferred in Iceland, where most large eruptions occur tion was a type-2 phreatic explosion according to the Stix
during spring and summer periods (Albino et al., 2010). and de Moor (2018) classification scheme. Thus, we discuss
Furthermore, we note that, in our observation period, a possible trigger for this event due to the infiltration of me-
two other precipitation events occurred in March and Au- teoric water through cracks produced by subsidence of the
gust 2015 (P1 and P2, respectively, Fig. 2); event P1 was crater floor. This liquid water was stored at shallow levels
larger than any other precipitation event in that year and oc- and vaporized by hot rocks, which led to the explosion.
curred during a period of high (or even peak) seismic activity A short-term increase in VT activity was observed in di-
at Lascar. Why this event with such considerable precipita- rect association with the eruption, after which the VT activity
tion did not trigger a phreatic explosion and why it was not rapidly declined. The absence of VT events from the record
associated with any other changes in degassing or VT seis- almost 2 months prior to the eruption suggests that the event
micity remain puzzling. However, our study shows that the that occurred on the 24th and those that occurred through-
explosive eruption at Lascar occurred during a phase of crater out the following days were signs of fracturing caused by
floor subsidence that was identified by InSAR (Richter et al., an increase in pressure following the percolation of mete-
2018); thus, a possible explanation may lie in the timing of oric water into Lascar’s hydrothermal system. For example,
event P3. VT events preceded the 2007 phreatic eruption of Mount On-
Event P3 was associated with 112 mm of accumulated pre- take, Japan (Kato et al., 2015), which was associated with the
cipitation over 3 d, which is comparable to the average pre- infiltration of hot fluids from the hydrothermal system. At
cipitation of 100 mm yr−1 typically observed, for example, at Lascar, the short-term increase in VT activity occurred dur-
the ALMA observatory (over 5000 m a.s.l. and 40 km north ing an increase in the pixel brightness observed by the cam-
of Lascar volcano). Our IP cameras furthermore showed the eras; both of these phenomena may indicate the formation
occurrence of snow in addition to the rain and hail recorded of new cracks exposing the previously sealed hydrothermal
by our precipitation sensor and that the melting of snow fol- system.
lowing event P3 was rapid and occurred within 3 d, whereas Moreover, the addition of percolating water into the sys-
the melting following events P1 and P2 was much slower, tem could have led to a strong dilution or reduction in CO2
Nat. Hazards Earth Syst. Sci., 20, 377–397, 2020 www.nat-hazards-earth-syst-sci.net/20/377/2020/A. Gaete et al.: Processes culminating in the 2015 phreatic explosion at Lascar volcano, Chile 389
Figure 7. Drone overflight results. (a) Photomosaic of the crater region showing the 2017 central elevation of the crater floor with a diameter
of 57 m. The white line is the approximate perimeter of the thermal anomaly. (b) Close-up of photomosaic (as indicated in a) showing the
blocky central elevation of the crater floor which corresponds to the dimensions of the thermal anomaly. Note the NE–SW-striking linear
feature transecting the central elevation. (c) Digital elevation shaded relief model overlaid by a slope map whose values represent the slope in
degrees; the central elevation is delineated in the center of the crater. (d) Sentinel-2 thermal anomaly pixels acquired 37 d after the eruption
overlain on a shaded relief map to illustrate the location of the central elevation of the deep Lascar crater. Data provided by the European
Space Agency (ESA).
emissions in response to an increased groundwater content, immediately following precipitation is likely associated with
resulting in an anticorrelated relationship between the steam the vaporization of water (Fig. S2).
brightness and the CO2 concentration (Fig. S2). This dynam- The rapid fumarole heating after the eruption and the
ics was previously discussed as being the result of an atmo- short-lived increase in the CO2 concentration (Fig. 4b and c)
spheric pressure reduction governing the boiling tempera- may be interpreted as a response to the open conduit resulting
ture of water and consequently increasing the vaporization from the fracture truncating the central elevation on the crater
of water in shallow aquifers (Zimmer et al., 2017). The only floor due to the eruption. Previous studies have described
comparison in this regard was performed for SO2 (Girona et rainfall-triggered structural destabilization and lava dome
al., 2015), where a very similar trend was observed in the collapse and their thermal–hydraulic mechanisms (Elsworth
steam brightness and the SO2 column abundance curves ac- et al., 2004; Hicks et al., 2010; Matthews and Barclay, 2004).
quired simultaneously during a very short (30 min) passive The remaining linear feature observed across the central ele-
degassing period at Mount Erebus, Antarctica. The correla- vation that we believe formed during the 2015 eruption could
tion between the SO2 and brightness time series reflects the provide evidence of a pressure buildup and an explosion of
fact that volcanic water vapor is typically emitted in pro- the system (Fig. 7b). This would allow for the existence of
portional amounts to the SO2 and CO2 abundances in the a persistent thermal anomaly, as is evidenced from satellite
plume in the short term and under normal conditions. This data even after 1 year (Fig. 3), and the appearance of a glow
concept can provide an idea about the parametric relation- from the crater the night after the eruption (Fig. 5), which
ship between the water and gas contents in fumaroles. For was still observable on the night of 2 November according to
our results, the most plausible interpretation suggests that the the kymographic analysis (Fig. S3a). This finding also favors
percolating water added to the system needed some time to the mechanism in which degassing transports more energy
heat up. Therefore, we observe a gradual increase in vapor- through hot fumarolic gases as a result of a higher magmatic
ized water over the 5 d preceding the eruption, the excess of gas flux into the atmosphere. The entire gas pulse accom-
which is evidenced by the relatively white color of the fu- panying the eruption expelled at least 170 t of SO2 in only
marole steam. The gradual increase observed during the 3 d 100 min, which is approximately half the amount of SO2 that
Lascar volcano usually emits throughout a whole day in a
www.nat-hazards-earth-syst-sci.net/20/377/2020/ Nat. Hazards Earth Syst. Sci., 20, 377–397, 2020You can also read