AXA IM Framlington Equities - Long term thematics investing Stephane Lago, Thematic Investment Specialist June 2091
←
→
Page content transcription
If your browser does not render page correctly, please read the page content below

Not for Retail distribution: this document is intended exclusively for Professional, Institutional,
                           Qualified or Wholesale Investors / Clients, as defined by applicable local laws and regulation.
                           Circulation must be restricted accordingly.

AXA IM
Framlington Equities
Long term thematics investing
Stephane Lago, Thematic Investment Specialist
June 2091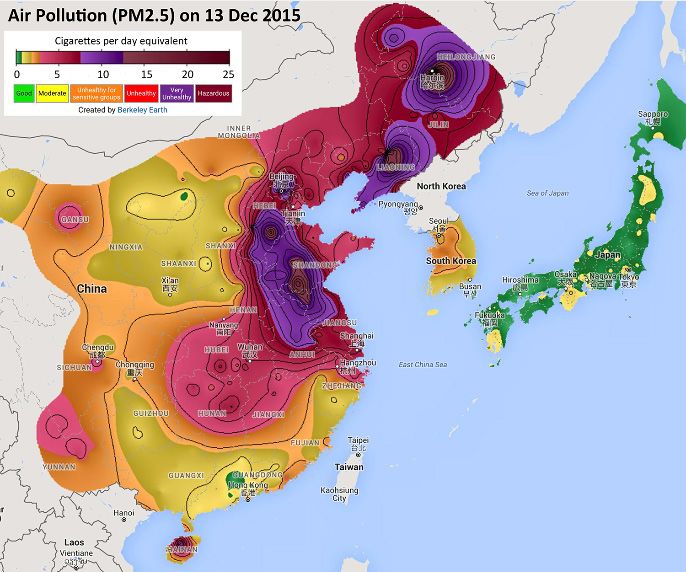
Change…

                                                                    Companies’ average lifespan in S&P500

                                                              1955:      61 years                               2015:       17 years

            62                                                           Years taken to hit 50 million users

                                      45

                                                               22

                                                                                          14                           12
                                                                                                                                       7
                                                                                                                                              4
                                                                                                                                                         1

      Automotive                 Electricity                 Television               Computer                    Mobile          Internet   Facebook   WeChat

Source: AXA IM, Visual Capitalist, BofAML Global Research, “Transforming the world – The 5 next years” October 2018.

                                                                                                                                                                 201830y
1        FRAMLINGTON EQUITIES
AXA IM Framlington Equities
Our offering

         Key                       EXPERTISE                                                PROCESS
      Figures (1)
                                   • Our core philosophy: Growth at a reasonable price      • Active management grounded in rigorous
        $57                        • Proprietary research is at the heart of our stock        fundamental research
    billion of assets                selection process (Portfolio Manager/Analyst           • Long-term conviction based approach, on average
                                     model)                                                   circa 4-5 year holding period (2)
   Managed across                  • Judgmental approach with an emphasis on                • Time tested and consistent approach since our
           3                         meeting company management                               inception in 1969

    global financial
        centres                    PORTFOLIO                                                PRODUCT
                                   • Truly conviction based, our portfolio managers are     • Core equities – across the market cap spectrum as
          50                         fully empowered to make investment decisions             well as country, regional and global funds
      Investment
     Professionals
                                   • High active share (>70% (2))                           • Thematic – a range of funds that give investors access
                                   • Risk aware - seven portfolio engineers fully             to long-term growth themes
                                     embedded within our investment process                 • Specialist investment capabilities and Responsible
      Portfolio                                                                               Investing (RI)
  managers have an
     average of

          19                            Our fund managers are fully empowered and accountable for their
  years’ experience                                          investment decisions
(1) AXA IM as at 31/03/2019 unless otherwise stated.
(2) For illustrative purposes only. Past performance is not a guide to future performance

                                                                                                                                                       201830y
    2    FRAMLINGTON EQUITIES
Evolving economy investment themes at Framlington Equities

                                                                       Urbanisation      Ageing &
                                                         Basic needs                      Lifestyle
                                                Social mobility
                                                                                                   Silver spending
                          Transitioning
                              Societies                                                                 Wellness and prevention

                     Sustainable resources                                                                 HealthTech

                                  Smart Grid
                                                                                                           Connected
                               Clean Energy
                                                                                                           Consumer
                              CleanTech                                                                   E-commerce & FinTech

                                                                                                      Software & Cloud
                                     Energy efficiency

                                           Internet of Things                                 AI & Analytics
                                                                Robotics
                                                                                 Automation

For illustrative purposes only. CR09360/05-19

                                                                                                                                  201830y
3        FRAMLINGTON EQUITIES
Old Economy investment themes

                                                                                 Quantity
                                                               Rural isolation
                                                   Extreme poverty
                                                                                 over Quality
                                           Polarised wealth
                                                                                               Shorter retiring life

                              Old World                                                               Disease related drugs

                                                                                                        Man made medicine
                           Dependant cities

                                 Brown-outs
                                                                                                        High Street
                                  Fossil Fuels
                                                                                                        Retail
                               Scarce
                            Resources                                                                  Shopping malls & physical payments

                                      Diesel Transport                                            Desktop

                                                    Offshoring                             Hardware
                                                Labour intensive process
                                                                            Traditional
                                                                           Manufacturing
For illustrative purposes only. CR09360/05-19

                                                                                                                                            201830y
4        FRAMLINGTON EQUITIES
Historic performance of Evolving Economy vs Old Economy universe

                                                                  Evolving Economy vs Old Economy
                                                             Relative performance - 5 years to March 2019

          25

          20
                                                                                                                                                                                                     +20.0%

          15

         %10

            5

                                                                                                                                                               Return - 5YR Ann
                                                                                                                                                       Evolving Economy                8.08
            0
                                                                                                                                                       Old Economy                     4.98

           -5
            Mar-14            Sep-14            Mar-15            Sep-15            Mar-16            Sep-16            Mar-17            Sep-17           Mar-18             Sep-18           Mar-19

Source: AXA IM, FactSet as at 31/03/2018. For illustrative purposes only. Past performance of the AXA IM constructed thematic universes are not a guide to future performance. The figures provided do not
relate to actual portfolios in the strategy. Actual portfolios are subject to the risks of portfolio management and trading, including but not limited to trading costs, market impact and fill rates, and may not
resemble the universes presented herein as a result. The strategy is not yet live and to the extent it becomes available for investment, an investor’s actual experience may vary. The relative benchmark for the
thematic universes is the S&P Global Broad Market Index. The returns and fundamental characteristics presented are for thematic universes constructed by AXA IM – Ageing & Lifestyle, Connected Consumer,
Automation, CleanTech and Transitioning Societies. Thematic universe inclusion is based on revenue exposure and constituent weightings of the S&P Global Broad Market Index. The “Evolving Economy”
universe contains index constituents with high or medium exposure to our themes. The “Old Economy” universe contains constituents with low and no exposure, which accounted for 52% of the S&P Global
Broad Market Index market capitalisation as of 31/12/2017. The weighted average of the universes will equal the S&P Global Broad Market Index. CR09360/05-19

                                                                                                                                                                                                                     201830y
5        FRAMLINGTON EQUITIES
Thematics exposure by sector

    18

    16
                                                                                                                                                             Old Economy

                                                                                                                                                             Transitioning Societies
    14
                                                                                                                                                             CleanTech

                                                                                                                                                             Automation
    12
                                                                                                                                                             Connected Consumer

    10                                                                                                                                                       Ageing & Lifestyle

    8

    6

    4

    2

    0
         Communication    Consumer         Consumer           Energy         Financials      Health Care       Industrials     Information       Materials            Real          Utilities
            Services     Discretionary      Staples                                                                            Technology                            Estate

Source: FactSet/AXA IM - Thematic exposure by GICS sector within the S&P Global BMI. Companies with high or medium exposure to a theme considered thematic as at 31/03/2019. CR09360/05-19

                                                                                                                                                                                                201830y
6         FRAMLINGTON EQUITIES
Evolving Economy investment strategies at Framlington Equities

                                                                                                 Longevity Economy strategy
                                                                                                 AUM: $108m

    Transitioning Societies strategy
                                  Model portfolio stage

                                                                                                                   Digital Economy strategy
                                                                           Evolving Trends strategy                AUM: $283m
                                                                                    AUM: $171m

     Clean Economy strategy
                                   AUM: $57m
                                                                                                              FinTech strategy
                                                                                                              AUM: c. $1bn

                                                          Robotech strategy
                                                                          AUM: c.$3.8bn

Source: FactSet as at 31/05/2019. For illustrative purposes only. CR09360/05-19

                                                                                                                                              201830y
7        FRAMLINGTON EQUITIES
Process consistency

                                                                                                                                                     Research structure:
    Proprietary thematic                                                                                                                             Thematic specialists
    exposure database
                                                                                                                                                       •   Reshaping of our global internal research
    Thematic filter                                                                                                                                    •   5 Thematic Research pods working with
    •   Sub-theme focus                                                                                                                                    Framlington Equities’ regional equity teams
    •   Investment team knowledge
    •   Sell-side thematic exposure data                                                                                                               Weekly meeting - discussion around:
    •   FactSet Revere revenue exposure                                                                                                                • Recent company/analyst meetings
                                                                                                                                                       • Conferences’ feedback,
    Company purity scoring                                                                                                                             • Industries/stocks/investment trends
    •   Defining the level of exposure (or “purity”)
        of companies:                                                                                                                                  Monthly meeting - discussion around:
        - High exposure                                                                                                                                • Trends, macro & stocks
        - Medium exposure
        - Low exposure                                                                                                                                 Quarterly review
                                                                                                                                                       • Quarterly medium-term view on the 5 themes
                                                                                                                                                       • Thematic recommendation list

                                                          Consistent portfolio construction
                                                           •   Typically 40-60 names                                •   No tracking error limit
                                                           •   Low turnover typically 80%                     •   Theme purity typically >70% in high & medium exposure stocks

Source: AXA IM as at 31/03/2019. AXA IM reserves the right to modify any of the procedures, process and controls described herein at its discretion. Diversification does not ensure a profit or protection against
a loss.

                                                                                                                                                                                                                      201830y
8         FRAMLINGTON EQUITIES
Proprietary thematic exposure database

 Initial Investment Universe                                     Thematic Filter                                  Company Purity Scoring

    • Initial Investment Universe:                               • Sub-themes focus: Ageing & Lifestyle,                High exposure
                                                                    Connected Consumer, Automation,                     >50% of revenues are coming from
       − C. 11,000 listed companies                                 CleanTech, Transitioning Societies                  the theme (generally small caps)
       − C. 1,400 industries                                     • Leveraging on Framlington Equities                   Medium exposure
       − Developed, Emerging &                                      investment team knowledge and                       Between 50% and 10% of revenues
         Frontier Markets                                           experience                                          are coming from the theme
                                                                 • Using sell-side thematic exposure data               (generally mid and large caps)
       − Small, mid & large caps
                                                                    (Citi Global Theme Machine, BofAML
                                                                                                                        Low exposure
                                                                    Global Research & Thematic
                                                                    Investment) supplemented by FactSet
Evolving economy – Global thematic internal research
AGEING & LIFESTYLE
TRANSITIONING SOCIETIES • Dani Saurymper*
• Ian Smith* • Peter Hughes
• Paul Birchenough* • David Shaw
• Will Chuang • Anne Tolmunen
• Anne Tolmunen • Vincent Vinatier
• Amanda O’Toole
CONNECTED CONSUMER
• Jeremy Gleeson*
CLEANTECH • Steve Kelly
• Amanda O’Toole* • Pauline Llandric
• Olivier Eugene • Alexandre Fade
• Mark Hargraves • Vincent Vinatier
• Will Chuang
• John King
AUTOMATION
• Tom Riley* • Dani Saurymper
• Mark Hargraves • Will Chuang
• David Shaw
Pod co-ordinator. As at 31/05/2019. For illustrative purposes only. Note that some resources are shared by the entire AXA IM Organisation. There is no assurance that any particular individual will be involved
in the management of the portfolio for any given period of time, if at all. AXA IM reserves the right to modify any of the procedures, process and controls described herein at its discretion.
CR09360/05-19
201830y
10 FRAMLINGTON EQUITIESExisting expertise in global and disruptive themes
Global Equity strategy1 Global Robotech strategy2
Cumulative performance since inception on August 2010 Cumulative performance since inception (08/12/2015)
260 180
AXA Framlington Global Core Equity Composite, USD
240 170
MSCI AC World Total Return Net
160 +62%
220 124%
200 108% 150
140
180 +36%
130
160
120
140
110
120
100 AXA Framlington Global Robotech Composite
100
90 MSCI AC World Net TR
80 80
Aug-10 May-11 Feb-12 Nov-12 Aug-13 May-14 Feb-15 Nov-15 Aug-16 May-17 Feb-18 Nov-18
Dec-15 Jun-16 Dec-16 Jun-17 Dec-17 Jun-18 Dec-18
Global Technology strategy3 Digital Economy strategy4
Cumulative performance since
Cumulative performance since inception (24/10/2017)
Jeremy Gleeson took over the strategy on June 07
450 140
AXA Framlington Global Technology Composite +321%
400
MSCI World Information Technology Net TR 130 +30%
350
Cumulative performance
300
+213% 120
250
110
200 +5%
150 100
100
90 AXA Framlington Digital Economy
50 MSCI AC World Total Return Net
0 80
Jun-07 Jun-08 Jun-09 Jun-10 Jun-11 Jun-12 Jun-13 Jun-14 Jun-15 Jun-16 Jun-17 Jun-18 Oct-17 Dec-17 Feb-18 Apr-18 Jun-18 Aug-18 Oct-18 Dec-18 Feb-19
Source AXA IM and FactSet as at 31/03/2019. 1: Performance of the Global Equity. Basis: Gross of Fees in USD. Comparative benchmark: MSCI AC World Net TR. 2: Performance of the Global Robotech. Basis: Gross of Fees in USD.
Comparative benchmark: MSCI AC World Net TR. 3:Performance of the AXA Framlington Global Technology. Basis: Gross of Fees in USD. Comparative benchmark: MSCI World Information Technology Net TR. 4: Performance of the
Digital Economy Equity. Source FactSet, Basis: Gross of Fees in USD. Comparative benchmark: MSCI AC World Net TR.. The deduction of fees reduces the level of return. Past performance is not a guide to future performance. AXA
201830y
IM claims compliance with the *Global Investment Performance Standards (GIPS). Please refer to the full GIPS Compliant Report attached at the end of this presentation for overall information.
11 FRAMLINGTON EQUITIESAXA World Funds Framlington Digital Economy
Just the beginning of a multi-year investment theme

                                      (Only)               9%                        of global retail sales are transacted online

                                                                   Global eCommerce size (LHS) and % of overall retail (RHS)
                           2 500                                                                                                                                                 14%

                                              Global eCommerce size (USD $bn)                  % of Overall Retail                                                               12%
                           2 000

                                                                                                                                                                                 10%
                                                                                                 From 2015 to
                           1 500
                                                                                                2021e, Global
                                                                                              eCommerce size is                                                                  8%
                 USD $bn

                                                                                              expected to double

                                                                                                                                                                                 6%
                           1 000

                                                                                                                                                                                 4%

                            500
                                                                                                                                                                                 2%

                              0                                                                                                                                                  0%
                                   2002 2003 2004 2005 2006 2007 2008 2009 2010 2011 2012 2013 2014 2015 2016 2017e 2018e 2019e 2020e 2021e

Source: AXA IM. chart: Euromonitor International, Citibank “Technology at work v3.0”, August 2017. Performance results of the past are no indicator for any future returns or trends. CR10049/08-19

                                                                                                                                                                                                      201830y
13       FRAMLINGTON EQUITIES
Sustainable long term drivers
Millennials are key Online continues to take market share
Average number of online transactions eCommerce penetration by country
(per person per year) (% of total sales)
15,6
15,1
21% (2023,E)
34% (2023,E) 17% (2018)
24% (2018)
Millenials Baby Boomers
Average amount spent per transaction 22% (2023,E)
(USD)
14% (2018)
$203
$173
7% (2023,E)
5% (2018) 9% (2023,E)
5% (2018)
Millenials Baby Boomers
Source: LH Chart: Global Online Consumer Report, KPMG International 2017. RH Chart: Euromonitor, William Blair, Retail in a digital world, 2019. For illustrative purposes only. Past performance is not a guide
to future performance.
201830y
14 FRAMLINGTON EQUITIESKey sub-themes
Digital Economy value chain
Discovery Decision
Delivery
(c. 20%* of the Portfolio) (c. 35%* of the Portfolio) (c. 20%* of the Portfolio)
Marketing/advertising Innovative/disruptive companies which have not just entered or adapted • Logistics: Same-day delivery
to a changing market but have often helped to create it option is increasingly important,
• Search engine, online
logistic centers need to have the
advertising and social media
• E-commerce: Focus is on online digital stores in industries moving capabilities required to adapt to
marketing are increasingly the
away from offline shops. Customer experience is paramount: ease of faster shipping time and
starting point when searching
use, depth of selection, design, reliability, etc. increasing demand.
and/or discovering products and
services. • FinTech : Consumers are
• Webportal & Apps: Usually leading players at the local or global level
accessing products and services
with modest capital expenditure and growing market share. They
on-line via various connected
typically have an excellent knowledge of their customer’s behaviour and
devices and directly making
the potential to monetise client data.
digital payments from those.
HubSpot Google Amazon Rightmove Paypal Kion Group
Tencent Electronic Arts Booking Holdings Deutsche Post Prologis
Data & Enablers
(c. 25%* of the Portfolio)
Globant Provide the crucial technology support and data analysis to develop companies’ digital presence via Zendesk
various channels and devices. Helping businesses that are digital migrants as well as those that are
Twilio digital natives. Splunk
Source: AXA IM as at 31/03/2019. *Estimates based on the overall portfolio given for indicative purpose only. Stock shown for illustrative purposes only and should not be considered as advice or a
recommendation (they constitute a rough estimate or an examples and are not the only stocks in the portfolio in these specific categories/boxes). CR10049/08-19
201830y
15 FRAMLINGTON EQUITIESDiscovery
Targeted marketing & advertising have become key channels to attract customers
Personalisation
• Marketing has shifted from traditional models (i.e. focus on
broad reach) to personalised digital models based on customer
activities, content and product recommendation.
Global Internet vs. TV Ad spend (in $bn) 1995-2017E
Personalised digital marketing and advertising
Monetisation:
• Efficient digital marketing campaign will increase online conversion
rates. Big search, ecommerce and social media companies are
competing to monetise customers traffic ultimately driving earnings
growth for the entire industry.
Source: AXA IM. Left chart: Kleiner Perkins, Internet Trends 2017, Zenith Advertising Expenditure Forecast , March 2017. Right picture: Kleiner Perkins, Internet Trends 2017, Facebook. CR10049/08-19
201830y
16 FRAMLINGTON EQUITIESDecision
Disruptive companies will not just enter or adapt to a changing market but will help to create it
Online will continue to take market share (vs. offline)
• Premium shopping areas may retain flagship stores and showrooms but
more transactions will be completed online due to vast range, ease of
comparability and simplicity of transaction.
OTA* - Global bookings & Online penetration
1600 50%
43.9%
42.1% 45%
1400 40.0%
37.7% 1467
1393 40%
1200 35.4% 1319
33.4% 1247 35%
Video games add-on content (e.g. selling new levels, new characters, etc.)
Onl i ne Penetration
1179
Bookings ($ Billions)
1000 1116
30%
800 25%
20%
600
A more mobile and app centric population
15%
400
10% • The digital development has changed online consumption
200 behaviour: customers are virtually assisted, online
5%
applications are easy to use, intuitive and encourage a
0 0% purchasing decision.
2013 2014 2015 2016E 2017E 2018E
Online Travel Bookings Global Offline Bookings Online Travel Bookings Penetration
Source: AXA IM. *Online Travel Agency. Left chart: Company reports, Phocuswright, Smith Travel Research, PwC, Stifel estimates. Right picture: EAsport company website. CR10049/08-19
201830y
17 FRAMLINGTON EQUITIESDelivery
Serving consumers wherever, whenever, and however they wish to interact and transact
China online payment volumes*
Fast and more efficient delivery
4.5
• Consumer preferences has triggered the need for faster shipping time Gross Merchandise Value (in Trillion USD) 4.1
at lower fees. Warehouses and distribution centers need to be 4.0
3.5
optimised to meet the requirement of today’s consumer. 3.5
2.9
3.0
2.4
2.5
2.0 1.8
1.5 1.2
1.0 0.8
0.6
0.5
0.0
2012 2013 2014 2015e 2016e 2017e 2018e 2019e
Safe and rapid payment
• Finding the right balance between easier ways of payments
and protecting customer against fraud has been facilitated by
the technological progress made by FinTech specialist
companies (over the last few years) overcoming a huge hurdle
in friction against growth of e-commerce.
Manage and follow your shipment
Source: AXA IM. LH picture: DHL company website . RH chart: iReasearch, Citi GPS: Global Perspectives & Solutions, 2016. *excluding banks. Stock shown for illustrative purposes only and should not be
considered as advice or a recommendation . CR10049/08-19
201830y
18 FRAMLINGTON EQUITIESData & Enablers
90% of smartphone time is spent on Apps – Only 16% of users will try a failing App a second time*
Disney embraces digital with MyMagic+ application
Numerous companies need assistance
• “Digital migrants” require expertise from 3rd party specialists in order
to compete with “digital native” businesses. For Instance,
New Relic, one of our holdings (see slide 25), is a cloud-based wait times
platform which enables organisations to collect, store and analyze in real-time
software data in real time. Its customers include Domino’s Pizza,
Costa, McDonalds, Capital One, Airbnb, etc.
New Relic helping Domino’s Pizza in its digital transition
80%
Online as a % of all sales
App/mobile as a % of online sales
60%
40%
20% Continuing technology advancement
• Utilising big data and using emerging technologies such as
0%
augmented reality (AR) and artificial intelligence (AI) to ultimately
2009 2010 2011 2012 2013 2014 2015
achieve a higher sales conversion ratio
Source: AXA IM . *Source: New Relic. LH chart: Company data as at 2016. RH picture: https://www.hongkongdisneyland.com/mobile-app. Stock shown for illustrative purposes only and should not be
considered as advice or a recommendation . CR10049/08-19
201830y
19 FRAMLINGTON EQUITIESAXA WF Framlington Digital Economy
Performance since inception*
50
AXA WF Framlington Digital Economy (Net, I USD) Main Peer competitor** MSCI AC World NR
40
30 29.3%
20
%
10
8.7%
2.7%
0
Since inception Since inception
-10 YTD 2018 2017***
(cum) (ann)
AXA WF Fram Digital Economy - I USD (net) 19.2% 4.7% 3.6% 29.3% 18.3%
MSCI AC Worl d 9.1% -9.4% 3.9% 2.7% 1.7%
-20
Oct-17 Dec-17 Feb-18 Apr-18 Jun-18 Aug-18 Oct-18 Dec-18 Feb-19 Apr-19
Source: FactSet,/Morningstar a at 31/05/2019. Basis: I USD share class, Single Price NAV, Net Income Total Return, Net fees in USD. Comparative benchmark: MSCI ACWI . *Inception date refers to 24/10/2017.
**Main peer competitor refers to Pictet Digital fund, I USD non-hedged shareclass at 0.80% management fees. The figures provided relate to previous months or years and past performance is not a reliable
indicator as to future performance. Performance calculations are based on the reinvestment of dividends. Index’s performance is calculated on the basis of dividends. The strategy does not have a reference index.
The fund’s performance indicator, the MSCI All Country World NR Index, is given as a basis for comparison only. ***From 24/10/17 to 31/12/17. (1) There is no guarantee that the strategy will achieve its goals.
201819i
20 FRAMLINGTON EQUITIESAXA WF Framlington Digital Economy
Top 15 holdings and market cap breakdown
Breakdown by market
Top 15 holdings Fund % Country Sector capitalisation (in USD)
45%
Visa Inc. 3.6 United States Information Technology
Digital Economy Portfolio MSCI All Country World
PayPal Holdings, Inc. 3.6 United States Information Technology 40%
36% 35%
Zendesk, Inc. 3.5 United States Information Technology 35% 34%
31%
Prologis, Inc. 3.5 United States Real Estate
30%
Amazon.com, Inc. 3.4 United States Consumer Discretionary 26%
Adobe Incorporated 3.2 United States Information Technology 25%
22%
Alphabet Inc. 3.1 United States Communication Services 20%
New Relic, Inc. 3.0 United States Information Technology
15%
12%
salesforce.com, inc. 2.9 United States Information Technology
10%
Goodman Group 2.8 Australia Real Estate
Microsoft Corporation 2.8 United States Information Technology 5% 3%
ServiceNow, Inc. 2.8 United States Information Technology
0%
Booking Holdings Inc. 2.8 United States Consumer Discretionary Small Mid Cap Large Cap Mega Cap
Facebook, Inc. 2.7 United States Communication Services
Globant SA 2.6 United States Information Technology Mega Cap => 100bn USD Mid Cap 5-25bn USD
Total 46.2 Large Cap 25-100bn USD Small Cap 0-5bn USD
Number of Stocks 53 Market cap typically >500m USD
Source: AXA IM as at 31/05/2019. CR10049/08-19
201830y
21 FRAMLINGTON EQUITIESAXA WF Framlington Digital Economy
Portfolio structure
Sub-theme breakdown
DISCOVERY
14%
DATA & ENABLERS Advertising/Marketing (5%)
34%
Internet (10%)
11% 5%
10% Ecommerce (9%)
OTA (4%) *
9%
Media (5%)
24%
4% Portal/Apps (4%)
5% Payments/Fintech (14%)
4% Logistics (6%)
8% DECISION
6% 14% Real Estate (8%)
22%
Enablers (24%)
Data (11%)
DELIVERY
28%
Source: AXA IM as at 31/05/2019. *Online Travel Agency. No assurance can be given that the strategy will be successful or that investors will not lose some or all of their capital. AXA IM reserves the right to
modify any of the investment process described herein at its discretion. CR10049/08-19
201830y
22 FRAMLINGTON EQUITIESAXA WF Framlington Digital Economy
Sector, Geographic & Geographic sales split
Sector split Geographical split Geographical sales split
Information 54% 78%
North North
Technology 16% 51%
America America
58%
Communication 17%
Services 9%
5%
Consumer 13% Europe Europe ex
Discretionary ex-UK 13%
11% 14% UK
8%
Real Estate
3% 5%
7% UK UK 7%
Industrials 5%
10%
0%
Financials 2%
17%
Japan Japan 3%
Consumer 0% 7%
Staples 8%
0% Developed 3% Developed
Energy
6% Asia Asia ex- 3%
ex-Japan 4%
0% Japan
Health Care
11%
6%
0% Emerging
Materials Emerging 19%
5% 12%
0%
Utilities
3% 1%
Cash Cash &
1% 5%
Cash 0% Others
0%
0% 20% 40% 60% 0% 20% 40% 60% 80% 100% 0% 20% 40% 60%
AXA WF Framlington Digital Economy MSCI All Country World
Source: AXA IM as at 31/05/2019. Geographical sales breakdown as at 31/03/2019 updated on a quarterly basis. CR10049/08-19
201830y
23 FRAMLINGTON EQUITIESAXA WF Framlington Digital Economy – stock contribution to performance
Top / Bottom 5 absolute contributors – Since Inception*
Stock return Contribution to
Portfolio average
Top 5 contributors Country Sector Market Cap in the portfolio absolute
weight %
portfolio % return %
Zendesk, Inc. United States Information Technology Small/Mid cap 2.98 177.55 3.34
Amazon.com, Inc. United States Consumer Discretionary Mega cap 3.38 81.50 2.37
New Relic, Inc. United States Information Technology Small/Mid cap 2.97 95.75 2.37
Splunk Inc. United States Information Technology Small/Mid cap 2.28 75.12 2.18
Twilio, Inc. United States Information Technology Small/Mid cap 1.25 312.18 1.91
Stock return Contribution to
Portfolio average
Bottom 5 contributors Country Sector Market Cap in the portfolio absolute
weight %
portfolio % return %
Baidu, Inc. China Communication Services Large cap 1.71 -57.16 -1.37
Deutsche Post AG Germany Industrials Large cap 1.85 -31.14 -0.76
Activision Blizzard, Inc. United States Communication Services Large cap 2.49 -30.30 -0.72
Alliance Data Systems Corporation United States Information Technology Small/Mid cap 1.12 -41.88 -0.65
XPO Logistics, Inc. United States Industrials Small/Mid cap 0.60 -44.60 -0.61
Stock selection is the main driver of performance
Source: AXA IM at 31/05/2019 in USD. *Inception date: 24/10/2017. The figures provided relate to previous months or years and past performance is not a reliable indicator as to future performance.
Performance calculations are based on the reinvestment of dividends. Performance calculations are net of management fees. Stocks shown for illustrative purpose only. The portfolio composition may evolve
anytime. CR10049/08-19
201830y
24 FRAMLINGTON EQUITIESAXA WF Framlington Digital Economy
Risk analysis & Liquidity profile
Risk metrics Liquidity profile
(Overall strategy*)
RISK DISTRIBUTION Trade to Cash/Strategy AUM
Tracking Error 8.2%
120
Active Share 88%
% of portfolio liquidated in 10 days
99
VALUE Portfolio Benchmark 100
92
Price to Book 5.6 2.1 88
Dividend Yield (12m Forward) % 0.6 2.8 80
Price to Earnings (12m Forward) 29.0 14.3
Weight %
Price to Sales 4.6 1.7 60
Price to EBITDA 19.1 8.7
40
GROWTH / QUALITY
3 Year Sales Growth (Historic) % 22.2 8.5
12M Sales Growth (Forward) % 15.7 6.1 20
3 Year EPS Growth (Historic) % 16.4 12.4
12M EPS Growth (Forward) % 14.0 9.1 0
Strategy Value Strategy Value Strategy Value
ROE 15.8 17.9 1bn USD 5bn USD 7bn USD
ROIC 8.5 11.8
Net Debt/Equity % -13.1 ** 46.4 For instance with a 1bn AUM in the strategy, 100% of the
portfolio could be liquidated within 10 days*
Source: Barra/FactSet/AXA IM as at 31/05/2019. Strategy unconstrained - MSCI All Country World used for comparative purposes. *The liquidation is calculated under normal market conditions and for
illustrative purpose. The liquidity and days to cash are calculated based on a 30% participation rate of the 90 day average volume for each stock in the portfolio. These figures are based on reported volumes.
As such, it may understate liquidity as off exchange activity is excluded. Positions which have no liquidity data available have been excluded from the above analysis. **Net Debt/Equity % is negative if
companies have more cash than debt. Calculated as (Debt-Cash)/Equity. CR10049/08-19
201830y
25 FRAMLINGTON EQUITIESAXA World Funds Framlington Clean Economy
Realising the urgency

                                                                                                                      Air pollution is now the 4th greatest threat to human health

                Social awareness                                                                                                   Beijing
                Social media have contributed to the growing public
                opinion towards global warming and the associated
                health and scarce natural resources risks.

                Governments
                The Paris 2015 Climate Agreement (COP21) achieved the                                                                                         Cigarettes per day equivalent

                first global, legally binding deal to keep the temperature                                                                          0           5           10           15         20           25
                rise below 2 degrees.                                                                                                                Good
                                                                                                                                                            Moderat
                                                                                                                                                              e
                                                                                                                                                                       Unhealthy for
                                                                                                                                                                      sensitive groups
                                                                                                                                                                                       Unhealthy
                                                                                                                                                                                                   Very
                                                                                                                                                                                                 Unhealthy
                                                                                                                                                                                                           Hazardous

                                                                                                                 The 4th warmest year on earth happened over the last 4 years

                Corporates
                The fast reorganisation of the economy around new
                forms of low-emission efficient solution and resource
                optimisation offers opportunity for businesses whose
                goods and services support this fast energy transition

Source: AXA IM, BoFA Merrill Lynch Global Research estimates (Dec 2017), Twitter. *RE100: 100% Renewable Energy. CR12547/04-20

                                                                                                                                                                                                                       201830y
27      FRAMLINGTON EQUITIES
Huge demographic challenges
Global population is increasing…while water supply is not
2019 2050
Total World Water Resources1: World Population2: Total World Water Resources1: World Population3:
200,000 km3 6.6bn 200,000 km3 9.3bn
1.Source: http://www.vossfoundation.org/assets/UNEP_Global_Water_Resources.pdf. 2. Source: http://www.worldometers.info/world-population/world-population-projections/
3. Source: https://www.un.org/development/ .(GEO-4). CR12547/04-20
201830y
28 FRAMLINGTON EQUITIESContributions of economic sectors to global greenhouse gas emissions
Agriculture, Forestry and
Other Land Use Transport
• fossil fuels burned for
• Cultivation of crops and
livestock 14% road, rail, air, and
marine transportation
• Deforestation
24%
Buildings
• Onsite energy generation
and burning fuels for heat 6%
in buildings or cooking in
homes
35% Energy production
• Burning of coal
Industry • Natural gas
• Oil for electricity and heat
• industry primarily involve
fossil fuels burned on site 21% •
•
Fuel extraction
Refining
at facilities for energy
• Processing
Source: AXA IM, FAO report ”Distribution of global Greenhouse”, 2014. Pictures Getty images. CR12547/04-20
201830y
29 FRAMLINGTON EQUITIES4 key sub-themes aligned with primary UN SDGs
Clean Economy strategy
Sustainable Transport Smart Energy Responsible Nutrition
(c. 25%* of the portfolio) (c. 25%* of the portfolio) (c. 25%* of the portfolio)
• Electric Vehicle (EV) : strong support for • Renewables : failing renewable production cost is • Food & Agriculture : feeding a growing
EV adoption driven by social and political allowing corporates and countries to power their population while preserving resources and
pressure economic development on wind, solar & hydro encouraging healthier habits including
precision farming, reducing demand for
• Batteries : significant advances in battery • Greener Homes/Buildings : digitalised electricity excessive animal products, bioscience
technology and the collapsing cost of network using advanced metering and storage innovation, organic food, etc.
battery storage have cleared the pathway solutions to manage the distribution of electricity
towards mass market EVs and meet the varying demands of businesses, • Water : growing recognition of the scarcity
public services and households of clean water will benefit companies
• Enablers : semiconductors , connectors, whose technology improve drinking water
emission reduction systems are key in • Efficient Factories : reducing energy consumption quality, reduces water usage and
every transport solution making sure the for heating, cooling, data storage, connected increases water re-use
energy consumption is efficient as possible devices, manufacturing process, lighting, etc.
Panasonic – Johnson Matthey – Infineon Kingspan – NextEra Energy – Schneider Electric John Deere – Itron – Chr Hansen
Recycling and Waste Reductions
(c. 25%* of the portfolio)
Businesses which mitigate environmental damage – by reducing waste, facilitating recycling,
monitoring and resolving pollution – will yield large net gains to the global economy
Umicore – Everbright Water – DS Smith
Source: AXA IM as at 30/04/2019. For illustrative purposes only. *Estimates based on the overall strategy given for indicative purpose only. Information regarding the portfolio
characteristics above is provided for reference only and does not represent the experience of the strategy nor is it intended as a representation or warranty by AXA IM or any other
persons or entity as to the actual composition of or performance of any future investment. No assurance can be given that the strategy will be successful or achieve its objectives. The
201830y
figures provided do not relate to actual portfolios in the strategy. Actual portfolios are subject to the risks of portfolio management and trading, including but not limited to trading costs,
market impact and fill rates, and may not resemble the model portfolio information presented herein as a result. The examples provided above are for illustrative purposes only and are
30
intended FRAMLINGTON
to reflect the typicalEQUITIES
securities, sectors, and/or geographies that could be deployed by the strategy to generate the target returns, and should not be considered a
recommendation or solicitation to buy or sell any particular security. AXA IM reserves the right to modify any of the procedures, process and controls described herein at its discretion.
CR12547/04-20Sustainable Transport
Within the next 12 years a third of global car sales will be electric vehicles (vs. 1% currently)
EV as a % of Global Car Sales
Electric Vehicle
• Innovation in battery storage and the electric power train are 100%
driving the development of the Electric Vehicle market. Social and 90%
political pressure to reduce emissions is supporting this transition.
80%
China accounts
for half of the
% of overall sales
60% sales
Electrical Vehicle’s innovations 34%
40%
20% 12%
1%
0%
2018 2025E 2030E 2050E
Pure Internal Combustion
Engine Vehicle sales ban
proposal (indicative year
per country)
Batteries & Enablers
• The whole EV supply chain aim to benefit from an increasing
adoption rate in the coming years - long lasting batteries, private
and public charging stations, semiconductors which can minimise
power loss and support performance, etc.
Source: AXA IM. Left picture: free of use. Right chart: BofA Merrill Lynch Global Research estimates, April 2018. CR12547/04-20
201830y
31 FRAMLINGTON EQUITIESSmart Energy
Energy, industry and buildings accounts for c.60% of global greenhouse gas emissions
Smart grid – efficient distribution of energy
From renewable resources to homes, factories, transports and offices
Renewables
• Energy, industry and buildings accounts for c.60% of global
greenhouse gas emissions which makes the energy
transition key. According to Goldman Sachs, 3 trillions of
USD Global investment in wind and solar over the next 20
years
• Renewable energy capacity has strongly increased over the
last decade while power generation costs have fallen.
Renewable energy costs are coming closer to the range of
fossil fuels, leading to an acceleration of their deployment
and offering strong economic opportunities for investors in
both developed and emerging markets.
Grid Infrastructure, homes, Buildings, Factories
• Digitalisation of the home and electricity grid allows
businesses and consumers to take control of their energy
use, changing their relationship with energy suppliers.
• The collapsing cost of battery storage and smart grid
technology opens up new possibilities for energy efficiency
and renewable energy.
Source: AXA IM, FAO (Food and Agriculture Organisation of the United Nations). Right picture: Goldman Sachs, The power of shift, Sept 2017. CR12547/04-20
201830y
32 FRAMLINGTON EQUITIESResponsible nutrition
The agriculture industry use 70% of global freshwater
Emission due to animal products consumed in the USA
Food & Agriculture (kg of CO2 equivalent per kg of meat)
• Population growth and rising wealth will continue to drive demand 30
for food and in particular proteins which consume more resources
than grains. There is an economic imperative to increase efficiency 25
throughout the food chain (1/3 of edible food is wasted). Resilient
agricultural practices which can adapt to climate change are also 20
key to meet this demand.
15
Efficient AgriTech solution
10
5
0
Beef Cheese Pork Chicken Eggs
Processing, transport, trade, preparation, waste disposal Production
Water
• Climate change, environmental damage and shifting consumption
patterns are stressing clean water resources, creating shortages in
some areas and floods in others.
Source: AXA IM, OECD (Organisation for Economic Co-operation and Development), FAO (Food and Agriculture Organisation of the United Nations). Left picture: BoFAM Agritech Farming, June 2017, AGCO Q4
2016 Presentation. Right chart: BoFAM Food Security, Heinrich Boll Foundation, March 2015. CR12547/04-20
201830y
33 FRAMLINGTON EQUITIESRecycling and Waste Reductions
Only 20% of all electronics are recycled
Recycling Urban waste generation by Income level and year
• Businesses which mitigate environmental damage – by facilitating 1200
recycling and reusing – will yield large net gains to the global
Waste Generated (millions tons/year)
2010
economy and will allow businesses to navigate regulatory 956
headwinds 1000 Projected 2025
800 686
Waste 602
600
369 360
400
213 243
200
75
0
Lower Income Lower Middle Upper Middle High Income
Income Income
Waste
• While developing countries population and wealth keep increasing,
urban and industrial waste management is becoming a priority.
Public opinion is shifting and corporates focused on reputational
risk are beginning to respond to consumer pressure to manage their
supply chains responsibly.
Source: AXA IM, BoFAM “Taking out the trash - Global Waste Primer” June 2018. Right hand chart: The World Bank 2012. *Electronic Waste. CR12547/04-20
201830y
34 FRAMLINGTON EQUITIESAXA WF Framlington Clean Economy
Top 15 holdings & market cap breakdown
Top 15 holdings Market Cap breakdown
Top 15 holdings Fund % Sub Theme Country Market Cap
AXA WF Framlington Clean Economy
1 Halma p.l.c. 4.8 Eco-Producti on UK $ 9 bn MSCI All Country World
50%
2 NextEra Energy, Inc. 3.7 Renewa bl es a nd Gri d USA $ 95 bn 47%
3 Chr. Hansen Holding A/S 3.7 Food Denma rk $ 14 bn 45%
4 TE Connectivity Ltd. 3.4 Ena bl ers USA $ 28 bn 40%
36% 35%
5 Kingspan Group Plc 3.3 Greener Homes /Bui l di ngs Irel a nd $ 9 bn
35%
6 Xylem Inc. 3.3 Wa ter USA $ 13 bn
30%
7 BorgWarner Inc. 3.2 Ena bl ers USA $ 7 bn 26%
8 Hannon Armstrong Sustainable In 2.9 Greener Homes /Bui l di ngs USA $ 2 bn 25% 23%
9 Unilever PLC 2.9 Eco-Producti on UK $ 174 bn 20% 17%
10 Siemens AG 2.7 Effi ci ent Fa ctori es Germa ny $ 96 bn
15%
11 Spirax-Sarco Engineering PLC 2.7 Effi ci ent Fa ctori es UK $ 8 bn
10% 8%
12 Panasonic Corporation 2.6 Ba ttery Ja pa n $ 20 bn
13 Deere & Company 2.6 Agri cul ture USA $ 44 bn 5% 3%
14 Thermo Fisher Scientific Inc. 2.4 Wa ter USA $ 107 bn 0%
Small Cap Mid Cap Large Cap Mega Cap
15 Johnson Matthey Plc 2.4 Ba ttery UK $ 8 bn
(0-5bn USD) (5-25bn USD) (25-100bn USD) (>100bn USD)
Total 46.6
Market cap typically >500m USD
Number of Stocks 44
Source: AXA IM as at 31/05/2019. For illustrative purposes only. No assurance can be given that the strategy will be successful or that investors will not lose some or all of their capital. CR12547/04-20
201830y
35 FRAMLINGTON EQUITIESAXA WF Framlington Clean Economy
Sector, geographic & regional sales split
Sector split Geographical split Regional sales split
31%
Industrials North
10% North 42% 37%
America
18% America
Materials 58%
5%
18% Europe ex
IT 17%
16% 38% UK
Europe
Consumer 10%
19%
Discretionary 11%
6% UK 4%
Utilities 8%
3%
Japan
Consumer 4% 7%
Staples 8%
Japan 6%
4%
Health Care Developed 0%
11%
Asia
3% ex-Japan 4% Developed
Real Estate
3% Asia ex- 3%
0% Japan
Financials 6%
17% Emerging
Telecom 0% 12% Emerging 25%
Services 9%
0%
Energy 6%
6% Cash Cash &
6% 0% 8%
Others
Cash
0%
0% 20% 40%
AXA WF Framlington Clean Economy MSCI All Country World
Source: AXA IM as at 31/05/2019. Geographical sales breakdown as at 31/03/2019, updated quarterly. For illustrative purposes only. No assurance can be given that the strategy will be successful or that
investors will not lose some or all of their capital. CR12547/04-20
201830y
36 FRAMLINGTON EQUITIES*
AXA WF Framlington Clean Economy
ESG & Controversy exposure
Exclusion of coal or oil sands; defense and tobacco sectors
ESG Scores Controversy Exposure
• Exclusion of ESG scoresAXA WF Framlington Clean Economy
Risk analysis & liquidity
Risk metrics Liquidity profile
120
RISK DISTRIBUTION
% of portfolio liquidated in 10 days
Tracking Error 4.2%
100 96
Active Share 97%
VALUE Portfolio Benchmark
80
71
Price to Book 2.6 2.1
63
Weight %
Dividend Yield (12m Forward) % 2.3 2.8
60
Price to Earnings (12m Forward) 16.2 14.3
Price to Sales 1.3 1.7
40
Price to EBITDA 9.3 8.7
EV/EBITDA 11.5 11.5
20
GROWTH / QUALITY
3 Year Sales Growth (Historic) % 10.5 8.5 0
12M Sales Growth (Forward) % 7.0 6.1 Strategy Value Strategy Value Strategy Value
1bn USD 5bn USD 7bn USD
3 Year EPS Growth (Historic) % 17.7 12.4
12M EPS Growth (Forward) % 8.5 9.1
Net Debt/Equity % ** 62.7 46.4
For instance with a 1bn AUM in the strategy, 97% of the
portfolio could be liquidated within 10 days*
Source: Barra/FactSet/AXA IM as at 31/05/2019. Strategy unconstrained - MSCI All Country World used for comparative purposes. *The liquidation is calculated under normal market conditions and for
illustrative purpose. The liquidity and days to cash are calculated based on a 30% participation rate of the 90 day average volume for each stock in the portfolio. These figures are based on reported volumes.
As such, it may understate liquidity as off exchange activity is excluded. Positions which have no liquidity data available have been excluded from the above analysis. **Net Debt/Equity % is negative if
companies have more cash than debt. Calculated as (Debt-Cash)/Equity. CR12547/04-20
201830y
38 FRAMLINGTON EQUITIESFinTech Strategy
Capturing value across the Value Chain: key Sub Themes within our strategy

             Cashless Society                                                     Innovative Leaders                               Technology Enablers
            (25% to 55% of portfolio*)                                             (25% to 55% of portfolio*)                        (10% to 30% of portfolio*)

 • Online shopping continues to take                                    • FinTech is revolutionizing the financial           • Enablers provide the crucial technology
   market shares from offline, ultimately                                 sector                                               support to develop FinTech companies’
   increasing the volume of digital                                                                                            digital presence via various channels
                                                                        • Established institutions still have a
   payments.                                                                                                                   and devices
                                                                          strong hand to play in banking,
 • The payment industry is moving to                                      insurance and wealth management                    • Helping traditional businesses that are
   more integrated and complex platforms                                  through wide ranging mobile and digital              “digital migrants” as well as those that
   able to process high volume of omni-                                   innovations                                          are “digital natives”
   channel and cross-border transactions

                                    We remain cautious on Blockchain, crypto, crowdfunding, P2P lending platforms and a
                                                           number of emerging business models

Source: AXA IM as at 31/03/2019. *Estimates based on the overall strategy given for indicative purpose only. CR10052/08-19

                                                                                                                                                                          201830y
40       FRAMLINGTON EQUITIES
FinTech strategy
Risk analysis & market cap breakdown
Risk metrics Sub-theme breakdown
RISK DISTRIBUTION CASHLESS SOCIETY
Tracking Error *
Digital Currency (16%)
5.7% TECH ENABLERS 35.6%
25.5%
Active Share 95.4% Payment Processing (19%)
7%
MSCI AC 16% Banking 2.0 (19%)
Portfolio 7%
VALUE World
3% Insurance 2.0 (8%)
2%
Price to Book 3.4 2.2 Wealth Management 2.0 (7%)
6%
Dividend Yield (12m Forward) % 1.6 2.7 19% Big Data (6%)
7%
Price to Earnings (12m Forward) 19.7 14.9
Block Chain (2%)
Price to Sales 3.8 1.7 8%
19% RegTech (3%)
Price to EBITDA 19.8 9.0
Security (7%)
EV/EBITDA 19.7 10.9
Software (7%)
GROWTH / QUALITY INNOVATIVE LEADERS
33.3%
3 Year Sales Growth (Historic) % 16.0 8.4
12M Sales Growth (Forward) % 12.4 5.6
c.400 core coverage listed companies (after
3 Year EPS Growth (Historic) % 9.7 12.5 Investable universe
qualitative and quantitative filtering)
Stocks
12M EPS Growth (Forward) % 15.1 8.2 Portfolio 42
ROE 11.4 18.0 Already owned within
42
ROIC 6.3 12.0 Framlington Equities
Net Debt/Equity % 30.0 46.5
Source: Barrad/FactSet/AXA IM as at 31/03/2019. Strategy unconstrained - MSCI All Country World used for comparative purposes. For illustrative purposes only. Information
regarding the model portfolio characteristics above is provided for reference only and does not represent the experience of the strategy nor is it intended as a representation or
warranty by AXA IM or any other persons or entity as to the actual composition of or performance of any future investment. No assurance can be given that the strategy will be
201830y
successful or achieve its objectives. The figures provided do not relate to actual portfolios in the strategy. Actual portfolios are subject to the risks of portfolio management and
trading, including but not limited to trading costs, market impact and fill rates, and may not resemble the model portfolio information presented herein as a result. The examples
41 FRAMLINGTON
provided EQUITIES
above are for illustrative purposes only and are intended to reflect the typical securities, sectors, and/or geographies that could be deployed by the strategy to generate
the target returns, and should not be considered a recommendation or solicitation to buy or sell any particular security. *Predicted Tracking Error.Longevity Economy strategy
Key sub-themes
The Longevity Economy: focus on whole of life, not just end of life

          Lifespan
                               WELLNESS                                               SILVER SPENDING                                                   SENIOR CARE
                  Improving the length of people’s                         Discretionary spend of this age group is                      Increasing demand as proportion of the
                         healthy life span                                     a huge opportunity for business                              senior population rapidly expands

             •   Modifying unhealthy behaviors with                        •   Growing population with high spending                     •   Improve supply of doctors and nurses
                 more active and healthier lifestyles                          capacity                                                      plus care facilities
             •   Preventing disease through vaccinations,                  •   Focus is on leisure activities, travel,                   •   Growing need for health insurance and
                 digital diagnostics, screening and                            beauty, financial planning and pet care                       funeral planning services
                 monitoring

                                                                                           TREATMENT
                                                             The older we get the more at risk of certain diseases we are
                                              • Treatment of age-related chronic diseases : i.e. heart attack/stroke, cancer, diabetes,
                                                                                dementia, arthritis
                                                 • Regenerative medicine and replacement of body parts due to wear and tear

Source: AXA IM as at 31/03/2019. The securities examples are intended for purposes of discussion of the strategy and no representation is made that these examples are past or current recommendations, that
they should be bought or sold, nor whether they were successful or not. CR10085/08-19

                                                                                                                                                                                                               201830y
43       FRAMLINGTON EQUITIES
Longevity Economy
Model portfolio profile
Risk metrics (vs. MSCI ACWI) Sub-theme breakdown
RISK DISTRIBUTION Consumer Health (3%)
Digital Health (13%)
Tracking Error * 5.2% TREATMENT WELLNESS Personal Care (4%)
Predicted Beta 0.96 30% 26%
Vaccines (3%)
3% 4% 3%
Active Share 95.6% 13% Education (2%)
Fitness (1%)
Portfolio Benchmark Animal Health (3%)
VALUE 24% 4%
Beauty & Vision (5%)
Price to Book 2.9 2.2 3%
Financial Planning (10%)
2%
1%
Dividend Yield (12m Forward) % 2.0 2.7 3% Leisure (6%)
Funeral Services (3%)
Price to Earnings (12m Forward) 17.6 14.9 4% 5%
2% Health Insurance (7%)
Price to Sales 2.3 1.7 7% 10% Home-Health & Nursing (2%)
3% 6%
Price to EBITDA 11.9 9.0 REITs (4%)
SENIOR CARE Ageing Pharmacy (24%)
EV/EBITDA 13.9 10.9 15% SILVER SPENDING
Cardio (3%)
24%
Orthopaedics (4%)
GROWTH / QUALITY
3 Year Sales Growth (Historic) % 6.2 8.4
12M Sales Growth (Forward) % 6.7 5.6
Investment Universe c.900 listed companies
3 Year EPS Growth (Historic) % 12.6 12.5
c.300 core coverage listed companies (after
12M EPS Growth (Forward) % 8.1 8.2 Investable universe
qualitative and quantitative filtering)
Stocks
ROE 11.4 18.0
Portfolio 64
Already owned within
31
Framlington Equities
Source: Northfield/FactSet/AXA IM as at 31/03/2019. Strategy unconstrained - MSCI All Country World used for comparative purposes. For illustrative purposes only. Information
regarding the model portfolio characteristics above is provided for reference only and does not represent the experience of the strategy nor is it intended as a representation or
warranty by AXA IM or any other persons or entity as to the actual composition of or performance of any future investment. No assurance can be given that the strategy will be
201830y
successful or achieve its objectives. The figures provided do not relate to actual portfolios in the strategy. Actual portfolios are subject to the risks of portfolio management and
trading, including but not limited to trading costs, market impact and fill rates, and may not resemble the model portfolio information presented herein as a result. The examples
44 provided above are for illustrative
FRAMLINGTON EQUITIES purposes only and are intended to reflect the typical securities, sectors, and/or geographies that could be deployed by the strategy to generate
the target returns, and should not be considered a recommendation or solicitation to buy or sell any particular security. *Predicted Tracking Error.AXA WF Framlington Evolving Trends
AXA WF Framlington
Evolving Trends
Sub-theme breakdown
Aged Care (9%)
TRANSITIONING
SOCIETIES Silver Spending (3%)
11% AGEING & Treatment (6%)
LIFESTYLE
Wellness (6%)
23%
Discovery (10%)
CLEANTECH 3% 9%
5%
12% 3% 3%
Decision (9%)
6% Delivery (6%)
6%
4% Data & Enablers (9%)
6%
2%
Industrial Automation (9%)
6%
Transport (2%)
10%
2% Technology & Enablers (6%)
9% Recycling & Waste Reduction (2%)
9%
Responsible Nutrition (4%)
9% 6%
Smart Energy (6%)
AUTOMATION CONNECTED Basic needs (3%)
18% CONSUMER Changing consumption (5%)
34%
Urbanisation and infrastructure (3%)
Source: AXA IM as at 31/03/2019. No assurance can be given that the strategy will be successful or that investors will not lose some or all of their capital. AXA IM reserves the right to modify any of the
investment process described herein at its discretion. CR10177/08-19
201830y
46 FRAMLINGTON EQUITIESAXA Framlington Global Technology Composite
Disclosures
Compliance Statement Policy on derivatives
For Segregated Accounts, derivatives are only used with the client’s authorisation. Futures and options are
AXA IM claims compliance with the Global Investment Performance Standards (GIPS®) and has prepared and used, mainly for hedging purposes. Except for specifically designated funds such as Futures Funds, no
presented this report in compliance with the GIPS standards. AXA IM has been independently verified for portfolio is to be overexposed to the market, translating as a strict “no leveraging” policy. There are no
the period 31 Dec 1999 – 31 Dec 2017. The verification report is available upon request. Verification futures funds in this composite.
assesses whether (1) the Firm has complied with all the composite construction requirements of the GIPS
Benchmark disclaimer
standards on a firm-wide basis and (2) the Firm’s policies and procedures are designed to calculate and
The composite benchmark is generally determined by the benchmark of the dominant portfolio in the
present performance in compliance with the GIPS standards. Verification does not ensure the accuracy of
composite. Where portfolios are managed according to peer group asset allocations (notably in the UK),
any composite presentation.
the composite benchmark is constructed by assigning a market index to published asset allocation
weightings, which are periodically rebalanced. The extent to which any given composite invests in countries
Presentation of the Firm or regions not included in the benchmark depends on the limits (if any) specified in the investment
AXA Investment Managers is a firm comprising two “sub‐firms” for GIPS® purposes, each of which is defined management contracts of the individual portfolios in the composite. In general, such investment is
as described: marginal and is typically less than 10% for any given portfolio.
1/ AXA IM: AXA IM is an active, long term multi‐asset manager with offices in the Americas, Asia Pacific and
EMEA regions with its investment teams offering the following investment capabilities: - Framlington Benchmark Definition
Equities (bottom‐up Thematic, Specialist sector, Global and regional equities, Emerging market equities, From 31/12/2000 100.00% MSCI World / Information Technology Gross Return USD
Income, Small cap) - Fixed Income (bottom‐up credit analysis and top‐down macroeconomic research,
Inflation, Aggregate, Multi‐currencies, Investment grade credit, High yield credit, Asian and emerging Minimum asset level
markets) - Structured Finance (alternative credit, ABS/CLOs, Leveraged loans, Mortgages, Private debt, Bank We have defined upper and lower thresholds and a grace period to avoid excessive volatility in the
capital solutions, ILS) - Multi Asset Client Solutions (Outcome oriented solutions, Multi‐asset solutions, composite construction.
Dynamic risk management, Balance sheet delegation, Asset allocation) - Chorus (absolute return, multi For US Fixed Income composites, the lower threshold is defined at 20,000,000 USD, where the upper
premia) threshold is not applicable, with a 3-month grace period.
2/ Rosenberg Equities: Rosenberg Equities is an equity manager with offices in the U.S., U.K., Japan, For AXA Framlington LatAm composite, the upper threshold is defined at 10,000,000 USD the lower
Singapore and Hong Kong, offering investment capabilities for Advanced factors and Systematic Alpha threshold at 8,000,000 USD, with a 3-month grace period.
strategies. For Framlington UK composites the upper threshold is defined at 1,000,000 GBP the lower threshold at
For more information about AXA Investment Managers, you can refer to AXA IM website http://www.axa- 900,000 GBP, with a 3-month grace period except for the AXA Framlington Managed Balanced Composites,
im.com the upper threshold is defined 850,000 GBP and lower threshold is 816,000 GBP.
For the composite International Equity, Global Entrepreneur, the upper threshold is defined at 500,000 EUR,
GIPS Disclosures where the lower threshold is not applicable, with a 3-month grace period.
Portfolio valuation For GBP LDI composites, the upper threshold is defined at 5,000,000 GBP and lower threshold is 4,000,000
Portfolios are valued according to the market closing prices each day, except for certain portfolios valued in GBP, with a 6-month grace period.
Germany, which use the closing price of the previous day, and the UK, where the price used is the 2pm price
For all other composites, the upper threshold is defined at 10,000,000 EUR the lower threshold at 8,000,000
of the same day. In order to apply this valuation policy, the NAV of the day following the valuation date is
EUR, with a 6-month grace period.
used for certain portfolios. Dividends paid on securities in the portfolio are accounted for using ex-dividend
date and are net of any withholding taxes. Buy and sell transactions are taken into account using trade-date While a portfolio AUM is less than the upper threshold, it is excluded from the performance calculation for
valuation after confirmation for the trade by the counterparty. Accrued interest on debt securities is the composite to which it belongs. Once a portfolio AUM equals to exceeds the upper threshold, the
recorded each time the portfolio is valued. All proceeds, including realised and unrealised gains or losses in performance of the portfolio is included in the performance calculation of the composite for the following
the portfolio are included in the value of assets. There are minor exceptions to these general rules for month, starting from the last valuation day of the month during which the UM first equalised or exceeded
specific types of portfolios. the upper threshold.
201830y
47 FRAMLINGTON EQUITIESAXA Framlington Global Technology Composite
Disclosures
The AUM for each portfolio will be measured on the last valuation day of each month, for the purpose of The benchmark return is calculated using monthly cashflows and do not include potential transaction costs
determining whether or not a portfolio will contribute to the performance calculation of a composite in the or management fees.
following month.
- The Annualised Performance is shown on a 365 days basis.
“Buffer” Rule: Once a portfolio has been included in the performance calculation of the composite, it
Additional information regarding policies for calculating and reporting returns in compliance with the GIPS
continues to be included unless either:
Standards is available upon request.
- The AUM falls below the lower threshold, or
- the AUM has remained less than the upper threshold for the grace period. Dispersion
When either of these two conditions is met at the end of a given month, the portfolio is excluded from the Since 31/12/2012, a methodology change on dispersion has occurred: dispersion is defined as the standard
performance calculation for the following month. deviation of portfolios returns for the period in question, taking into account the portfolio beginning
relative weight (asset weighted dispersion measure). It is only displayed if there are at least five portfolios
Performance result / fees that remain for the entire period in the composite.
Performance results are presented gross of fees. Portfolios net returns are computed from Net Asset Disclaimer
Values (dividend reinvested if specified) and each portfolio has an on-going charge assigned. Portfolios This document is for informational purposes only and does not constitute, on AXA Investment Managers’
gross returns are computed from Net Asset Values adding back technical fee rate – which may be ongoing part, an offer to buy or sell or a solicitation of investment advice. Due to its simplification, this document is
charges or Total Expenses Ratio – this calculated monthly and compounded up for relevant periods. The partial and the information can be subjective. AXA Investment Managers may but shall not be obligated to
range of the Technical Fee Rate for this composite is shown above. The rates shown do not imply any limit update or otherwise revise this document without any prior notice. All information in this document is
(either maximum or minimum) on the fees application to new mandates. The range of the Technical Fee established on the accounting information or on market data basis. AXA Investment Managers disclaims
Rate for this composite is shown above. The rates shown do not imply any limit (either maximum or any and all liability relating to a decision based on or for reliance on this document. The most recent
minimum) on the fees application to new mandates. prospectus is available to all investors and must be read prior subscription and the decision whether to
invest or not must be based on the information contained in the prospectus.
Compliance with local laws
This performance presentation does not conflict with any relevant local laws in any of the AXA M
management centres included in the Firm perimeter as at 31/12/2016.
Calculation methodology
Composite performance is calculated on a monthly basis as follows:
- The portfolios entering the performance calculation are determined according to the Minimum Asset
Level and Buffer Rule described above.
- Each portfolio brings its own specific start and end dates to the calculation, depending on the
particular valuation dates of the portfolio.
- The performance of each portfolio is calculated using the start and end dates relevant to the period in
question, and using daily-either cashflows
- The performance of a composite is calculated as a weighted average (using each portfolio’s assets
under management as at each portfolio’s specific start date for the period in question) of the
performance of the portfolios.
- Quarterly, annual, cumulative and since-inception returns are calculated by linking the composite
monthly returns through compounded multiplication.
.
201830y
48 FRAMLINGTON EQUITIESYou can also read