U.S. Corporate On the up - S&P Global
←
→
Page content transcription
If your browser does not render page correctly, please read the page content below
U.S.
On the Corporate
       up
European Corporate Credit Outlook 2018
                                          2 Summary and Top Risks
                                            Top 5 Themes for 2020
                                          4 ‘B-’ Debt And CLO Risk
                                          6 The Growth of ‘BBB’

Credit Outlook
                                          8 Disruption and Uncertainty
                                         12 Sector Growth Prospects
                                         15 Trade Tensions
                                            Other Topics
                                         16 M&A

2020
                                         17 Ratings Trends
                                         19 Financing Conditions
                                         20 Default Outlook
                                         21 Leveraged Finance

Balancing Act
U.S. Corporate Credit Outlook 2020: Balancing Act

U.S. Corporate Credit Outlook 2020
                                                                                                           Authors
Balancing Act                                                                                              David C Tesher
                                                                                                           New York
December 16, 2019                                                                                          david.tesher
                                                                                                           @spglobal.com
                                                                                                           +1-212-438-2618
 Key Takeaways
                                                                                                           Gareth Williams
                                                                                                           London
– Three pressure points. A U.S. economic slowdown, credit-risk differentiation and U.S. policy
                                                                                                           gareth.williams
  risks are three pressure points for U.S. corporates going into 2020 and beyond.                          @spglobal.com
– Economic Slowdown. Federal Reserve rate cuts have helped ease recession fears and
  stabilize credit markets. However, economic slowdown concerns are challenging U.S. non-                  SECONDARY CONTACT
                                                                                                           Gregg Lemos-Stein
  financial corporates as reflected by an increasing negative ratings outlook bias.
                                                                                                           New York
– Credit-risk pricing-differentiation to persist. In our view, the differentiation in credit risk          gregg.lemos-
  pricing between stronger and weaker corporate credits will continue. Stronger credits will               stein@spglobal.com
  continue to benefit from favorable financing conditions, while weaker credits will face greater          +1-212-438-1809
  scrutiny and pricing pressures in accessing capital.
                                                                                                           Defaults and Rating Trends
– U.S. policy risks. The two main policy risks are trade and the presidential election. The U.S.-          Evan Gunter
  China ‘phase 1’ trade deal and progress on USMCA are near-term positives although the former             New York
  does not fully address the dispute over technology, intellectual property and market access. In          evan.gunter
  respect of the U.S. presidential nomination, sharp differences in policy platforms among                 @spglobal.com
  candidates increases policy uncertainty.                                                                 +1-212-438-6412

– Disruptive trends and regulatory changes may present further challenges. U.S. non-financial              Nick Kraemer
  corporates face a challenging operating environment; slowing global growth, rising cost                  New York
  pressures, more regulation particularly in relation to environmental concerns, and uncertainty           nick.kraemer
  around trade and supply chains offer a difficult backdrop.                                               @spglobal.com
                                                                                                           +1-212-438-1698
– Still growing. Despite these pressures, our base case assumptions point to continued growth
  for the corporate sector with revenue and cash flow growth still positive even if relatively             Leveraged Finance
  subdued in comparison to the more buoyant years of this cycle.                                           Ramki Muthukrishnan
                                                                                                           New
Markets enter 2020 precariously balanced. Deteriorating economic momentum has been countered               Yorkamki.muthukrishnan
                                                                                                           @spglobal.com
with a renewed monetary easing cycle from the Federal Reserve, helping underpin financing                  +1-212-438-1384
conditions, market confidence and liquidity. While our base case assumption is that the U.S.
economy and key global export markets will continue to grow, the rate of expansion is weakening            Steve Wilkinson
and significant headwinds are emerging for the corporate sector.                                           New York
                                                                                                           steve.wilkinson
Simmering trade tensions have contributed to uncertainty around supply-chains and are raising              @spglobal.com
                                                                                                           +1-212-438-5903
political tension around tax rates, intellectual property and control over regulation. Cost pressures,
notably in labor markets, are starting to build and investment plans are being scaled back.                Robert Schulz
Moreover many industries that are investing are competing intensely for market position as                 New York
disruptive new technologies encourage new entrants and require investment in new platforms.                robert.schulz
                                                                                                           @spglobal.com
Many industries are having to adjust to regulatory efforts to tackle environmental concerns. These
                                                                                                           +1-212-438-7808
all bring significant credit risks and represent an uncertain operating environment. The positive
news is that S&P Global Ratings analysts expect to see revenues and EBITDA continue to expand.             RESEARCH CONTRIBUTOR
                                                                                                           Yogesh Balasubramanian
Late-cycle anxiety has already meant that weaker corporate credits – those rated ‘B’ or below – are        Mumbai
benefitting less than higher-rated companies from interest rates remaining lower for longer. We            yogesh.balasubramanian@
expect this risk differentiation to persist next year, with weaker credits facing greater scrutiny and     spglobal.com

pricing pressures in accessing capital. It remains the case that many financial assets are valued
                                                                                                           Lekha Prabhakar
relatively generously and thus vulnerable to a decisive change in market perceptions and sentiment         Mumbai
regarding the cycle.                                                                                       lekha.prabhakar@spglobal.
                                                                                                           com
In the following pages, we discuss five key themes for U.S. corporate credit in 2020: ‘B-‘ rated debt
and CLO risk; the rapid growth of ‘BBB’ rated debt; the disruption and uncertainty facing many
sectors; prospects for profits growth in this environment; and the likely persistence of uncertainty
around trade policy. Following that we look at some core themes – M&A, ratings trends, financing
conditions, the default outlook and a detailed analysis of the outlook for leveraged finance.

S&P Global Ratings                                                                           December 16, 2019   2
U.S. Corporate Credit Outlook 2020: Balancing Act
Top Risks
Table 1
Top North-America Risks
Geopolitical and trade disputes cloud world growth
Risk
Risk level* Very low Moderate Elevated High Very high Improving Unchanged Worsening
trend**
Trade and geopolitical tensions continue to dampen business confidence and weigh on growth forecasts. While a mini-
deal between the U.S. and China has been announced, we do not think this will address the dispute over technology,
intellectual property and market access. Ongoing protests in Hong Kong and the Congressional U.S. response
complicates U.S.-China trade negotiations. The United States-Mexico-Canada Agreement (USMCA) is close to being
ratified, but other regional trade tensions linger such as the U.S. placing tariffs on EU goods in October. Government
interventions via tariffs, subsidies, and regulations continue to cloud capex decisions. Despite trade uncertainty, a
resilient U.S. labor market and economy prompted S&P Global Ratings’ economists to lower their U.S. recession
forecast.
Mature credit cycle and the potential for volatile liquidity
Risk
Risk level* Very low Moderate Elevated High Very high Improving Unchanged Worsening
trend**
Trade tensions and other risks to global growth led the Fed to three quarter-point rate cuts in three consecutive
meetings since July. While lower interest rates contributed to a drop in investment-grade funding costs, companies
rated ‘B-’ or lower face widening risk premiums as investors have moved up the credit curve. The build-up in corporate
debt over the past decade of economic expansion has led to a growing concentration of investment-grade ratings in the
‘BBB’ category and speculative-grade ratings in the ‘B’ category. With debt concentrations growing, investors and
regulators continue to focus on liquidity risks, especially among thinly traded instruments within the credit market.
Cybersecurity threats to business activity
Risk
Risk level* Very low Moderate Elevated High Very high Improving Unchanged Worsening
trend**
Increasing technological dependency and global interconnectedness means cyber risk poses a systemic threat and
significant single-entity risk. As cyberattacks become increasingly sophisticated, new targets and methods are
emerging. Companies face the risk of criminal, proxy and direct state-sponsored cyber-attacks. Governments are also
vulnerable, with local governments appearing to be the target with increasing frequency. This rapidly emerging risk has
led to a fast-growing cyber-insurance market, though insured losses from cyber-attacks are still small compared with
economic losses. Still, the relentlessness of cyber-attacks creates a need for heightened governance measures for all
types of issuers.
Housing imbalances remain a threat for Canada even as credit growth slows
Risk
Risk level* Very low Moderate Elevated High Very high Improving Unchanged Worsening
trend**
More stringent government mortgage qualification rules for homebuyers have resulted in decelerating home prices
across Canada, with household credit growth slowing more quickly versus other advanced economies. Although
consumer debt service burdens have eased with a) less incurrence of new debt and b) a pick-up in income growth,
elevated house price-to-income multiples and stretched housing affordability remain a threat to financial stability.
However, the Bank of Canada’s dovish policy will support steady debt-service ratios for consumers.
Sources: S&P Global Ratings.
* Risk levels may be classified as very low, moderate, elevated, high, or very high, and are evaluated by considering both the likelihood and systemic
impact of such an event occurring over the next one to two years. Typically these risks are not factored into our base case rating assumptions unless the risk
level is very high.
** Risk trend reflects our current view on whether the risk level could increase or decrease over the next 12 months.
S&P Global Ratings December 16, 2019 3U.S. Corporate Credit Outlook 2020: Balancing Act
Top 5 themes for 2020
1. The Surge In ‘B-‘ Debt And Risks For CLOs
Protracted low interest rates and a borrower-friendly debt market have allowed investment-grade
and high-quality speculative grade firms across sectors to borrow cheaply and extend their
maturity curve. Further down the credit spectrum these benefits are felt less evenly. The
speculative grade debt market remains bifurcated, with demand firmly skewed in favor of high-
quality names, primarily among ‘BB’ category credits. This is partly a reflection of a more
challenging economic environment which could potentially translate to increased defaults and
downgrades concentrated at the lower reaches of non-investment grade credit.
The current negative bias, which we define as the percentage of issuers with a negative outlook or
ratings on CreditWatch negative, is 16% for the U.S. ‘B-’ population. Risk is particularly pronounced
in sectors such as retail and oil and gas where about 15% and 14% of the portfolio are rated in the
‘CCC’ category or lower. Sectors such as aerospace & defense, chemicals, health care, non-durable
consumer product companies, capital goods and metals & mining could all potentially confront
greater slippages from the ‘B’ to ‘CCC’ category in the event of a sharp slowdown in growth.
In terms of the sector concentration of ‘B-’ rated debt, the technology, business and consumer
services, telecommunications and health care sectors together account for more than 55% of the
total debt outstanding of all U.S.-based ‘B- issuers (see chart 1). Including media and the relatively
beleaguered retail and restaurants and oil and gas sectors, this figure jumps to nearly two-thirds of
the total. Of some comfort is the observation that the two most prominent sectors – technology and
business and consumer services – which represent just under 40% of total ‘B-’ debt outstanding
only have debt amounting to 4.5% of the total ‘B-’ pool on negative outlook or credit watch negative.
Sectors at the greatest risk of downgrades are autos, telecommunications and consumer products
accounting for 16% of total ‘B-’ debt, nearly two-thirds of which is on negative outlook.
Chart 1
Share Of Non-Financial ‘B-’ Rated Debt Outstanding By Sector
Sector Share of B- Debt Outstanding (%) Sector Share of B- Debt with Negative/Watch Negative Outlook (%)
25
20
15
10
5
0
Source: S&P Global Ratings
Given the sharp rise in ‘B-’ issuers in technology in recent years, as well as the structural
headwinds confronting consumer products and retailers, this debt can be a source of investor
concern in the event of financial market volatility or an economic downturn. Furthermore, history
has shown that even in a strong economic environment, the ‘B-’ segment has much higher ratings
volatility and a higher likelihood of both downgrades and default.
This is a cause of concern for many CLO managers and investors. The percentage of ‘B-’ leveraged
loans in the S&P/LSTA leverages loan index has passed 13%, and loans from companies rated ‘B-’
now constitute over 19% of assets in U.S. reinvested broadly syndicated loan (BSL) CLO collateral
pools, more than doubling the proportion of ‘B-’ assets at the end of 2015. Most BSL CLOs have an
S&P Global Ratings December 16, 2019 4U.S. Corporate Credit Outlook 2020: Balancing Act
allowable bucket of 7.5% for loans with ‘CCC’ rating in their collateral pool. Once the proportion of
‘CCC’ loans rises above this preset threshold, the par value of the loans will be haircut as part of the
calculation of the par coverage test ratios. In such cases, the coverage tests could fail, resulting in
payments to the equity tranche holders and subordinate noteholders being halted.
Chart 2
‘B-’ And Lower Issuers Represent A Growing Share Of U.S. Speculative-Grade Issuers
B- and Below Rated Issuers As % Of U.S. Speculative-Grade (By Count)
35%
30%
25%
20%
15%
10%
5%
0%
81 83 85 87 89 91 93 95 97 99 01 03 05 07 09 11 13 15 17 19 As of
Oct. 19
Source: S&P Global Market Intelligence’s CreditPro. *Through Oct 31. Note: Includes S&P rated non-financial corporates.
In an effort to shed some light on the potential impact of downgrades and defaults within the
cohort of ‘B-’ rated obligors on rated U.S. BSL CLOs, we recently published a scenario-based
analysis (see ‘To “B-“ Or Not To “B-“? A CLO Scenario Analysis In Three Acts’, Nov. 26, 2019). We
analyzed three scenarios of increasing severity, based on broad hypothetical outcomes. These
scenarios are not meant to be predictive or part of any outlook statement, nor are they meant to
reflect any of the stresses outlined in our rating definitions; they are specifically geared to address
the questions and concerns voiced to us from CLO market participants. Chart 3 shows the model
derived impact of these scenarios on tranches within the broadly syndicated CLO universe rated by
S&P Global Ratings.
Chart 3
CLO B- Downgrade Scenario Analysis - Summary Of Shock Scenarios And Ratings Impact
Source: S&P Global Ratings
S&P Global Ratings December 16, 2019 5U.S. Corporate Credit Outlook 2020: Balancing Act
2. Lending Conditions and Financial Policy Decisions Support Growth Of ‘BBB’
In the U.S., ‘BBB’ non-financial corporate debt has grown more than over 200% since 2007 (see
chart 4), and some 39% between the end of 2015 and mid-2019 (to $2.5 trillion from $1.8 trillion). In
terms of their share of the total amount of rated nonfinancial corporate bond debt, the top 10
issuers account for 32% of ‘BBB’ non-financial corporate bond debt in the U.S.
Chart 4
U.S. Corporate ‘BBB’ Debt – 87% of growth since 2007 is from ‘BBB+’ and ‘BBB’ rating levels
BBB- BBB BBB+
$ Bn.
3500
3000
2500 1186 1188
1211
2000 1040 1135
760 824
1500 655
585 552 1469 1559
1000 421 497 832 916 1067
403 762 809
573 506 603 709
500 405 541
507 544 717 662 574 569 542
263 338 319 382 344 374
0
07 08 09 10 11 12 13 14 15 16 17 18 19
Source: S&P Global Ratings. S&P Reported balance sheet debt for rated ‘BBB’ U.S. nonfinancial corporates; includes
confidential entities. Data as of 11/8/2019.
Most of the expansion of the ‘BBB’ rating category has come from higher-rated issuers where
downgrades to speculative grade are more rare (‘BBB+’ and ‘BBB’). The proportion of debt rated at
‘BBB-’, the most vulnerable level, is the smallest of the three sub categories and has been on a
declining trend since 2015 (see chart 5). Roughly 84% sits 2-3 notches above speculative grade.
Chart 5
U.S. Corporate ‘BBB’ Debt – Lowest Rated ‘BBB-‘ Accounts for 16% Of Debt
BBB- BBB BBB+
100%
90%
80% 38% 39% 33% 36% 37% 38% 37% 38% 37% 36%
40% 42% 42%
70%
60%
50%
38% 42% 37% 40% 38% 37% 32%
40% 38% 41% 34% 37% 46% 47%
30%
20%
10% 25% 23% 25% 28% 23% 22% 25% 25% 28% 24% 20% 18% 16%
0%
07 08 09 10 11 12 13 14 15 16 17 18 19
Source: S&P Global Ratings. S&P reported balance sheet debt for rated ‘BBB’ U.S. nonfinancial corporates; includes
confidential entities. Data as of 11/8/2019. Data labels may not sum to 100% due to rounding.
Growth of the ‘BBB’ segment has occurred amid favorable global lending conditions, which are
largely still intact. This pace of growth in the ‘BBB’ market in recent years is largely attributable to
very low interest rates since the financial crisis in both the U.S. and Europe. This low interest rate
environment has allowed ‘BBB’ companies to issue at rates once enjoyed by 'A' and even 'AA'
issuers. Some higher-rated firms have made decisions (such as debt-funded mergers, acquisitions,
and shareholder returns) that have led to downgrades to ‘BBB’, in part due to the minimal
difference in the relative cost of funding.
S&P Global Ratings December 16, 2019 6U.S. Corporate Credit Outlook 2020: Balancing Act
This large buildup in debt just one rating category above speculative grade (‘BB+’ or lower) is raising
concerns among stakeholders over the risk of companies becoming fallen angels (issuers
downgraded to speculative grade from investment grade) and the ability of the speculative-grade
market to absorb potentially large amounts of downgraded debt. Significant amounts of
investment-grade debt is held in Separate Managed Accounts (SMAs) that have stringent ratings
eligibility requirements and forced sale provisions tied to downgrades that typically range from 30
to 180 days. That said, the speculative-grade market has shown its ability to absorb large amounts
of downgraded ‘BBB’ debt in the past (see "The U.S. Speculative-Grade Market Can Withstand ‘BBB’
Downgrades," April 24, 2019)
Chart 6
U.S. Corporate ‘BBB’ Sector Level Debt Leverage Bands for 2019 (Projections)
0-1.5x 1.5-2x 2-3x 3-4x 4-5x 5x+ Debt Concentration [RHS]
100% 3% 2% 18%
6% 12% 6%
90% 26% 25% 3% 19% 16%
36% 21%
80% 44% 44% 14%
42% 43% 51% 46% 52% 16%
32%
70% 58%
41% 12%
60% 26% 80% 96%
44% 10%
50% 38%
11%
37% 48% 8%
40% 24% 24%
38% 69%
30% 40% 31% 21% 37%
6%
46% 40% 4%
20% 18% 31% 42% 21%
9% 29% 10%
10% 22%
9% 3% 2%
17% 6% 12% 8% 5% 3%
11% 9% 2% 6%
6% 4% 1% 4% 1% 4% 4%
0% 1% 1% 0%
Source: S&P Global Ratings. Data as of 11/8/2019. Note: Percentage of total S&P adjusted ‘BBB’ debt within leverage band over total S&P adjusted
debt by sector. Debt concentration depicts sector debt as a percent of total ‘BBB’ debt
Nonetheless, as economic growth slows companies will face challenges, particularly in more
cyclical sectors such as auto manufacturers. This is notable because Ford and General Motors
account for 29% of the debt outstanding for the top 10 BBB-rated issuers in the region1. Debt levels
and leverage for the top 10 borrowers in this rating segment have decreased slightly this year as a
result of debt repayments at AT&T and General Electric, which offset United Technologies' and
Broadcom's borrowing to fund acquisitions. Weighted-average leverage has declined slightly, to 3x
in mid-2019 from 3.2x at the end of 2018. We expect credit metrics will continue to improve in 2020,
with the majority of the top 10 maintaining relatively stable metrics and a few achieving more
notable improvements. We expect leverage to decline at General Electric, CVS Health, and United
Technologies in 2020, largely as a result of asset sales, continued debt repayment, and an all-stock
merger, respectively.
Meanwhile, downgrade risk and upgrade potential for the top 10 are relatively balanced. In fact, two
of these companies, Verizon and United Technologies, are rated ‘BBB+’, the highest 'BBB' category
rating. The rating outlook on Verizon is positive, while the rating on United Technologies is on
CreditWatch with positive implications, indicating that these companies could be upgraded to the
‘A’ category in 2020. Three companies are rated ‘BBB-’: Ford, Energy Transfer, and Broadcom.
These represent 27% of the top 10 debt. The outlooks are stable.
1
See Credit Trends: 'BBB' Pulse: Vitals Remain Stable For The Largest Issuers, Nov.25, 2019
S&P Global Ratings December 16, 2019 7U.S. Corporate Credit Outlook 2020: Balancing Act 3. Headwinds from tech disruption, regulation, and litigation S&P Global Ratings recently published the fifth annual series of Industry Top Trends reports covering 25 global corporate and infrastructure industries2. These set out the key assumptions, risks, and opportunities seen by S&P Global Ratings analysts for industries in the year ahead. Table 2 provides a summary of these key risks and opportunities in relation to North American companies. One consistent theme that emerges is that almost all industries are battling against powerful headwinds that are constraining growth and posing significant risks to credit quality. Although highly sector-specific in their nature, technological disruption, environmental, social and regulatory costs, and regulations loom large across many sectors. Many aren’t new, but it is striking how central these risks have become to sector credit conditions and outlooks. There are three broad clusters of risks: – Technological disruption that is threatening market position, altering consumer consumption patterns; – Regulations encompassing a wide spectrum that includes efforts to address environmental concerns and pricing mechanisms to better reflect climate-related risks and impacts, and the governance of emerging technologies; – Litigation, which includes ongoing cases in relation to opioids and health care and emissions breaches for autos. In all cases, there are significant credit risks posed by these pressures particularly in terms of weaker revenues (new competition, changing preferences, pricing pressures), heightened capital expenditure requirements (for example to meet new regulatory standards, develop new technologies, or compete for market share), and a greater need for M&A (to find new sources of growth or protect market share). These all pose risks to cash flow growth and predictably and often requires substantial funding commitments. An additional layer of uncertainty in reacting to these pressures comes from the upcoming 2020 presidential election, which could alter the political priorities and framing of these challenges, as well as ongoing uncertainties around trade policy which can affect supply-chain decision making. Some specific sector examples: Retail Retailers remain under duress from secular changes, including rapidly evolving shopping habits, the impact of e-commerce and a shift from larger department store formats. Key trends include: – Continued growth in online sales; – The need for business models to evolve to keep pace with consumer expectations; – Increasing focus on value and high price sensitivity due to transparency afforded by the internet; – Competition for consumers' wallet share from autos, rent, health care, technology, and experiences. As a result of these headwinds, we expect very weak (less than 2%) top-line growth in the department store and apparel segments in 2020. Retailers' margins will also continue to be pressured due to the requisite investments in omni-channel capabilities in order to compete effectively. Consumer Durables Retailers are increasing private-label offerings to differentiate themselves and drive loyalty, as well as to shore up profit margins. We expect branded-goods companies to lose some shelf space this year, and will need to focus on managing price gaps with private labels to keep consumers from switching. 2 See https://www.spglobal.com/ratings/en/research-insights/topics/corporate-ratings-industry-top-trends for the 25 individual industry reports as well as a single compilation that brings them all into one publication with an overview that highlights the key themes emerging from the sector analysis. S&P Global Ratings December 16, 2019 8
U.S. Corporate Credit Outlook 2020: Balancing Act

Media

Increasing audience fragmentation, intensifying over-the-top (OTT) competition, and accelerating
declines of pay-TV subscribers are driving significant evolution in the media ecosystem. We expect
media companies to continue to invest in their own content production. This could pressure
operating margins, cash flow, and credit metrics, especially if increased competition drives up
content costs.

Real Estate

There is growing pressure on retail assets, particularly lower-quality shopping centers. This is likely
to continue in 2020 as retailers remain under pressure from secular changes, including the impact
of e-commerce and a shift from larger department store formats. Tenants may resort to store
closures to survive.

Environmental (Cross-sector)

Regulators are primarily driving these initiatives. Firms from a few sectors are likely to be
influenced by changing legislations. Examples include IMO 2020 regulations reducing sulfur
content to 0.5% from 3.5% in marine fuel, which has direct or indirect implications for shipping, oil
and gas, airlines and CO2 emissions regulations which are relevant to utilities, autos, and cement
manufacturers, among others. Integrated steel producers in North America face increasing
pressure to invest significantly to reduce heavy GHG emissions from coal-fired blast furnaces. In
the utility sector, renewables are expected to benefit from improved economics, as well as a
relatively long runway for the solar Investment Tax Credit, creating a renewable-heavy and
demand-uncertain grid that requires more flexibility--weakening the long-term case for baseload
generation such as coal and nuclear in wholesale markets. During the next decade, social and
environmental agendas will begin to influence consumer behavior, with more focus on plastics,
supply chains, and environmental policies.

Regulatory (Cross-sector)

Policy uncertainty amid the 2020 presidential elections is a particular concern for healthcare and
midstream energy companies. Other examples include legal and regulatory adversities faced by
the tobacco sector, the increasing attention paid to media and tech companies with a focus on
user privacy, unsafe content, and antitrust/market-power concerns, opposition to large pipeline
projects which will continue to be a risk for midstream companies.

The above examples are not exhaustive, but should illustrate the breadth and depth of the
challenges facing the North American corporate sector in relation to this theme. The risks and
credit impact are both short- and long-term in nature and present significant threats to both
financial and business risk profiles.

S&P Global Ratings                                                                            December 16, 2019   9
U.S. Corporate Credit Outlook 2020: Balancing Act
Table 2
Industry Top Risks – North America
Sector
Aerospace and Defense The grounding of the MAX has gone on longer than we expected. If delays continue well into 2020, Boeing
could decide to further cut or even suspend MAX production temporarily.
We expect U.S. defense spending to increase only modestly for the next few years with declines in defense
spending possible after fiscal 2021.
Air traffic in 2018 has trended below the long-term average of 5% due to trade tensions and slowing economic
growth, a trajectory that is likely to continue and could accelerate if the global economy weakens further.
Autos Global autos could face considerable pressure from prolonged trade disputes given potential disruptions to
supply chains.
Non-deferrable capex and R&D-linked electrification, connectivity, and autonomous driving will limit the
scope of restructuring to accommodate softer market conditions and could drive some suppliers out of the
market.
Funding access is an additional risk, as the clouded industry outlook lowers creditor confidence on the
suppliers.
Building Materials A slowdown in economic growth will increase competition in an industry that is already at overcapacity.
Companies facing operating cash flow squeezes will see tighter liquidity and increasing difficulty in
refinancing.
Building materials generally still face overcapacity. The price recovery in 2017-2019 was primarily from the
rationalization of production between producers, for example cement producers in China, without shutting
down excess capacity
Capital Goods We expect divestments and acquisitions to continue as large U.S, European, and Japanese capital goods
companies seek to simplify their structures and invest in higher growth technologies.
We expect large capital goods companies to be able to withstand the downturn well
We expect to see negative rating transitions and a potential increase in defaults in the lowest 'B' and 'CCC'
rating categories
Chemicals A recession in one or more regions is a key risk that could result in lower-than anticipated demand and
earnings
We could see little change in shareholder rewards, M&A, or elevated capital spending. This could hurt credit
quality in an environment of weaker earnings and cash flows
Companies rated ‘B’ or below or those concentrated in fewer end markers are more susceptible to demand
and other shocks
Consumer Products Technology and changes in consumers’ behavior, tastes, and preferences have increased the pace of change
in the consumer products industry and branded goods companies have been focusing on being more agile to
repositioning their portfolios to meet these changes.
The U.S.-China dispute has hurt the smaller, speculative-grade durable and apparel companies and some
seafood processors in Canada that rely heavily on imports from China.
Speculative-grade credit quality will erode rapidly in case of a recession
Health care Disruption in the industry creates risk but also opportunities. Health care systems are rapidly expanding their
service offerings and expanding out of the hospital and into lower-cost delivery settings
Pharma ratings have little capacity for M&A following this year’s deals
The appetite/tolerance for higher leverage has increased in all three main subsectors: pharma, health care
services, and medical equipment. Fueled by a combination of a favorable financing environment, high
multiples, and rapid consolidation, starting leverage has been increasing steadily to almost 7x.
Homebuilders and Deteriorating affordability causes new home volumes and prices to fall
developers Balance sheets appear to be in better shape than just a few years ago, sparking our positive credit bias for
U.S. homebuilders. Overall, leverage appears to have peaked in 2016, after which leading homebuilders
started taking a more conservative stance on debt usage for growth and shareholder returns
Share buybacks could erode a growing credit buffers.
Hotels, Gaming, and We expect the legalization of sports betting in U.S. states to continue gradually following the prior announced
Leisure Supreme Court decision, with euro online gaming companies set to capitalize.
Hotel managers and franchisors weather a U.S. downturn better than owners
We expect fuel expense for all cruise operators to increase in 2020, due to an expected shift in consumption
toward more expensive marine gas oil (MGO), from lower-priced fuels like heavy fuel oil (HFO).
Media and entertainment Several large media companies are embarking on new OTT launches as they look to mitigate the effects of
declining pay-TV subscribers by establishing direct-to-consumer (DTC) OTT services.
We expect more than $3 billion in political advertising revenue for local television in 2020 (largely in the
second half of the year) given the U.S. presidential election and intensifying political climate.
Ad agency holding groups have chosen different approaches to owning data. While Publicis and Interpublic
recently acquired large data assets, WPP and Omnicom are focused on developing internal and open-data
analytics platforms
Metals and mining We are forecasting slower global economic growth in 2020, and a sharper decline could worsen the
deterioration in metals markets
Shareholder returns or new investments consume precious capital
We estimate average steel producer margins will improve modestly in 2020 from currently weak levels.
S&P Global Ratings December 16, 2019 10U.S. Corporate Credit Outlook 2020: Balancing Act
Midstream Energy We believe opposition to large pipeline projects will continue to be a significant risk for midstream companies,
even if the Atlantic Coast Pipeline and Mountain Valley Pipeline projects receive a favorably ruling by the U.S.
Supreme Court
Producer credit quality is under pressure from financial and operational restructurings, and in some cases
bankruptcies.
We think most midstream companies will stay on a more disciplined financial path and focus only on the
highest return projects, while scaling back capital spending.
Oil and gas One of the major sector risks is the debt maturity wall facing speculative-grade companies and their ability to
meet maturities. The
A sharp downturn in the global economy would clearly result in a pronounced decline in demand and therefore
in oil and natural gas prices.
With the E&P portfolio so highly weighted to the lower end of the high yield universe, especially in the U.S.,
anticipating an increasing wave of defaults and bankruptcies is a normal reaction.
Real estate Retail properties globally are seeing rent and occupancy pressure from store closures and weak performance
of retail tenants resulting from intense e-commerce competition
Uncertainties around the U.S.-China relationship, trade disputes, and geopolitical risks will likely dampen
global growth, with the manufacturing sector exhibiting growing weakness.
We expect real estate issuers to shift focus towards growth vs. enhancing credit quality given access to low-
cost debt
Retail and restaurants Rapidly changing shopping habits, including the shift to e-commerce, mean retailers have to innovate quickly
and effectively while they compete with bigger, better capitalized players like Amazon.
Tariffs will increase the pressure on retailers, exacerbating a difficult situation for issuers who don't have the
financial flexibility to absorb the supply chain shock.
In the U.S., the broader economy is not likely to provide offsetting support to the sector. Despite wage growth
and low unemployment, some indicators suggest a modest slowdown in consumer spending.
Technology Both tariff- and non-tariff related actions have been disruptive to tech companies, adding to business
uncertainties, and resulting in the decelerating IT spending growth.
China's economy has slowed through 2019 and could slow further amid a bitter trade war between it and the
U.S., hurting consumer demand for IT products ranging from smartphones to semiconductors used in autos in
the world’s largest market
Deteriorating credit quality and rising leverage over the past few years and increased recession risk will likely
lead to further downgrades among lower-rated credits
Telecommunications The benefits from 5G investments are uncertain
S&P Global Ratings' economists have increased their forecast of the risk of a U. S. recession to 30%-35%,
which could pose a risk for telecom operators that have exposure to small businesses
A T-Mobile-Sprint merger could have meaningful industry ramifications
Transportation Airlines appear better positioned, particularly in North America, to withstand an economic slowdown than in
the past due to their more prudent capacity decisions, the less aggressive strategies by the big low-cost
airlines (Southwest and WestJet), and their ability to save cash by cutting back on share repurchases.
Sluggish demand trends, most notably stemming from the ongoing U.S.-China trade dispute, and additional
trade tariffs could impede the rebalancing of supply and demand conditions.
Operating efficiency improvements to continue following the successful implementation of precision
scheduled railroading (PSR).
Merchant Power We think incremental retirements of coal-fired generation announced in 2020-2021 will be a surprise as coal
is rapidly becoming the fuel on the margin (highest variable cost) as gas production continues to impress.
Regional risks pertain either to milder weather-influenced demand destruction, or negative demand trends,
such as in the PJM and ISO-NE.
Historically, an economic slowdown has sent demand sharply lower by 5%-6%, which is meaningful enough to
result in negative cash flow generation for some IPPs
Regulated Utilities Over the past decade, utilities have reduced their regulatory lag through the use of forward looking test years,
formula rate plans, multi-year rate orders, increasing use of rider mechanisms, and decoupling.
Our base-case outlook for credit quality reflects our view that most North American utilities would withstand
a change to the credit cycle
Annual capital spending for the industry remains robust at about $140 billion. The industry is primarily
focused on smaller projects that enhance safety, reliability, productivity, and reduce carbon emissions.
Transportation Growing trends of protectionism and isolationism have the potential to limit traffic increases
Infrastructure For ports we anticipate volume will soften in 2020 due to slower U.S. and global economic growth, with trade
or tariff disputes possibly further depressing cargo volumes
Competition from technology used by transportation network companies such as Uber and Lyft is beginning to
destabilize the business model of carparks
Source: S&P Global Ratings.
Risks and opportunities have been simplified and standardized relative to the originals for cross-section clarity. No rank ordering is implied between the
risks/opportunities.
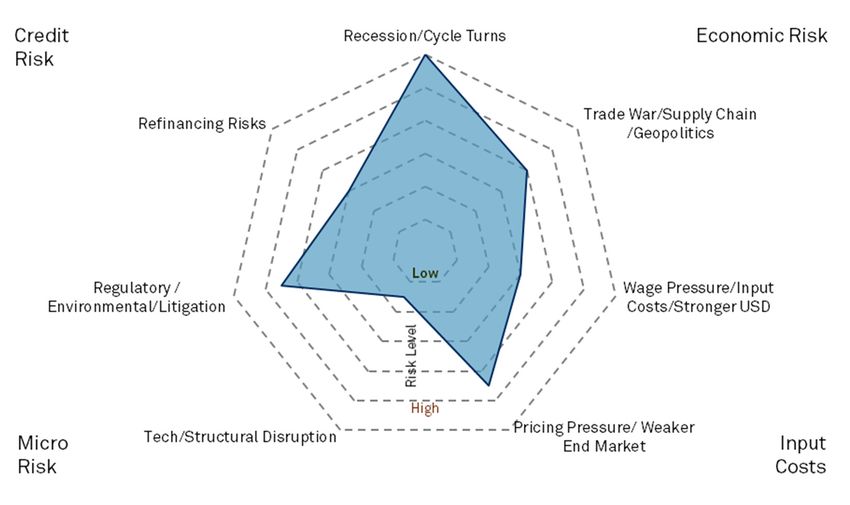
S&P Global Ratings December 16, 2019 11U.S. Corporate Credit Outlook 2020: Balancing Act 4. Profits Growth Outlook Still Positive For 2020 The U.S. corporate sector has faced a more unsettled operating environment over the past year, with heightened uncertainty around trade and supply chains, ongoing disruption, regulatory pressures (see prior section), and deteriorating domestic economic momentum. Our heat map of market and economic leading indicators (see chart 7) shows the clouding of the outlook. A recession in the next 12 months is not our base case given ongoing monetary policy stimulus and positive consumer and labor trends in particular. Chart 7 U.S. Leading Indicators Growth Signal Heat Map Source: S&P Global Ratings Nevertheless, anxiety around the cycle remains acute. This is reflected in the most recent survey of S&P Global Ratings U.S. corporate and infrastructure analysts of the greatest areas of perceived risk for the credits that they follow (see chart 8). The risk of a turn in the economic cycle is seen as the biggest concern, followed by the more structural pressures (regulation, trade, pricing pressure) discussed above. Chart 8 Top Risks U.S. Non-Financial Corporates Source: S&P Global Ratings, Credit Conditions Committee Q4 2019. Data reflects survey results from S&P Global Ratings analysts in Q4 S&P Global Ratings December 16, 2019 12
U.S. Corporate Credit Outlook 2020: Balancing Act

The impact of uncertainty has been felt in investment intentions especially. We flagged the
impending downturn in our annual capital expenditure (capex) survey (see Global Corporate Capex
Survey 2019: Curbed Enthusiasm, June 19, 2019) and capex-sensitive sectors such as capital
goods expect 2020 to be difficult. Multiple key demand drivers for this sector – including autos and
commodities – are stagnating or in decline, while construction has peaked. The deterioration can
be seen in consensus forecast revision trends (see chart 9), where 12-month forward capex
projections are being cut sharply. Nevertheless, while North American capex is likely to decline 1%-
2% in 2020, it is unlikely to fall more dramatically without a drastic change in the economic outlook.
Many sectors are still increasing capex (see chart 10) and indeed need to in response to
technological and competitive pressures. Media, retailing and transportation are all examples of
sectors increasing spending in order to improve digital platforms, content, and logistics.

Chart 9                                                                   Chart 10
YOY Change In 12m Forward Consensus Capex Index                           Capex Growth Forecast 2020: North America Non-Financial
                                                                          Corporate Capex Growth By Sector (Rated universe only)

              North America Monthly 12m Fwd Consensus                                     Capex Growth 2020 (Nominal, USD, %)
              Capex Index (YOY%)                                                               Media
                                                                                  Buis. & Cons. S'vcs
     15                                                                        Aerospace & Defense
                                                                                             Retailing
     10                                                                                   Technology
                                                                                      Transportation
                                                                                       Capital Goods
      5
                                                                                          Healthcare
                                                                                           Chemicals
      0                                                                                     Telecoms
                                                                                 Consumer Products
     -5                                                                              Metals & Mining
                                                                                        Eng. & Const.
                                                                                  Paper & Packaging
   -10                                                                             Building Materials
                                                                                                Autos
   -15                                                                                      Oil & Gas
          07 08 09 10 11 12 13 14 15 16 17 18 19                              Hotels Rest's & Leisure
                                                                                                         -15% -10% -5%     0%    5% 10% 15%

Source: S&P Global Market Intelligence, S&P Global Ratings. Universe is   Source: S&P Global Ratings
Global Capex 2000. Consensus revisions are unweighted local currency.

For the corporate sector as a whole, the impact of adverse developments over the past year can be
seen in sharply weaker growth rates for revenues and EBITDA (see charts 11 and 12).

Chart 11                                                                  Chart 12
North America Non-Financial Corporate Revenue Growth                      North America Non-Financial Corporate EBITDA Growth

                         Sales Growth (YOY%)                                                       EBITDA Growth (YOY%)

                                                          Estimate                                                                  Estimate
   +15                                                                        +20

   +10                                                                        +15
                                                                              +10
     +5
                                                                                +5
     +0
                                                                                +0
     -5
                                                                                -5
    -10                                                                        -10
    -15                                                                        -15
           06 07 08 09 10 11 12 13 14 15 16 17 18 19 20 21                           06 07 08 09 10 11 12 13 14 15 16 17 18 19 20 21

Source: S&P Global Market Intelligence, S&P Global Ratings. Includes non-financial corporations rated by S&P Global Ratings, excluding real estate.
Expressed in U.S. Dollar terms.

S&P Global Ratings                                                                                                December 16, 2019        13
U.S. Corporate Credit Outlook 2020: Balancing Act
S&P Global Ratings estimates that revenues for rated North American companies will only have
grown 3.8% in 2019 vs. 10.2% the prior year; for EBITDA, the 2019 growth rate is also projected at
3.8% vs. 12.1%. Importantly though, in our base assumptions we expect revenue and EBITDA to
expand in 2020 and 2021, with 4%-5% revenue growth and 6%-8% EBITDA growth. Chart 13 shows
the breakdown of these assumptions by sector. All sectors are expected to see positive revenue
growth – albeit very modestly so in some companies – and likewise profit margins are expected to
edge higher for most sectors. Critical to these assumptions are the assumed resilience of U.S. GDP
growth (1.9% next year) and a stabilization of growth in some key export markets (Europe, China),
which have lost economic momentum in recent quarters.
Chart 13
Estimated North America Non-Financial Sector Revenue Growth And EBITDA Margin Change In 2020
Revenue Growth (2020 YOY%, USD) Difference in EBITDA Margin, 2019 to 2020 (%) [RHS] 20.6%
9.5% 9.6% 10.2%
4.8% 4.8% 5.5% 6.4%
1.7% 1.8% 2.8% 2.9% 3.4% 3.5% 4.0% 4.5%
0.2% 0.6% 1.1%
1.5% 0.8% 1.2% 1.3% 1.5%
0.2% 0.7% 0.3% 0.9% 0.3% 0.7% 0.4% 0.1% 0.9% 0.5% 0.3% 0.1% 0.5% 0.3%
Source: S&P Global Ratings
While our base case assumptions suggest positive trends for corporate cash flow growth and
broadly supportive financing conditions, the risk of a serious downturn in either the economic or
credit cycles is not negligible, particularly in the context of a long period of expansion and
exceptionally low bond yields. To assess the risks here, we have published extensive analysis of the
impact that a downturn involving deteriorating economic and credit fundamentals--with rising
defaults and scarce liquidity--may have on ratings and market conditions. For full details, please
see: https://www.spglobal.com/ratings/en/research-insights/topics/when-the-cycle-turns .
S&P Global Ratings December 16, 2019 14U.S. Corporate Credit Outlook 2020: Balancing Act
5. Trade Tensions Likely To Linger
Trade conflict has been a persistent source of uncertainty and market volatility over the last year. In
tandem with worries about global growth, this has been a key factor in inhibiting business
investment and has raised more structural concerns about international supply chains.
Recent developments have suggested a more positive trend - the U.S. and Canada are anticipated
to ratify the USMCA imminently, and the U.S. and China have potentially reached a Phase 1
agreement on trade. The latter is likely to mean that List 4B tariffs are delayed (see chart 14) and
reductions in tariffs already in place3.
Chart 14
U.S. imposed tariffs on remaining US$300 billion of Chinese imports – List 4B Likely Deferred By Phase 1 Deal
As of Sept. 23, 2018 List 4A (Sept. 1, 2019) List 4B (Deferred by Phase 1 Deal) Not covered
Toys and sports equipment
Footwear
Textiles and clothing
Electronics and electrical machinery
Stone and glass
Machinery
Vegetable products
Plastics and rubber
Wood products
Metals
Fuel
Miscellaneous
Chemicals
Prepared foodstuffs
Animal products
Transportation equipment
Hide and skins
Mineral products
0% 20% 40% 60% 80% 100%
Source: United States International Trade Commission Dataweb
Nevertheless, it appears premature to think that trade conflict will not continue to remain a theme
over the coming year. With regard to U.S.-China negotiations, the next steps in negotiation remain
difficult, with uncertainty and tensions likely to persist. Specifically, the next phase of negotiations
that are striving to resolve the tension over technology, intellectual property and market access will
continue to be challenging. This dispute is consequently likely to be a long running one. It is also
likely that the deal may provide for a “snap back” of tariff rates and coverage if either side fails to
make good on commitments. Furthermore, the protests in Hong Kong and the recent U.S.
Congressional response add political complexity to the negotiations.
Wider escalations (for example European autos, Brazilian and Argentinian steel and aluminum)
remain possible. So while the mood music may improve from time to time as agreements edge
forward, complete certainty around trade policy is likely to be absent. As such risks of market
volatility and knock-on effects on corporate planning and investment are likely to persist into 2020.
3
See https://panjiva.com/research/phase-1-phase-out-doesnt-remove-supply-chain-uncertainties/31336
S&P Global Ratings December 16, 2019 15U.S. Corporate Credit Outlook 2020: Balancing Act
M&A
Cautious Boardrooms
While global M&A activity slowed, deals in the U.S. crossed $1 trillion in Q3 and are poised to end
the year at the levels seen in 2018 (see chart 15). IT and healthcare accounted for more than half of
deal volumes, as acquisitions in these sectors were largely driven by industry consolidation and
increased leveraged buyouts. While we expect M&A activity to remain high in sectors such as
healthcare and pharmaceuticals due to increasing level of disruption, the deal volume in 2020 is
likely to dip, given the cautious environment in corporate boardrooms. Potential buyers are likely to
wait-and-watch amid uncertainty about the outcome of the presidential election and trade
negotiations. Also, following the recent burst of consolidation and collaboration in sectors such as
metals & mining, automobiles and media, the activity is expected to slow this year, as these sector
move into a digestion and consolidation mode.
Chart 15 Chart 16
M&A Activity in The U.S. U.S. Deal Activity by Sector
$bn Total Deal Value (U.S. Targets) Utilities
1600 Others 3%
6% IT
Consumer Disc. & 27%
1200 Staples
13%
800
Energy
400
13%
2008 2010 2012 2014 2016 2018 YTD Healthcare
(Nov. Capital Goods 24%
19) 14%
Source: S&P Global Market Intelligence, S&P Global Ratings. Announced deals with U.S. targets, transactions above $100m. Data to Nov. 30 2019.
Holding back
We expect borrowing conditions to remain favorable for acquisitions in 2020. However, this may not
be enough to propel volumes beyond the levels seen in 2018 and 2019. Rising risk tolerance among
investors has been a key driver for sponsors embarking on leveraged buyouts and endorse debt-
funded acquisitions. For instance, U.S. technology companies that have engaged in M&A and
leveraged buyouts have seen significant deterioration in credit quality, with leverage rising to more
than 10x on average from 8.5x in 2016-2018 period. With credit markets displaying late-cycle
characteristics, investors could turn cautious toward such transactions and lean in favor of deals
where there is a clear path for deleveraging.
Unconventional approach
Though deal activity is likely to be impacted by policy uncertainty in the U.S., we believe that the
current slow-growth environment could sway a few firms to pursue transformational deals to
derive greater efficiencies and broaden their revenue channels. As with capex, though, much of the
recent jumbo M&A deals reflect how challenging organic revenue prospects and operating
conditions are for many industries, with growth low, margins under pressure, and intense
disruption. On a more positive note, some companies in sectors such as capital goods are seeking
to gain exposure to new technological capabilities in terms of digitalization, software and A.I., while
U.S. automakers look to collaborate on battery development for electric vehicles and autonomous
driving capabilities. Advertising agencies will continue to acquire technology and data businesses
that could help them enhance their data-driven analytics. In contrast, sectors such as healthcare
and pharma, which continue to face increased pricing pressure, will pursue horizontal mergers in
2020 given the increasing levels of disruption in the healthcare industry.
S&P Global Ratings December 16, 2019 16U.S. Corporate Credit Outlook 2020: Balancing Act
Ratings Trends
Downgrade potential continues to build
U.S. corporate downgrade potential has risen consistently in the past year, with risk rising broadly
across sectors. The growing downgrade potential has coincided with the deceleration in U.S.
economic growth and the recent buildup of low-rated debt.
As a measure of downgrade potential, the negative bias shows the percentage of ratings with
negative outlooks or on CreditWatch with negative implications. The negative bias for North
American nonfinancial corporates has risen by four percentage points in the past year, reaching
15% as of Oct. 31, and marking a ninth consecutive quarter of decline. This incremental rise in the
negative bias has been spread across sectors, with negative biases rising in 12 (out of 16) U.S.
nonfinancial corporate sectors.
Chart 17 Chart 18
North American Non-Financial Corporate Net Outlook Bias North American Non-Financial Corporate Ratings Outlook
Net Outlook Outer ring Positive
North America 5% Negative
Bias (%) Dec 2018 17%
0 Inner ring
-2 End-Oct 2019 Positive
-4 3%
Negative
-6 18%
-8
-10
Stable
-12
76%
-14
-16
13 14 15 16 17 18 19
Source: S&P Global Ratings Source: S&P Global Ratings
Further clouding the ratings outlook, fewer North American nonfinancial issuers now show upgrade
potential than they did one year ago. The positive bias (the percentage of ratings with positive
outlooks or on CreditWatch with positive implications) has fallen by two percentage points, to 3%,
in the same period. In rating actions, U.S. corporate downgrades rose for a fourth consecutive
quarter in the third quarter, led by the oil and gas and consumer products sectors.
Auto, Oil & Gas, and Retail & Restaurants Show Highest Negative Biases
The auto sector had the steepest increase in negative bias, with an increase of 22 percentage
points, to 31%. Downgrade potential within the sector has risen in recent quarters as pressures in
the aftermarket and operational missteps by some tier-1 auto suppliers have driven most of our
negative rating actions. While S&P Global Ratings expects U.S. light-vehicle sales to decline nearly
3% year-over-year in 2019 before stabilizing in 2020 and 2021, overall, we don't expect this modest
dip (in our base-case) alone to lead to downgrades for automaker and supplier ratings in 2019-
2020. Firstly, our forecast sales levels remain healthy enough for most automakers and suppliers to
operate with healthy EBITDA margins, and secondly we believe significant new product launches
will support automakers' current product mix in favor of trucks.
The oil and gas sector follows with a negative bias of 26%, up 5 percentage points in the past year,
including an increase of 2 percentage points in the third quarter. Credit stress in oil and gas has
been on the rise as companies cope with volatile energy prices, liquidity issues, and high leverage.
Moreover, capital market access has not been favorable for this sector, especially those deep
speculative-grade issuers, and some issuers are conducting distressed exchanges for debt that is
trading at very low prices.
S&P Global Ratings December 16, 2019 17U.S. Corporate Credit Outlook 2020: Balancing Act
Meanwhile, the negative bias for the retail sector also remains elevated, at 26%, though it has
fallen 4 percentage points in the past year. This sector continues to face challenges from rising
tariffs and changing consumer preferences.
Chart 19 Chart 20
Auto Sector Leads In Negative Bias, While Metals Lead In Downgrade Potential Has Risen In 12 U.S. Non-Financial
Positive Bias Sectors Over The Past Year
Negative bias Stable bias Positive bias (%) YoY Change In Negative Bias
(Percentage
point change) (5) 5 15 25
(Issuer count) 0 10 20 30 40 50 60 70 80 90 100
Automotive
Automotive (55)
Aerospace/defense
Oil & Gas (102)
Health care
Retail/Restaurants (114)
CP&ES
Telecommunications (61)
Metals/mining/steel
Consumer Products (246)
Forest
Health Care (150)
Oil & Gas
Media & Entertainment (261)
Utility
Aerospace & Defense (52)
Home/RE
CP&ES(112)
Utilities (148) Transportation
Capital Goods (133) Telecommunications
Metals, Mining & Steel (53) Consumer products
Forest (76) Media/entert
Transportation (62) Capital goods
Home/RE (121) High technology
High Technology (187) Retail
Source: S&P Global Ratings Source: S&P Global Ratings
S&P Global Ratings December 16, 2019 18U.S. Corporate Credit Outlook 2020: Balancing Act
Financing Conditions
U.S. financing conditions have seen little change in the past 2-3 months, remaining broadly
neutral-to-supportive. Some slight improvements have been observed recently against the
backdrop of both an improving tone in the U.S.-China trade dispute and the Fed’s recent interest
rate cuts. Markets appear to be ending the year with optimism, and potentially a renewed hunt for
yield among investors.
For credit markets, risk assessments have become more positive toward the majority of the
market, with investment-grade spreads falling to 136 bps, from 173 bps at the end of 2018. In
general, the ‘BB’ segment has seen its spread run a similar trajectory. However, some lingering
risk-aversion from a year ago alongside expectations for a slowing economy appear to be keeping
‘B’, and ‘CCC/C’ spreads elevated, and on an upward trajectory this year (see chart 21). We expect
this spread gap between the weakest and strongest credits to persist next year, as late-cycle credit
concerns warrant a higher risk premium on credits with ratings at ‘B’ or below.
For 2020, S&P Global Ratings expects monetary policy to remain unchanged through the year with
the next policy action a hike in 2021. This could change if our downside risks come to fruition and
the central bank may be forced to cut rates again in March if economic growth slows to below
potential and inflation recedes further. In this context, and with policy makers worldwide looking to
rekindle economic growth after a period of lost momentum, we would expect the policy context for
funding conditions to remain supportive and conducive to refinancing at favorable rates outside of
the riskier end of the corporate credit spectrum. Market volatility – and periods when access to
funding may be more difficult – is most likely to stem from event risk (politics, trade) or from risk
premiums rising in the face of an unexpectedly sharp deterioration in the economic outlook, which
is not our base case.
Chart 21
Some Stress At The Low-End
Investment-Grade and Speculative-Grade Corporate Bond Spreads (bps)
Investment-Grade BB B CCC (right-axis)
700 1400
600 1200
500 1000
(Basis points)
400 800
300 600
200 400
100 200
0 0
1/17 4/17 7/17 10/17 1/18 4/18 7/18 10/18 1/19 4/19 7/19 10/19
Source: S&P Global Ratings. Data as of Sep. 30, 2019.
S&P Global Ratings December 16, 2019 19You can also read