Supporting Electric Vehicles in the Wellington Region - ADVISORY REPORT - Prepared by Jake Roos Consulting Ltd with assistance from Reytna Limited
←
→
Page content transcription
If your browser does not render page correctly, please read the page content below

ADVISORY REPORT

Supporting Electric Vehicles
in the Wellington Region

Prepared by Jake Roos Consulting Ltd   Version 1.5.8
with assistance from Reytna Limited     2019-09-06
SUPPORTING ELECTRIC VEHICLES IN THE WELLINGTON REGION – ADVISORY REPORT 2019

   Report commissioned by the Wellington Region EV Working
   Group for Wellington Electricity, Electra, PowerCo,
   Wellington City Council, Greater Wellington Regional Council,
   Hutt City Council, Upper Hutt City Council, Porirua City Council,
   Kāpiti Coast District Council, Masterton District Council,
   Carterton District Council and South Wairarapa District
   Council.

   Prepared by Jake Roos Consulting Ltd
   with assistance from Reytna Limited

                                                                               Work funded by:

   Version 1.5.8
   2019-09-06

   www.jakeroosconsulting.co.nz
   www.retyna.co.nz

Page 2
JAKE ROOS CONSULTING LTD WITH ASSISTANCE FROM REYTNA LIMITED

Contents
0.1     Acknowledgements	                                    5
0.2     Executive Summary	                                   6   2.5.1   Summary of findings	                                                 24

0.2.1   Purpose	                                             6   2.6     EV incentives versus public transport and active
                                                                          modes	                                                               25
0.2.2   Key Findings 	                                       6
                                                                  2.7     Demand for public charging infrastructure	                           26
Section 1: Introduction	                                    12   2.7.1   Public AC (slow) charging	                                           28
1.1     Background	                                         12   2.7.2   Fast charging	                                                       28
1.2     Rationale 	                                         12   2.7.3   ‘Ultrafast’ charging	                                                29
1.2.1   EVs are critical to decarbonising road transport	   12   2.7.4   Regional differences in charging needs	                               31
1.3     EVs reduce air pollution	                           13   2.8     Portland, Oregon USA 	                                                32
1.4     Present distribution of EVs in Wellington Region	   15   2.9     Buses	                                                               33
1.5     Projections of EV numbers in Wellington to 2024	    15   2.9.1   NZ Bus	                                                              33
1.6     Summary of findings	                                17   2.9.2   Tranzit	                                                             33
1.7     Electric vehicle promotion and funding 	            17   2.9.3   Analysis	                                                            34
Section 2: Issues and analysis 	                            20   2.10    EV refuse collection trucks	                                         35
2.1     Demand for EVs		                                    20   2.11    Taxis and private hire vehicles (e.g. Uber and Lyft)	                35
2.1.1   Summary of findings	                                21   2.12    Delivery vans and other commercial vehicles	                         36
2.2     Supply of EVs	                                      21   2.13    Case study: City of Sacremento, California, USA 	                     37
2.2.1   Summary of findings 	                               21   2.14    Car share schemes	                                                    37
2.3     AC (slow) charging and potential grid impact	       21   2.15    Workplace AC charging	                                               38
2.3.1   Summary of findings	                                23   2.16    Battery reuse and recycling	                                         38
2.3.2   Vehicle to Grid	                                    23
2.5     On-street residential charging	                     24

                                                                                                                                               Page 3
SUPPORTING ELECTRIC VEHICLES IN THE WELLINGTON REGION – ADVISORY REPORT 2019

   Section 3: Recommended Strategy	                                                   42   Footnotes and endnotes
   3.1         Vision	                                                                42   This report contains both footnotes and endnotes:
   3.2         Pathway 	                                                              42   •   Footnotes: are represented by Roman numerals relevant to further
                                                                                                information which can be reviewed at the bottom of each corresponding
   3.3         Approaches                                                              42       page.
   3.4         Principles	                                                            42   •   Endnotes: are represented by numbers relevant to further information which
   3.5         Ambition and Targets                                                    43       can be located in the References section beginning on page 46.
   3.6         Suggested measures 	                                                   45
   3.7         References	                                                            48

   Figures and Tables
   Figure 1		          Greenhouse gas projection for transport sector	                14
   Figure 2            Scenarios for EV adoption in the Wellington Region	            15
   Figure 3		          Most important EV incentives according to Norwegian
                       EV owners from 2017 survey. Question: Select the 3 most
                       important EV incentives                                        20
   Figure 4		          CleanTechnica and Greenway’s recommended charging
                       infrastructure mix	                                            26
   Figure 5		          Portland’s transportation hierarchy for people movement        32

   Table 1		           EV ownership rates and number of public DC fast chargers
                       in the Wellington Region                                       16
                                                                                                                                                                                Page/s
   Table 2		           EV numbers and public chargers for a selection of                                                                                                             17, 23
                       countries		                                                    27
                                                                                                                                                                                        34
   Table 3		           Estimated range of future public charging needs	               27                                                                                               35
   Table 4		           Fixed network costs per DC fast charger per day for different
                                                                                            Additional images courtesy of: Electra, Greater Wellington Regional Council, Hutt City
                       load groups and network areas	                                 30
                                                                                            Council, Wellington City Council, Wellington Electricity.

Page 4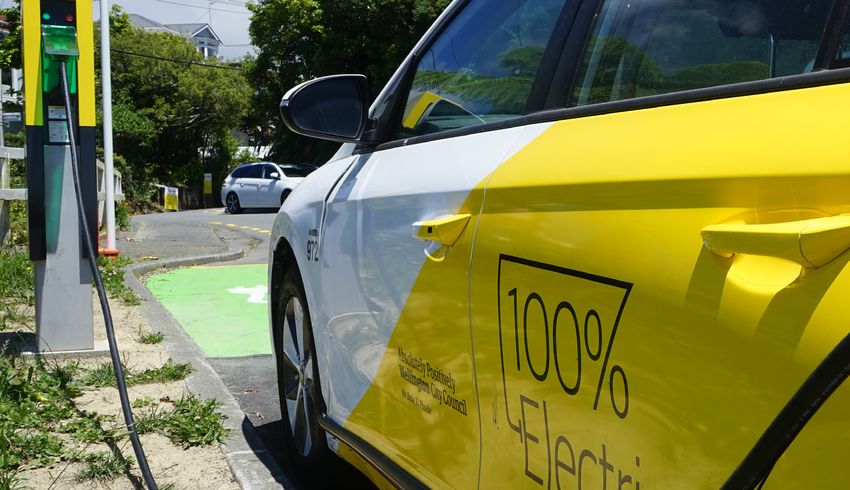
JAKE ROOS CONSULTING LTD WITH ASSISTANCE FROM REYTNA LIMITED

0.1 Acknowledgements
The author would like to acknowledge all those that contributed to the creation of this document.

Liz Yeaman		            Reytna Ltd                                                      Mike Hay		         PowerCo
Steve West		            Charge.Net                                                      Paul Blane		       Greater Wellington Regional Council
Vanessa Wills		         Charge.Net                                                      Andrew Cooper		    Greater Wellington Regional Council
Tom Parker		            Charge.Net                                                      Sigurd Magnusson   Wellington City Council
James Howard		          Tranzit
Ian Gordon		            NZ Bus
Rob Wheeler		           GreenCabs
Haobo Wang		            Ministry of Transport
Freddie Holmes		        Ministry of Transport
Jennifer McSaveney      Ministry of Transport
Saffron Byron		         Energy Efficiency and Conservation Authority
Sam Bridgman		          NZ Post
Erik Zydervelt		        MEVO
Rebekah Rennell         NZTA
Willy Trolove		         NZTA
Matthew Eastwood        Energy Saving Trust
Rosemary Knight         Energy Saving Trust

                                                                                                                                                                 Page 5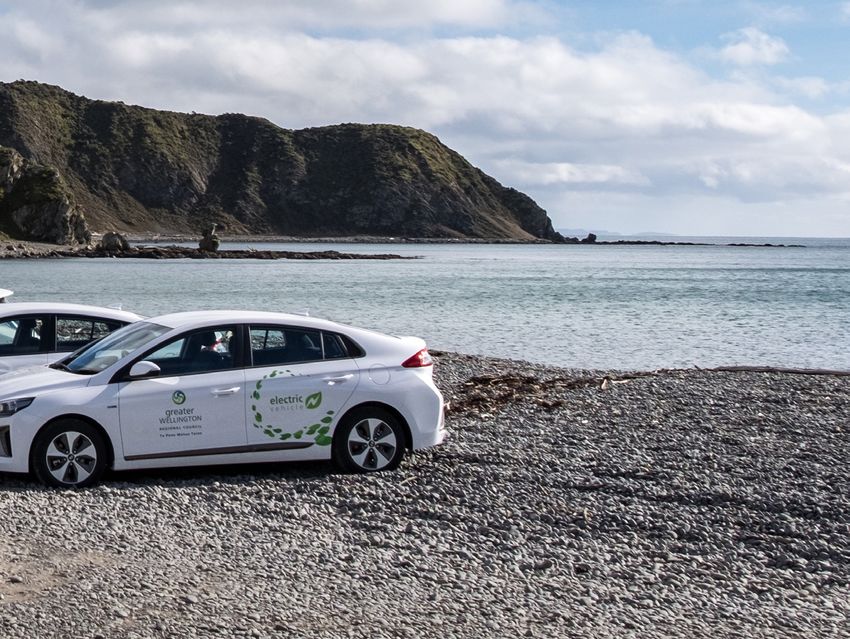
SUPPORTING ELECTRIC VEHICLES IN THE WELLINGTON REGION – ADVISORY REPORT 2019

   0.2 Executive Summary
   0.2.1 Purpose                                                                         0.2.2 Key Findings
   The purpose of this report is to aid the Wellington Region stakeholder                •   It is estimated that there will be between 5,000 and 9,000 battery electric
   organisations (specifically the nine councils and three electricity network               vehicles in Wellington Region by mid-2021, and between 15,000 and 28,000
   companies in the region) with taking a coordinated approach to supporting                 (3.9 and 6.7% of all vehicles) will be EVs by mid-2024. Around 30% of these
   electric vehicle (EV) adoption in the period 2019-2024, in line with an overarching       will be plug-in hybrids (PHEVs) and 70% fully battery electric (BEVs).
   long-term vision of a Wellington Region where use of fossil fuels for road
                                                                                         •   The estimated number of public DC fast chargers required to support this is
   transport have been eliminated and replaced with vehicles powered with
                                                                                             between 50 and 90 in 2021 and 150 and 280 in 2024. Up to ten times these
   renewable energy.
                                                                                             numbers of public AC chargers (mostly at destinations for shopping, tourism
   The report has a recommended set of policies, principles, approaches and                  and hospitality) may also be desirable.
   targets for signee organisations to endorse, and suggested actions for signees
                                                                                         •   Measures to address upfront cost of EVs are critical to stimulate demand
   to implement in co-ordination and co-operation with other stakeholders. This
                                                                                             and supply – all can have an advocacy role to government for policies that
   will allow all parties to take a consistent approach to achieve the vision. The
                                                                                             address this. Prioritising EVs within large organisations for fleet purchases
   suggested actions are based on our current understanding of the issues and
                                                                                             and/or business travel can also help increase supply in the new and
   their remedies, and these may be updated as certain actions are completed,
                                                                                             second-hand markets.
   further experience and knowledge is gained or circumstances change.
                                                                                         •   A diverse array of supporting measures from a variety of organisations is
   The recommendations are intended to complement Government targets and
                                                                                             helpful for boosting EV uptake, and provides ‘insurance’ against uptake
   programmes for promoting EVs and reducing emissions, not be a substitute for
                                                                                             slowing should conditions change, for example the end of the road user
   them.
                                                                                             charges exemption for EVs.
                                                                                         •   Overnight home charging is the cheapest and most convenient method of EV
                                                                                             charging for household vehicles.
                                                                                         •   As such, it is important to address the issue of EV charging for households
                                                                                             without off street parking. This will require a variety of approaches.
                                                                                         •   Home charging of household EVs is not likely to exceed the capacity of
                                                                                             electricity networks provided maximum demand is managed, although there
                                                                                             may be isolated ‘hot-spots’ to deal with.

Page 6
JAKE ROOS CONSULTING LTD WITH ASSISTANCE FROM REYTNA LIMITED

•   EV incentives do not appear to have a significant impact on use of active
    transport modes and public transport, but care should be taken in their
    design to avoid this nonetheless.
•   Local authorities and network companies have an important role in ensuring
    that applications to install public charging infrastructure are handled in a
    consistent and efficient manner so as not to inhibit its development.
•   Significant investment in charging infrastructure is needed to support BEV
    buses, particularly in depots and also fast charging on route, although the
    need for the latter can be minimised over time through improving battery
    efficiency and bus design.
•   DC fast charging requires a premium price to recover costs because of
    the ongoing expense of purchasing the required electrical capacity to
    accommodate large peaks in demand, so relying on this heavily for meeting
    the majority of charging needs of an EV is not desirable.
•   It is important that time spent charging does not conflict with vehicle
    utilisation, particularly for commercial vehicles, such as couriers and taxis,
    which are typically more highly utilised than household vehicles.
•   While the batteries from electric vehicles can have a useful second life in
    stationary applications, they still have the potential to add to e-waste in the
    future if systems and regulations are not established to avoid it. These must
    be developed and implemented in the near future as the EV fleet grows
    and the first wave of EVs ages. Central government involvement in this is
    essential to set up the regulatory framework.

                                                                                                                                            Page 7
SUPPORTING ELECTRIC VEHICLES IN THE WELLINGTON REGION – ADVISORY REPORT 2019

0.2.3    Recommended strategy summary

Supporting Electric Vehicles in the Wellington Region – Recommended Strategy

           Vision                                          Renewable energy replaces fossil fuels in road transport
                                                                    Wellington Region plays its part in limiting global warming to 1.5⁰C

           Pathways                           Public Transport                              Electric vehicles                              Active Modes

                                                  Leadership                                 Infrastructure                                 Promotion
                                  •     Include EVs in organisational plans,     •   Encourage charging at home and
                                        strategy and operations                      work
                                  •     Prioritise EVs for in-house transport    •   Enable sufficient public charging
                                                                                                                                   Promote EVs to the public and
           Approaches
                                                                                                                               •
                                        and fleet                                •   Users pay for public DC fast
                                                                                                                                   businesses
                                  •     Facilitate e-buses for public                charging
                                                                                                                               •   Promote and encourage EV car
                                        transport                                •   Efficiently process applications for
                                                                                                                                   share schemes
                                  •     Collaborate with our peers,                  public chargers
                                        community, government and                •   Encourage systems to replace,
                                        business                                     repurpose and recycle EV batteries

           Ambition                        6% of vehicles in Region are EVs by 2024                     An increasing number of people view EVs favourably

           Principles                 Priority to active modes and PT           Polluter pays          Just and sustainable          Mitigate any negative impacts

                                          50% of organisation light fleets (owned, leased or shared) are EVs by end 2024,
           Target
                                                                       100% are by end 2030

Page 8
JAKE ROOS CONSULTING LTD WITH ASSISTANCE FROM REYTNA LIMITED

                                                      Page 9
Introduction
Section 1
A Wellington City Council Hyundai Ioniq electric vehicle
plugged into a public charger installed in streets where
              multiple residents lack off-street parking

                                                                  Page 11
SUPPORTING ELECTRIC VEHICLES IN THE WELLINGTON REGION – ADVISORY REPORT 2019
Section 1: Introduction
government, electrical utilities and other large public and private sector
organisations can play important roles in achieving this, for example by
helping provide whatever charging infrastructure is needed, and by using EVs
themselves. The report focusses on the period to 2021, and considers what is
1.1 Background likely to happen and be needed in the following three years to 2024. The report
also sets durable, long term guiding principles for the signee organisations and
This project is an initiative of the Wellington Region Electric Vehicle Working
other stakeholders to use indefinitely.
Group (REV-WG). This group is comprised of officers from councils across the
region and other interested organisations from both the public and private
sector. The group operates as a coordinating mechanism for the promotion of 1.2 Rationale
electric vehicles (EVs) generally and in relation to the development of charging
infrastructure specifically. ‘EVs’ for the purposes of this group and document is In order to reach net zero emissions nationally and globally, the transport sector
defined as road-registered battery electric vehicles (BEVs) and plug-in hybrids must be addressed. This has been recognised by NZ Government and various
(PHEVs) of all sizes, both private and commercial. To be an EV, a vehicle must be expert advisory bodies, including GLOBE-NZ6 and the Productivity Commission7.
able to be recharged with an external source of electricity1. Elected leaders of 47 local authorities, including all of those in the Wellington
The purpose of this report is to aid the Wellington Region stakeholder Region, have also recognised this by signing the Local Government Leaders
organisations (specifically the nine councils and three electricity network Climate Change Declaration in 2017, which says that they will reduce their own
companies in the region) with taking a coordinated approach to supporting EV emissions and that of their communities through shifting to electric vehicles8.
adoption in the period 2019-2024, in line with an overarching long-term vision For further discussion of the rationale for local authority involvement, see the
of a Wellington Region where use of fossil fuels for road transport have been EECA guide3.
eliminated and replaced with vehicles powered with renewable energy. Electricity network (distribution) companies also have a critical role to play in
The report builds on the existing work of REV-WG including their six-monthly decarbonising the economy, including the transition to EVs, for the obvious
co-ordination updates published on the Greater Wellington Regional Council’s reason that they provide the infrastructure to supply end users with electricity,
website2, and existing guidance for local authorities published by EECA in 2018 which increasingly will be generated from renewable sources. In the Wellington
‘Driving a Low Emissions Economy – How Local Authorities can support and Region, Electra distributes electricity to the Kāpiti Coast District, PowerCo
promote electric vehicles’3. Current information on the development of EVs in distributes to the Wairarapa, and Wellington Electricity (WE*) serves Wellington
New Zealand can be found in the NZ EV Guide, which is updated monthly4. City, Porirua and the Hutt Valley.
Support for EV uptake is part of a broader effort to move to a low (and
eventually net-zero) emissions economy to reduce the drivers of climate change. 1.2.1 EVs are critical to decarbonising road transport
EVs can be supplied by renewable energy sources so provide an option to Greenhouse emissions must begin to reduce within the next few years order
‘decarbonise’ transport in Wellington, in concert with other methods. to have any realistic prospect of staying within the 1.5 degree C warming limit
The Central Government target for EVs is for 64,000 to be on the road nationally specified by the international Paris Agreement9. Net emissions globally must
by the end of 2021, charting an exponential rate of growth to this point5. Local be halved by 2030 and reach zero by 2050 to make exceeding 1.5 degree C very
unlikely. The Government ratified the Paris Agreement, but presently its policies
Page 12JAKE ROOS CONSULTING LTD WITH ASSISTANCE FROM REYTNA LIMITED
(and those of all other countries) are not consistent with limited warming to as relatively straightforward to decarbonise compared to other sectors, meaning
either 1.5 or 2.0 degrees C. If efforts globally are not scaled up to the required that it did not make sense to decarbonise these slowly and make up the
level by 2020, the window of opportunity to meet either of these goals will be shortfall in other sectors.
missed. This will lead to a radically different global and local climate in the
The Ministry of Transport modelled five different scenarios for EV uptake for
second half of the century, as modelling for the region carried out by NIWA in
the whole of New Zealand, which it used to base their target for 2021 on. The
2017 shows10.
average of these scenarios projects 58,500 EVs in NZ in by the middle of 2021 and
Modelling by the Ministry of Transport (MoT) carried out in 2015 shows that 180,800 by the middle of 2024. The middle scenario forecasts two-thirds of new
based on their projections of EV numbers, the substitution of petrol and diesel cars added to the fleet in 2030 are EVs (53% BEV, 13% PHEV) and 90% are by 2040.
vehicles will start to reduce the total emissions from the transport sector by
2023-24. The delay is a result of the overall growth in the vehicle fleet and
total number of vehicle kilometres travelled (VKT) – the rate of EV adoption (in 1.3 EVs reduce air pollution
concert with any improvement in fuel efficiency) must first exceed this growth
before it has a net effect. It can be seen from this modelling that by 2030 road In addition to reducing greenhouse gas emissions, the replacement of diesel
transport emissions have declined only slightly, and have reduced by only vehicles with electric can reduce air pollution. Diesel engines are much higher
around a third from their peak by 2040. It should be these projections chart emitters of harmful air pollutants, such as fine particles, nitrogen oxides and
a 35% increase in VKT nationally between 2016 and 2036, whereas modelling black carbon, than petrol engines. Electric drive systems do not produce these
for the Let’s Get Wellington Moving project projected a maximum increase pollutants at all, however it should be noted that all kinds of vehicles produce
of 22% for the same period11. This would suggest EV adoption would have a some particulate pollution from tyre and brake pad wear. Local improvements
greater impact on overall transport emissions in the Region than the national to air quality from switching from diesel to electric vehicles will be of greatest
modelling indicates. benefit on streets which currently have a high proportion of diesel vehicles
and a high pedestrian, worker or housing density resulting in greater human
The Productivity Commission in their 2018 report on moving to a low carbon exposure to pollution with detriments to human health. Replacing diesel buses
economy7 highlighted any new fossil fuelled vehicles bought now ‘lock-in’ a and other diesel vehicles on routes in the CBD will be particularly important.
significant volume of cumulative emissions over their lifetime, shrinking New
Zealand’s remaining emissions budget and creating a higher future emissions The 2012 Health and Air Pollution in New Zealand study12 estimated that the
price across the economy. The average of age of light passenger vehicle fleet social costs of air pollution in New Zealand were $4.28 billion per year. The
in NZ is over 14 years. Accounting for this, they concluded nearly all new study estimated that air pollution from motor vehicles results in 13 premature
registered vehicles must be EV from 2030. deaths per year in the Wellington region. The social costs motor vehicle
pollution in the Wellington Region were estimated at $48 million per year. 22%
The 2017 report by Vivid Economics on ‘Net-Zero NZ’ for the Globe-NZ group of the anthropogenic sources of these costs can be attributed to air pollution
reached similar conclusions, but said that almost all new cars sales must be from motor vehicles. The social costs of air pollution from motor vehicles in the
EV from the 2020s to keep on track to a net-zero greenhouse gas emissions Wellington region is estimated at $18 million per year.
goal for 2050 without resorting to scrapping fossil fuelled vehicles before the
end of their useful life.
Both the Productivity Commission and Vivid Economics identified light vehicles
Page 13SUPPORTING ELECTRIC VEHICLES IN THE WELLINGTON REGION – ADVISORY REPORT 2019
Figure 1 – greenhouse gas projection for transport sector
Projected national greenhouse gas emissions from road transport and total VKT (average of five scenarios for
EV adoption)
16000 7E+10
14000
6E+10
12000
5E+10
10000
4E+10
Total VKT
kT CO2e
8000
3E+10
6000
2E+10
4000
1E+10
2000
0 0
total emissions from road transport total VKT
Page 14JAKE ROOS CONSULTING LTD WITH ASSISTANCE FROM REYTNA LIMITED
1.4 Present distribution of EVs in Wellington Region Figure 2 – scenarios for EV adoption in the Wellington Region
Wellington as a region presently has the third highest number of EVs per head
of population (3.1 EVs per 1000 people) in the country. The distribution of EVs Projected EV adoption for Wellington Region (all vehicle types)
within the region is shown in Table 1, over the page. 30000
25000
Wellington City and South Wairarapa have the highest rates of ownership,
followed by Upper Hutt and Lower Hutt. There is no obvious correlation between 20000
ownership rates and the number of public DC fast chargers. The lowest rate of 15000
EV ownership is in Masterton District, which due to its rural nature and distance 10000
from Wellington means a limited vehicle range presents more of a barrier
5000
compared to other areas.
0
2015/16 2016/17 2017/18 2018/19 2019/20 2020/21 2021/22 2022/23 2023/24
1.5 Projections of EV numbers in Wellington to 2024 Low (average NZ adoption rate, lowest uptake scenario for NZ)
High (current Wellington adoption rate, highest uptake scenario for NZ)
Upper and lower estimates for the number of EVs in Wellington have been Wellington EV registrations (actual)
derived from the highest and lowest of MoT’s scenarios, using the national
average EV ownership rate and present Wellington Region ownership rate. The
scenarios give a range of between 5,000 and 9,000 EVs in Wellington Region by
mid-2021, and between 15,000 and 28,000 EVs in Wellington Region by mid-2024.
Around 30% of these are projected to be PHEVs, and 70% are BEVs. Expressed as
a percentage of the fleet, the range is from 1.3% to 2.3% by mid-2021, and from
3.9% to 6.7% by mid-2024.
MoT’s projections also estimate the share of each vehicle type amongst the total
number of EVs. The average of the five scenarios show 8% of EVs by the end of
2024 are vans and utes, and there are 200 BEV buses nationally. Further data can
“
be found on the MoT website13.
EVs are critical to
decarbonising road transport
”
Page 15SUPPORTING ELECTRIC VEHICLES IN THE WELLINGTON REGION – ADVISORY REPORT 2019
Table 1 – EV ownership rates and number of public DC fast chargers in the Wellington Region
Area EV registrations Population estimate EVs per 1000 people Number of DC EVs per fast charger
at 30-01-19 30-06-18 devices Jan 2019 fast charging
Wellington City 816 216300 3.8 6 136
Hutt City 311 105900 2.9 3 104
Porirua City 156 56800 2.7 1 156
Upper Hutt City 142 43700 3.2 1 142
Kapiti Coast District 129 53200 2.4 3 43
South Wairarapa District 39 10450 3.7 1 39
Masterton District 30 25700 1.2 1 30
Carterton District 17 9340 1.8 0 N/A
Wairarapa (combined) 86 45490 1.9 2 43
Wellington Region 1640 521390 3.1 16 103
Page 16JAKE ROOS CONSULTING LTD WITH ASSISTANCE FROM REYTNA LIMITED
1.6 Summary of findings 1.7 Electric vehicle promotion and funding
The costs of carbon emissions and air pollution associated with use of fossil The government via EECA operates the Low Emission Vehicle (LEV) contestable
fuelled vehicles are not paid for by their users – they are transferred to wider fund to assist the implementation of EV related projects provided they fit certain
society in the forms of environmental damage and poor health. This means they criteria including their strategic aims and investment focus. Rounds are run
have an artificial financial advantage compared to EVs, which are not as harmful. twice per year. Local authorities and electricity network companies can and
This creates a strong rationale for intervention on the part of Government to have successfully bid for this funding, including to develop the national network
address this market failure. of DC fast chargers.
Present MoT projections of EV adoption on which the government EV target is EECA alongside EV owner association the Better NZ Trust and industry
based are not consistent with the road transport sector contributing as much as association Drive Electric undertake to promote EVs to the public and
is required of it to meet the goal of becoming net-zero emissions by 2050. businesses, both through the media and at test drive events14. Partnerships
with other parties are useful to them to increase the scale and reach of these
Local authorities, electricity network companies and the private sector
efforts, and Wellington councils have collaborated with them in this way before.
can advocate to central government for stronger policies and assist with
EECA monitors the success of these efforts with regular representative surveys.
implementation to help ensure the full potential of EVs to cut emissions is
Results from late 2018 show 55% of the public view EVs favourably.
realised, along with other measures to reduce the growth in vehicle kilometres
travelled, which will also contribute to lowering emissions. By winding down
their own purchase of fossil fuel vehicles, organisations can prevent the ‘lock-in’
of future greenhouse gas emissions over the vehicles’ life, which may be over 20
years.
Page 17Issues and analysis
Section 2
Page 19
SUPPORTING ELECTRIC VEHICLES IN THE WELLINGTON REGION – ADVISORY REPORT 2019

   Section 2: Issues and analysis                                                         and other local incentives correlated well with variances in EV uptake across the
                                                                                          country, suggesting these incentives played a role as well.
   There are a number of perceived, actual or potential barriers to EV uptake. These      In 2017, the Norwegian EV Owners association surveyed their members, gaining
   will be discussed in turn with reference to existing research and experience           12,000 responses. They asked respondents to select the three most important
   locally and internationally, with analysis and summary of key findings that will       incentives offered by the government to them for owning an EV. Exemptions
   be used to inform the recommend policies and suggested actions in this report.         from sales tax (their GST), road tolls and car purchase tax were rated the most
                                                                                          important (see Figure 3). Reasons 1 and 3 are incentives that address the
   2.1     Demand for EVs                                                                 initial purchase costs. Slightly lower rated was lower annual road tax and low
                                                                                          electricity cost, which along with no road tolls are measures that lower ongoing
   There are many reasons for people and organisations to purchase EVs – such             costs for operating a vehicle. The presence of a network of charging stations, a
   as reduced operating costs and the environmental benefits. These benefits              measure related to practicality and convenience, rather than cost, was ranked
   create demand, however achieving high levels of EV adoption means motivating           sixth.
   increasing numbers of people to make the switch, which will require an                 New Zealand’s incentives for EVs are very limited by comparison. The main
   increasingly compelling proposition, up to a certain point. Once EVs are               measure, the exemption of EVs from road user charges (RUCs) is scheduled to
   ubiquitous, outright bans on the sale of fossil-fuelled vehicles can be used           end for light EVs on 31 December 202119. For light EVs the exemption is worth
   achieve a full change-over, and many countries’ governments have already               around $600 per year on average. For heavy EVs the exemption to Road User
   signalled when they intend to bring in such restrictions15.                            Charges ends when heavy EVs make up 2% of the heavy vehicle fleet. For heavy
   Norway has the highest percentage of EV market share in the world, and highest         EVs this exemption is worth $5,000-80,000 or more per year depending on the
   rate of ownership per capita, as a result of a concerted effort on the part of their   vehicle size and utilisation.
   government16. As of November 2018, Norway had 190,000 BEVs and 90,000 PHEVs            Figure 3: Most important EV incentives according to Norwegian EV owners from
   on their roads after experiencing year-on-year doubling of the number from very        2017 survey. Question: Select the 3 most important EV incentives viii
   low levels at the beginning of the decade17. EVs went from 4.2% of new car sales
                                                                                          7000
   there in 2011 to 49% in 2018. There are many similarities between Norway and NZ,
                                                                                          6000
   making their experience instructive, given where they are now is approximately
                                                                                          5000
   where NZ aims to be in five years’ time.
                                                                                          4000
   In the 2017 paper ‘Charging infrastructure experiences in Norway - the worlds
                                                                                          3000
   most advanced EV market’18, the authors from the Norwegian EV Association
                                                                                          2000
   concluded that measures that lowered the initial purchase cost of EVs were key
                                                                                          1000
   drivers to creating demand for EVs, for the simple and obvious reason that by
   eliminating the difference in purchase cost between EVs and petrol and diesel            0
                                                                                                 Exemption Exemption    No        Low         Low      Network Access to     Free      Free       Free
   vehicles, it made them as affordable at the point of purchase and more overall                 from VAT from road purchase    annual    electricity of public bus lanes municipal charging   access to
                                                                                                              toll    taxes     road tax      cost     charging             parking              ferries
   attractive, when the other benefits were considered. Exemption from road tolls                                                                      stations

Page 20
JAKE ROOS CONSULTING LTD WITH ASSISTANCE FROM REYTNA LIMITED
2.1.1 Summary of findings the vehicles they import and sell to be at or below a certain level of CO2 per 100
km. This encourages them to offer, market and price a greater variety of EV and
Councils and electricity network companies in NZ cannot adjust or introduce fuel-efficient vehicles to help meet the standard.
taxes or introduce regulation in relation to the sale of vehicles in general or
EVs in particular. However, they may take an advocacy role for such measures New Zealand and Australia do not have vehicle efficiency standards, unlike
with central government. It is within the power of councils as road controlling Japan, EU, South Korea, USA, Canada, India, China, Brazil, Mexico and Saudi
authorities and providers of parking to introduce local incentives for EVs. A Arabia.
diverse array of incentives is desirable to continue to stimulate demand and As EV supply is constrained globally, manufacturers may prioritise supply of their
build consumer confidence. EVs to countries where they need them to help meet a fuel economy standard.
2.2 Supply of EVs 2.2.1 Summary of findings
The presence of incentives in the country has a role to play in attracting
Presently two-thirds of all EVs in the country are second Nissan Leafs imported
supplies of EVs from abroad, as well stimulating demand, although supply
from Japan. These vehicles, which are typically only a few years old, are available
is likely to lag behind demand. Measures to address upfront cost are key, as
in a price range which is affordable to many NZ consumers, which helps explain
previously discussed. By committing to convert their organisation’s fleets to EV,
their popularity. NZ presently has around 5% of all Nissan Leafs originally sold
organisations help increase supply by encouraging vehicle suppliers to support
new into the Japanese market, and this percentage has increased over time. It
the NZ market, and eventually providing a supply of affordable EVs to the
seems unlikely that this supply will be cut off, but on its own is unlikely to be
second-hand market within NZ when they are ready to sell them on.
sufficient. Meeting the demand for EVs will require a greater variety of EV makes,
models and vehicle types to be available in the country at an affordable price,
to satisfy the requirements of different owners. EVs sold new into NZ also have
Greater Wellington Regional Council, Hutt City Council and Wellington City
a greater level of after-sales support from the vehicle manufacturers, which is
Council all have an ‘EV first’ policy for fleet purchases, and Wellington Electricity
desirable also, particularly with regard to battery replacement.
has already converted its light vehicle fleet to EV. A group of 34 large NZ
However, NZ is not alone in attempting to convert its fleet, and may struggle to corporates committed in 2016 to convert 30% of their fleets by the end of 20192¹
obtain a diversity of EV models in sufficient quantities from international vehicle
“
manufacturers while they scale up production. In Norway, consumers have pre-
ordered an estimated 30,000 EVs from international car-makers, indicating how
supply is presently falling short of demand there20. Norway has used a direct incentives [have] a role to play in
attracting supplies of EVs from
approach to addressing purchase price, adjusting sales taxes on cars to make
EVs cheaper to buy relative to petrol and diesel vehicles.
Another policy mechanism that could be used to encourage EV supply is a abroad... although supply is likely
”
vehicle fuel economy standard. A vehicle fuel economy standard requires
manufacturers/importers of light vehicles to have the average fuel efficiency of to lag behind demand
Page 21SUPPORTING ELECTRIC VEHICLES IN THE WELLINGTON REGION – ADVISORY REPORT 2019
2.3 AC (slow) charging and potential grid impact My Electric Avenue 2012-2015, OFGEM, United Kingdom25
In this project 100 households were given a Nissan Leaf EV. They were grouped
All EVs can recharge using their onboard AC charger. The rate of charging is in 10 clusters across the UK. All households had 16A charging facilities installed
limited by the capacity of the charger and power supply it is connected to. AC in their homes and were extensively monitored. The study found EV charging
charging is often called ‘slow’ charging, with the slowest rate being at 8A (1.8kW) increases after-diversity maximum demand (ADMD)i by 1kW.
using a common three-pin power socket, typically used by private owners for
overnight charging at home. Faster 16A and 32A charging is also affordable and Modelling showed that across Britain, 32% of low voltage (residential) networks
practical in a domestic situation, but requires a modest amount of effort and will require intervention of some kind when 40% – 70% of customers have EVs,
expenditure on the part of owners to set this up. Half of the participants in based on 16A charging being the norm. However, the study also successfully
the Wellington Electricity EV Charging Trial22 reported they used an three-pin trialled the use of a system ‘Espirit’ to manage EV charging load across
household socket for home charging, and in Norway, 63% of EV owners do18. For multiple households, reducing the cluster’s peak demand at low cost. The trial
those households or businesses with off-street parking, using AC overnight is participants found letting Espirit manage their charging was not a significant
the cheapest and most convenient method of EV charging. The US Department imposition.
of Energy EV Project found home AC charging accounted for 86% of the energy
delivered to EVs23.
The EV Project 2009-2013, US Department of Energy
For a light passenger EV, the amount of range that can be added in ten hours
of AC charging is approximately 100km at 8A, 200km at 16A, and 400km at 32A, This study including monitoring of over 8,000 EV households, and included the
assuming they have sufficiently large batteries. Data from the NZ Household installation of a mature charging infrastructure (home, workplace and public)
Travel Survey shows 95% of household vehicles in the Wellington Region are for them to use. The home chargers were rated at 16A-equivalent23.
driven less than 116 km/day24. The average is 40 km/day, meaning that on
This study of the EV Project data showed the ADMD of all residential EV
average most light EVs only need to be charged for a few hours each day.
chargers spread across the country was 1.0kW on weekdays (and 0.8kW
Clearly overnight AC charging is and will remain the predominant method for on weekends26). There were differences between regions. For example the
EV charging for the foreseeable future for household EVs. The question of what ADMD in Nashville, where they did not have time of use electricity pricing to
impact this will have on electricity distribution networks has been investigated motivate people to charge off-peak, was 1.1kW at 8pm. In San Francisco, where
in NZ and abroad. households could get a cheaper electricity price after midnight, the ADMD was
1.3kW at 1am.
Electricity networks are designed to manage a peak in demand for electricity,
which typically occurs in the morning and evening in residential areas. EV
charging, once common, will increase these peaks, possibly exceeding the
tolerances of networks. Conversely, charging may be spread across the day,
reducing impact and improving utilisation and return on investment of networks.
EVs could even be used to support the grid at peak times (known as ‘vehicle to
i After diversity maximum demand (ADMD) is the aggregate maximum electricity demand at any one
grid’ or V2G). Real world studies and experience provide considerable assurance time of many individual connections to an electricity network, given as an average of all connections. An electricity
that EV charging will not have a detrimental effect on grid stability. network must be designed to meet ADMD whenever it should occur, with a margin of error. ‘Demand-side’ measures
such as load shifting can be used to reduce ADMD.
Page 22JAKE ROOS CONSULTING LTD WITH ASSISTANCE FROM REYTNA LIMITED
EV Charging Trial 2017, Wellington Electricity22 2.3.2 Vehicle to Grid
This trial involving 92 EV-owning households found that home EV charging Vehicle-to-grid (V2G) EV chargers (and similarly equipped vehicles) facilitate
by owners in the Wellington Electricity Supply area increased ADMD by 0.5 - energy flow both to and from an EV, allowing it to act as a rechargeable energy
0.8kW, which is within the capacity of most low voltage networks. Half of the source. When connected to a V2G charger at home or work, charge from an EV
trial participants used an 8A socket for home charging (1.8kW). Most charged can be used as a cheaper power source when electricity prices are at their peak,
off peak even when they did not receive a reduced price for this, and some reducing peaks in electrical demand. It may eventually be able to be used to
changed their behaviour in response to information about the public benefits power homes during power outages.
of charging off-peak. A greater proportion of EV consumers who received
time-of use electricity pricing charged their vehicles outside peak periods that V2G has to managed in a way that ensures the EV owner still has enough energy
those that did not. The majority of participants were comfortable with the idea to drive when and where they want. The purpose of V2G is to boost the resilience
of having the timing of home charging managed for them by a third party to and flexibility for the electricity network during peak demand while also giving
reduce peak demand. EV owners a financial benefit through reduced electricity costs and/or a payment
for the service their battery provides.
2.3.1 Summary of findings The technology is in use in Japan27 and network company Vector is conducting a
trial of V2G in Auckland28.
These real-world studies found that the diversity of home charging behaviours
across multiple households greatly reduces the impact on electricity networks
compared to what it would be if all EVs were charged at exactly the same time.
It is clearly important that this diversity is maintained, which can be achieved
via electricity pricing and non-intrusive services to co-ordinate charging, but it
would appear that most existing residential electricity networks will be able to
cope with very high levels of EV penetration. This is further supported by the
experience in Norway, where no significant issues of this kind have arisen so far
from home charging in urban areas, with the exception that some remote, rural
holiday destinations have experienced issues from recharging during peaks in
visitor numbers. Care should be taken by utilities and councils to identify and
address such ‘hot spots’.
Page 23SUPPORTING ELECTRIC VEHICLES IN THE WELLINGTON REGION – ADVISORY REPORT 2019
2.5 On-street residential charging electricity network operator objections. Also for various reasons the projects
also take a long time to implement. The criteria of the fund have been changed
While home AC charging is the cheapest and most convenient option for those to include nearby local authority off-street carparks, with the chargers being
that are in detached or semi-detached homes, accounting for the majority of available for public use during the day and residents’ only at night, in order
households in the region, there are many households where this is not available. to avoid conflict with neighbours over the limited parking space outside their
One in four dwellings in Wellington City lack off-street parking. Also apartment homes30. As of early 2019, there were approximately 700 ‘slow’ chargers in
dwellers and other people in rental accommodation may not be able to arrange Greater London31.
a charging point with their landlord or body corporate. People in such situations Amsterdam’s City Authority has a dedicated EV Charging Infrastructure bureau.
need viable alternatives in order to successfully operate their own EV. They provide on-street EV charging points when they are requested (for
In 2015 consultants working for Transport for London (a city where 85% of overnight use by residents, so-called ‘pillow’, chargers). The target for the end
dwellings lack off-street parking) extensively studied these options, including of 2018 was to have 4,000 of these chargers installed. The chargers provide
existing approaches in use across Europe29. Those they judged were effective data to the municipality, which they use to co-ordinate further development
and deliverable were: of the network. The City has also developed clusters of chargers in some
neighbourhoods32.
• Public, bookable on-street AC charging stations, located in residential areas
Wellington City Council has secured 50% funding with EECA’s Low Emission
• Basic, secure sockets installed on street furniture outside EV owners’ homes Vehicle Contestable Fund for trialing on-street charging in 25 residential streets,
(this is being implemented in Germany by a private company Ubitricity, and in which will be operational later in 2019. Given almost 20,000 homes in Wellington
the London Borough of Southwark by the company char.gy) City lack off street parking, and could be reliant on such a scheme being
• Running a lead from the home to the street over the footpath and covering it expanded, the learnings of this trial will be valuable to guiding the future of the
with secured matting (allowed in Amsterdam) city’s charging network.
• Relying on public DC-fast charging, away from home
• Alternative arrangements nearby to home– e.g. using sharing apps, accessing
commercial parking outside of business hours.
Each option has its own pros and cons. The consultants saw the greatest
potential in creating ‘socket networks’. DC fast charging was also seen as very
important, though the higher cost and lower convenience of this meant it was
ranked lower.
Subsequently, the UK government has created a funding programme via their
national Energy Saving Trust (EST) and local authorities to establish residential
on-street chargers. The fund is in its second year and only three projects have
been implemented so far. The reasons for this given by EST were other residents
objecting during consultation; the street works required were too expensive; and
Page 24JAKE ROOS CONSULTING LTD WITH ASSISTANCE FROM REYTNA LIMITED
2.5.1 Summary of findings 2.6 EV incentives versus public transport and active
It is perhaps unsurprising that allocating space in the public realm for the modes
exclusive use of a limited number of people is contentious, especially when
such space is scarce. However the experience of cities such as Amsterdam shows In providing incentives for EVs, will public authorities inadvertently attract
that this resistance can be overcome if the municipality is committed to EVs and travellers away from more preferred modes such as active and public transport?
the general public understands and accepts the reasons why. There is a dearth of research on this topic. However a 2015 masters thesis by
Eric Nygaard33 on Norwegian EV uptake and substitution effect for other modes
Support for private use of EVs must be part of a package of measures for found that:
personal mobility whose primary focus is on alternatives to private car
ownership, such as walking, cycling, e-mobility and public transport for the “The tests conducted on the data sample indicate minor, but statistically
majority of journeys, and access to electric car-share schemes and rentals significant EV substitution effects on public and manual transportation for
when necessary. See the case study on the City of Portland’s EV Strategy and its commuting. Although some respondents decreased their use of public and
transport hierarchy on page 30. active transportation, the median use did not change. 70% and 86% respectively
held on to their public and manual transportation habits when they became EV
Regarding new apartments, when parking is provided, councils can require owners. Moreover, the tests indicated no significant EV substitution of public
charging to be provided alongside them to avoid any problems getting it and manual transport for everyday activities or long journeys. The implication
installed in the future. This is recommended by the Norwegian EV Association18. is that EVs only to a limited extent substitute public and manual transportation,
Councils themselves are also providers of rental accommodation. Councils and when substitution takes place it is mainly for trips to and from work… In
could allocate charging bays in shared council housing resident car parks when light of the strong link between car use and timesaving versus public transport,
residents request them, or pro-actively. increasing the frequency and convenience of public transport could help offset
this effect.”
This finding is generally reassuring that any effect is limited. However, it is still
useful to consider carefully the design of any incentives or policy measures for
EVs with such potential effects in mind, and mitigate them if possible.
In Oslo, after a decade implementing strong incentives for EVs such as free
parking, free charging, free use of toll roads and use of bus lanes to complement
government policies for EVs, EVs make up 57% of all new car sales (45% BEV and
12% PHEV) there. Because of this success, the municipality is now rolling back
some of these incentives (such as free charging and the road toll exemption). EV
cars are not exempt from their plans to make their inner-city car-free and more
people-centric. However, electric delivery vehicles will be permitted access34.
Page 25SUPPORTING ELECTRIC VEHICLES IN THE WELLINGTON REGION – ADVISORY REPORT 2019
2.7 Demand for public charging infrastructure Figure 4: CleanTechnica and Greenway’s recommended charging infrastructure
mix.
The number of public charging stations relative to EV fleet size has been
examined for a selection of different countries. See Table 2 (over page).
CHARING INFRASTRUCTURE MIX
Norway has the highest number of EVs per DC fast charger and the second
highest per all public chargers. This reinforces the finding of the Norwegian
EV Association18 that beyond a certain point, the provision of charging Highways, transportation hubs
infrastructure is not the main driver of EV uptake, rather, it is other policies. ~30 min charging time
While the spread of BEVs per fast charger is very wide, per all EVs it is within a DC 280 - 300 km/hour of charging
factor of 2.1, suggesting this is a better guide to charging needs. Interestingly, FAST
New Zealand has the fewest EVs per fast charger of the group, which is perhaps CHARGING
related to the early stage of EV adoption in the country which coupled with the
widely dispersed population requires a relatively widely-dispersed but lightly- Hotels, resturants, shopping malls,
used network of chargers. business centres, etc.
FAST AND SLOW
~2 hours or more charging time
The number of EVs per public charger is within a factor of 2.5, if the Netherlands PUBLIC CHARGING 40 - 50 km/hour of charging
is excluded. The Netherlands has a very low number of EVs per public chargers
per EV, but it is unusual in that it has a very high proportion of PHEVs. Given the
small size of battery packs in PHEVs, arguably they have a reduced need for fast
charging. Also the Dutch municipalities have had a strong focus on installing on- Single family houses, parking
street residential ‘pillow’ (overnight) chargers in their cities (see the case study garages of apartment and
on Amsterdam in the previous section). These are technically public chargers, so office buildings etc.
have skewed the numbers somewhat compared to the other countries. SLOW CHARGING AT ~6 hours or more charging time
HOME AND AT WORK 15 - 20 km/hour of charging
Guidance for municipalities in Europe assembled by consultants Cleantechnica
and Greenway with the help of a working group of charging infrastructure
professionals35 recommended a ‘rule of thumb’ of one DC fast charger per 100
EVs, and one publicii AC charger per 10 EVs. This rule appears to be broadly
consistent with Table 2. The mix of charging types they recommend is illustrated
in Figure 4 (right).
ii ‘Public’ chargers include those which are reserved for patrons such as at hospitality and retail businesses, but
excludes workplace chargers for employees.
Page 26JAKE ROOS CONSULTING LTD WITH ASSISTANCE FROM REYTNA LIMITED
Table 2: EV numbers and public chargers for a selection of countries
As at… All public BEVs per DC EVs per public
chargers fast charger fast charger charger
Norway Oct-18 190000 90000 280000 1600 10600 119 175 26
Netherlands Dec-17 20000 100000 120000 750 32000 27 160 4
UK Dec-18 60792 138765 199557 1900 19000 32 105 11
Germany Dec-18 105115 89629 194744 unknown 16,100 - - 12
USA Dec-18 630000 480000 1110000 8244 57586 76 135 19
New Zealand Jan-18 9140 2927 12067 148 447 62 82 27
Applying the ‘rule of thumb’ of one DC fast charger per 100 EVs and one public Table 3: estimated range of future public charging needs
AC charger per 10 EVs, the range of possible public charging requirements for
Wellington Region is summarised in Table 3 (right). EVs AC chargers DC fast chargers Total capacity
(3 - 22kW) (25 - 50kW) (MW)
Jan 2019 1,640 39* 16 ~1
Jun 2021 5,000-9,000 500-900 50-90 6-11
Jun 2024 15,000-28,000 1,500-2,800 150-280 18-34
* Note that the majority of these public chargers are at hotels and campgrounds
Page 27SUPPORTING ELECTRIC VEHICLES IN THE WELLINGTON REGION – ADVISORY REPORT 2019
2.7.1 Public AC (slow) charging 2.7.2 Fast charging
Public AC chargers are useful in areas where EVs will dwell for long periods, DC fast charging (namely charging at rates higher than 25kW) is critical for
given the relatively long charging times associated with them. Such locations extending the range of EVs on long journeys, especially for those EVs that have
are airports, hotels, holiday parks, shopping and entertainment premises, and smaller battery packs, such as the Gen 1 and Gen 2 Nissan Leafs. They may
parking complexes near to these places. There is a business case for the owners also be the main means of recharging for those EV owners without off-street
of these premises to provide charging as a value-add service to patrons, similar parking, as previously discussed. Referring specifically in relation to household
to ‘free wi-fi’. Private property is already likely to have an adequate electricity vehicles, as EVs with larger battery packs become more common, the number of
supply for AC charging, so the incremental cost of installing and operating fast chargers that are required relative to the total number of EVs in the country
acharging point is often low. As such, there is limited need for public sector can be expected to reduce, given it is possible to add hundreds of kilometres of
involvement, other than promotion, unless they themselves are the public range to a light EV using overnight charging. (This does not include taxis, couriers
parking provider. and other commercial vehicles, that typically have higher utilisation rates than
household vehicles – see the following sections for further discussion) However,
Electric car share schemes may also wish to install public AC charging on-street
in the interim, we can expect demand for fast charging to increase roughly in
to support their fleet of vehicles. This network could also potentially be used by
line with the total number of EVs.
others. Potentially there could be other private companies wishing to install AC
charging (e.g. as a standalone business). However, the costs and business risks Citizen science organisation ‘Flip the Fleet’ surveyed of 102 EV owners in New
associated with a third party installing and operating an AC charger on-street Zealand about fast charging in 201836. It found that the sample group almost
relative to the return can be challenging. Road controlling authorities can help unanimously thought that more fast chargers were required. The most desirable
by having clearly laid out policies and processes for applications for public characteristic of fast charging (determined via a choice experiment) was
chargers, and by co-ordinating with electricity network companies to identify found to be immediate and predicable access. The authors recommended the
the areas where electricity supplies for chargers can be established at least introduction of usage fees to fast chargers that are presently free to discourage
cost. These systems would be equally useful for applications to install DC fast unnecessary use of chargers by EV owners that could charge at home, and
chargers. to support the expansion of fast charging on a commercial basis. This is the
same recommendation made by the Norwegian EV Association18, but in any
case, all public fast chargers in the Wellington Region already require payment
to the provider Charge.Net. The authors also suggested that a greater number
and variety of chargers should be made available at presently congested sites.
Charge.Net did this in 2018 at their chargers at the Vivian St Z station and at
the Dowse, putting a 25kW unit alongside the existing 50kW unit at each. The
available electrical capacity (or the upfront investment in upgrades to get more)
is a constraint on further development. Queuing will increasingly be a problem
if the development of fast charging infrastructure does not keep pace with
the number of vehicles. Another potential constraint is the suitability of the
placement and configuration of fast chargers for larger vehicles (e.g. commercial
vehicles, campervans and motor homes), or those users with special mobility
Page 28JAKE ROOS CONSULTING LTD WITH ASSISTANCE FROM REYTNA LIMITED
requirements. However, this may not necessarily slow households from adopting their supply’s connection, capacity and annual maximum demand, as well as
EVs significantly overall as most people will be able to charge at home18. per unit of electricity (In the Wellington Region, only Electra does not). For the
Wellington Electricity (WE*) network area, a 350kW supply would cost between
Goldman Sachs37 estimated the potential market for DC fast charging
$100 and $150 per day in such ‘fixed’ fees, depending on whether it fell into the
infrastructure in their report 2017 report ‘EVs: From Pump to Plug’. They estimated
highest or second highest load group. See table below for a comparison. These
globally that overnight home charging would account for 80% of all charging,
costs would have to be recovered from users e.g. 20 users/unit/day means $5.00
and DC fast charging would be 6%, with the remainder being AC charging at
-$7.50 per customer, on top of energy costs, capital cost recovery and any other
workplaces or other destinations. Following from this, the report authors
expenses.
estimated that while the distribution of fast charging stations must be similar
to filling stations, their utilisation will be around 10 times lower (around 20 Given this, ultrafast charging may only be profitable where utilisation is very
customers per day), meaning a significant margin above operating costs must high, meaning in locations where it is especially useful (so it can command a
be charged to recover the capital costs and make a profit. This can be observed premium price) and there are many potential customers – e.g. in the middle
in NZ presently, where fast charging using commercial chargers is approximately of long-distance journeys on arterial routes. Therefore, they seem unlikely to
three to four times more expensive than charging at home. Despite this, supplant the network of regular DC fast chargers, but rather occupy a niche of
presently DC fast charging is still around one third cheaper than petrol to drive their own.
an equivalent distance. However, the end of the RUC exemption for EVs would
significantly reduce this difference.
2.7.3 ‘Ultrafast’ charging
In the near future, new EVs will be capable of fast charging at rates much higher
than the present norm of 50kW (e.g. at 350kW, seven times faster). In theory this
will allow EVs to be recharged in a similar fashion to how petrol and diesel cars
are refilled, within a few minutes. However, the electrical capacity that will be
“
needed at such ‘ultrafast’ charging stations, assuming there are multiple units at
each site as there are at filling stations, will be substantial.
To gain a better understanding of the capability and costs of the electricity
...new EVs will be capable of fast
network to accommodate ultrafast charging stations, estimates were obtained
for hypothetic installations at logical locations for a hub of either four or eight
charging...within a few minutes...
350kW charging units. however, the electrical capacity that
• Cnr Arthur and Taranaki Street, Te Aro – Lowest cost option: $750K +- 20%
will be needed at such ‘ultrafast’
”
• 140 Hutt Rd, Kaiwharawhara – Lowest cost option: $400K +/- 20%
In addition, network companies typically charge commercial clients per kW of charging stations...will be substantial.
Page 29You can also read