American Muslim Poll 2019: Predicting and Preventing Islamophobia
←
→
Page content transcription
If your browser does not render page correctly, please read the page content below
American Muslim Poll 2019:
Predicting and Preventing
Islamophobia
Featuring an Updated National American
Islamophobia Index
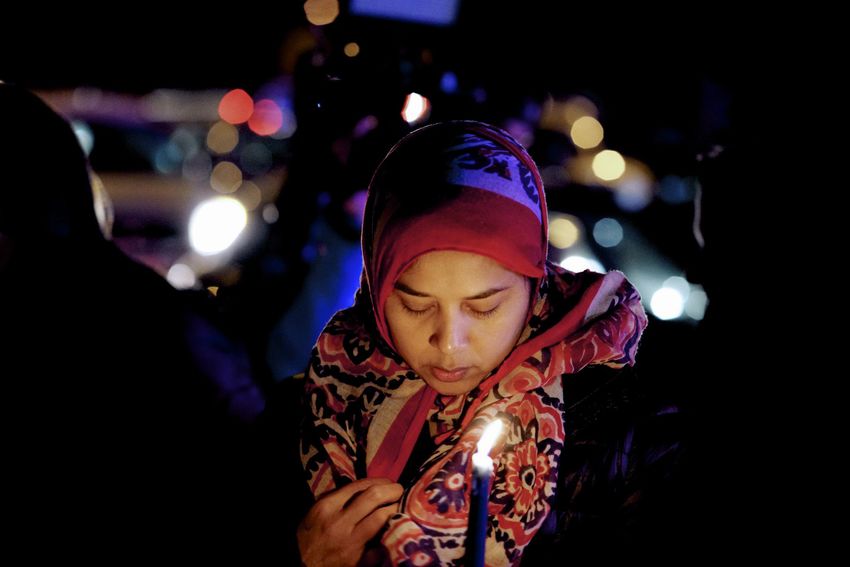
Candlelight walk protesting the Muslim Ban in Washington, D.C.
I
SPU’s fourth annual poll informs national conversations with the voices of everyday
Americans. Researchers, policymakers, and the public have access to key insights
and analysis into the attitudes and policy preferences of American Muslims, Jews,
Catholics, Protestants, white Evangelicals, the non-affiliated, and the general
public. For the second year, in partnership with Georgetown University’s The Bridge
Initiative, we track the National American Islamophobia Index, measuring how much
the public endorses anti-Muslim tropes. New this year: Our researchers examine
protective factors against Islamophobia, as well as data-driven recommendations for
those working to elevate American Muslim civic engagement and for those combating
anti-Muslim bigotry.
American Muslim Poll 2019: Predicting and Preventing Islamophobia 1
Research Team
Dalia Mogahed, Report Co-Author, Director of Research
Azka Mahmood, Report Co-Author
Youssef Chouhoud, Data Analyst, ISPU Fellow, Assistant Professor at
  Christopher Newport University
Erum Ikramullah, Research Project Manager

Communications Team
Katherine Coplen, Director of Communications
Katie Grimes, Communication & Creative Media Specialist

Advisory Team
Khaled Beydoun - JD UCLA School of Law; Associate Professor of Law
  at the University of Arkansas School of Law; Senior Affiliated Faculty
  at the University of California-Berkeley
                                                                             Contents
Karam Dana - PhD Interdisciplinary Near and Middle Eastern Studies,
  University of Washington; Assistant Professor at the University of
  Washington Bothell                                                         Introduction            3
David Dutwin - PhD Communication and Public Opinion, Annenberg
  School for Communication, University of Pennsylvania; Executive Vice       Executive Summary       4
  President and Chief Methodologist at SSRS
John Esposito - PhD Temple University; Professor of Religion,                Results		               7
  International Affairs, and Islamic Studies at Georgetown University
Rachel M. Gillum - PhD Political Science, Stanford University; Fellow,         Civic Engagement      7
  Stanford University
Amaney Jamal - PhD Political Science, University of Michigan; Edwards          Faith and Community   13
 S. Sanford Professor of Politics at Princeton University
Nazita Lajevardi - PhD University of California, San Diego; JD University      Islamophobia Index    19
  of San Francisco; Assistant Professor, Michigan State University
Kameelah Mu’Min Rashad - MS MEd University of Pennsylvania; MRP              Recommendations         25
  International Institute for Restorative Practices; Founder and President
  of the Muslim Wellness Foundation
                                                                             Methodology             26
Cover photo: "Candlelight Vigil" by Miki Jourdan (CC BY-NC-ND 2.0)
                                                                             Endnotes		              27
For more information about the study, please visit:
http://www.ispu.org/poll

Acknowledgements
ISPU would like to acknowledge our generous supporters
whose contributions made this report possible, including:
                 The Bridge Initiative, Alwaleed Center for
                 Muslim-Christian Understanding, Georgetown
                 University
RISE Together Fund
Democracy Fund

ISPU would like to acknowledge the following partners:
••   America Indivisible
••   CAIR
••   Emgage
••   ISNA
••   Khalil Center
••   MPower Change
••   Muslim Mental Health
••   Muslim Public Affairs Council
••   No Muslim Ban Ever Campaign
••   Poligon Education Fund
••   Stanford Muslim Mental Health Lab

Suggested citation: Mogahed, Dalia and Mahmood, Azka. American
Muslim Poll 2019: Predicting and Preventing Islamophobia. May 2019:
The Institute for Social Policy and Understanding.
American Muslim Poll 2019:
Predicting and Preventing Islamophobia
Featuring an Updated National American Islamophobia Index
Introduction
Triumphs and tribulations punctuated the year leading up communities. This includes the Muslim community,
to ISPU’s fourth annual poll of American religious com- where a new grassroots organization called FACE
munities. In June 2018, the Supreme Court upheld a (Facing Abuse in Community Environments) began to
fourth iteration of the travel ban, which allows vast im- investigate and document cases of alleged abuse in an
migration restrictions for travelers from Iran, Libya, North effort to raise awareness and demand accountability.
Korea, Somalia, Syria, Venezuela, and Yemen. Five of
these seven nations are majority Muslim. In their scathing It was against this backdrop that ISPU conducted its
dissent of the majority decision, Justices Sonia Sotomayor fourth annual 2019 poll of American faith and non-faith
and Ruth Bader Ginsburg said the ruling “leaves undis- groups.
turbed a policy first advertised openly and unequivocally
as a ‘total and complete shutdown of Muslims entering How were Americans of varying faith backgrounds
the United States’ because the policy now masquerades feeling about the direction of the country in the midst of
behind a façade of national-security concerns.” a government shutdown? In a year where voter turnout
broke records, how likely were Americans who are
Later that year, Ilhan Omar, a hijab-wearing former Muslim to participate in the midterm election compared
refugee originally from Somalia, and Rashida Tlaib, a to other groups? More importantly, what factors predict
Palestinian American, were the first Muslim women their participation? Does a candidate’s support for the
elected to the U.S. House of Representatives, each so-called Muslim ban help or hurt their run for public
taking her oath on her personal Quran. office? And with whom do Muslims find the greatest
political common ground? How common are unwanted
Analysts have credited the record-breaking voter turnout sexual advances from a faith leader in each religious
of the 2018 midterms for bringing Omar and Tlaib to community? And how likely is it that these alleged trans-
Congress in an election that saw a number of “firsts,” gressions are reported to law enforcement or commu-
mostly Democratic women of color and LGBTQ indi- nity leadership?
viduals. These Freshman lawmakers make up a new
class of members of Congress who ran on some of the We also continue our annual measure of the
most progressive and anti-establishment platforms seen Islamophobia Index with the Bridge Initiative, a
in years, and gave Democrats a majority in the House. measure of the level of public endorsement of anti-
Muslim tropes. Have levels of Islamophobia in America
This new Congress witnessed the longest government increased, decreased, or stayed the same? Last year
shutdown in history (lasting from December 22, 2018, we examined the impact of Islamophobia on society,
to January 25, 2019) over President Donald Trump’s discovering that higher levels of anti-Muslim sentiment
demand for $5 billion to complete a wall on the U.S.- are linked to greater acceptance of violence against ci-
Mexico border, leaving large swaths of the American vilians, authoritarian policies, and anti-Muslim discrimi-
public without income for five weeks. nation. This year, we sought to explore the drivers of
Islamophobia. What predicts lower or higher anti-Mus-
As women shattered the glass ceiling of Congress in lim views? And with whom do Muslims find the greatest
record numbers, the #MeToo movement continued support?
to race forward, bringing attention to sexual miscon-
duct long normalized and left unacknowledged in the We conclude our study with a set of data-driven rec-
corporate sector, media, and government. It also ommendations for those working to elevate American
brought attention to sexual misconduct within religious Muslim civic engagement and for those combating
American Muslim Poll 2019: Predicting and Preventing Islamophobia 3Islamophobia. In light of the horrific massacre of 50 wor- Muslims Who Vote Overwhelmingly Favor
shippers in a mosque in Christchurch, New Zealand, on Democrats
March 15, 2019, by a man reciting every anti-Muslim
Our findings show that Muslims directed their frustration
trope in our index, these recommendations seem ever
with the administration at the polls and voted overwhelm-
more urgent.
ingly in favor of Democratic candidates. Three-quarters
of Muslims (76%) cast their ballots for Democrats, a trend
We hope this report continues to inform our national
mirrored among the Jewish Americans (69%) we sur-
conversation with the voices of ordinary people.
veyed, as well as Black (91%) and Hispanic Americans
(66%) more generally. Among Muslims, support for
Executive Summary Democrats remains consistent with age as opposed to
the general public where it decreases: 83% of Muslims
In January 2019, the Institute for Social Policy and aged 50 and older vote for Democrats in contrast with
Understanding conducted a survey of American 44% of their generational peers in the general public.
Muslims, Jews, Catholics, Protestants, including white
Evangelicals, and the non-affiliated, to examine their Though Growing, Muslim Voter
views on politics, religion, sexual and religious violence, Registration and Engagement Still Lags
minorities, and other faith groups. Our findings show Behind Other Groups
that American Muslims are multi-dimensional; they
Despite being higher than in 2016 (60%), only 73% of
share many characteristics with other faith groups and
eligible Muslim voters report being registered to do so,
non-affiliated Americans and, yet, are unique. They are
the least likely in our 2019 sample than other groups
disappointed with some aspects of their country and
(85%-95%).1 Overall, Muslims’ voter eligibility is 80%,
express hope in others.
which is less than the other groups in our survey and
this gap may persist because 47% of American Muslims
Muslims Least Likely to Approve of are not native-born. The voter registration gap is most
President but More Likely to Express pronounced among Muslim young adults (aged 18-29),
Optimism with the Direction of the only 63% of whom report being registered to vote com-
Country pared to 85% of their peers in the general population.
We found that only 16% of American Muslims approve of Muslim voter engagement further suffers due to the in-
the job Donald Trump is doing as President, the lowest of consistency of Muslim voters who express their inten-
all groups surveyed. While other groups tallied between tions to vote (83%) but show up at the polls in fewer
24% and 50%, the majority of white Evangelicals (73%) numbers (59%), either due to lack of choice of candi-
reported approval of the President and highlighted dates or distrust in the electoral system. Despite these
a deep rift between the two religious groups. Among large gaps, Muslims contested in the 2018 midterm
Muslims, white Muslims (29%) and those who are 30-49 elections in unprecedented numbers, recording as many
years old (19%) are more likely to approve of Donald as 131 wins at local and state levels, and securing three
Trump than all others. Congressional positions.
Despite the low opinion of the performance of the Muslim Local Engagement with Elected
President, 33% of Muslims conveyed optimism about Officials a Predictor of Voter Participation
the future trajectory of the nation, more than any other More Broadly
faith group or unaffiliated Americans surveyed. While
We found that some expected factors such as higher
white Muslims (43%) are more likely than Black Muslims
income and older age, as well as religious attendance as
(20%) to be upbeat, Muslim women (70%) are more
previously reported in ISPU polls, hold true as predictors
likely than Muslim men (58%) to be pessimistic about
of voter participation for Muslims as they do for other
the future. We find Muslims’ overall positivity remarkable
Americans. However, in the case of Muslims, contact-
given the fact that all other groups surveyed registered
ing a local elected official emerged as the single stron-
a sharp decline in their satisfaction with the way things
gest determinant of voter participation. We also found
are going in the country. We posit that Muslim and
that Muslims are the group least likely to communicate
Democratic gains in the 2018 midterm elections and the
with local and federal elected officials, with only 20% of
continued resistance to Trump’s anti-immigration poli-
Muslim men and 21% of Muslim women reporting com-
cies are responsible for Muslims’ confidence.
munication with a local official.
American Muslim Poll 2019: Predicting and Preventing Islamophobia 4Support for Muslim Ban Does Little to that reflect private spirituality and lower on the one that
Help Candidates with Most Voters requires public risk, likely because of the threat of reli-
gious discrimination, which Muslims continue to report
Sixty-one percent of Muslims, 53% of Jews, and 56%
at higher frequencies (62%) than any other faith group
of non-affiliated Americans report that a candidate’s
(43% or less).
endorsement of the Muslim ban would decrease their
support for that individual. While white Evangelicals
In comparison, white Evangelicals are high both on
(44%) are the most likely of any group to say a candi-
private and public dimensions of religiosity, with faith
date’s endorsement of the Muslim ban would increase
playing a central role in their personal lives as well as
their support of that candidate, a majority of even this
what they wish to see in their society. Jews are low on
faith group saw the issue as either decreasing their
private measures of spiritual engagement such as fre-
support (19%) of such a candidate or making no dif-
quency of religious services, but higher on public asser-
ference (37%). The plurality of the general public (44%)
tion of their faith identity and a sense of a linked fate with
say a candidate’s endorsement of a Muslim ban would
co-religionists.
decrease their support, while 21% say it would increase
their support. Thirty-four percent of the general public
say it would make no difference to them whether or not Muslims Most Likely to Report Religious,
a candidate supported the Muslim ban. Gender, and Sectarian Discrimination
As reported in our prior polls, Muslims are the most likely
Muslims Profess More Private Religious group to report experiencing religious discrimination
Devotion, Less Public Religious (62%). Muslim women report higher levels of discrimina-
Assertiveness tion (68%) than men (55%). Second to Muslims, 43% of
Jews report religious discrimination, while 36% of white
We found that Muslims (71%) and white Evangelicals
Evangelicals report experiencing it. With 40% register-
(82%) are the most likely to say religion is very important
ing experiences of sectarianism, Muslims are the group
in their daily life, more than all other faith groups and
most likely to have sectarian discrimination within their
non-affiliated Americans. Despite facing higher levels
ranks as compared to other groups surveyed.
of religious discrimination than other groups, Muslims
hold steady to their faith. Forty-three percent of Muslims
Our data show that 41% of Muslim women experience
attend religious services once a week or more, on par
gender discrimination from within their community, the
with Protestants (49%) but less frequently than white
highest of any group examined. However, the misogyny
Evangelicals (64%). More Muslims (78% of men and
they suffer from the public at large is still greater at 52%.
79% of women) report satisfaction with the way things
Muslim women are also more likely to report gender dis-
are done in their house of worship than the general
crimination from the public than are any other group of
public (62%).
women surveyed (36% or less).
Muslims are more likely to be privately devout—derive
meaning and purpose from their faith (63%) and draw Though Unwanted Sexual Advances from
on their faith to forgive someone who has hurt them a Faith Leader Equally Prevalent Across
deeply (54%)—than all groups surveyed except white Communities, Muslims Most Likely Group
Evangelicals (75% and 63%). to Report to Law Enforcement
Unwanted sexual advances from a faith leader are
However, Muslims are less likely to publicly assert equally prevalent among all groups we surveyed. All
their religious beliefs such as take unpopular stands groups are also equally likely to report such advances to
to defend their faith (36%) or wish to use their faith as members of the community. However, Muslim victims of
a source of law (33%) than white Evangelicals (58% sexual crimes are most likely to speak up against perpe-
and 54%). Muslims (55%) have a sense of linked fate,2 trators and more likely (54%) to involve law enforcement
that is, to believe that their fate is tied to that of their in such matters than any other group in our study.
coreligionists, as much as Protestants (55%) and white
Evangelicals (57%), but less than Jews (69%). Though
it can be reasonably expected that greater personal
Islamophobia Index Inches Up
spiritual engagement would translate into greater public A measure of the level of public endorsement of five neg-
assertion of faith, Muslims are highest on dimensions ative stereotypes associated with Muslims in America,
American Muslim Poll 2019: Predicting and Preventing Islamophobia 5our Islamophobia Index inched up from 24 in 2018 to significantly linked to a lower score on the Islamophobia
28 in 2019. The Islamophobia Index calculates reported Index (less Islamophobia), though the correlation is
levels of agreement with the following statements: weak. Notably, respondents’ nativity, sex, age, educa-
A. Most Muslims living in the United States are tion, and religiosity have no bearing on Islamophobia.
more prone to violence than others.
B. Most Muslims living in the United States
discriminate against women.
Methodology
C. Most Muslims living in the United States are
ISPU created the questionnaire for this study and com-
hostile to the United States.
missioned Social Science Research Solutions (SSRS) to
D. Most Muslims living in the United States are
conduct a nationally representative survey of self-iden-
less civilized than other people.
tified Muslims and Jews and a nationally representative
E. Most Muslims living in the United States are
survey of the general American public. Researchers ex-
partially responsible for acts of violence carried
amined the views of self-identified Protestants (parsing
out by other Muslims.
out white Evangelicals), Catholics, and the non-affiliated.
White Evangelicals are routinely studied in religion survey
Jews and Hispanic Americans Are Most research as a separate subgroup due to their unique
Favorable Toward Muslims and White social and political characteristics (see, for example,
Evangelicals Least surveys by the Public Religion Research Institute [PRRI]
Of all faith groups apart from Muslims, Jews score the and studies by the Pew Research Center). In our analy-
lowest on the Islamophobia Index. A majority (53%) of sis, we make comparisons among age and racial groups.
Jews report having positive views of Muslims with 13% For race comparisons among the Muslim sample, we do
reporting negative views. In contrast, white Evangelicals not include Hispanic Americans in the racial compari-
score the highest on the Islamophobia Index with as sons due to small sample size. In the general public, we
many as 44% holding unfavorable opinions about exclude Asian Americans due to small samples sizes. A
Muslims, which is twice as many as those who hold fa- total of 2,376 interviews were conducted. ISPU owns all
vorable opinions (20%). data and intellectual property related to this study.
Analyzed by race, Hispanic Americans are five times as SSRS conducted the survey of Muslims, Jews, and the
likely to hold favorable opinions of Muslims as they are to general population for ISPU from January 8-25, 2019.
have negative attitudes (51% vs. 10%). In comparison, SSRS interviewed 804 Muslim and 360 Jewish respon-
white Americans are almost as likely to hold favorable as dents. The sample for the study came from multiple
unfavorable opinions (33% vs. 26%), whereas 40% have sources. SSRS telephoned a sample of households that
no opinion. Black Americans are seven times as likely were prescreened as being Muslim or Jewish in SSRS’s
to hold positive opinions (35%) as negative views (5%) weekly national omnibus survey of 1,000 randomly se-
of Muslims, but the majority report having no opinion lected respondents (n = 648) and purchased a listed
(51%). sample for Muslim and Jewish households in both land-
line (from Experian) and cell phone (from Consumer Cell)
samples, sample providers that flags specific character-
Knowing a Muslim Linked to Lower istics for each piece of a sample (n = 133). In an effort
Islamophobia
to supplement the number of Muslim interviews that
Our analysis reveals that knowing a Muslim personally is SSRS was able to complete in the given time frame and
among several protective factors against Islamophobia. with the amount of available prescreened sample, SSRS
When a Muslim is a close friend, Islamophobia is further employed a web-based survey and completed the final
reduced. We found that three in four Jews know a 383 Muslim subject interviews via an online survey with
Muslim, about half of the general public know a Muslim, samples from a non-probability panel (a panel made
but only about one in three among white Evangelicals up of respondents deliberately [not randomly] chosen
know an American who is Muslim. to represent the demographic makeup of the commu-
nity in terms of age, race, and socio-economics). SSRS
Other predictors of lower Islamophobia include used their sample in the probability panel to adminis-
Democratic leanings; knowledge about Islam; favor- ter the general population portion of the survey (n =
able views of Jews, Black Americans, and feminists; 1,108). These are respondents who have completed a
and higher income. Negative views of Evangelicals are survey through the SSRS omnibus and signed up for the
American Muslim Poll 2019: Predicting and Preventing Islamophobia 6probability panel. In an effort to balance out the general (24%) and Jewish (27%) sentiments are slightly more
population probability panel, SSRS interviewed 104 positive than Muslims’ (16%), yet on the lower end of
non-Internet respondents through the omnibus survey, the spectrum. Catholic views (37%) hover right around
which uses a fully replicated, stratified, single-stage, the general public average (39%), and Protestants’
random-digit-dialing (RDD) sample of landline tele- are slightly higher (50%). By far and away, white
phone households and randomly generated cell phone Evangelicals (73%) are the group most likely to approve
numbers. Sample telephone numbers are computer- of the President. As in previous years, the data illustrate
generated and loaded into online sample files accessed a schism between Muslims and white Evangelicals re-
directly by the computer-assisted telephone interviewing garding the performance of Donald Trump as President.
(CATI) system.
Muslims Least Likely to Approve of President’s
For the Muslim and Jewish samples, the data are Performance
weighted to: 1) adjust for the fact that not all survey
respondents were selected with the same probability, 90%
and 2) account for non-response across known demo- 80%
73%
graphic parameters for the Jewish and Muslim adult 70%
populations. The survey has a margin of error at a 95% 60%
confidence level of Muslims ±4.9% and Jews ±7.6%. 50%
50%
37% 39%
40%
For the general population sample, the data are weight- 30% 27%
24%
ed to provide nationally representative and projectable 20% 16%
estimates of the adult population 18 years of age and 10%
older. The weighting process takes into account the 0%
Muslim Jewish Catholic Protestant White Non- General
disproportionate probabilities of household and respon- Evangelical Affiliated Public
dent selection due to the number of separate telephone
FIGURE 1: Do you approve or disapprove of the way Donald Trump is handling his job
landlines and cell phones answered by respondents and as president? (% Approve shown) Base: Total respondents, 2019
their households, as well as the probability associated
with the random selection of an individual household
member. The survey has a margin of error at a 95% Last year, we reported a tumble in Muslim’s rating of the
confidence level of general population ±3.6%. U.S. President’s job performance (from 78% approval of
President Barack Obama’s job performance in 2016 to
For more details on polling methodology, visit www.ispu. 13% approval of President Donald Trump’s performance
org/poll. in 2018). Approval ratings in 2019 remain low (Figure 2).
Muslim Approval of President’s Job Has
Results Declined Sharply Since 2016
CIVIC ENGAGEMENT 90%
80%
78%
70%
Muslims Least Likely to Approve of 60%
President and as Likely as Jews to Have 50%
Voted Democrat in the Midterms 40%
30%
Two years into the Trump presidency, American Muslims 20% 16%
13%
(16%) are the least likely group to report a favorable view 10%
of Donald Trump as President (Figure 1). Opinions about 0%
2016 2018 2019
the current President have held broadly similar to those
reported in our survey in 2018. On the whole, approval FIGURE 2: Do you approve or disapprove of the way [Barack Obama / Donald Trump]
is handling his job as president? (% Approve shown) Base: Total Muslim respondents,
has inched up minimally higher across all groups but 2016, 2018, 2019
inter-group differences have held steady. Non-affiliated
American Muslim Poll 2019: Predicting and Preventing Islamophobia 7Muslim Dissatisfaction with President Trump This hopefulness is still decisively lower than 2016
Varies by Race and Age (Figure 4), but suggests that in spite of their low opinion
of Donald Trump, American Muslims are likely buoyed
Within the Muslim community, approval of President
by two important developments: historic Muslim gains
Trump varies along age and racial lines: White Muslims
in the 2018 midterm elections and pushback against
(29%) and Muslims who are 30-49 years old (19%) are
Trump’s immigration policies. Conversely, satisfaction
more likely to view Donald Trump positively compared
among white Evangelicals in our sample fell from 50% in
to Muslims who are Arab (12%), Asian (16%), and Black
2018 to 24% in 2019.
(7%), and Muslims aged 50 and older (8%). Muslims’
approval for Donald Trump decreases as age increases,
Muslim Satisfaction with Direction of Country
which is contrary to the trend that prevails among the
Has Declined Since 2016
general population. Nineteen percent of Muslims in the
30-49 year old age bracket report approval of Donald
Trump’s job as president, while only 8% of Muslims aged 70%
63%
50 and older feel the same way. Among the general 60%
public, Donald Trump is approved of by 37% of those 50%
41%
aged 30-49 and approval grows to 46% in the 50 and
40% 33%
older group. 27%
30%
20%
Despite Dissatisfaction with the President,
Some Muslims Express Optimism with the 10%
Direction of the Country 0%
2016 2017 2018 2019
Surprisingly, despite the large portion expressing nega-
tive perception of the current administration, a degree of FIGURE 4: Overall, are you satisfied or dissatisfied with the way things are going in
this country today? (% Satisfied shown) Base: Total Muslim respondents, 2016, 2017,
optimism persists in the American Muslim community: 2018, 2019
33% of Muslims report being satisfied with the current
direction of the nation, more than Jews and the general
public (both 19%), Protestants (20%), and non-affiliated Fielding this survey (January 8-25, 2019) in the wake
Americans (13%). Muslims (33%) are statistically similar of the 2018 midterm elections and during the govern-
to Catholics (25%) and white Evangelicals (24%) in ex- ment shutdown of 2018-2019 has uniquely captured
pressing hopefulness. the pulse of Americans. The longest federal govern-
ment shutdown in U.S. history, which spanned from
Our data also suggest that all faith groups and non-affiliat- December 22, 2018, to January 25, 2019, showcased
ed Americans show a decline in their satisfaction with the the stiff resistance to Donald Trump’s immigration poli-
trajectory of the country in 2019 vs. 2018, except Muslims, cies and border wall proposal. The events that reaffirm
who have maintained their stance (33% vs. 27%). Muslims’ faith in the future of the nation are likely the
reason white Evangelicals, President Donald Trump’s
All Faith Groups, Except Muslims, Declined in staunchest supporters, in our sample have reported
Satisfaction with Direction of Country Over Past Year the most significant decrease in satisfaction “with the
way things are going in this country” of all groups sur-
White Evangelical 50%
veyed. While white Evangelicals’ optimism reduced by
nearly half from 50% approval in 2018 to 24% in 2019,
40%
Protestants reported a 15 point decrease over 2018
Protestant (35% vs. 20%) and the general public reported a 10
Catholic
point reduction (29% vs. 19%).
30%
Jewish
Muslim
To be clear, positive sentiment about the country’s direc-
20%
Non-Affiliated tion within the Muslim community is not uniform. White
(43%) and Asian (41%) Muslims are twice as likely to
10%
be satisfied than Black Muslims (20%). However, Black
2018 2019
Americans who are Muslim report satisfaction at much
FIGURE 3: Overall, are you satisfied or dissatisfied with the way things are going in higher levels than their non-Muslim counterparts in our
this country today? (% Satisfied shown) Base: Total respondents, 2018, 2019
sample (3%), as do white Muslims compared with white
American Muslim Poll 2019: Predicting and Preventing Islamophobia 8Americans in the general public (43% vs. 20%). It is Muslims Least Likely to Be Registered to Vote
worth noting that roughly a third (36%) of Black Muslims in 2019
compared to just 2% of Black Americans overall were
born outside of the U.S. In our research, immigrants are 95%
100% 92% 94% 94%
often more optimistic about the direction of the country 90% 85%
90%
than native-born Americans. Muslim women (70%) are 80% 73%
more likely to be dissatisfied about the country’s trajec- 70%
tory than men (58%), though Muslim women’s reported 60%
satisfaction is up from 17% in 2018 to 28% in 2019, 50%
40%
possibly reflective of encouraging recent events.
30%
20%
Though Growing, Muslim Voter 10%
Registration Still Lags Behind Other 0%
Muslim Jewish Catholic Protestant White Non- General
Groups Evangelical Affiliated Public
FIGURE 5: Are you registered to vote at your present address or not? (% Yes shown)
Muslims Least Likely to Be Eligible and Base: Total respondents who can legally vote in the U.S., 2019
Registered to Vote
Though the vast majority of Muslims (80%) are eligible
to vote, they are the least likely to be so among all faith Overall, voter registration among Muslims has main-
groups and non-affiliated Americans in our survey. Since tained an upward trajectory since 2016 (60%) and 2017
roughly half (52%) of American Muslims are born outside (68%) (Figure 6). However, despite concerted get-out-
of the United States, a significant subset of the group the-vote efforts ahead of November 2018 midterm elec-
may not have naturalized yet. In comparison, 92% of tions, the number of registered Muslim voters has re-
Jews, 94% of Catholics, 97% of Protestants, 99% of mained statistically similar in 2019 (73%) to what it was
white Evangelicals, 97% of non-affiliated Americans, in 2018 (75%). Roughly a quarter of American Muslims
and 96% of the general population are eligible to vote. remain disengaged at the ballot box.
Voter eligibility among Muslims has remained relatively
stable since 2016.
More Muslims Registered to Vote Than in
2016
Among those eligible to vote, Muslims (73%) are still less
likely than all other groups to be registered to vote. Other 90%
groups tally from 85% (non-affiliated Americans) to 95%
(Jews). The gap is most pronounced in the 18-29 age 80% 75%
73%
group where Muslim voter registration (63%) is a full 22 68%
70%
points behind the same age group among the general 60%
population (85%). Older Muslims’ (88%) registration 60%
patterns are similar to the general population (93%).
Muslims of all races are equally likely to be registered to 50%
vote, as are Muslim men and women.
40%
2016 2017 2018 2019
FIGURE 6: Are you registered to vote at your present address or not? (% Yes shown)
Base: Total Muslim respondents who can legally vote in the U.S., 2016, 2017, 2018,
2019
Muslim Voters’ Intentions to Vote Inconsistent
with Their Actions
In our 2018 survey, 83% of Muslims expressed their
intention to vote in the 2018 midterm elections, while
our survey in 2019 found that only 59% actually did.
In comparison, 82% among the general public in our
sample reported casting their ballots in the 2018 mid-
terms. Similarly in 2016, 81% of Muslims intended to
American Muslim Poll 2019: Predicting and Preventing Islamophobia 9vote in the 2016 presidential elections, while only 61% of races contested (141) were at the local level, though
did (Figure 7). Although some of the discrepancy may Muslims also competed for county, state-level, and
be attributed to the social desirability of the appearance Congressional positions, as well as judiciary offices at
of being a voter, for American Muslims, lack of engage- several levels.
ment in the electoral process also signals disenchant-
ment with available candidates and the electoral system. Muslim Young Adults’ Voting Trails Behind
In 2017, 42% of Muslims expressed their dissatisfac- Peers in General Public
tion with the candidates or lack of trust in the system,
which can explain resistance to mobilization efforts and Political engagement varies across age brackets among
the persistent gaps between word and action when it all groups surveyed, with greater participation by older
comes to the ballot. voters; Muslims are no different. However, Muslim young
adults’ participation in the midterms is sluggish in con-
Not All Muslims Who Intend to Vote Show up trast with their generational peers in the general popula-
tion (52% vs. 72%) as well as compared to their elders
at the Polls
in the community (71%). In a record-breaking year when
100% midterm voter turnout was highest since 1914, this
90%
81% 83% apathy may concern those working to increase Muslim
80%
political engagement. Our findings, therefore, highlight
70%
60%
61% 59% the need to promote civic engagement among young
50% Muslims. In the future, the importance assigned to a
40% Muslim voting bloc will rely heavily on the voting habits
30%
of this cadre of Muslim voters. Community activists and
20%
10% change makers have room to increase the education of
0%
2016 Presidential Election 2018 Midterm Elections
young adult Muslims to encourage and sustain mean-
ingful political engagement in the long run.
Intended to Vote Actually Voted
FIGURE 7: Do you plan to vote in the 2016 presidential election? Did you vote in the Though formal political activity appears to have pla-
2016 presidential election? Do you plan to vote in the November 2018 midterm
elections? Did you vote in the November 2018 midterm elections? Base: Total Muslim
teaued among young Muslims, they continue to be
respondents who can legally vote in the U.S., 2016, 2017, 2018, 2019 active in their local communities and engaged in domes-
tic issues. ISPU’s American Muslim Poll in 2017 report-
The story of Muslim participation in American politics ed that young adult Muslims show greater support for
is multifaceted. While some Muslims withdraw from it, social justice initiatives such as Black Lives Matter than
others seek to change the political landscape of their the general public (71% vs. 53%). Forty-four percent of
country. The 2018 midterm elections witnessed historic Muslim youth recounted volunteering to help neighbors
numbers of Muslim candidates running for public office. solve a community problem, which is on par with youth
That year, 23 Muslims declared candidacy for statewide among Jews, Catholics, Protestants, white Evangelicals,
or national office. Of the seven who won primaries, four and the general public demonstrating that they are just
won in the general elections. Two of the three elected as invested in their local communities as their genera-
Muslim members of Congress are women, a first for tional peers.
the U.S. House of Representatives. Keith Ellison, who
was the first Muslim to serve in Congress, became the Muslims and Jews Most Likely to Have Voted
Minnesota Attorney General, the first Muslim to occupy for a Democrat in 2018 Midterms
a state-level elected position.
Our data suggest that Muslims channeled their disap-
proval of the administration through their vote in the
According to an estimate by Emgage, an American
2018 midterm elections. More than three out of four
Muslim civil rights group, about 100 Muslim candidates
Muslims (76%) who cast ballots in the 2018 midterms
filed paperwork to run for various public offices in the
voted for a Democrat, while only 13% voted for a
2018 midterm elections, the highest number since the
Republican. Across faith groups and those unaffiliated,
year 2001. Over the years 2016-2018, 276 American
Muslims are more likely to vote Democratic than any
Muslims are reported to have run for public office, of
other group surveyed except Jews (69%), who vote
whom 131 won. Thirty-six percent of these candidates
similarly (Figure 8). Muslims are about four times more
were women and 64% were men. The highest number
likely to vote Democratic than white Evangelicals (76%
American Muslim Poll 2019: Predicting and Preventing Islamophobia 10vs. 17%). Favoring Democratic candidates is consistent Muslim participation. Unsurprisingly, belonging to a
with the trend of three-fourths of Muslims’ self-identifica- high income bracket and older age group is linked to a
tion as Democrats or Democratic-leaning in their political greater likelihood of voting in midterm elections, which
beliefs. It is no surprise, then, that over 90% of American mirrors trends in the general public.
Muslim candidates in the 2018 midterm elections are
reported to have contested on the Democratic platform. Remarkably, the level of education attained does not
impact voter participation for Muslims, though a college
Muslims and Jews Most Likely to Have Voted degree is the strongest determinant of participation for
for a Democrat in 2018 Midterms the general public.
90% Mosque attendance stands out as a predictor of civic
80% 76% engagement, as in past surveys. For Muslims, associa-
69%
70% 66%
tion with their local faith community translates into direct
60%
50% 52% participation in midterm elections. The same holds true
50%
42% for the general public, where weekly attendance of a reli-
40%
gious service is also linked to voting in midterm elections.
30%
20% 17%
Contacting a local elected official, but not a federal
10%
official, emerged as the strongest determinant of midterm
0%
Muslim Jewish Catholic Protestant White Non- General participation among Muslims. On average, Muslims who
Evangelical Affiliated Public
contact local officials are 25% more likely to vote in
FIGURE 8: If you voted for a Member of Congress this November, did you vote for a midterm elections. While it is not surprising that those
Republican candidate or the Democratic candidate? (% Who voted Democrat shown)
Base: Total respondents who can legally vote in the U.S. and voted in the November who make the effort to contact their elected official are
2018 midterm elections, 2019 also more likely to vote in the midterms, it is noteworthy
that this only becomes significant for local officials and
Older Muslims Lean More Democratic Than not federal officials. This suggests that when Muslims
Generational Peers in General Public are engaged locally, not just at the federal level, they
While Muslims of all ages are likely to vote for Democratic are more likely to participate overall, even in state and
candidates, those aged 50 and older are nearly twice as federal elections.
likely to vote for Democrats than the same age group
among the general public (83% vs. 44%). As with the Income, Age, Mosque Attendance, and Local
general public, party alignment varies by race in the Political Engagement Predict Voter
Muslim community. White Muslims (25%) are more likely Participation Among Muslims
than Asian Muslims (9%) to vote Republican and about
six times as likely to vote Republican as Black Muslims
(4%). Uniquely, Muslims’ voting pattern diverges from HIGHER VOTER PARTICIPATION
the general public—as they age, the general popula-
Strong Predictor Moderate Predictor
tion leans more Republican whereas Muslim Americans
continue to identify as strongly Democratic. Among the
general public, support for Democrats falls from 70%
among young adults (18-29) to 56% among middle-
aged Americans (30-49) and further to 44% in the oldest
age group (50+). Among Muslims, 75% of young adults
and those of middle age vote Democratic, and 83% of
Contacted Local High Income Over the Age Attends Religious
those who are 50 and older report the same. Elected Official in of 50 Service Weekly
Past Year
Muslim Local Engagement with Elected FIGURE 9: Did you vote in the November 2018 midterm elections? Base: Total Muslim
respondents who can legally vote in the U.S., 2019
Officials a Predictor of Voter Participation We used linear regression and held key variables constant (including demographics,
political party identification, and political ideology) to isolate the effect of each variable of
More Broadly interest. For the effect size of the variable, “Strong” in this case represents a shift in the
predicted probability of a midterm vote by 20% or more and “Moderate” indicates a shift
What factors predict American Muslims’ voting in the between 10% and 20%.
midterms? Fielding this survey soon after the 2018
midterm elections has given insights into patterns of
American Muslim Poll 2019: Predicting and Preventing Islamophobia 11Muslims Less Likely to Communicate with 50 and older lag behind their age groups in the general
Elected Officials public (19% vs. 32% and 22% vs. 38%).
Our data indicate that Muslims are less likely than all
Given the strong influence of involvement in local politics
other groups surveyed to communicate with federal
on midterm participation and the low levels of Muslims’
and local elected officials. Muslims are half as likely as
involvement in the same, there is an opportunity for
Jews and Protestants to contact federal elected officials
Muslims to build local relationships. Investment in their
(17% vs. 39%), and similarly lag behind Catholics (27%),
local faith community and the broader public, as well
white Evangelicals (33%), the non-affiliated (32%), and
as involvement in local politics can increase Muslims’
the general public (31%). While Muslims are about as
buy-in and engagement at the national level.
likely to engage a local official as a federal official, they
are less likely than all other faith groups and non-affiliat-
ed Americans to contact local elected officials as well. Support for Muslim Ban Does Little to
Only 20% of Muslims report communicating with a city Help Candidates With Most Voters
or state official in contrast with more than one-third of In effect since 2017 in various renditions, President
Jews (38%), Protestants (39%), and white Evangelicals Donald Trump’s controversial executive order to impose
(35%). Among Catholics and non-affiliated Americans, travel restrictions and ban citizens from five predomi-
29% and 30%, respectively, engaged with local officials. nantly Muslim countries has been widely debated.
Immigration remains in the spotlight in the political arena
Muslim women (20%) are just as likely as Muslim men and candidates support or oppose the so-called “Muslim
(21%) to contact their local officials, as are most women ban” to indicate their political leaning. How significant, if
and men of various faith groups in our survey. However, at all, is a candidate’s endorsement of the Muslim ban
in some instances, men and women’s engagement to voters?
patterns differ from each other. This is the case among
white Evangelicals and Jews. For white Evangelicals, • Our data reveal that a majority of Muslims, Jews,
men are far more likely to be involved than women at and non-affiliated Americans say a candidate’s
the local (52% vs. 23%) as well as federal level (48% support for the Muslim ban would be reason to
vs. 22%). On the other hand, among Jews, women decrease their support for this individual’s run for
(47%) lead men (31%) in federal engagement. Muslim elected office: 61% of Muslims, 53% of Jews, and
women being as civically engaged as Muslim men is not 56% of non-affiliated Americans hold this view.
shocking; our 2017 American Muslim survey found that
• While white Evangelicals (44%) are the most likely
Muslim women’s donation spending, support for social
of any group to say a candidate’s endorsement
justice initiatives, and reporting of discrimination out-
of the Muslim ban would increase their support of
paces Muslim men.
that candidate. However, a majority of even this
faith group, Trump’s strongest supporters, say a
Muslims aged 50 and older (23%) are more likely than
candidate’s support for such a policy would either
Muslims aged 18-29 (16%) and those aged 30-49
decrease their support (19%) or would make no
(14%) to contact a federal elected official. This trend is
difference (37%).
similar to the general public where a greater percentage
of older age groups are more likely to contact federal • The general public is twice as likely to say a
officials. These data reflect the greater overall voter candidate’s endorsement of a Muslim Ban would
engagement among older Muslims as compared to decrease their support (44%) as increase it (21%),
younger coreligionists. However, middle-aged Muslims’ with 34% saying it would make no difference.
engagement is significantly lower than that of their gen-
erational peers in the general public (14% vs. 28%).
Even the most engaged Muslims in the 50+ group fall
behind their peers (23% vs. 37%) when it comes to con-
tacting a federal official. Among Muslims, white Muslims
(25%) are most likely to get in touch with a federal of-
ficial. Engagement with a local elected official is similar
across age groups among Muslims, ranging from 19%
to 22%. Once again, Muslims who are middle-aged or
American Muslim Poll 2019: Predicting and Preventing Islamophobia 12Endorsement of Muslim Ban Does Little to discrimination (55% of men vs. 68% of women). Though
Help Candidates with Most Voters Muslim women continue to experience greater religious
discrimination than all other groups studied—findings
that remain the same in 2019 as in previous years—it
INCREASE SUPPORT DECREASE SUPPORT NO DIFFERENCE
has not distanced them from their faith.
Muslim 8% 61% 27%
The percentage of Muslims who hold religion very im-
Jewish 15% 53% 30%
portant to their daily lives has held steady since 2016.
Catholic 18% 41% 41%
Muslims as Likely to Attend Religious Services
34% 33% 33%
Protestant
as Protestants
White Evangelical 44% 19% 37% As with previous studies (ISPU poll 2016-2018, Gallup
2009, Pew 2011 and 2016), Muslims are on par with
Non-Affililated 12% 56% 29%
Protestants in religious attendance—43% of Muslims
General Public 21% 44% 34% and 49% of Protestants report attending a religious
service once a week or more. In our survey, Muslims’
and Protestants’ religious attendance is greater than
FIGURE 10: Does a candidate's support of President Trump's travel ban on citizens
from five predominantly Muslim countries, a policy sometimes referred to as the Jews’ (23%) and Catholics’ (27%), but less than that of
“Muslim ban,” increase your support, decrease your support, or not make a white Evangelicals (64%).
difference to your support for this candidate? Base: Total respondents, 2019
Uniquely among Muslims, religious service attendance
does not differ by age. In the general public, those aged
These findings suggest that immigration and tourism
50 and over are more likely to attend religious services
from the countries included in the Muslim ban are not a
once a week or more frequently than those in younger
major concern for a majority of Americans. Endorsement
age brackets. As such, Muslim 18-29 year olds (31%)
for this controversial Trump policy is more likely to hurt
are more likely to attend weekly religious services than
than help candidates with most voters.
their peers in the general public (18%). Muslim women
are less likely than men to attend a weekly service (29%
vs. 55%), explained partially by the fact that traditional
FAITH AND COMMUNITY Islamic teachings require men to attend Friday congre-
gational prayer and make it optional for women.
Muslims Profess More Private Religious
Devotion, Less Public Religious
It is worth noting, however, that Muslim men and women
Assertiveness
are equally likely to say they are “satisfied with the way
Muslims More Likely to Hold Religion Very things are done at their house of worship” (78% of men
Important Than All Other Groups, Except and 79% of women). Overall, Muslims (78%) report being
White Evangelicals more satisfied with the way their houses of worship are
run as compared to Catholics (63%) and the general
Muslims (71%) are far more likely to say religion is “very
public (62%).
important to their daily lives” than Jews and Catholics
(both 35%), Protestants (61%), or the general public
Muslims aged 50 and older are more likely to be satis-
(36%). The importance of faith to Muslims is only sur-
fied (89%) with their house of worship than young adults
passed by white Evangelicals (82%) in our survey.
(18-29) and middle-aged (30-49) Muslims (both 76%). It
Noticeably, though white Evangelicals and Muslims
is noteworthy that young adults (52%) and middle-aged
diverge in their views in most of our findings, the two
Americans (60%) in the general public are also less likely
groups stand out as the most devoted to their faith
to express satisfaction with their places of worship than
amidst a sea of growing secularism.
their elders ages 50+ (68%). Opinions among Muslims
are similar across race.
Muslim women and men are equally likely to say reli-
gion is important to them, despite the greater social
cost that Muslim women incur for their faith identity in
the form of a greater frequency of reported religious
American Muslim Poll 2019: Predicting and Preventing Islamophobia 13Muslims Profess More Private Religious b. Your religion should be a source of American law
Devotion, Less Public Religious Assertiveness but not the only source.
We aimed to measure not only outward religious prac- c. Your religion should NOT be a source of
tice, but the degree to which faith animated one’s inner American law.
reality. We designed a section of our survey to gauge
private and public spiritual engagement. Two survey Muslims (33%) are less likely than white Evangelicals
questions intended to measure private religious engage- (54%) to say they want their religion to be a source of
ment and three captured public religiosity. American law but not the only source. Muslims are on
par with Catholics (28%), Protestants (39%), and the
Religion in Private Life general public (29%) to hold this view. All these groups
are more likely than Jews (19%) and non-affiliated
We asked survey participants to indicate how much they
Americans (10%) to agree (Figure 11).
agreed or disagreed with the following statement:
This finding confirms our hypothesis that a group’s wish
“Because of my religious faith, I have meaning and
to link religion to law would mirror the importance of re-
purpose in my life.”
ligion to them. These data suggest that people who see
their faith as an important part of their personal life also
This question is a measure of the meaning one draws
want to see their values reflected in the laws of the land.
from their religion. We expected this dimension of per-
Muslims are not unique in this regard, nor are they the
sonal spirituality to closely track with the importance of
group most prone to this view.
religion reported by groups overall, and it does. Once
again, Muslims (63%) are more likely than Jews (33%),
Within the Muslim community, Arabs (70%) are most
Catholics (37%), Protestants (54%), and the non-affiliat-
likely to see no role for their faith in American law, while
ed (6%) to strongly agree with the statement. However,
other age and racial groups do not differ in their re-
white Evangelicals are the group most likely to strongly
sponses. Among the general public, Black Americans
agree (75%). Among Muslims, all ages and races are
(25%) are the most likely to see a role for their faith as
equally likely to find meaning and purpose through re-
the main source of American law.
ligion. In contrast, in the general public, those aged 50
and older as well as Black Americans are more likely to
White Evangelicals Most Likely to Say Their
report the same.
Religion Should Be a Source of American Law
Respondents also reported how strongly they agreed or
disagreed with the following statement: Muslim 12% 33% 51%
“Because of my religious faith, I have forgiven people Jewish 8% 19% 71%
who have hurt me deeply.”
Catholic 5% 28% 66%
This question is a measure of the power of faith to Protestant 17% 39% 42%
overcome vengeance and ego. We found that Muslims
27%
(54%) and white Evangelicals (63%) are most likely to White Evangelical 17% 54%
“strongly agree” that they have forgiven someone who 10% 87%
Non-Affiliated
has hurt them deeply because of their faith, counter-
ing the popular trope that Islam teaches vengeance and General Public 9% 29% 62%
Christianity forgiveness. 0% 10% 20% 30% 40% 50% 60% 70% 80% 90% 100%
Main Source of Law Some Source of Law Not Source of Law
Religion in Public Life
FIGURE 11: I am going to read you a few statements, please tell me which one comes
Respondents were asked to choose one of the following closer to your point of view: Your religion should be the MAIN source of American law. Your
religion should be a source of American law but not the only source. Your religion should
statements that is closest to their point of view: NOT be a source of American law. Base: Total respondents, 2019
a. Your religion should be the MAIN source of
American law.
American Muslim Poll 2019: Predicting and Preventing Islamophobia 14We asked participants to share how much they agreed Our data finds that Muslims (55%) are more likely than
or disagreed with the following statement: Catholics (23%) or the general public (35%) to believe
in linked fate, similar to Protestants (55%) and white
“I will take unpopular stands to defend my religious faith.” Evangelicals (57%). Though less pronounced in their
religious devotion compared to Muslims and white
This question illustrates one’s readiness, or courage, to Evangelicals, Jews (69%) are most likely to express
take a risk to defend their faith by being “unpopular.” a linked fate with their group. This sense of collective
We would expect those who see their faith as impor- destiny may explain Jews’ willingness to defend their
tant to them to be more likely to express this readiness faith in public even if they are not practicing it in their
than others who have a more secular outlook. Some private lives.
groups surprised us. We found that Muslims (56%) are
less likely than Jews (72%) to agree that they will “take Of the three measures of spiritual engagement—(1)
unpopular stands to defend their religious faith” despite meaning and purpose, (2) forgiveness, and (3) un-
faith being more important to Muslims than it is to Jews popular stances to defend it—Muslims are highest on
according to the data that measure private devotion. dimensions that reflect private spirituality and lower on
In this instance, Muslims are closer to Catholics (54%) the one that requires public risk. White Evangelicals are
on the spectrum, though they surpass Catholics in the high on all three, which reflects their public assertive-
importance of religion in their lives (71% vs. 35% very ness and deep personal devotion. Jews are more likely
important) and frequency of religious services (43% vs. than Muslims to be willing to take unpopular stances,
27% once a week or more). but lag in the dimensions that reflect personal devotion.
Catholics are lower on all three, which corresponds to
Unsurprisingly, given the importance of religion to their the less pronounced place religion is reported to have in
group, roughly three-quarters of white Evangelicals their personal lives.
(78%) agree with taking unpopular stands in defense
of their faith. This is on par with Jews (72%) despite We have summarized these dimensions in the follow-
the sharp difference in their reported private religious ing framework (Figure 12), placing our surveyed religious
devotion. communities in one of four quadrants depending on their
relative public and private levels of religious engagement.
One reason that can be ascribed to Muslims’ lukewarm
support for outspoken displays in defense of their faith is White Evangelicals Most Likely to Be Both
the high incidence of religious discrimination. As a faith Privately and Publicly Religious
group, Muslims report the most frequent religious dis-
crimination (62% vs. 43% or less) and as such have the
most to risk with unpopular public displays in defense
High
White Evangelical
of their faith.
Jewish
PUBLIC ENGAGEMENT
Finally, we asked survey participants the following
question: Protestant
“Do you think what happens to members of your faith Catholic Muslim
community in this country will affect you personally?”
This question measures what is termed “linked fate,”3
Non-Affiliated
how much one feels that their personal lives are impact-
Low
ed by the fate of their religious community. How much Low High
solidarity or shared destiny do respondents perceive with PRIVATE ENGAGEMENT
their group of co-faithful? The answers would gauge a
FIGURE 12: This table is a summary of the authors’ observations regarding where
sense of group cohesiveness, where one’s outcomes different American faith communities land on the two dimensional spectrum of public
and private religious engagement.
are closely linked to those of one’s groups. For instance,
those with high levels of “linked fate” would indicate that
they are doing well personally if their group is doing well,
and they would likewise perceive an attack on the group
as being a personal threat.
American Muslim Poll 2019: Predicting and Preventing Islamophobia 15You can also read