SOUTH AUSTRALIA KEY HAZARDS & RISKS SUMMARY - (February 2020) - AWS
←
→
Page content transcription
If your browser does not render page correctly, please read the page content below
KEY HAZARDS &
              RISKS SUMMARY
                     (February 2020)

SOUTH AUSTRALIA

      Light Square

      Page 1 of 38
Contents
FOREWORD ............................................................................................................................................3
SOUTH AUSTRALIA IN FOCUS ..............................................................................................................4
ZONE KEY HAZARDS AND RISKS SUMMARIES ...................................................................................5
HAZARD IMPACT CATEGORIES ............................................................................................................6
SOUTH AUSTRALIAN STATE HAZARDS ...............................................................................................7
DISASTER RISK REDUCTION ................................................................................................................8
CLIMATE CHANGING OUR WORLD .......................................................................................................9
ANIMAL AND PLANT DISEASE .............................................................................................................10
BLACK SYSTEM EVENT .......................................................................................................................12
BUSHFIRE .............................................................................................................................................14
CYBER CRISIS (emerging) ....................................................................................................................16
EARTHQUAKE.......................................................................................................................................18
ESCAPE OF HAZARDOUS MATERIALS ...............................................................................................20
FLOOD ...................................................................................................................................................22
HEATWAVE ...........................................................................................................................................24
HUMAN DISEASE ..................................................................................................................................26
STORM ..................................................................................................................................................28
STRUCTURE FIRE ................................................................................................................................30
TERRORISM ..........................................................................................................................................32
MANAGING RISKS TO SOUTH AUSTRALIA ........................................................................................34
OUR GOVERNANCE FRAMEWORK .....................................................................................................34
SHARED RESPONSIBILITY ..................................................................................................................35
STRONGER TOGETHER ......................................................................................................................36
SOUTH AUSTRALIA’S DISASTER RESILIENCE STRATEGY ..............................................................36
FURTHER READING .............................................................................................................................37

   PUBLISHED FEBRUARY 2020
   This project was funded under the Natural Disaster Resilience Program by the South Australian State Government and the
   Commonwealth Department of Home Affairs.
   Disclaimer - The information contained in this State Key Hazards and Risks Summary is provided by the Government of
   South Australia as a public service. This document has been prepared in good faith and is derived from sources believed to
   be reliable and accurate at the time of publication. Nevertheless, the reliability and accuracy of the information cannot be
   guaranteed and the Government of South Australia expressly disclaims liability for any act or omission done or not done in
   reliance on this information and for any consequences, whether direct or indirect, arising from such act or omission. This
   document is intended to be a guide only and readers should obtain their own independent advice and make their own
   necessary inquiries.
   Photo Credits:
   Front Cover - Light Square SA Tourist Commission #250081
   Back Cover - Port Hughes, Yorke Peninsula SA Tourist Commission #250069

                                                                   Page 2 of 38
FOREWORD
Across South Australia there are a range of hazards that can have significant impact on people’s health
and wellbeing, along with severe impacts to the State’s economy, the environment, and our
communities.
Fortunately the emergencies and disasters we generally experience are generally not at the same
frequency or scale as other States and Territories.
Research by Handmer, Ladds and Magee1 estimates that between 1967 and 2013, South Australia
sustained total losses of approximately $5 billion (i.e. 3.2% of national losses). This assessment included
the significant 1992 Adelaide Hills floods, and the 1980 and 1983 Ash Wednesday bushfires.
In 2017, the Australian Business Roundtable noted that “Today, based on the history of natural disasters
over the past 50 years, the total economic cost of natural disasters in SA is estimated to be $200m per
year. The cost in SA is forecast to reach $700m a year by 2050”.2
Since 2013, other significant events have impacted South Australia, including the 2015 Sampson Flat
and Pinery bushfires and the extreme weather event that caused the State-wide black system event in
September/October 2016.
The 2019-2020 bushfire season saw multiple significant bushfires occur across the State including the
Cudlee Creek and Kangaroo Island bushfires. By early February 2020 over 265,000 ha had been burnt
resulting in 3 fatalities and the loss of 188 houses, 60,000 livestock and large numbers of wildlife.
This document does not address day-to-day emergencies that are managed by response agencies (such
as a house fire, road crash rescue or ambulance response to an individual), but has a clear focus on
large scale emergencies requiring cross agency cooperation and provision of government support to
assist community recovery.
This document provides a snapshot of high impact hazards and associated risks, and supports eleven
Emergency Management Zone (regional) Key Hazards and Risks Summaries that provide specific
information on the natural disasters and hazards identified relevant to each zone.
As a nation, we are striving to meet the potential impacts of severe to catastrophic disasters. As a State,
we all need to participate in preparing for and mitigating emergency events. Building resilience in the
community is key to minimising risk and increasing our ability to respond and recover from these events.

Dominic Lane
Chief Executive
SA Fire and Emergency Services Commission

1 Handmer J, Ladds M, and Magee L, 2016. Disaster losses from natural hazards in Australia, 1967-2013. (Note, this study was limited to
events that caused estimated losses of at least $10 million, therefore excluding many smaller events that have caused death, injury and losses.)
2
  Australian Business Roundtable “Building resilience to natural disasters in our states and territories” November 2017

                                                              Page 3 of 38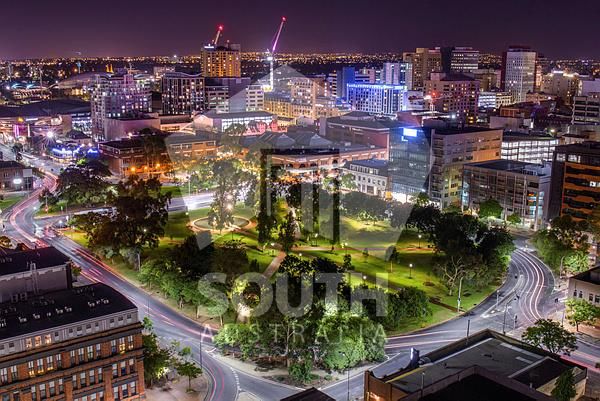
SOUTH AUSTRALIA IN FOCUS

        People                  Social setting /                 Economy
                                 community
                                                           $107.4 billion
 1.73 million people           60 towns and cities with    Gross State Product
                                                           annually
 Average age is   40           a population greater than
                               1,000 people
 years                                                     143,542 registered
 17.5 % are children           273,321 people              businesses
                               speak a language other
 aged 0-14 years
                               than English at home
                                                           98% businesses have
                                                           less than 19 employees
 18.2% are aged over           3,392 people speak
 65 years                                                  Major industries
                               an Australian Indigenous
                                                           Health care
 83.4%         of South
                               Language
                                                           Retail
 Australians live in the       Top 5 non-English           Manufacturing
 greater Adelaide Planning                                 Education/training
 region                        languages                   Public administration
                               Italian
                               Mandarin                    Top 5 occupations
                               Greek                       Professionals
                               Vietnamese                  Clerical / administrative
                               Persian / Dari              Technicians & trades
                               Growing ancestries          Managers
                                                           Community & personal
                               Chinese (0.8%)              service
                               Indian (0.7%)
   Environment
                               Irish / Scottish (0.4%)
                               Vietnamese / Filipino
                                                           47,000 km of
                               (0.2%)                      arterial road network

 1,043,514 square              Growing religions           1.36 million
                               Hinduism (0.5%)             registered motor vehicles
 kilometres of land mass
                               Christian (nfd) (0.5%)
 3,816 km of                   Islam (0.5%)                75 million
                               Buddhism (0.1%)             passengers on metropolitan
 mainland coastline plus
                                                           public transport network
 1,251 km island length                                    annually

 5 major deserts                                           7 million visitors annually
 27 prominent natural                                      33.5 million Visitor
 lakes and lagoons                                         nights annually

 6 wetlands of international                               $6.9 billion spent by
 importance                                                visitors annually

                                      Page 4 of 38
ZONE KEY HAZARDS AND RISKS SUMMARIES

  The 2011 National Strategy for Disaster Resilience recognised that Australians need to
  better understand risks relevant to their community and prepare for potential impacts.

  South Australia has been divided into 11 Emergency Management Zones based on
  State Government Regions.

  Zone Emergency Management Plans were produced for each zone by State and Local
  governments based on risk assessments conducted with stakeholders from government
  agencies and non-government organisations, using the National Emergency Risk
  Assessment Guidelines. Workshop participants used realistic hazard scenarios to
  assess the risks which were most likely to occur and have the greatest impacts in their
  zone.

  These are detailed in each zone’s Key Hazards and Risks Summary which are
  available on the SES website:
  https://www.ses.sa.gov.au/site/community_safety/community_engagement/key_hazards_risks_
  summary_for_zones.jsp

                                       Page 5 of 38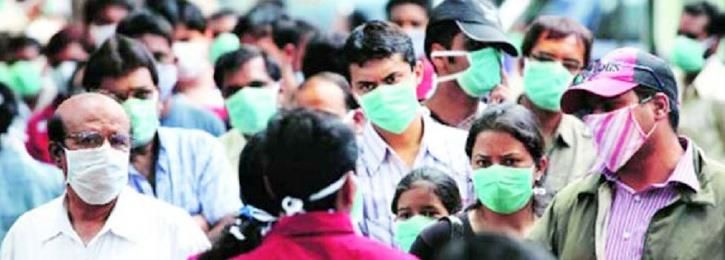
HAZARD IMPACT CATEGORIES
In this report, hazards are assessed in the impact categories of people, the state’s economy,
environment, and social setting (i.e. community).

   People impacts describe deaths
   and injuries, including psychological
   effects, as a direct result of the
   emergency event, relative to the
   population being considered.
                                                      Economic impacts include
                                                      financial and economic losses
                                                      resulting directly from damage due to
                                                      the emergency event. Dollar-value
                                                      financial losses can be measured as
                                                      direct and indirect, and tangible and
                                                      intangible.

  Environmental impacts include
  loss of species and landscapes, and
  loss of environmental value, as a
  result of the emergency event.

                                                          Social setting /
                                                          Community impacts are
                                                          concerned with the effect on
                                                          communities from the emergency
                                                          event, as distinct from the individual
                                                          impacts assessed in the people
                                                          criteria.
                                                          The consequences are concerned
                                                          with the effect on communities as a
                                                          whole, such as the diffusion of
                                                          community activities in the local
                                                          area, breakdown of community
                                                          organisations and structures, and a
                                                          permanent reduction in the
                                                          community.

                                           Page 6 of 38
SOUTH AUSTRALIAN STATE HAZARDS

Over the past 10 years, risk assessments have been conducted on the State’s key hazards
using AS/NZS 4360 Risk management, ISO 31000 Risk management, and the National
Emergency Risk Assessment Guidelines (NERAG).
A hazard is a source of potential harm, or a situation that can cause loss.

The State Emergency Management Committee has identified a range of hazards that have
the potential to cause significant impacts.

 Animal and plant disease
 Black system event
 Bushfire
 Earthquake
 Escape of hazardous materials
                                                        Hazards are reviewed
 Flood                                                  periodically, and can be added
 Heatwave                                               or removed as a State Hazard.
 Human disease                                          For example:
 Storm                                                   • Riverbank collapse was
                                                           added in 2009 after
 Structure fire                                            drought conditions saw
 Terrorism                                                 River Murray levels drop
                                                           by 1.5 metres below Lock
                                                           1, and removed in 2015
                                                           after river flows and pool
                                                           levels returned to normal;
                                                         • Black System Event was
                                                           added after the September
                                                           2016 state-wide power
                                                           outage; and
                                                         • Cyber Crisis has been
                                                           identified as an emerging
                                                           risk and is being
                                                           considered by the State
                                                           Emergency Management
                                                           Committee for inclusion as
                                                           a State Hazard.

                                         Page 7 of 38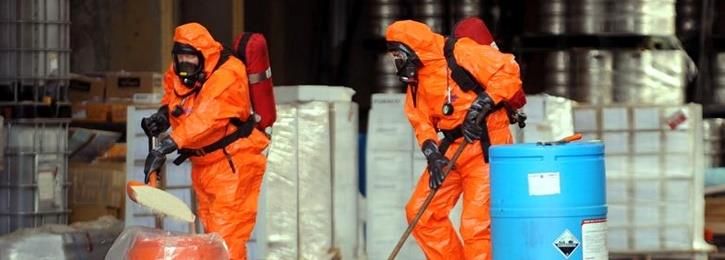
DISASTER RISK REDUCTION

 In 2015, Australia became a signatory to the international Sendai Framework for Disaster
 Risk Reduction 2015-2030. The Commonwealth, States and Territory Governments
 developed and endorsed in 2018 the following two frameworks:
  •       National Disaster Risk Reduction Framework – which outlines a national
          comprehensive approach to proactively reducing risk now, and into the future, and
  •       Australian Disaster Preparedness Framework - a guideline to develop the capabilities
          required to manage severe to catastrophic disasters.

Each of the State Hazards has specific agencies – known as Hazard Leaders and Control
Agencies – assigned to manage and lead response when an emergency occurs.

      HAZARD LEADER
      An agency of the Government of
      South Australia which has
      knowledge, expertise and                                   CONTROL AGENCY
      resources, to provide leadership for                       An agency assigned under
      emergency management planning                              legislation (or the State Emergency
      for an appointed hazard.                                   Management Plan) to perform the
      It is not necessarily the case that                        function of exercising control of an
      the Hazard Leader is the Control                           emergency.
      Agency as these roles may be split                         Role
      based on the respective agency
      resources and expertise.                                   •   Take control of the response

      Role                                                       •   Ensure a safe working environment

      •    Bring together all agencies of                        •   Ensure effective liaison,
           government and any required                               communication and cooperation
           Commonwealth, local or non-                           •   Continually assess the situation,
           government entities to undertake                          identify risks and share information
           comprehensive planning processes                          with all involved
           relating to its assigned Hazard
                                                                 •   Develop and share plans and
      •    Prepare, review and maintain a                            strategies
           hazard plan for their assigned
           hazard                                                •   Implement and monitor incident
                                                                     action plans
      •    Review other plans to ensure that
           all aspects of their assigned hazard                  •   Ensure the effective allocation of
           have been addressed                                       available resources

      •    Work with the various Sub-                            •   Ensure the public is adequately
           Committees, Control Agencies,                             informed and warned
           Support Agencies, and Functional                      •   Facilitate investigation of the
           Support Groups to ensure that all                         emergency and review of response
           aspects of the state’s approach to a                      activities
           hazard, including mitigation,
           response and recovery measures,                       •   Coordinate the transition from
           are coordinated.                                          response to recovery

                                                  Page 8 of 38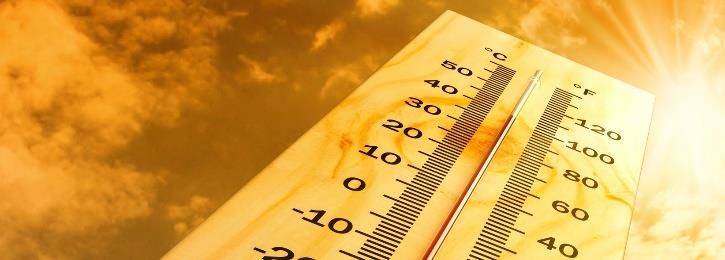
CLIMATE CHANGING OUR WORLD
Climate change is already happening and further change is inevitable. The effects of a changing
climate affect most sectors of the environment, economy and community.
The failure of climate-change mitigation and adaptation has been identified by the World Economic
Forum’s Global Risks Report 2019 as the second most important global risk in terms of likelihood and
impact.

   FIVE MOST LIKELY GLOBAL                                    FIVE MOST IMPACTFUL GLOBAL
   RISKS:                                                     RISKS:
     •    Extreme weather events                                •   Weapons of mass destruction
     •    Failure of climate-change                             •   Failure of climate-change
          mitigation and adaptation                                 mitigation and adaptation
     •    Natural disasters                                     •   Extreme weather events
     •    Data fraud or theft                                   •   Water crises
     •    Cyber attacks                                         •   Natural disasters

In South Australia, climate change is already apparent over a range of time-scales:

         Since 1910, average             Since 1965, sea levels                Since 1990, annual
              surface air                 along our coast have                rainfall between April
           temperature and                risen by between 1.5                   and October has
           surrounding sea                 and 4 mm per year.                  reduced by 10 to 40
         surface temperature                                                     mm per decade
            has warmed by                                                    across some southern
          around one degree                                                     agricultural areas.
               Celsius.

The Department for Environment and Water (DEW) is supporting the Premier’s Climate Change
Council to establish a new across agency climate change strategy for South Australia and to
develop a blue carbon strategy for South Australia in collaboration with government agencies
and other stakeholders. More information can be found here:
https://www.environment.sa.gov.au/topics/climate-change

Future climate change may include:

                Average temperatures in South Australia are projected to increase by between 1.0
                and 2.1 degrees by 2050.

                Sea levels across South Australia are projected to rise by 22 to 25 cm by 2050. This
                will raise the height of coastal sea level events related to high tides and storm surges,
                resulting in more frequent floods and increased coastal erosion.

                                               Page 9 of 38
ANIMAL AND PLANT DISEASE

                                                        POTENTIAL IMPACTS
  The Department of Primary Industries and
  Regions South Australia (PIRSA) is the                        Physical injury, illness or death from
  designated Hazard Leader and Control                          exposure to physical, biological or
  Agency.                                                       chemical hazards, and threat to
                                                                mental health and wellbeing from any
                                                                losses or impacts experienced.
                                                                Disruption to economic activity,
Animal and plant diseases are defined under                     potential for significant loss of local
legislation (and the Emergency Plant Pest                       and export trade earnings,
Response Deed, or Emergency Animal Disease                      reputational damage, and loss of
Response Agreement) including:                                  long-term market share.

 •     Fisheries Management Act 2007 (e.g.                      Contamination of soil and waterways,
       emergency aquatic (marine and                            loss of animal or plant species in
       freshwater) pests)                                       local area, and elevated risk of large-
                                                                scale waste disposal requirements.
 •     Livestock Act 2007 (e.g. emergency animal
                                                                Response-related quarantine or
       diseases, and emergency aquatic animal
                                                                movement control measures, and
       diseases)
                                                                long-term recovery issues related to
 •     Natural Resources Management Act 2004                    business viability, local economy,
       (e.g. pests, and some invasive vertebrate                employment migration or loss of
       pests and weeds)                                         major industry / employer.
 •     Plant Health Act 2009 (e.g. emergency
       plant pests/diseases)
                                                          For more information regarding Animal
Biosecurity means:
                                                          and Plant Disease visit:
     “protecting the economy, environment,                www.sa.gov.au/topics/emergencies-and-
     and the community from the negative                  safety/types/animal-and-plant-disease
     impacts of pests, disease, weeds, and
     contaminants.”
It includes trying to prevent new pests and
diseases from establishing, through early
detection, and helping to control outbreaks when
they do occur.

                                               Page 10 of 38
HISTORICAL EVENTS KEY RISKS FOR SOUTH AUSTRALIA
August 2007: A large Equine Influenza The $22.3b Agriculture, Food and Wood industry
outbreak, associated with imported horses, was is at risk from more than 285 exotic pests or
experienced in New South Wales and diseases of consequence. Outbreaks can result
Queensland, with nearly 10,000 properties from a number of circumstances such as:
affected during the epidemic. In South Australia,
• Zoonotic transmission (i.e. human to
it resulted in a two-week, state-wide horse
animal)
standstill order, replaced with a risk-based
permit system for horse events. • Vector borne (e.g. biting insects)
Late 2014: The Giant Pine Scales (insect) is an • Mitigation program failure
exotic plant pest that was detected in three pine • Intentional introduction (e.g. illegal
tree species, and posed a threat to Australia’s introduction of prohibited items)
softwood plantation industry, parks, forests and
residential properties. A national response plan • Bioterrorism
was unable to eradicate the pest in Victoria. In • Contaminated feed
October 2016, without an effective chemical
treatment, a management program was • In/on packaging of imported goods
implemented. • On the footwear or clothing of travellers
February 2016: Pacific Oyster Mortality • Bio-fouling on ships or in ballast water
Syndrome (disease) causes cumulative
• Escape or release of species (e.g. from
mortalities to oysters within 10 days. When the
aquarium trade)
disease was confirmed in Tasmania, from where
South Australia imports most of its oyster spat, Impacts may vary in scale due to specific
PIRSA conducted extensive sample testing environmental requirements of the pest/disease,
across the state, and a Notice of Prohibition on host density, weather conditions, and timing of
the entry of live oysters remains in place until detection, and therefore may be experienced on
March 2020. Surveillance indicates that South a local, state or national level.
Australia remains free of the disease, however
the industry impacts included job losses and a PIRSA actively:
significant reduction in sales for more than 24 • Undertakes prevention, surveillance and
months. eradication activities to keep animal and
plant pests out of the state
• Develops partnerships with government,
industry and community to implement
biosecurity risk management strategies
where eradication is not achievable
Community resilience improves with:
• Early detection and reporting of
unusual pests, disease symptoms or
weeds
Climate change factors that influence
the occurrence of this hazard:
• Higher average temperatures
• Fewer frosts
• Warmer water temperatures
• Increased temperature and/or
acidity of oceans
Page 11 of 38BLACK SYSTEM EVENT
POTENTIAL IMPACTS
South Australia Police (SAPOL) is the Physical injury, illness or death to
designated Hazard Leader and Control vulnerable people (e.g. aged, unwell,
Agency for a black system event (i.e. reliant on life-support devices,
large-scale power outage). heating or cooling) from loss of
The Department for Energy and Mining power and/or lack of back-up
(DEM) is the designated Control Agency arrangements, and threat to mental
for electricity shortages (e.g. normal day- health and wellbeing from any losses
to-day outages). or impacts experienced.
Disruption to economic activity, loss
of state revenue, and elevated risk of
financial hardship for business and
A Black System Event is defined as: industry.
“The absence of voltage on all or a Clashing power lines may cause fires
significant part of the transmission in native vegetation, forests, parks
system or within a region during a major and reserves.
supply disruption affecting a significant
number of customers.” Short-term interruption to community
functionality and morale (e.g.
sporting events, community
A black system event can include: gatherings, commercial services).
• An outage affecting the whole of the South
Australian National Energy Market region
• All local generation trips and every on-grid
electrical device shuts off (including traffic
and street lights buildings, industry and
residences). Only sites with uninterruptible
power supplies or back-up generators will
retain power to the extent those
For more information on how to minimise
redundancies permit
the impact to you and your family, visit:
• Requires a system restart of local
https://www.sa.gov.au/topics/energy-
generation
and-environment/energy-
• Requires incremental load restoration. supply/electricity-power-outages
Page 12 of 38HISTORICAL EVENTS South Australia is a region within the National
Energy Market (NEM), which is operated by the
September 2016: A major storm resulting in Australian Energy Market Operator (AEMO).
80,000 lightning strikes, large hailstones, heavy Interruptions can occur at:
rain, and destructive winds (including 190-260
• Interconnectors at Heywood and
km/h tornadoes), caused damage to 23
Murraylink connect South Australia to the
transmission towers in the Mid North region,
national grid.
affecting three of the four interconnectors
connecting Adelaide to the north and west of the • Power generation sites, which includes
state. This triggered a late-afternoon, state-wide various generation types:
power outage. Power was progressively
restored to 40% of customers within three hours,
and 80-90% with eight hours, and the last of the
remaining customers had power restored 14
days later. A Business SA survey estimated the
cost of the blackout to the state to be about
$367m, which would have been higher had it
occurred earlier in the day.
December 2016: Severe storms caused
damage to more than 350 distribution network
power lines, resulting in 155,000 properties
• Transmission network of 5,591 km, and
losing power for upwards of 12 hours in the
Adelaide Hills, Mid North, Flinders Ranges, and • Distribution network of 87,999 km
Murraylands. About 1,600 households in the (including 71,177 km overhead and 16,822
Adelaide Hills were without power for more than km underground).
80 hours.
February 2017: More than 90,000 households SA Police actively:
in Adelaide lost power for 45 minutes in the • Review risk based on ongoing changes to
middle of a major heatwave. This occurred when the electrical network in SA
AEMO did not receive sufficient bids from
generators to provide power to cope with an • Address issues identified by the Burns
evening peak demand. Approximately 100 MW inquiry
was shed to avoid potential damage to network • Reinforce the need for good business
equipment, and maintain the security of the continuity practices for all community and
power system. business members as well as government
Climate change factors that
influence the occurrence of this
hazard:
• Increased risk of extreme heat Community resilience improves with:
may overload components in the
electricity transmission and • Being self-sufficient for at least 72
distribution networks hours at home and at work
• More frequent heatwaves may • Having an emergency kit available
place greater demand on for you and your family
electricity generation
•Increased intensity of storm
events may damage components
KEY RISKS FOR
in the SOUTH and
transmission AUSTRALIA
distribution networks
Page 13 of 38BUSHFIRE
POTENTIAL IMPACTS
The South Australian Country Fire Service
(CFS) is the designated Hazard Leader Physical injury, illness or death from
and Control Agency for Bushfire. flames or smoke whilst attempting to
combat the fire, shelter-in-place,
perform a rescue, or attempt an
evacuation, and threat to mental
The Australasian Fire and Emergency Services health and wellbeing from any losses
Authorities Council (AFAC) defines bushfire as: or impacts experienced.
“An unplanned vegetation fire. A generic Damage to, or loss of, homes, public
term which includes grass fires, forest buildings, businesses, utilities
fires and scrub fires.” infrastructure (e.g. gas, water,
electricity, communications), crops,
livestock and interruption to local
In South Australia, a bushfire is: economy (e.g. businesses and
industries).
“the combination of environmental factors
which influence fire behaviour in a non- Destroy native vegetation, injure or
urban setting and includes factors such kill wildlife, contribute to loss of
as topography, aspect, vegetation habitat/species, and elevated soil
constituting fuel, fuel quantity and erosion risk.
arrangement, that in combination with Initial recovery and long-term
human settlement may cause harm to reconstruction to rebuild damaged
people or damage to property or the properties, infrastructure and local
environment.” economy, restoration of local
community services, and recovery of
local environment.
For information on how to minimise the
impact to you and your family or business,
visit:
https://www.sa.gov.au/topics/emergencies
-and-safety/types/bushfire
Page 14 of 38HISTORICAL EVENTS KEY RISKS FOR SOUTH AUSTRALIA
February 1980: Ash Wednesday I bushfire, The underpinning climatic features of South
burnt 4,770 hectares, resulting in 40 injuries, Australia are hot, dry summers with relatively
and destroyed 76 homes or other buildings. cool winters, with the majority of rainfall
Insured costs estimated at $132m 2011 value. occurring between May and August, which
influence the growth and curing of fire fuel and
February 1983: Ash Wednesday II bushfire,
fire behaviour.
burnt 200,000 hectares, resulting in 28 deaths,
1,500 injuries, and destroyed 283 houses. Key bushfire risk locations include:
Insured costs estimated at $308m 2011 value.
• Far North
January 2005: Wangary bushfire, burnt 78,000
hectares, resulting in 9 deaths, 115 injuries, and • Mid North
destroyed 93 homes and 316 farm sheds. • Lower Eyre Peninsula
Insured costs estimated at $41m 2011 value.
• Adelaide Hills
January 2014: Eden Valley bushfire, burnt
25,000 hectares, destroyed 4 homes and • Kangaroo Island
hundreds of kilometres of fencing, and killed • Murray Mallee
livestock and native animals.
• Upper and Lower South East
January 2014: Bangor bushfire, burnt 35,000
hectares, destroyed 5 homes, killed 700 sheep,
burnt for more than 30 days. CFS actively:
January 2015: Sampson Flat bushfire, burnt • Develops community information and
20,000 hectares, resulting in 134 injuries and resources for community education and
damaged 167 buildings. More than 3,500 engagement activities
firefighters responded (including support from • Provides fire danger ratings, fire bans,
New South Wales and Victoria). Damage was warnings and emergency alerts during the
estimated at $13m. bushfire season
November 2015: Pinery bushfire, burnt 86,000 • Maps of assets at risk from bushfire and
hectares, resulting in 2 deaths and 90 injuries, assigns treatments to mitigate the risk to
and damaged 470 buildings and 18,000 sheep these assets across the state through the
and 87 cattle were killed. Losses also included Bushfire Management Area Plan (BMAP)
unharvested production losses of 60,000 tonnes process
grain, 33,000 tonnes of hay, and 50,000 tonnes
of straw. More than 1,700 firefighters responded • Assesses new developments in bushfire
to the fire (including support from Victoria). prone areas to ensure they are built to
Insured costs estimated at $170m 2016 value. required standards based on the Bushfire
Attack Level (BAL) for each site.
December 2019/January 2020: The Cudlee
Creek and Kangaroo Island bushfires burnt over
265,000 ha, resulting in 3 fatalities and the loss
of 188 houses, 60,000 livestock and large
numbers of wildlife. Community resilience improves with:
• Being bushfire ready at home and at
work
• Having a 5 Minute Bushfire Plan
Climate change factors that influence
• Acting Now
the occurrence of this hazard:
• Higher average temperatures
• Decreased annual rainfall
• Increased time spent in drought
• Harsher fire weather climate
Page 15 of 38CYBER CRISIS (emerging)
POTENTIAL IMPACTS
Cyber threats are an emerging hazard
and the South Australian Government is Elevated distress, fear and/or anger
actively working with the Commonwealth within the local community, and
Government on prevention, preparation, society as a result or consequence of
response and recovery arrangements for an incident.
cyber crisis. Physical injury, illness or death from
The Department of the Premier and intentional disablement of critical
Cabinet (DPC) is the Control Agency for services.
Cyber Crisis.
Disruption to the continuity of
business service delivery and
A Cyber Crisis is defined as: inability to re-commence after theft,
loss or inappropriate disclosure of
“malicious cyber activity, with data critical to business operations.
consequences so severe the full Cyber
Crisis Incident Management Framework is Damage to or contamination of the
activated for a whole-of-government or environment where cyber activity
whole of state response.” aims to disrupt or disable resource
The Department of the Premier and Cabinet processing facilities or infrastructure
(DPC) leads a coordinated response to prepare (e.g. waste or water).
for, respond to, and recover from cyber security
incidents affecting government or the Disruption to or undermining the
community. delivery of critical services to the
community.
Engaging online is part of everyday life but the
online world can give criminals opportunities to Interruption to community
steal money, information or identities. To protect functionality and social
community’s loss of money, information or connectedness.
identities DPC recommends the community use
the Stay Smart Online service
(www.staysmartonline.gov.au). This is a free
service for Australian internet users that explains
recent online threats and how they can be
managed.
Page 16 of 38HISTORICAL EVENTS KEY RISKS FOR SOUTH AUSTRALIA
Globally and locally cybersecurity risks are South Australia maintains vigilance of cyber
growing in their prevalence as well as their security risks identified locally, nationally and
potential to disrupt or cause damage. Many internationally, potentially involving:
examples remain classified and cannot be
• Critical infrastructure and critical service
published broadly, however, recent public
delivery
examples in South Australia include:
2012: Adelaide-based defence electronics • Espionage and foreign interference
manufacturer was subject to a cyber-attack that • Sensitive and personal information.
allegedly led to the stealing of sensitive
engineering designs leading to a significant loss
of revenue and a drop in annual net-profit from DPC actively:
$45 million to $9 million. • Assists all South Australian government
agencies to manage cyber security in
2016: South Australian Government accordance with whole of government
departments and public schools were subjected policy, based on national and international
to sporadic denial of service cyber-attacks which best practice for information security risk
disabled systems over a period of two weeks. management.
The attacks were only stopped when SA Police
• Helps to improve the cyber resilience of the
were able to identify and arrest the attacker.
government services that the community
2017: Two South Australian consumers lost a rely on, including working with law
total of $900,000 in real estate themed enforcement agencies.
cybercrime scam undertaken by criminal • Promotes State and National awareness
organisations. programs that provide information on how
the community can prepare and recovery
2018: South Australian Government’s Cyber from incidents that impact them.
Crisis Watch Desk received 1287 cyber security
threat reports from government agencies over
the year. This was up from 1098 reports in 2017
and 743 reports in 2016.
Community resilience improves with:
• Understanding potential threats to
their information and data and
protecting themselves when they
are using online services at home
and at work.
Climate change factors that influence
the occurrence of this hazard:
• Based on current research, no link
has been established between
climate change and the occurrence
of cyber crisis, however,
communities already dealing with
escalating climate impacts may be
more vulnerable to opportunistic
cyber crime activities.
Page 17 of 38EARTHQUAKE
POTENTIAL IMPACTS
The Department of Planning, Transport Physical injury, illness or death from
and Infrastructure (DPTI) is the impacts of collapsing buildings,
designated Hazard Leader. exposure to hazardous materials,
South Australia Police (SAPOL) is the and threat to mental health and
designated Control Agency. wellbeing from any losses or impacts
experienced.
Disruption to economic activity,
An earthquake is defined as: damage to physical assets, and
impacts upon key infrastructure and
“the shaking of the surface of the earth services.
caused by underground movement, such
as along a fault line or by volcanic activity. Potential changes to landscape such
They range from slight tremors to major as land slips, ground deformation
shaking, lasting from a few seconds to a and liquefaction.
few minutes, and may be followed by Short-term clean up, and long-term
aftershocks.” recovery and reconstruction activity
to rebuild homes, restore community
infrastructure, services and local
Geoscience Australia monitors seismic data economy.
from more than 60 stations around Australia,
and reports on significant earthquakes to alert
the Australian Government, State and Territory
Governments and the public about earthquakes
in Australia and overseas.
An earthquake’s magnitude is a measure of the
energy released by the earthquake (traditionally
measured on the Richter scale). For information on how to minimise the
impact to you and your family or business
Earthquake effects, based on human visit:
observation, are rated using the Modified https://www.sa.gov.au/topics/emergencie
Mercalli (MM) Intensity Scale, which ranges from s-and-safety/types/earthquake
I (imperceptible) to XII (total destruction).
Geoscience Australia monitors
earthquake events at www.ga.gov.au
Page 18 of 38HISTORICAL EVENTS KEY RISKS FOR SOUTH AUSTRALIA
May 1897: Beachport, magnitude 6.5 with about Key earthquake risk locations include:
5 serious and 45 minor injuries reported.
• Far North
Damage concentrated in the Kingston,
Beachport and Robe areas. • Mid North
• Eyre Peninsula
September 1902: Warooka, magnitude 6.0 • Greater Adelaide metropolitan area
causing 2 deaths and 1 injury, and widespread • Lower South East
damage to the town’s stone buildings. Apart from the damage caused by the ground
shaking, earthquakes can also lead to:
March 1954: Darlington, magnitude 5.4 felt up
to 250 km away, causing 16 injuries and • Aftershocks (which follow the largest shock
damage to 3,000 buildings. of an earthquake sequence)
• Soil liquefaction (involves the loss of soil’s
March 1986: Marryat Creek, magnitude 6.0 just capacity to support the foundations of
south of the Northern Territory border resulted in buildings and other infrastructure)
a 14 km boomerang shaped surface rupture.
• Ground surface rupture and deformation
March 1997: Burra, magnitude 5.1 felt up to 170 • Landslides and rock falls
km away, however no major damage caused.
• Tsunamis
April 2014: Yunta, magnitude 4. 7, felt widely • Hazardous material release
across the state. • Fire (resulting from damage to gas or other
utility infrastructure or utility disruption)
June 2016: Kangaroo Island, magnitude 4.9 felt
up to 200 km away, with damaging vibrations • Flooding
limited to 20 km.
DPTI actively:
• Undertakes a leadership role in planning
emergency management activities
regarding earthquakes
• Seeks to mitigate risk from the
earthquake hazards by providing
technical advice on land use planning
and building codes
• Maintains the currency of community
resilience information on the earthquake
pages on sa.gov.au
Community resilience improves with:
• Preparing a business continuity
plan or household emergency
plan and emergency kit
Knowing how to:
• Drop to the ground close to you
where you can avoid injury from
Climate change factors that influence
falling debris
the occurrence of this hazard:
• Take Cover under something
• Based on current research, no link strong (e.g. sturdy table)
has been established between
climate change and the occurrence • Hold on to it until the shaking
of earthquakes. stops
Page 19 of 38ESCAPE OF HAZARDOUS MATERIALS
POTENTIAL IMPACTS
SafeWork SA is the designated Hazard Immediate and long-term physical
Leader. injury or illness, or death from
The South Australian Metropolitan Fire hazardous substances exposure,
Service (MFS) and Country Fire and threat to mental health and
wellbeing from any losses or impacts
Service (CFS), depending on the
location of the incident, are the experienced.
designated Control Agencies. Disrupt economic activity (e.g.
The Department of Planning, Transport business trading, traffic flow) and
and Infrastructure (DPTI) is the Control cause damage to and/or destroy
physical assets.
Agency for marine spill into coastal
waters. Contamination of soil and waterways.
The Environment Protection Agency
(EPA) is the lead agency responsible
for the management of site Short-term disruption to local
contamination resulting from a release community service delivery by
of hazardous materials. government bodies and utilities.
A hazardous material may be defined as:
“any substance, including dangerous
goods and dangerous substances, that
can escape controlled confinement and
produce a risk to persons, infrastructure,
the environment or the economy of the
State.”
For information on how to minimise the
impact to you and your family visit:
http://www.sa.gov.au/topics/emergencies-
and-safety/types/chemical-emergency
Page 20 of 38HISTORICAL EVENTS KEY RISKS FOR SOUTH AUSTRALIA
June 1999: After the oil tanker Chanda Hazardous materials are usually stored in
completed discharging its cargo of crude oil at association with significant fuel storage
Port Stanvac, a discharge hose, separated locations, service stations, water and waste
whilst being pressure tested, and released oil to water treatment plants, wineries, mine sites,
the sea. The 260 cubic metre spillage created a processing plants, and manufacturing sites.
slick about 5-10 km long and 500-800 metres
wide. The light oiling of beaches at Sellicks and Hazardous materials are transported daily by
Aldinga resulted in 400 cubic metres of oiled road and rail, often in populated urban areas, to
sand and seaweed being removed. ensure supplies of fuel and other materials used
by industry and the public.
July 2007: The spill of about 10,000 litres of
Some hazardous materials can cause
used motor oil from an industrial storage tank at
explosions or fires when not contained.
Largs Bay, spread onto adjoining land, covering
an area of 1,100 square metres. The clean-up
operation, costing about $200,000, involved the SafeWork SA actively:
use of 650 tonnes of sand. • Provides advice, industry information and
education resources to assist workplaces
October 2010: The 225 metre grain carrier
Grand Rodosi collided with, and sank, the 47 • Issues media releases and Incident Alerts
metre tuna vessel Apollo S, moored at the Port in response to significant events
Lincoln wharf. Containment booms were • Conducts proactive and reactive worksite
deployed for the oil and diesel spill, and a 300 Health and Safety Inspections to ensure
metre exclusion zone was established to isolate compliance and enforcement
the damaged wharf and sunken vessel. $28m
law suit ($20m loss of vessel, $4m replacement
for fishing, $4m economic loss and salvage).
October 2017: A transformer at a Thebarton
electrical substation, holding about 10,000 litres
of insulating oil, exploded. The resulting fire
generated substantial smoke pollution, and oil
caused a two kilometre slick in the River
Torrens. Community resilience improves with:
• Labelling chemicals correctly
• Preparing and practicing site
emergency response plans
Climate change factors that influence
the occurrence of this hazard:
• Higher average temperatures
• Increased risk of extreme heat
• Increased intensity of storm events
Page 21 of 38FLOOD
POTENTIAL IMPACTS
. The Department for Environment and
Physical injury, illness or death from
Water (DEW) is the designated Hazard fast-moving, deep or contaminated
Leader. water, and threat to mental health
The South Australian State Emergency and wellbeing from any losses or
Service (SES) is the designated Control impacts experienced. Secondary
Agency. health effects e.g. mosquito borne
disease.
Inundation and damage to, or loss of,
homes, vehicles, public buildings,
Flood is the most costly natural disaster in South businesses, physical infrastructure
Australia. The main types of flooding are: (e.g. roads, bridges), loss of access
to transportation routes, loss of crops
• Riverine flooding – occurs six or more and livestock, and interruption to
hours after heavy rainfall when excess water local economy (e.g. businesses and
flows over the banks of watercourses. industries).
• Flash flooding – occurs less than six hours Submerge land, injure or kill wildlife
after heavy rainfall. Causes are overbank by drowning or isolation from food
flow from quick response streams, run-off on sources, physical change to water
its way to a waterway or run-off exceeding courses, deposits of silt and refuse,
local drainage capacity (stormwater flooding reduced water quality and elevated
in urban catchments). risk of erosion.
• Infrastructure failure – caused by failure of Floodwaters may take time to recede
infrastructure that controls, conveys or stores and some communities (especially in
water e.g. pipes, pumps, dams or levees. remote locations) may be isolated for
some time.
• Coastal flooding – caused by elevated sea
levels as a result of tidal and/or wind-driven
events, including storm surges in lower
coastal waterways.
For more information on how to minimise
the impact to you and your family visit:
https://www.sa.gov.au/topics/emergencies
-and-safety/types/flood
Page 22 of 38HISTORICAL EVENTS State flood risk locations include:
• Gawler River
August 1956: The River Murray flow peaked at
• Light, Gilbert and Wakefield Rivers
341 GL/day. 1,500 people were evacuated, and
15,000 visitors per day were impacted at • Brownhill and Keswick Creeks
Mannum. Some inundation remained for six • Numbered (First to Fifth) Creeks
months. Estimated losses not available. • Port Adelaide area (sea and stormwater
flooding)
March 1983: Drought breaking thunderstorm • River Murray
rains caused flood and storm damage in • Upper and Lower Onkaparinga River
Adelaide suburbs and the Barossa Valley. • Dry Creek
Estimated losses of $56m 2013 value.
• River Torrens (events larger than 1% AEP)
December 1992: Widespread flooding between • Coastal areas of the state (expected to
Gawler, eastern Adelaide Hills and Goolwa. increase with mean sea level rise)
Numerous homes inundated, 1 reported death,
and damage to crops and market gardens. DEW actively:
Estimated losses of $2.4b 2013 value.
June 2003: The Patawalonga River broke its • Provides public flood study data on the
banks at Glenelg North, following heavy rain and Flood Awareness website
a weir malfunction, flooding about 160 homes. • Provides state-wide flood risk assessment
Estimated losses of $38m 2013 value. and oversight of the state-wide flood
warning infrastructure network
November 2005: Gawler River flooding caused
extensive damage to 1,500 ha of market • Develops flood management policies, such
gardens. Estimated losses of $61m 2013 value. as for dam safety and levee bank
management
December 2010: Two storm fronts delivered
widespread rainfall through Pt Pirie, Clare, • Provides technical advice and advocacy for
Snowtown, Renmark and the Mt Lofty Ranges, appropriate land use and building controls
flooding Riverton, Stockport, Tarlee and that consider the flood hazard
Saddleworth. Damage to 66 homes, roads, • Provides technical advice to SES during
infrastructure, crops and livestock, totalled more incidents and on flood response planning
than $11m. and flood impact warnings
May 2016: A storm surge 1.2m above predicted • Collaborates with the Bureau of
astronomic high tide impacted multiple coastal Meteorology and SES to monitor water
suburbs and a Port River king tide flooded 50ha forecasts and water levels and support
of Mutton Cove Conservation Park killing public warnings.
samphire vegetation habitats. Estimated losses
of $3.5m 2016 value.
September 2016: Two flood events, involving
multiple watercourses, inundated homes, Community resilience improves with:
required some Old Noarlunga residents to • Understanding flood risk of homes
evacuate, and damaged bridges, paths and and businesses
levee banks along the River Torrens. 250 crop
growers around the Light and Gawler Rivers • Having a Flood Emergency Plan
were also impacted. Estimated losses of $66m • Land use planning and building
2016 value
. requirements that considers flood
risk
• Keeping clear of flooded creeks,
Due to climate change, this hazard is
rivers and stormwater drains
expected to result in:
• Receiving and understanding flood
• Increased intensity of storm events
warnings
• Increased extreme rainfall intensity
• Higher extreme sea level events
KEY•RISKS FOR SOUTH AUSTRALIA
More coastal erosion and flooding
Page 23 of 38HEATWAVE
POTENTIAL IMPACTS
The South Australian State Emergency
Service (SES) is the designated Hazard Exacerbate existing health issues,
Leader and Control Agency. and elevate the risk of heat-related
illnesses (e.g. heat cramps, fainting,
heat exhaustion, heat stroke) or
A heatwave is defined as: death from dehydration or drowning.
“three or more days of high maximum and Damage to crops and community
minimum temperatures that are unusual infrastructure, loss of stock,
for that location and time.” increased power prices, reduced
labour output, reduced patronage at
In the last 200 years, severe and extreme businesses or community events.
heatwaves have taken more lives than any other
natural hazard in Australia. Trees at risk of dropping limbs,
wildlife seeking water or shelter in
Localised heatwave warnings are issued to the populated areas, blue-green algae
public across the Bureau of Meteorology (BoM) outbreaks in waterways, elevated
forecast areas using the forecast maximum and bushfire risk.
minimum temperatures over the coming three
days. Disruption to, or cancellation of,
community events, short-term
response and recovery activity to
Heatwaves are classified as: repair damaged power,
communications, water and transport
• Low-intensity heatwave: Expected to be infrastructure (e.g. overheated
experienced through summer, most people equipment components, excessive
can cope with this level of heat, but begin soil movement, and damage to
to see health effects if no precautions roads, railway lines and bridges).
taken.
• Severe heatwave: Less frequent, but
challenging for the vulnerable.
• Extreme heatwave: Rare, but can affect For more information on how to minimise
the health of anyone who does not take the impact to you and your family visit:
precautions to keep cool, even those who https://www.sa.gov.au/topics/emergencies
are healthy, and affect reliability of -and-safety/types/heatwave
infrastructure (e.g. power, transport).
Page 24 of 38HISTORICAL EVENTS KEY RISKS FOR SOUTH AUSTRALIA
March 2008: During a record-breaking, fifteen- Heatwaves cause more deaths than any other
day heatwave Adelaide experienced the longest natural hazard.
period of maximum daily temperatures of 35OC
Whilst any individual, regardless of age, sex or
and above on record for any capital city. It
health status, can develop heat stress if
resulted in at least $150m in damage and
engaged in intense physical activity and/or
reduced income for South Australia.
exposed to environmental heat, additional
factors can increase the risk of extreme heat on
January/February 2009: During a thirteen-day
a person, such as:
heatwave from 26 January to 7 February 2009
(inclusive of a 33OC day) Adelaide experienced • Older people (over 65 years)
eight days above 40OC, with a highest
temperature of 45.7OC. More than 34 excess • Acute, chronic and severe illness
heat-related deaths were reported. • Inability to keep cool
January 2014: Adelaide recorded five • Disability
consecutive days above 42OC between the 13 • Environmental and social factors
and 17 January 2014. There were 294 heat-
related emergency presentations at hospitals,
and 38 excess heat-related deaths reported. SES actively:
• Liaises with Bureau of Meteorology on
December 2015: Adelaide recorded four forecasts for heatwave
consecutive days above 40OC for the first time in
December, between the 16 and 19, with more • Engages with the community and provides
than 85 people admitted to hospitals with heat- education for getting ready
related illnesses. • Provides early warnings to the community
December 2019: South Australia as a whole • Responds to requests for assistance from
had its hottest day on record on 19 December, the community
when it reached 47.1OC, exceeding the previous
record of 45.7OC on 24 January 2019. Fifteen
locations in South Australia recorded new
highest temperatures including Nullarbor 49.9OC
and Ceduna 48.9OC. Community resilience improves with:
• Keeping yourself cool
• Staying hydrated
• Checking up on vulnerable people
you know to see if they are okay
Due to climate change, this hazard is
expected to result in:
• Higher average temperatures
• Increased risk of extreme heat
• More frequent heatwaves
Page 25 of 38HUMAN DISEASE
POTENTIAL IMPACTS
The Department for Health and Wellbeing
(DHW) is the designated Hazard Leader Serious illness or death from a
and Control Agency. disease, and threat to mental health
and wellbeing of communities from
any losses or impacts experienced,
especially affecting priority
Human disease is defined as: populations such as indigenous, rural
and regional, socio-economically
“any impairment of normal physiological disadvantaged, and culturally and
function affecting all or part of an linguistically diverse, being most at
organism, especially a specific risk.
pathological change caused by infection,
stress, etc., producing characteristic Elevated absenteeism from
symptoms, illness or sickness in general workplaces, closing of businesses,
detected in humans. reduction in economic productivity
and income, and increased demand
on health services.
An epidemic is defined as: Environmental damage due to
“An outbreak or unusually high inappropriate disposal of biological
occurrence of a disease or illness in a waste.
population or area that has the potential to Protracted response and recovery
cause harm to the people, environment or activity, potential for increased social
economy to an extent which could isolation of affected communities due
overwhelm the capacity of existing health to quarantine controls (e.g. travel
response resources.” restrictions, closing of schools), and
breakdown of community support
networks.
A pandemic is defined as:
“an epidemic on a global scale.”
For more information on how to minimise
the impact to you and your family visit:
https://www.sa.gov.au/topics/emergencies
-and-safety/types/human-disease
Page 26 of 38HISTORICAL EVENTS KEY RISKS FOR SOUTH AUSTRALIA
Haemolytic Uraemic Syndrome 1995: There Infectious diseases caused by organisms such
were 23 confirmed cases of food poisoning and as bacteria, fungi, parasites or viruses. These
one death after adults and children consumed can be spread to humans by:
metwurst contaminated with Escherichia coli
• Other humans (e.g. coughing, sneezing,
(E.coli) bacteria. Many continue to suffer severe
blood and body fluids)
ongoing health problems, including some who
have had organ transplants. • The environment, including food and water
(e.g. food poisoning)
H1N1 Influence 2009: South Australia recorded
8,944 confirmed cases of Human Swine Flu and • Animals and insects (e.g. mosquito bites)
28 deaths, with two high school closures. • Bioterrorism event (e.g. deliberate act to
Thermal imaging equipment and nurses were cause an infectious disease outbreak
deployed at international airports, and airlines utilising any of the above mechanisms)
were required to report passengers with
influenza symptoms. SA Health actively:
Food and Water Contamination 2016: SA • Undertakes human disease surveillance
Health was involved in 19 food-borne disease and monitoring of potential risks and action
outbreak investigations and took 800 food to respond to cases of infectious diseases
samples as part of investigations. SA Health in the community
also provided advice on the management of 56
incidents where the safety of drinking water was • Provides State funded vaccination
potentially compromised. programs, including influenza
Seasonal Influenza 2019: Between 1 January • Provides environmental health monitoring
and 11 May 2019, SA Health has received and coordinated action to rapidly identify
12,339 notifications of influenza (compared to and respond to incidents
1,348 cases for the same period the previous
year) and recorded 17 deaths, including children
as well as adults.
Community resilience improves with:
• Getting vaccinated to prevent
infectious diseases (e.g. annual flu
shot), or reduce your risk of
becoming ill whilst travelling
overseas (especially in high risk
Climate change factors that countries).
influence the occurrence of this • Washing your hands with soap
hazard: and water before eating or
• Heatwaves, drought and bushfires preparing food, after going to the
increases the threat to physical toilet, and after touching animals
and mental health and wellbeing or their environment.
for all communities, especially • Staying home from work, school
priority populations. or public places if you are ill to
• Increased average temperatures stop the spread of disease.
and/or extreme rainfall events can • Covering up, applying insect
cause diseases to emerge, or repellents, or avoiding exposure
increase in prevalence, that then outdoors when mosquitoes are
spread between animals and most active.
people (e.g. insect bites), as well
as vector-borne diseases (e.g.
bacteria, fungi, and viruses).
• Drought can reduce access to
supplies of safe drinking water.
Page 27 of 38You can also read


