Annual Accomplishments - Office of Weather and Air ...
←
→
Page content transcription
If your browser does not render page correctly, please read the page content below
Annual
Accomplishments
A Weather-Ready Nation informed
by world-class weather research.

                      1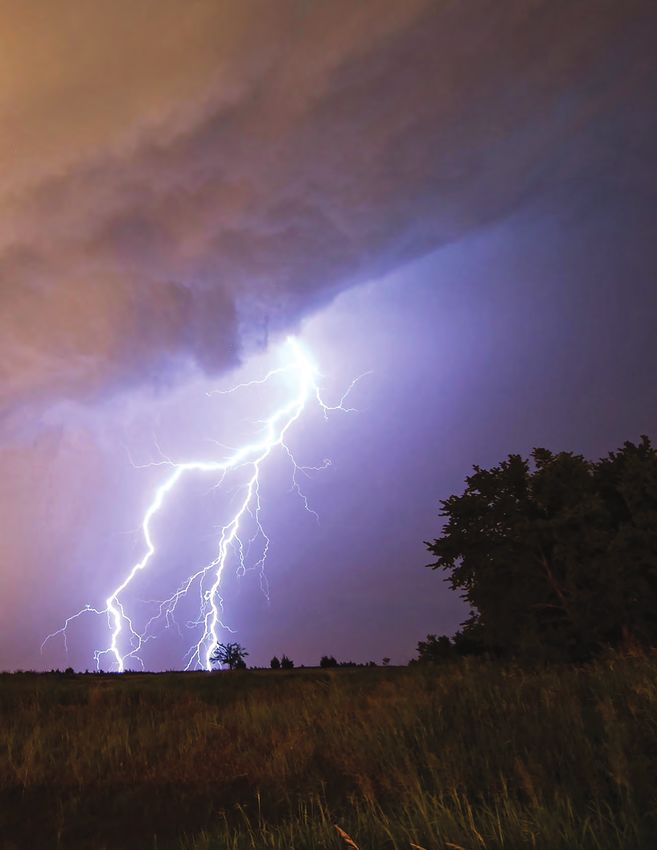
Office of Weather and Air Quality Annual Accomplishments FY2018 | April 2019
Director: John Cortinas, Ph.D.
Deputy Director: Kandis Boyd, Ph.D.
From back row, left: Michele Olson*, Chantel Bivins*, Tamara Battle*, Bonnie Brown*P, Dorothy Fryar,
Gina Eosco*P, Yolanda Aguilar*, Segayle Thompson*P, Jessie CarmanP, Sarah Perfater*
From front row, left: Kandis BoydP, Chandra KondraguntaP, John CortinasP, Mark VincentP,
John Opatz*, Jordan Dale*, DaNa CarlisP, Bradford Johnson*P
Not pictured: Richard Fulton, Johnna Infanti*P, and Matthew Mahalik*
Affiliates are denoted with (*) and doctorates are denoted with (P). Photo Credit: Laura Wilson, NOAA
(October 2018).
Suggested citation: NOAA Office of Weather and Air Quality. April 2019. Office of Weather and Air
Quality Annual Accomplishments. https://owaq.noaa.gov
Notes: (1) Unless otherwise noted, all images are courtesy of NOAA or researchers funded by NOAA.
(2) Every effort was made to compile accurate data and information; OWAQ regrets any errors or
omissions. (3) Narratives about current or intended transitions into operations are denoted with .
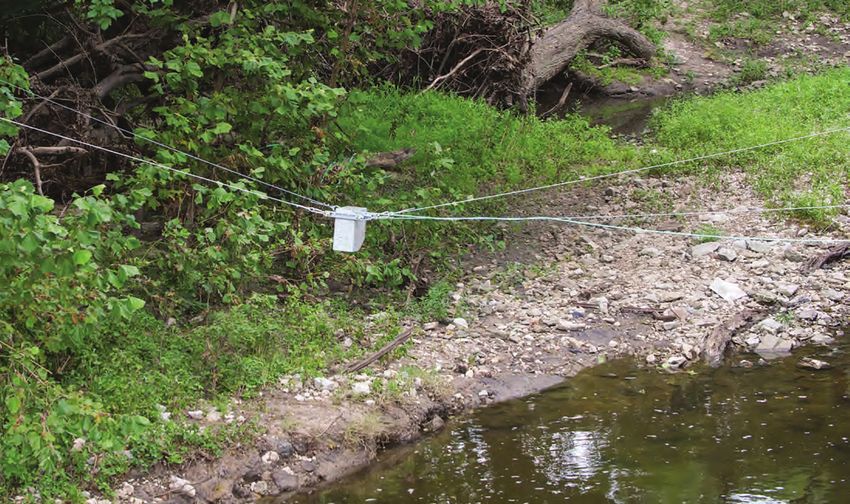
ON THE FRONT AND BACK COVERS: Lightning Strike. Image credit: Mary Murnan for NOAA’s
National Severe Storms Laboratory (June 2018).
2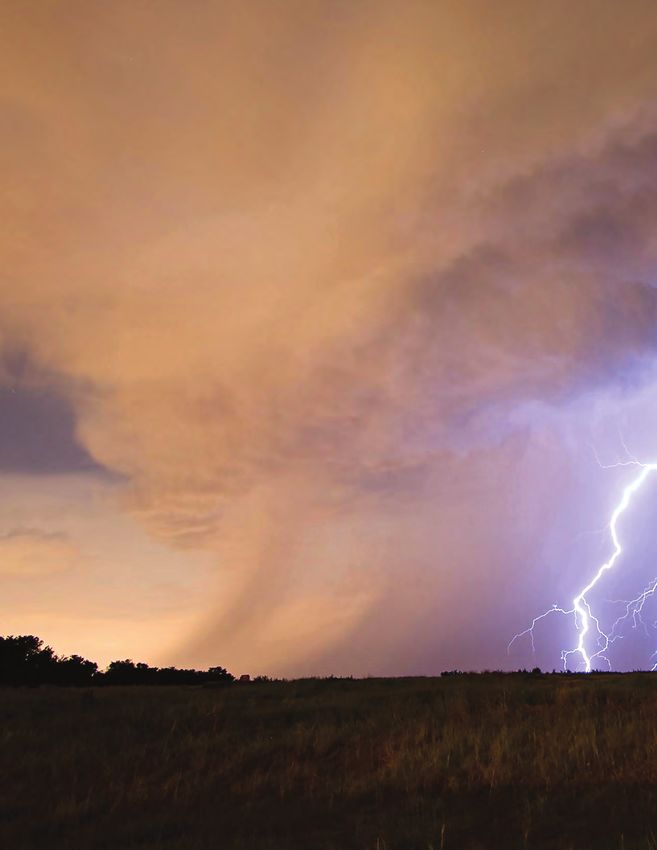
Annual
Accomplishments
FY2018 >>

Letter from the Director . . . . . . . . . . . . . . . . . . . . . . . . . . . . . . . . . . . . . . . . . . . .  4
Executive Summary . . . . . . . . . . . . . . . . . . . . . . . . . . . . . . . . . . . . . . . . . . . . . . . . . .  5
Annual Accomplishments
Research Focus Area 1 – Tropical Cyclones . . . . . . . . . . . . . . . . . . . . . . . . . . . . . . . . . . . . . . .  8

Research Focus Area 2 – Hazardous Weather . . . . . . . . . . . . . . . . . . . . . . . . . . . . . . . . . . . . .  9

Research Focus Area 3 – Flooding . . . . . . . . . . . . . . . . . . . . . . . . . . . . . . . . . . . . . . . . . . . . . . . 11

Research Focus Area 4 – Air Quality  . . . . . . . . . . . . . . . . . . . . . . . . . . . . . . . . . . . . . . . . . . . . . 13

Research Focus Area 5 – Interdisciplinary Research  . . . . . . . . . . . . . . . . . . . . . . . . . . . . . . . 16

The Way Forward . . . . . . . . . . . . . . . . . . . . . . . . . . . . . . . . . . . . . . . . . . . . . . . . . . . . . 18
Appendix A – Projects  . . . . . . . . . . . . . . . . . . . . . . . . . . . . . . . . . . . . . . . . . . . . . 20
Appendix B – Outreach . . . . . . . . . . . . . . . . . . . . . . . . . . . . . . . . . . . . . . . . . . . . 22

                                                                3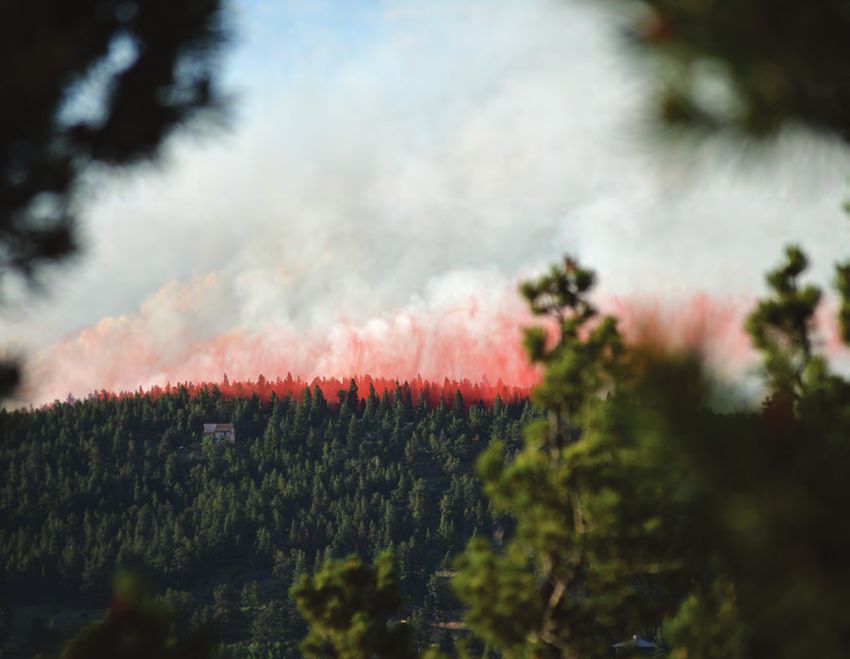
LETTER FROM THE DIRECTOR

                      John Cortinas, Ph.D.
                      Director, Office of Weather and Air Quality
                      NOAA’s Office of Oceanic and Atmospheric Research
                      April 2019

The Office of Weather and Air Quality was directed to
fund and transition world-class research. We did.
NOAA’s Office of Weather and Air Quality (OWAQ) is entrusted with finding, funding, and
fostering collaborative weather and air quality research. Together, the OWAQ team and partners
find answers to our Nation’s most pressing questions about tropical cyclones, hazardous
weather, flooding, air quality, and human responses to these risks, among many other research
areas.

OWAQ has undergone transformative growth this year to align with NOAA priorities, execute a
larger budget, manage award processes efficiently, and work collaboratively across the weather
enterprise to advance weather and air quality research and transitions. As always, extraordinary
teamwork and dedication made our accomplishments possible. In particular, I acknowledge our
team and partners for:

      • Increasing the number of funding awards from 62 to 84, a 27% increase over FY2017.

      • Increasing Federal employees from 5 to 8, a 60% increase over FY2017.

      • Increasing the contract staff from 5 to 11, a 120% increase over FY2017.

      • Shepherding a budget increase from $24.1 million to $37.1 million,
        a 54% increase over FY2017.

      • Serving as NOAA’s Office of Oceanic and Atmospheric Research lead for executing
        congressional directives.

As you will read in the pages that follow, our team and partners also addressed the difficult
research questions whose answers help us understand and predict our weather. I acknowledge
them for scientific accomplishments that ranged from using drones to improve National Weather
Service (NWS) models for storm intensification1 to using satellite data to improve tropical cyclone
prediction.2

The Office of Weather and Air Quality was directed to fund and transition world-class research:
We did that, and, with our team and partners, will do still more.

                     Sincerely,

                                               4
ANNUAL ACCOMPLISHMENTS

Executive Summary
In 2018, fourteen weather and climate disaster events across            OWAQ also employed SBES research-informed practices for
the United States (U.S.) caused losses in excess of $1 billion          internal and external communication via the office’s website,
each. That mix of drought, severe storms, tropical cyclones,            social media, and presentations at major conferences.
wildfire, and winter storm events resulted in the deaths of 247
people and had significant economic effects.3 National Oceanic          Goal 2. OWAQ and partners advanced models and forecast
and Atmospheric Administration’s (NOAA) National Weather                tools to produce the best weather forecasts and warnings to
Service (NWS) analysts report that weather alone can cause              build a Weather-Ready Nation by advancing the development
the gross domestic product in the U.S. to vary by as much as            and implementation of NOAA’s Unified Forecast System;
$1.3 trillion annually.4 By fostering weather research related to       beginning to advance Subseasonal-to-Seasonal forecasts; and
high-impact events, and by focusing on research that enables            improving severe weather prediction capability.
effective communication of the risks, the Office of Weather and
Air Quality (OWAQ) is supporting the world-class weather and            In particular, OWAQ and partners coordinated expertise across
air quality research that makes it possible to save lives, reduce       the weather community, including academia, the private sector,
property damage, and enhance the national economy.                      and government officials, while also serving NOAA as an expert
                                                                        on the Weather Research and Forecasting Innovation Act of
VISION: A Weather-Ready Nation informed by world-                       2017 as the Office of Oceanic and Atmospheric Research’s
class weather research.                                                 (OAR) Weather Portfolio Steward. OWAQ and partners also
                                                                        advanced models and forecast tools by funding researchers
                                                                        focusing on increased resolution, data assimilation, physics
MISSION: Finding, funding, and fostering collaborative
                                                                        upgrades, and other related priorities. Among the models
weather and air quality research to discover, develop,
and transition products, tools, and services for timely
and accurate weather and air quality forecasts.

OWAQ discovers, develops, and transitions products, tools,
and services for world-class weather and air quality research
by finding, funding, and fostering collaborative research within        13             Percentage of projects improving
                                                                                       operational models

                                                                        23
NOAA’s research laboratories and across the weather enterprise
(i.e., NOAA, other Federal agencies and entities, state and                            Number of peer-reviewed
local governments, academia and other not-for-profits, and the
private sector). Accomplishments in fiscal year 2018 (FY2018)
                                                                                       publications

                                                                        53
supported each of the office’s four goals.
                                                                                       Percentage of projects increasing
Goal 1. OWAQ improved effective communication of weather                               readiness level
information to strengthen decision-making and forecasting

                                                                        25
abilities through a mix of assessments and studies by enhancing
the integration of social, behavioral, and economic science                            Percentage of transition projects
(SBES) into weather research and development5 and integrating                          with signed transition plans
SBES research findings into weather enterprise applications.

In particular, OWAQ supported the National Academies of
Sciences, Engineering, and Medicine study on integrating
SBES into the weather enterprise, then began addressing the
                                                                         5             Research and development results
                                                                                       transferred into operations

                                                                        19
identified challenges and proposed solutions. OWAQ also
expanded funding of research with a social, behavioral, and/or
                                                                                       Percentage of projects that include
economic component in FY2018 by incorporating social science                           social, behavioral, and/or economic
into OWAQ’s yearly funding calls; funding social science through                       science research
National Science Foundation (NSF) supplementals called
the Social Science Transitions from Research to Operations              FIGURE 1. The Office of Weather and Air Quality by the Numbers.
Program: A NSF and NOAA Grant; and developing a special                 Image credit: Office of Weather and Air Quality Annual Operating Plan
economics research effort.                                              FY2018.

                                                                    5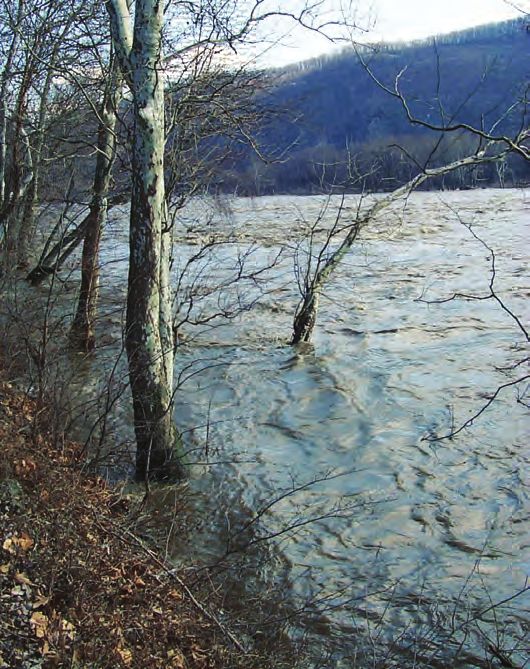
EXECUTIVE SUMMARY

                     30                                                            30
NUMBER OF PROJECTS

                                                   Lifecycle Phase:
                                                       Operations                                                               Starting Lifecycle Phase:
                                                       Demonstration                                                               Demonstration
                     20                                                            20
                                                       Development                                                                 Development
                                                                                                                                   Research

                     10                                                            10

                     0                                                             0
                          4                6                 8                          Research         Development       Demonstration           Operations
                                    READINESS LEVEL                                                           LIFECYCLE PHASE

   FIGURE 2. Distribution of Projects by Readiness Level in FY2018                 FIGURE 3. Shifts in Readiness Level Based on Starting Lifecycle Phase
   (Active Projects; Levels Range from Basic Research (1) to Deployment (9).       for FY2018 (Active Projects).

   and forecast tools advanced, OWAQ supported funding                             increasing contract staff by 55% in FY2018 (5 to 11 contractors)
   for the Verification of the Origins of Rotation in Tornadoes                    while considering gender, race/ethnicity, generational, and
   Experiment - Southeast (VORTEX-SE) and expanded the OAR                         educational balances (see also Figures 5 and 6).
   modeling inventory.
                                                                                   OWAQ and research partners supported the Department of
   Goal 3. OWAQ and partners effectively and efficiently                           Commerce’s commitment to increasing the participation of
   managed the advancement and transition of weather research                      minority-serving institutions (i.e., Historically Black Colleges
   into societal applications by advancing the development                         and Universities, Hispanic-serving institutions, Tribal colleges
   and transition of weather research to operations; ensuring                      and universities, and Alaskan Native and Native Hawaiian
   operations and management processes were well-                                  institutions), and institutions that work in under-served
   documented, maintained, and refined; and responding in                          communities. Moreover, some grantees reported on a focus on
   a timely and effective manner to NOAA’s Congressional                           diversity and inclusion, especially for professional development
   mandates.                                                                       and training.

   OWAQ and partners employed research-based practices for                         Transitioning World-Class Research into Operations.
   transitioning research to operations, such as thinking ahead                    To meet these goals while preparing for OWAQ’s new
   to the transition with the initial proposal and progress reports;               responsibilities, new structures were established: the team
   partnering researchers and operators; and following NOAA’s                      grew; process efficiencies were introduced; redundancies
   process for transition plans.                                                   were eliminated; and new partnerships were developed.
                                                                                   Supported by these new structures, OWAQ established
   OWAQ advanced and transitioned weather research across                          working groups; prepared congressional reports; built the OAR
   the portfolio. Among other activities, OWAQ transitioned to                     modeling inventory; hosted multiple workshops; and issued
   algorithms, wrote transition plans, and moved two projects                      and managed Federal funding opportunities (see Figure 4).
   into operations (see also Figures 2 and 3).6
                                                                                   The accomplishments above and in the pages that follow are
   Goal 4. OWAQ developed and supported a diverse and                              the product of OWAQ’s partnerships and OWAQ’s focus on the
   inclusive work environment that promoted equal access to                        research and development activities that led to demonstrations
   the opportunities OWAQ offers by recruiting and maintaining                     in NOAA’s testbeds. In these testbeds, project outcomes
   a diverse and highly qualified workforce; promoting and                         such as new observing systems and data products, improved
   enhancing the inclusion of OWAQ’s diverse workforce; and                        data analysis techniques, and better statistical or dynamic
   integrating and promoting diversity and inclusion as a core                     models and forecast techniques are presented to operational
   consideration throughout OWAQ’s funding mechanisms.                             forecasters and evaluated for potential future implementation
                                                                                   in the National Weather Service (NWS) forecast offices at
   In particular, OWAQ developed and supported a diverse and                       the local, regional, and/or national center levels. These
   inclusive work environment by increasing the number of                          improvements create a Weather-Ready Nation informed by
   Federal employees by 21% in FY2018 (5 to 8 employees) and                       world-class weather research.

                                                                               6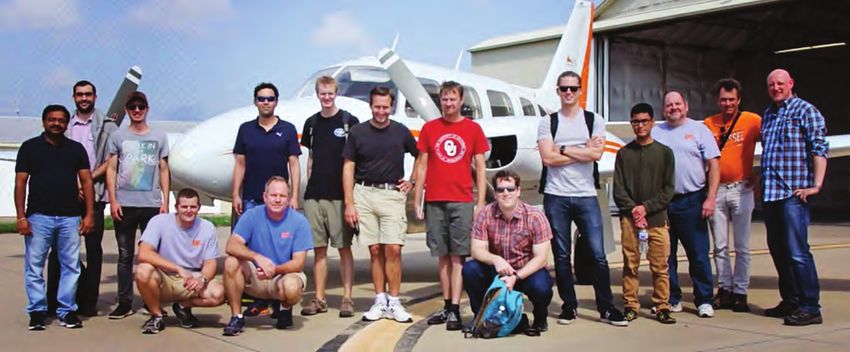
1
WASHINGTON
$100,000
1
6
2 NEW YORK
WISCONSIN $377,200
$1,168,800 MICHIGAN
1
$409,100
1
1 IOWA
1 11 MARYLAND $4,849,100
NEBRASKA $251,400
NEVADA $128,900 2 DISTRICT OF COLUMBIA
$453,500 39 OHIO
5 $737,600
$510,000
4 1 VIRGINIA
COLORADO
CALIFORNIA $270,000
$19,750,600
$1,139,200 MISSOURI
$689,500
1 TENNESSEE
2 31 $365,600
ARIZONA OKLAHOMA 3
$893,800 $14,987,900
4 ALABAMA
$388,600
5
MISSISSIPPI
TEXAS $1,202,500
$1,293,500
11
FLORIDA
FIGURE 4. Locations and Amounts by State in FY2018 $2,001,500
(Active Projects; Total Estimated Allocations, Rounded).
ZA/ZP Bands Pay Plans Gender Race/Ethnicity
SES/ST/SL ZA 2
ZA Black Asian
13% 12%
12% 37% 13%
Fe-
ES male
ZA 5 ZP 13% 38%
38% ZA 4 75% Hispanic
37% Male White 13%
62% 37%
Retirement Eligibility Supervisory Generations Education
Masters
Doctorate Degree
Eligible in Baby
75% 12%
> 5 Years Boomers
38% 75% High
School
Supervisory 13%
Eligible 12%
Next 5 Years Generation X
37% Eligible
FY18 Non-Supervisory 25%
25% 88%
FIGURE 5. OWAQ Workforce Profiles FIGURE 6. OWAQ Diversity Profiles
(Federal employees at the end of FY2018). (Federal employees at the end of FY2018).
7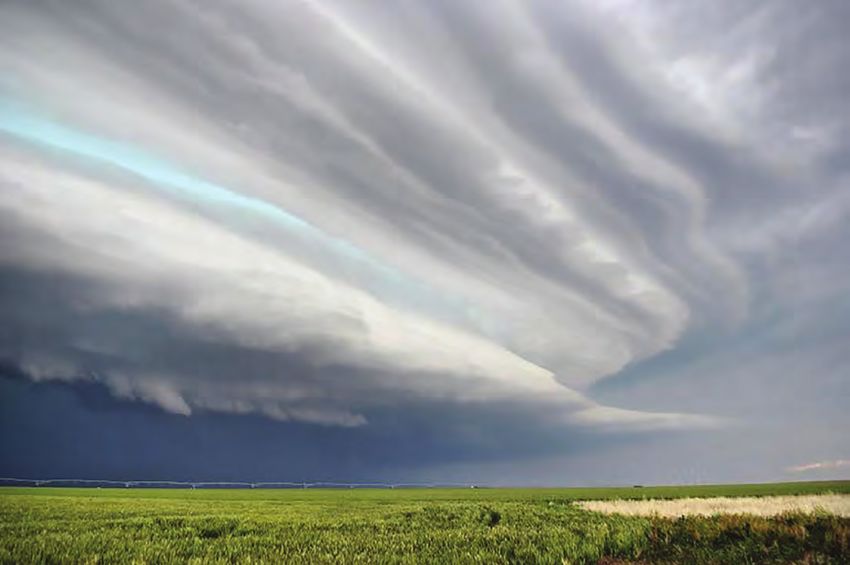
ANNUAL ACCOMPLISHMENTS

Tropical Cyclones
(includes Hurricanes, Typhoons, and Cyclones)
                                                                                  Tropical cyclones develop when a tropical storm intensifies and
                                                                                  winds reach 74 miles per hour (119 kilometers per hour) and
                                                                                  are known variously as hurricanes (Atlantic and Eastern Pacific
                                                                                  Oceans), typhoons (Western Pacific), and cyclones (Indian Ocean).7
                                                                                  The impacts of tropical storms can be devastating; storm surge
                                                                                  can cause deaths and devastating property loss ranging from
                                                                                  damaged roads and bridges to destroyed homes and businesses.

                                                                                  In 2018, there were fifteen named storms in the North Atlantic,
                                                                                  including eight hurricanes and two major hurricanes.8 The two
                                                                                  major hurricanes, Florence and Michael, caused approximately
                                                                                  $49 billion in combined damages,9 including the damage to
                                                                                  communication, transportation, and utility infrastructures as a
                                                                                  result of heavy rains, strong winds, and waves.

                                                                                  Consistent with OWAQ’s goals and objectives, research priorities
                                                                                  for tropical cyclones include:10

                                                                                     (1) Improve operational analysis of the surface wind field.
                                                                                     (2) Identify new applications of ensemble modeling systems
                                                                                         for track, intensity, and structure forecasting.
                                                                                     (3) Improve tropical cyclone intensity guidance.
                                                                                     (4) Improve guidance for tropical cyclone genesis.
                                                                                     (5) Advance coastal inundation modeling and/or applications,
                                                                                         visualization, and/or dissemination technology.
                                                                                     (6) Develop probabilistic wave height forecasts.
                                                                                     (7) Apply and integrate relevant social and behavioral science
                                                                                         methodologies to improve forecasters’ use of convection-
FIGURE 7. Forecasts for Hurricanes (top) Edouard (0000 UTC 12                            allowing/resolving data, techniques, and guidance, as well
Sep 2014) and (bottom) Linda (0000 UTC 8 Sep 2015) with (right)                          as end-users’ ability to receive, assess, understand, and
Corresponding Best Tracks. To improve the aesthetics and readability of
the figures, only the 34- and 64-kt wind radii are shown, the latter being
                                                                                         respond to forecasts and warnings.
shown as inner concentric rings when the intensity exceeds 64 kt. Note
that intensity biases affect the forecast of wind radii with under- (over-)       In FY2018, approximately 1 out of every 10 projects funded by
forecasts of intensity corresponding to slightly smaller (larger) 34-kt           OWAQ contributed to tropical cyclone research.
wind radii. Image credit: Figure 8 of Knaff, J.A., C.R. Sampson, and G.
Chirokova. 2017. “A Global Statistical–Dynamical Tropical Cyclone Wind               Improving Tropical Cyclone Intensity Forecast Models |
Radii Forecast Scheme.” Weather Forecasting, 32, 629–644, https://                Joint Hurricane Testbed
doi.org/10.1175/WAF-D-16-0168.1. © American Meteorological Society.
Used with permission.                                                             Galina Chirokova & John Kaplan | Colorado State University-Cooperative Institute for
                                                                                  Research in the Atmosphere; NOAA’s Atlantic Oceanographic and Meteorological
                                                                                  Laboratory [see Figure 7]

                                                                                  This project proposed to complete a number of upgrades to the
                                                                                  operational statistical hurricane intensity models, which have
                                                                                  provided operational intensity guidance for the last five years
                                                                                  through the addition of a tropical cyclone wind structure based
                                                                                  predictor or combination of predictors to the Statistical Hurricane
                                                                                  Intensity Prediction Scheme, the Logistic Growth Equation Model,
                                                                                  the multi-lead time probabilistic Rapid Intensification Index, and
                                                                                  the global Rapid Intensification Index.

                                                                                     Accounting for Dropsonde Drift to Improve Tropical Cyclone
                                                                                  Forecasts | Joint Technology Transfer Initiative
                                                                                  Jason Sippel | NOAA’s Atlantic Oceanographic and Meteorological Laboratory
                                                                                  [see Figure 8]

                                                                                  A fundamental problem for hurricane assimilation is that
                                                                                  dropsondes capture the release point instead of the observation
                                                                                  point. This leads to small errors in the environment around
FIGURE 8. Change in Track Error (expressed as percent improvement)
                                                                                  a storm, which can result in unacceptable errors at the inner
as a Result of Assimilating Drift-Estimated Dropsonde Data. Image credit:
Jason Sippel.                                                                     core of a storm. Researchers conducted a large retrospective
                                                                                  analysis of over 300 cases with data that has been processed by

                                                                              8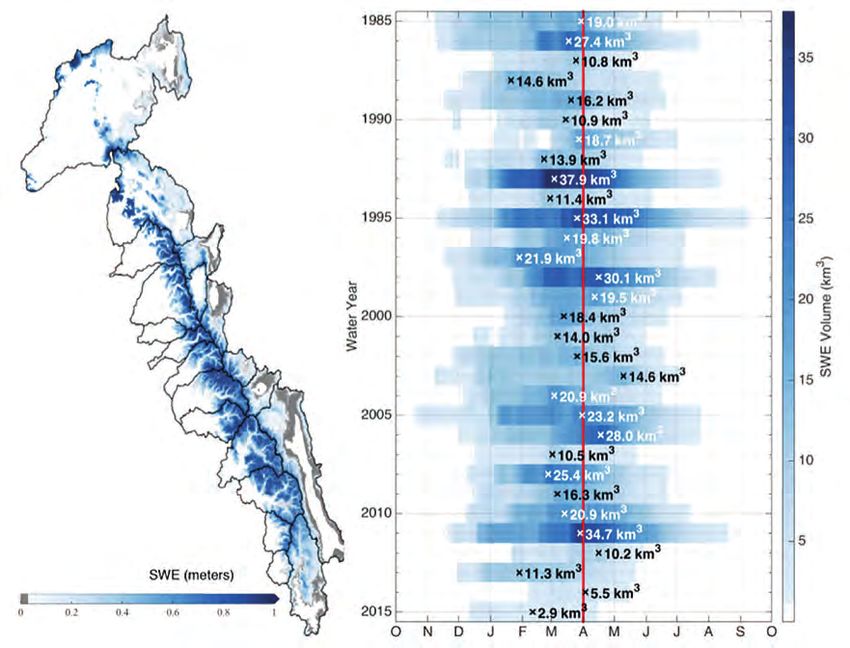
Indicates narratives about current or intended transitions into operations.

a newly developed algorithm to account for dropsonde drift.
Consideration of dropsonde drift and use of all dropsonde data
will have a significant positive benefit on forecasts through
operational use in the National Centers for Environmental
Prediction Global Forecast System and the Hurricane Weather
Research and Forecasting regional model.

   Improving the Accuracy of Hurricane Intensity Forecasts |
Joint Hurricane Testbed
Anthony Wimmers | University of Wisconsin-Madison Cooperative Institute for
Meteorological Satellite Studies

To improve the accuracy of hurricane intensity forecasts,
researchers worked to develop a new computer model based
on microwave satellite imagery that would provide diagnostic
and forecast guidance prior to and during hurricane eyewall
replacement cycles. Results could include integration of the
model into SHIPS and possible transition to NOAA’s National
Hurricane Center (NHC). Ongoing work was funded by a Joint
Polar Satellite System Risk Reduction grant to integrate the
model into a real-time data processing environment for the NHC,
the Central Pacific Hurricane Center, and the Joint Typhoon                       FIGURE 9. Eye of Hurricane Edouard Taken from NOAA’s Gulfstream
Warning Center.                                                                   IV Aircraft. Image credit: Ching-Hwang Liu for NOAA’s Atlantic
                                                                                  Oceanographic and Meteorological Laboratory (September 2002).
   Using Satellite Data to Improve Tropical Cyclone
Prediction | Joint Hurricane Testbed
Chris Rozoff | University of Wisconsin-Madison Cooperative Institute for          Consistent with OWAQ’s goals and objectives, research priorities
Meteorological Satellite Studies
                                                                                  for hazardous weather include:14
To improve tropical cyclone prediction, researchers sought to
provide a computationally efficient forecasting tool to advance                     (1) Identify and validate concepts and techniques to improve
the current state-of-the-art hurricane rapid intensification                            NOAA’s convection-allowing/resolving ensemble forecast
forecast technique by adding microwave satellite imagery data.                          system performance.
Researchers created a large climatological passive microwave                        (2) Identify and validate innovative post-processing and
dataset containing virtually all satellite passes over Atlantic                         verification techniques for NOAA’s deterministic models
and Eastern Pacific Tropical Cyclones at the 18.7, 36.5, and 89                         and ensembles across spatial and temporal scales to
GHz channels. Using these data improved tropical cyclone                                create skillful and reliable probabilistic thunderstorm and
intensity predictions, especially Rapid Intensification, which will                     severe hazard threat guidance.
be valuable as part of an improved suite of statistical-dynamical                   (3) Identify and validate new or improved methods, models,
forecast guidance available at the National Hurricane Center.                           or decision-support tools to improve probabilistic winter
                                                                                        precipitation forecasts for snowfall amounts and/or ice
                                                                                        accumulation.

Hazardous
                                                                                    (4) Identify and validate new or improved ways of enhancing
                                                                                        forecaster use of probabilistic precipitation or ice

Weather
                                                                                        accumulation short-range and medium-range forecasts.
                                                                                    (5) Identify and validate new or improved methods,
                                                                                        observations, decision-support tools, and models to
(includes Thunderstorms, Severe Wind and Hail Storms,                                   improve understanding or evaluate forecast performance
Tornadoes, Heavy Rainfall, Winter Weather, and Flooding)                                of extreme precipitation events.
                                                                                    (6) Improve numerical weather prediction modeling through
The term “hazardous weather” is usually applied to local,                               data assimilation, post-processing, and verification
intense, often-damaging storms such as thunderstorms, severe                            capabilities.
wind and hail storms, and tornadoes, but it also can be used to                     (7) Improve extreme precipitation forecasting.
describe heavy rainfall, winter weather such as heavy snow and                      (8) Apply and integrate relevant social and behavioral science
ice, and flooding such as coastal, inland, and flash flooding.11                        methodologies to improve forecasters’ use of convection-
Annually, the U.S. is struck by 100,000 thunderstorms, 10,000                           allowing/resolving data, techniques, and guidance, as well
severe thunderstorms, 5,000 floods or flash floods, and 1,000                           as end-users’ ability to receive, assess, understand, and
tornadoes.12 About 90 percent of all presidentially declared                            respond to forecasts and warnings.
disasters are hazardous-weather-related, representing 500
deaths and nearly $15 billion in damage per year.13                               In FY2018, approximately 5 out of every 10 total projects funded
                                                                                  by OWAQ contributed to hazardous weather research.

                                                                              9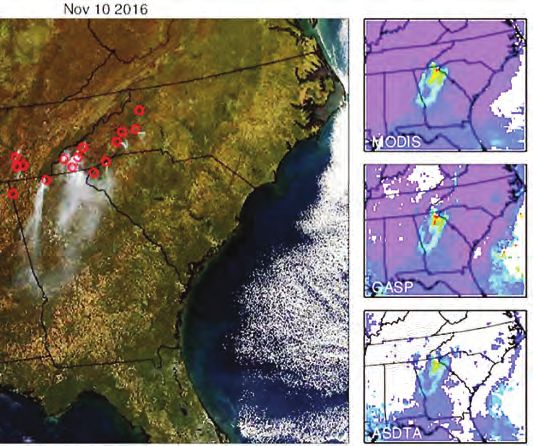
ANNUAL ACCOMPLISHMENTS

   Understanding Simulated Storm Updrafts and                                                                   FIGURE 10 (left). Spatial Contribution
Rotation to Improve Severe Hail Forecasting |                                                                   of 2–5 km AGL Minimum (magenta),
                                                                                                                Maximum (black), and Full (gray) 24-h
Hazardous Weather Testbed
                                                                                                                UH to Severe (≥ 29 mm) Hail MESH
Israel Jirak | National Weather Service-Storm Prediction Center                                                 40 km Neighborhoods (red circles).
[see Figure 10]                                                                                                 Data from 0000-UTC initialized NSSL-
Researchers sought to improve severe hail forecasting                                                           WRF on 08 May 2016. Image credit:
through targeted information extraction from                                                                    Provided by Israel Jirak.
convection-allowing model forecasts and by objective
verification using radar-derived hail size estimates.
Two new products were made available to NWS
forecasters as operational guidance in forecasting
severe hail using the HiRes Window and High-
Resolution Rapid Refresh runs: (1) Hourly minimum
updraft helicity (2-5 km AGL) to identify left-splitting
supercells, which can be prolific hail producers; and
(2) Hourly maximum updraft speed (below 100 mb) to
better estimate storm intensity and potential hail size.

   Using Drones to Improve Severe Storm
Forecasts | Joint Technology Transfer Initiative
Steve Brooks | University of Tennessee [see Figures 11 and 12]

To improve severe storm forecasts, researchers
used the existing hyperspectral and thermal imaging
instruments on a University of Tennessee aircraft—and
developed those same instruments onto a University
of Tennessee drone—to assess the Lifted Index of
near-surface air as a precursor to deep convection.
Researchers performed full-flight testing of the
Unmanned Aerial Vehicle equipped with the new
sensors. This progressed resolution from 1 meter per              FIGURE 11. Improved Resolution of Hyperspectral and Thermal Imaging Using an
pixel to 2 centimeters per pixel, which improves the              Unmanned Aerial Vehicle. Image credit: Brooks Presentation, https://bit.ly/2FzSXc3.
input data in NWS models and leads to better severe               © American Meteorological Society. Used with permission.
storm forecasts.

FIGURE 12. Image of the Team at the University of Tennessee in Front of the Research Aircraft. Image credit: Brooks Presentation, https://bit.ly/2FzSXc3
(June 2018). © American Meteorological Society. Used with permission.

                                                                         10
Indicates narratives about current or intended transitions into operations.
Using Machine Learning to Improve Quantitative
Precipitation Forecasts (QPFs) | Joint Technology Transfer
Initiative
Russ Schumacher | Colorado State University
Using machine learning techniques, researchers developed
a probabilistic forecast of extreme rainfall systems to provide
improved guidance to the forecasters of the Weather Prediction
Center (WPC). Researchers improved quantitative precipitation
forecasts (QPFs) by testing machine learning techniques in the
2017 Flash Flood and Intense Rainfall experiment. The WPC will
be able to provide communities with improved QPFs, allowing
them to better prepare for dangerous flash floods.
Improving Probability Information about Particular Hazards |
Hazardous Weather Testbed
Kristin Calhoun, Wayne Feltz, Lans Rothfusz, & Michael Pavolonis | University
of Oklahoma; University of Wisconsin-Madison Cooperative Institute for
Meteorological Satellite Studies; National Severe Storms Laboratory; National
Environmental Satellite, Data, and Information Service
Researchers integrated satellite, multi-radar, lightning
(future capability), and environmental data to determine the
probability of a given storm producing severe weather in the
next sixty minutes. This project contributed to improving the
overall probability information about particular hazards (e.g.,
hail, tornado).
FIGURE 13 (right). A Colorado Rainbow and Rainshaft. Image
credit: Jared Rackley, Weather in Focus Photo Contest 2015 (May
2014) from NOAA’s Photo Library.
Flooding (Hydrological)
Flooding is the result of an overflow or inundation from a river or and forecasting.
other body of water that causes or threatens damage. Coastal (2) Identify and validate new or improved methods, data
storms, heavy rain, and melting snow (addressed in previous assimilation, models, or decision-support tools to improve
sections) are all potential causes. When flooding is on coastal utilization of precipitation forecasts and production of
lands, it is termed “coastal inundation” and, although it could streamflow forecasts.
be caused by wave action, it is usually the result of riverine (3) Improve water prediction capabilities to include efforts
flooding, spring tides, severe storms, or underwater seismic to enhance hydrologic prediction through improved
activity resulting in a tsunami. data assimilation and model extension for hydrological
data sets.
Flooding can endanger life, property, and economies. In 2016, (4) Focus on advancements leading to improved surface-
societal impacts included 126 fatalities and $10.9 billion in based or airborne-based observing capabilities of snow
damage from flash floods and river floods.15 From 1980–2018, depth (snow water equivalent) and soil moisture.
there were 29 billion-dollar flooding events in which 543 lives (5) Apply and integrate relevant social and behavioral science
were lost and the average flood event cost $4.3 billion.16 methodologies to improve forecasters’ use of convection-
allowing/resolving data, techniques, and guidance, as well
Consistent with OWAQ’s goals and objectives, research priorities as end-users’ ability to receive, assess, understand, and
for flooding include:17 respond to forecasts and warnings.
(1) Identify and validate new or improved methods, models, In FY2018, approximately 2 out of every 10 total projects funded
or decision-support tools to improve flash flood monitoring by OWAQ contributed to hydrological research priorities.
11ANNUAL ACCOMPLISHMENTS
FIGURE 14. Left panel: Map of
31-Year Climatology of Snow-
Water Equivalents (SWE; in
meters) over the Sierra Nevada.
Right panel: Visualization of
Daily Range-Wide SWE (in km3)
Including the Peak Annual Value
and Its Day of Occurrence (red
line corresponds to 1 April).
Image credit: Provided by
Konstantinos Andreadis.
Using Radar to Improve Flash Flood Warnings | Improving the Representation of Cloud and Precipitation
Hydrometeorology Testbed Microphysics in Numerical Forecast Simulations |
Jonathan Gourley | NOAA’s National Severe Storms Laboratory Hydrometeorology Testbed
David Kingsmill | University of Colorado-Cooperative Institute for Research in
To improve flash flood warnings, researchers tested and Environmental Sciences
transitioned a set of experimental radar-based flash flood tools
and products for use by NWS weather forecast offices. These This project sought to improve the representation of cloud and
improved flash flood watches and warnings for the near-term precipitation microphysics in numerical forecast simulations
(0-6 hour forecast period), so the Flooded Locations and of coastal orographic precipitation along the West Coast.
Simulated Hydrographs software was successfully transitioned Extreme precipitation can lead to devastating flooding and
to the National Centers for Environmental Prediction with the debris flows in the coastal mountain regions during periods of
latest Multi-Radar/Multi-Sensor deployment. enhanced moisture flow associated with atmospheric rivers.
Although researchers were not able to implement and test any
Improving Prediction of Snowmelt Impacts | Snowpack and modifications to the Ferrier-Aligo (F-A) microphysics scheme
Soil Moisture in an operational setting during the project, they developed
recommendations for improving the F-A scheme to better
Konstantinos Andreadis | University of California Los Angeles [see Figure 14]
represent orographic warm rain. Each of these improvements is
To improve the National Water Model’s (NWM) ability to a step toward improved forecasts.
reproduce snow conditions and to predict streamflow in snow-
dominated river basins, researchers will use evaluation and error Using Velocity Data to Form a Better Picture of Flash
diagnosis with a state-of-the-art, observation-based dataset. Flooding | Joint Technology Transfer Initiative
Researchers will provide to the NWM team the datasets with Daniel Wasielewski | Cooperative Institute for Mesoscale Meteorological Studies
improved parameterizations of the NWM, a set of simulation [see Figure 15]
datasets along with output evaluation metrics, and the
Researchers sought to improve hydrologic forecasting in
observational datasets of the snow-water equivalent reanalysis
the new National Water Model (NWM) with the installation of
with uncertainty estimates as well as the observational datasets
fourteen stream radars on cables or bridges across rivers at
(from Landsat, MODIS and VIIRS) used in their derivation.
12Indicates narratives about current or intended transitions into operations.
FIGURE 15. Stream Radar in Mill Creek, Oklahoma. Image credit: Jorge Duarte (April 2017).
the pre-determined, high-priority locations. In support
of the NWM, during a flash flood event stream radars
can complement the existing U.S. Geological Survey
Air Quality
stream gauge network and capture instances in which Although air quality has improved following the passage of the
water levels are the same but the velocity varies. Clean Air Act in 1970, in many areas of the country the public is
still exposed to unhealthy levels of air pollutants and sensitive
Improving Streamflow Predictions | Snowpack ecosystems are damaged by air pollution. Both wildfires in the West
and Soil Moisture and high surface ozone episodes during heat waves in the East
Heather Reeves, Mimi Hughes, and David Gochis | University of contribute to poor air quality. NOAA works with the Environmental
Oklahoma; Cooperative Institute for Research in Environmental Protection Agency, state and local air quality agencies, academia,
Sciences and National Center for Atmospheric Research
and the private sector to provide an air quality forecast capability for
This research advanced the Spectral Bin Classifier, the Nation called the National Air Quality Forecasting Capability.
which provides three-dimensional hydrometeor phase
diagnosis and estimates of the liquid-water fraction Consistent with OWAQ’s goals and objectives, research priorities for
of falling precipitation. Researchers are transferring air quality include:18
this product from a research version of the code to a
real-time experimental version as a part of the Multi- (1) Development and evaluation of high-resolution (1-4 km) air
Radar/Multi-Sensor (MRMS) System at NOAA’s National quality forecast capabilities that are consistent with NOAA
Severe Storms Laboratory. Researchers also are weather forecast models at these resolutions.
investigating the feasibility and value of incorporating (2) Incorporation of the Finite Volume Cubed-Sphere Dynamical
dual-polarized radar information for refining the Core (FV3) model-driven meteorological predictions in the
algorithm’s output. Post-testing, the product will be National Air Quality Forecasting Capability with on-line
transitioned to the operational version of MRMS coupling in the near future.
running at the National Centers for Environmental (3) Improved spatial and temporal estimates of anthropogenic and
Prediction, pending NWS acceptance. natural pollutant emissions.
13ANNUAL ACCOMPLISHMENTS
(4) Exploration and quantification of the potential value of
ensemble model approaches and post processing to
operational air quality forecasting.
(5) Improved model representation in the FV3 model of
physical/chemical processes for long range transport.
(6) Apply and integrate relevant social and behavioral science
methodologies to improve forecasters’ use of convection-
allowing/resolving data, techniques, and guidance, as well
as end-users’ ability to receive, assess, understand, and
respond to forecasts and warnings.
In FY2018, approximately 1 out of every 10 projects funded by
OWAQ contributed to air quality research priorities.
Assessing and Communicating Uncertainty in Modeled
Transport, Dispersion, and Deposition of Hazardous
Materials | Joint Technology Transfer Initiative
Barbara Stunder | NOAA’s Air Resources Laboratory [see Figure 16]
In this project, researchers are improving deterministic
approaches with products that assess and communicate
uncertainty in the models of hazardous material transport,
FIGURE 16. Forward 24h Trajectory Matrix Forecast at 1500 m Above
dispersion, and deposition. This serves emergency response
Ground Level Using the NAM Meteorological Data. Image credit: Creative applications as diverse as simulating atmospheric plumes from
Commons License, https://doi.org/10.1016/j.envsoft.2017.06.025 chemical releases, smoke from wildfires, or wind-blown dust.
Improving the Forecasts of Smoke from Wildfires |
Air Quality
Tianfeng Chai | University of Maryland [see Figure 17]
This project seeks to provide a better smoke forecast by
developing a Hybrid Single Particle Lagrangian Integrated
Trajectory Model inversion system to better estimate wildfire
smoke sources. Researchers plan to evaluate and improve
the inverse system while working on real-time operation
capability. Proposed actions include: (1) Transitioning the
inverse system code to the NOAA operational environment,
if possible; (2) Modifying the code interface to read near-real-
time Geostationary Satellite aerosol/smoke products; and (3)
Evaluating the smoke forecasts using the optimally estimated
emissions.
Improving Air Quality Prediction | Air Quality
Irina Djalalova | NOAA’s Physical Sciences Laboratory and the Cooperative
Institute for Research in Environmental Sciences at the University of Colorado
[see Figure 18]
This project proposed to provide improved accuracy of
particulate matter (PM2.5) and surface ozone air quality
forecasts provided to the public. An initial beta-version of
FIGURE 17. Observed Fire Events in Southeastern U.S. on November ozone post-processing code was delivered to the National
10, 2016. MODIS truecolor image is shown in left panel, and MODIS, Centers for Environmental Prediction (NCEP). An updated
GOES Aerosol/Smoke products, Automated Smoke Detection and version was delivered to NCEP that included site-specific
Tacking Algorithm aerosol optical depths are shown in right panel. weighting of ozone forecasts. In addition, an updated version
Red circles indicate locations of wildfires detected by the Hazardous of the post-processing code that provides improved skill at
Mapping System. Image credit: Provided by Tianfeng Chai.
forecasting extreme events for both ozone and PM2.5 was
developed, tested, and evaluated against the NCEP Community
Multiscale Air Quality forecasts. Based on this testing, NCEP has
approved the new ozone post-processing scheme, as well as
updates to the PM2.5 scheme, for the next operational model
implementation upgrade.
14Indicates narratives about current or intended transitions into operations.
FIGURE 18 (right). This image shows a 16-day
time-series of observed and forecast PM2.5,
spatially averaged over 905 sites in the western
third of the U.S. Early in the time period there
were numerous fires burning in Washington and
Oregon states and western Canada, leading
to high PM2.5 values during the first 5 days of
August. Whereas the raw CMAQ forecasts (red
line) reached PM2.5 values as high as those
observed during this period, the original KFAN
method (blue dashed line) predicted values that
were much too low, as it did not find a sufficient
number of good analogs with high PM2.5 values.
In contrast, the new KFAN method modified for
extreme events (solid blue line) does a much
better job of matching the observed high PM2.5
values. Image credit: Provided by Irina Djalalova.
FIGURE 19. Fire Suppression Operations for the Cold Spring Fire Near Nederland, Colorado. Image credit: Steve and Susan Williams, NOAA’s Earth
System Research Laboratory (August 2016).
15ANNUAL ACCOMPLISHMENTS
Interdisciplinary Consistent with OWAQ’s goals and objectives, research
priorities for interdisciplinary research include:20
Research (1) Identify and validate via quasi-operational testbed
demonstrations new high temporal and spatial resolution
in-situ and remotely-sensed observation datasets and
Interdisciplinary research is integrating knowledge and methods dynamically consistent 3-D objective data-analysis
from different disciplines and synthesizing approaches. OWAQ techniques to provide the best state of the current
interdisciplinary themes include, but are not limited to: environment.
(2) Apply and integrate relevant social and behavioral
Uncertainty, including understanding and messaging of science methodologies into the above testbed priority
probabilistic hazard information. The OWAQ team and areas to improve forecasters’ use of convection-allowing/
partners coordinate social, behavioral, and economic science resolving data, techniques, and guidance.
research needs; determine approaches to translating social, (3) Apply and integrate relevant social and behavioral
behavioral, and economic science research into application; and science methodologies to improve forecasters’ use of
learn from the operational community to understand the next convection-allowing/resolving data, techniques, and
research challenges (facilitated by the Social Science Program). guidance, as well as end-users’ ability to receive, assess,
Similarly, the OWAQ team and partners support multiple-hazard understand, and respond to forecasts and warnings.
research across severe weather tropical cyclones, precipitation
extremes, air quality, flash flooding, hydroclimate extremes,
and other hazards to support NOAA’s Weather-Ready Nation
initiative and build natural hazard resilience in communities.
This is possible with a next-generation severe weather
watch and warning framework that is modern, flexible, and
designed to communicate clear and simple hazardous weather
information that serves the public (facilitated by the Forecasting
a Continuum of Environmental Threats (FACETs) paradigm).
Timescales, including Subseasonal-to-Seasonal research.
Subseasonal-to-Seasonal (S2S) research focuses on baseline
understanding of predictability; advancement of community-
driven NOAA modeling initiatives; and increasing the utility of
multi-model ensembles for end users. This will fulfill the S2S
(two weeks out to two years) requirements of the Weather
Research and Forecasting Innovation Act of 2017 while
emphasizing the models and components in NOAA’s Unified
Forecast System (UFS), the North American Multi-Model
Ensemble, and ongoing multi-model ensemble efforts on the
S2S timescale.
Data and models, including Weather-Water-Climate
initiatives and the Joint Technology Transfer Initiative. The
National Academy of Science reports, Observing Weather
and Climate From the Ground Up (2009), and The Future of
Atmospheric Boundary Layer Observing, Understanding, and
Modeling, Proceedings of a Workshop (2018) underscore the
importance of improved observations of the lower atmosphere
(a region that is not particularly well-sampled by satellites) to
better understand and predict specific, high-impact weather
events. Programs such as the Joint Hurricane Testbed,
Hydrometeorology Testbed,19 and Joint Technology Transfer
Initiative support development, testing, and evaluation of
mature research that has the potential for improving NOAA’s
NWS operational capabilities, particularly in the areas of
advancing numerical weather prediction capabilities that FIGURE 20. Comparison of HYCOM and MOM6 Models for Sea-Surface
seamlessly integrate in the NOAA UFS, water prediction Height (SSH) variability. Image credit: Alan Wallcraft, Eric Chassignet, and
capabilities, and forecasting extreme precipitation and flooding Robert Hallberg via a collaboration between Florida State University and
events. GFDL funded by the National ESPC.
16Indicates narratives about current or intended transitions into operations.
In FY2018, approximately 2 out of every 10 projects funded by
OWAQ contributed to those interdisciplinary research priorities.
Improving Understanding of Ocean Heat and
Sea-Level Rise | Earth System Prediction Capability
Robert Hallberg | NOAA’s Geophysical Fluid Dynamics Laboratory [see Figure 20]
In the latest version of the Modular Ocean Model (MOM6),
researchers sought to enable eddy-resolving resolution runs
(0.08 deg) and reported good preliminary results. This is an
improvement over previous modeling which, at best, offered 0.1
degree resolution that was insufficient for understanding the
details of all sizes of ocean eddies. Future work will incorporate
internal wave drag parameterizations for tides, data assimilation
preparations, and open boundary conditions (for nests).
Improving Guidelines for Expressing Uncertainty | Social
Science Program
Susan Joslyn | University of Washington [see Figure 21]
A series of experimental studies conducted for this project
revealed that forecast inconsistency causes a slight reduction in FIGURE 22. Model Evaluation Tools Enhanced with Shapefiles.
trust; however, the reduction in trust due to forecast inaccuracy Examples of masking regions generated from shapefiles by Dana Strom
at the Meteorological Development Laboratory. Regions include the
is much greater. Moreover, inconsistency may give users
Massachusetts County Warning Area, the Missouri Basin River Forecast
important information about forecast uncertainty. Therefore, it
Center (MBRFC), and two regions in Alaska. Image credit: Provided by Tara
is better to update the forecast even if it means inconsistency, Jensen.
especially if the forecaster thinks that the new information is
likely to be more accurate.
Improving Subseasonal Forecasts of Extreme Hydrological forecasts (lead times ranging from 15 to 45 days) that will allow
Events | Joint Technology Transfer Initiative stakeholders to better prepare for extremes in the hydrological
Cristiana Stan | George Mason University cycle, such as the onset of drought conditions and heavy
precipitation events.
This research will provide a scientifically validated version
of the Unified Forecast System with capabilities to run the
Improving Research-to-Operations Transitions for FACETs
computationally efficient ocean model MOM6 at 0.25 degrees
| Joint Technology Transfer Initiative
global resolution. This supports improvements to subseasonal
Alan Gerard | NOAA’s National Severe Storms Laboratory
This project continues the research-to-operations transition
6 process for key aspects of the Forecasting a Continuum of
■ Consistent Environmental Threats (FACETs) effort for convective hazards
■ Inconsistent and will support the progress of Probabilistic Hazard Information
5 towards initial operational implementation. FACETs is a
proposed next-generation watch and warning framework that is
designed to communicate clear and simple hazardous weather
Mean Trust Rating
4 information to the public.
Improving the Use of Precipitation Forecasts |
3 Hydrometeorology Testbed
Tara Jensen | National Center for Atmospheric Research [see Figure 22]
This project will integrate verification research with social
2
science research to develop verification metrics and tools
that improve forecasters’ adoption, interpretation, and use of
deterministic and probabilistic model guidance with a focus
1
on convection-allowing guidance. Ultimately, researchers will
Accurate Inaccurate identify a set of objective measures to be employed at the
FIGURE 21. Experiment 1 Trust Ratings by Accuracy and Consistency. Hydrometeorology Testbed and, possibly, other testbeds such
Image credit: Provided by Susan Joslyn. as the Hazardous Weather Testbed.
17T H E WAY F O R WA R D
The Way Forward
build a Weather-Ready Nation with an overall focus on improving
model physics, developing enhanced hazard mitigation
strategies, accelerating the development of capabilities, and
incorporating evaluation. In turn, this means:
Fulfilling the office’s vision while meeting the needs of a
Weather-Ready Nation requires ongoing innovation and a
• Expanding Next Generation Global Prediction System
holistic view of our office’s performance and our partners’
elements related to severe weather prediction, especially
needs. OWAQ delivered as promised in FY2018 and is ready to
landfalling tropical storms and hurricanes.
deliver again.
• Supporting the next generation of mesoscale weather-
observing platforms.
Goal 1. OWAQ will continue to improve effective communication
• Improving the Finite-Volume Cubed (FV3)-based
of weather information to strengthen decision-making and
ensemble prediction system.
forecasting abilities by:
• Improving storm-surge modeling.
• Accelerating the development of the Joint Effort for Data
• Applying theoretical knowledge about behavioral
assimilation Integration infrastructure.
responses to predictions, warnings, and forecasts in
• Accelerating assimilation of new satellite and other
specific domains.
observational data and optimization of current data
• Improving the transition of social and behavioral
assimilation.
research into operations.
• Accelerating, testing, and evaluating forecast impacts
• Embedding social sciences in the physical sciences.
from new data assimilation capabilities in regional
• Improving dissemination of ideas and best practices
and global atmospheric, marine, land, hurricane, and
to stakeholders.
hydrological models.
• Evaluating impacts from satellite observing system
Goals 2. OWAQ will continue to advance models and forecast
components and mitigation of forecast skill drop-outs.
tools to produce the best weather forecasts and warnings to
To improve understanding of tropical cyclones, OWAQ will
support improvements to the current hurricane prediction
system and improvements in National Hurricane Center
forecast techniques to improve seasonal hurricane forecasts.
OWAQ also will support the continued availability and use of
ocean observation platforms and systems for improvements
to hurricane forecasting skill, specifically in regard to intensity
and track.
To improve understanding of tornadoes, OWAQ will continue
to support VORTEX-SE, as requested, so scientists can study
the storms that produce tornadoes in the Southeast U.S. by
examining historical data and applying state-of-the-art numerical
weather prediction and data assimilation systems.
To improve understanding of air quality, OWAQ will improve air
quality research and forecasting because the current NOAA
operational forecast challenges for fine particulate matter
(PM2.5) and ozone predictions include improving emissions
from sources such as wildfire smoke and dust as well as
chemical mechanisms.
Goal 3. To effectively and efficiently manage the advancement
and transition of weather research into societal applications,
OWAQ will focus on applied research, development, and, in
particular, the demonstration and testing of that research in
NOAA’s quasi-operational forecasting environment. To improve
the technology transfer effectiveness and efficiency, OWAQ
will support development, testing, and evaluation of mature
weather research that has the potential to improve NOAA’s NWS
operational capabilities, particularly in the areas of advancing
FIGURE 23. Potomac River Overflowing Its Banks Near Harpers Ferry, numerical weather prediction capabilities that seamlessly
West Virginia. Image credit: Janet Ward (February 2000) for NOAA’s integrate in the NOAA Unified Forecast System, water prediction
Photo Library. capabilities, and forecasts of extreme precipitation and
18FIGURE 24. A Supercell Moves East of Denver, Colorado. Image credit: Susan Cobb for NOAA’s National Severe Storms Laboratory (June 2006).
flooding events. This also includes improving the efficiency, to advance and support our mission of science, service,
effectiveness, and accuracy of obtaining snowpack and soil and stewardship.
moisture observations.
In support of the overall diversity of the weather enterprise,
OWAQ will advance research at the subseasonal-to-seasonal OWAQ will continue to strengthen engagement with
time frame and will simultaneously advance predictive capability underrepresented groups, particularly with NOAA’s
and understanding of precipitation on the S2S scale via Cooperative Science Centers, Historically-Black Colleges and
improved data assimilation, especially coupled data assimilation Universities, Hispanic-Serving Institutions, and Tribal Colleges
including new observation types; Earth system model processes and Universities.
for precipitation and high-impact events; and ensemble
techniques, composition, and post-processing, including multi-
model ensembles.
Goal 4. To develop and support a diverse and inclusive work
Conclusion
environment that promotes equal access to the opportunities We cannot avoid weather, but we can learn more about what to
OWAQ offers, OWAQ will continue to assemble a workforce expect and when to expect it. Count on OWAQ to learn from this
that understands and responds to OWAQ’s partners and year’s accomplishments while continuing to make prioritized,
stakeholders. Workforce diversity also will ensure that sustained investments in weather and air quality research. With
the interdisciplinary demands for weather research and our partners, we will fulfill our vision of a Weather-Ready Nation
development expertise are continuously met while building informed by world-class weather research.
a work environment that encourages open communication,
provides fair and equitable opportunities, and empowers Visit https://owaq.noaa.gov for funding opportunities, student
employees with the resources and support they need and teacher resources, and more.
19Appendix A: Projects
ACTIVE PROJECTS IN FY2018 (alphabetical by title) Convection-Permitting Ensemble Forecast System Evaluating Stochastic Physics Approaches within Select
for Prediction of Extreme Weather | Lead PI(s) Glen Convection Allowing Model (CAM) members included in
Accounting for Non-Gaussianity in the Background Error Romine, Michael Coniglio | University Corporation for the Community Leveraged Unified Ensemble (CLUE) during
Distributions Associated with Cloud-Related Variables Atmospheric Research; Cooperative Institute for Mesoscale the Hazardous Weather Testbed (HWT) Spring Experiment |
(Microwave Radiances and Hydrometeors) in Hybrid Data Meteorological Studies | 09/01/2015 - 08/31/2018 Lead PI(s) Jamie Wolff and Isidora Jankov | National Center
Assimilation for Convective-Scale Prediction | Lead PI(s) for Atmospheric Research; Colorado State University-
Karina Apodaca | Colorado State University | 10/01/2016 - Critical Steps toward a National Global Ocean Modeling Cooperative Institute for Research in the Atmosphere |
09/30/2019 Capability in Support of ESPC | Lead PI(s) Robert Hallberg | 07/01/2017 - 06/30/2019
Geophysical Fluid Dynamics Laboratory | 10/1/2017 -
Adding TC Genesis Verification Capabilities to the Model 9/30/2018 | See also page 17 Evaluation and Diagnosis of National Water Model
Evaluation Tools - TC Software | Lead PI(s) Daniel Halperin | Simulations Over CONUS Ising a Novel Snow Reanalysis
Embry-Riddle | 09/01/2018 - 08/31/2020 Demonstration of a Rapid Update Convection-Permitting Dataset | Lead PI(s) Konstantinos Andreadis | University of
Ensemble Forecast System to Improve Flash Flood and California Los Angeles | 09/01/2018 - 08/31/2020 | See also
Advancing Frequently-Updating Storm-Scale Ensemble Data Winter Weather Prediction | Lead PI(s) Glen Romine | National page 12
Assimilation and Prediction Towards Operations | Lead PI(s) Center for Atmospheric Research | 07/01/2017 - 06/30/2019
Curtis Alexander | OAR/ESRL/GSD | 11/01/2017 - 10/31/2020 Evaluation and Improvements of Tornado Detection Using
Demonstration of a Rapid Update Convection-Permitting Infrasound Remote Sensing: Comparative Analysis of
Advancing Social and Behavioral Science Research and Ensemble Forecast System to Improve Hazardous Weather Infrasound, Radar, Profiler, and Meteorological Data Sets,
Application within the Weather Enterprise | National Academy Prediction | Lead PI(s) Glen Romine | National Center for and Potential Impacts on NOAA/NWS Operations | Lead
of Sciences | 03/08/2016 - 03/07/2018 Atmospheric Research | 07/01/2017 - 06/30/2019 PI(s) Hank Rinehart and Kevin Knupp | General Atomics and
University of Alabama-Huntsville | 10/01/2017 - 09/30/2019
Airborne Phased Array Radar (APAR) Development and Demonstration of an Airborne Hyperspectral and Thermal
Risk Mitigation Project | Lead PI(s) Vanda Grubišić | National Imaging System to Assess Convective Lifted Index | Lead Evolutionary Programming for Probabilistic Tropical Cyclone
Center for Atmospheric Research | 10/1/2017 - 3/31/2019 PI(s) Steve Brooks | The University of Tennessee | 10/01/2016 Intensity Forecasts | Lead PI(s) Paul Roebber | University of
- 09/30/2018 | See also page 10 Wisconsin-Milwaukee | 07/01/2017 - 06/30/2019
Alliance for Integrative Approaches to Extreme
Environmental Events | Lead PI(s) Kimberly Klockow | Developing a Unified Online Air Quality Forecasting System An Examination of the State of Knowledge on Risk
Cooperative Institute for Mesoscale Meteorological Studies | Based on CMAQ and NGGPS | Lead PI(s) Georg Grell | NOAA/ Perceptions and Understanding Response to Uncertainty
05/01/2017 - 05/31/2018 OAR/ESRL | 06/01/2016 - 05/31/2019 Information | Lead PI(s) Terri Adams | Howard University |
08/01/2017 - 07/31/2018
Assessing the Impact of Assimilating Ground-Based Infrared Developing an Objective Evaluation Scorecard for Storm
Radiometer Data into Convective-Scale Numerical Weather Scale Prediction | Lead PI(s) Tara Jensen | National Center for Extending the Rapidly-Updating Real-Time Mesoscale
Prediction Models | Lead PI(s) Timothy Wagner | University of Atmospheric Research | 07/01/2017 - 06/30/2019 Analysis (RTMA) to Three Dimensions for Whole-Atmosphere
Wisconsin-Cooperative Institute for Meteorological Satellite Situational Awareness and Analysis of Record | Lead PI(s)
Studies | 10/01/2016 - 09/30/2019 Developing and Evaluating GSI-based EnKF-Variational Curtis
Hybrid Data Assimilation for NCEP NAMRR to Improve Alexander | NOAA/OAR/ESRL/GSD | 11/01/2017 - 10/31/2020
Assessing the Impact of Stochastic Cloud Microphysics Convection-Allowing Hazardous Weather Forecast | Lead
in Convection-Resolving Models Using GOES-R Satellite PI(s) Xuguang Wang | University of Oklahoma | 09/01/2015 FACETs: Advancing Physical and Social Science Concepts
Observations | Lead PI(s) Jason Otkin, Gregory Thompson, - 08/31/2019 toward Operational Implementation of Probabilistic Hazard
and Fanyou Kong | University of Wisconsin-Cooperative Information | Lead PI(s) Alan Gerard | OAR/NSSL | 11/01/2017 -
Institute for Meteorological Satellite Studies; National Center Development and Evaluation of New Statistical Calibration 10/31/2020 | See also page 17
for Atmospheric Research; and University of Oklahoma | Methods for Multi-Model Ensemble Weeks 3-4 Probabilistic
08/01/2017 - 07/31/2019 Forecasts | Lead PI(s) Nicolas Vigaud | Columbia University | FACETs: Developing Operationally-Ready Hazard Services-
09/01/2018 - 08/31/2020 Probabilistic Hazard Information (PHI) for Convective
Assessment of Hydrologic Forecasts Generated Using Hazards | Lead PI(s) Tracy Hansen | NOAA/OAR/ESRL/GSD |
Multi-Model and Multi-Precipitation Product Forcing | Lead Development and Implementation of Probabilistic Hail 11/01/2017 - 10/31/2020
PI(s) Witold Krajewski | University of Iowa | 07/01/2017 - Forecast Products Using Multi-Moment Microphysics and
06/30/2019 Machine Learning Algorithms | Lead PI(s) Nathan Snook | The Forecast Guidance for Aviation Tactical Operations and
University of Oklahoma | 10/01/2016 - 09/30/2019 Strategic Planning over Alaska | Lead PI(s) Judy Ghirardelli |
Assimilation of Lake and Reservoir Levels into the WRF- NOAA/NWS/STI/DFSB | 11/01/2017 - 10/31/2020
Hydro National Water Model to Improve Operational Development and Optimization of Radar-Assimilating
Hydrologic Predictions | Lead PI(s) David Gochis, Allen Ensemble-Based Data Assimilation for Storm-Scale Ensemble Forecast System Development Activities toward a
Burton, and Lynn Johnson | University Corporation for Prediction in Support of HWT Spring Experiments | Lead PI(s) Convective-Scale HRRR Ensemble | Lead PI(s) Glen Romine
Atmospheric Research; Great Lakes Environmental Research Ming Xue | University of Oklahoma - Center for Analysis and | National Center for Atmospheric Research | 08/01/2017 -
Laboratory (GLERL); Colorado State University-Cooperative Prediction of Storms | 07/01/2017 - 06/30/2019 07/31/2019
Institute for Research in the Atmosphere | 10/01/2016 -
09/30/2019 Development of NWS Convective Scale Ensemble Guidance on Observational Undersampling over the Tropical
Forecasting Capability through Improving GSI-Based Hybrid Cyclone Lifecycle | Lead PI(s) David Nolan and Eric Uhlhorn
Assimilation of Remote Sensing Observations into Ensemble-Variational Data Assimilation and Evaluating the | University of Maryland and NOAA/OAR/AOML | 09/01/2015
Convective-scale NWP to Improve 0-6 h Probabilistic Multi-Dynamic Core Approach | Lead PI(s) Xuguang Wang | - 08/31/2018
Forecasts of High Impact Weather | Lead PI(s) Nusrat Yussouf The University of Oklahoma | 10/01/2016 - 09/30/2019
| Cooperative Institute for Mesoscale Meteorological Studies | Guidelines for Expressing Uncertainty in Impact Decision
10/01/2016 - 09/30/2019 Direct Detection of Tornadoes Using Infrasound Remote Support Service Products Supplement to NSF Award
Sensing: Assessment of Capabilities through Comparison Improving Public Response to Weather Warnings | Lead
Augmentation of VORTEX-SE Intensive Observations Period with Dual Polarization Radar and Other Direct Detection PI(s) Susan Joslyn | University of Washington | 09/01/2016 -
Measurements with Infrasound Observations to Detect and Measurements | Lead PI(s) Hank Rinehart and Kevin 09/01/2019 | See also page 17
Track Tornadoes | Lead PI(s) Carrick Talmadge | University of Knupp | General Atomics and University of Alabama-
Mississippi | 10/01/2016 - 12/31/2017 Huntsville | 10/01/2016 - 09/30/2018 Identification of the Fluid Mechanisms Associated with
Tornadic Storm Infrasound | Lead PI(s) Brian Elbing |
Automated High-Resolution Ensemble-Based Hazard Enabling Effective Use of Deterministic-to-Probabilistic Oklahoma State University | 09/01/2018 - 08/30/2020
Prediction Tool | Lead PI(s) Curtis Alexander | OAR/ESRL/GSD Precipitation Forecasts for Heavy and Extreme Events | Lead
| 05/01/2015 - 04/30/2018 PI(s) Tara Jensen | National Center for Atmospheric Research The Impact of Ocean Resolution in the Unified Forecast
| 07/01/2017 - 06/30/2019 | See also page 17 System (UFS) on the Subseasonal Forecast of Extreme
Building a Distributed Earth System Model Development Hydrological Events | Lead PI(s) Cristiana Stan | George
Community | Lead PI(s) Cecelia DeLuca | CIRES NOAA ESRL | Ensemble-Based Pre-genesis Watches and Warnings for Mason University | 09/01/2018 - 08/31/2020 |
10/1/2017 - 9/30/2018 Atlantic and North Pacific Tropical Cyclones: Lead PI(s) See also page 17
Russell Elsberry | University of Colorado-Colorado Springs |
Comparison of Model versus Observationally-Driven Water 07/01/2017 - 06/30/2019 Implementation of a Three-Dimensional Hydrometeor
Vapor Profiles for Forecasting Heavy Precipitation Events Classification Algorithm within the Multi-Radar/Multi-Sensor
| Lead PI(s) John Forsythe | Colorado State University- Estimation of Tropical Cyclone Intensity Using Satellite System | Lead PI(s) | Heather Reeves | University of Oklahoma
Cooperative Institute for Research in the Atmosphere | Passive Microwave Observations | Lead PI(s) Haiyan Jiang | - Cooperative Institute for Mesoscale Meteorological Studies
07/01/2017 - 06/30/2019 Florida International University | 07/01/2017 - 06/30/2019 | 08/01/2017 - 07/31/2019
Convection-Allowing Ensemble Prediction for Heavy Implementation of Advanced Multi-Sensor Analysis and Data
Precipitation in Support of the Hydrometeorology Testbed Fusion Algorithms for Real-Time High-Resolution Quantitative
(HMT): New QPF Products, Data Assimilation Techniques Precipitation Estimation | Lead PI(s) Dong-Jun Seo and Lin
and Prediction Model | Lead PI(s) Ming Xue | University of Tang | The University of Texas at Arlington and The University
Oklahoma | 07/01/2017 - 06/30/2019 of Oklahoma | 10/01/2016 - 09/30/2019
20You can also read