Unsafe Jobs, Labour Market Risk and Social Protection - 73rd Economic Policy Panel Meeting
←
→
Page content transcription
If your browser does not render page correctly, please read the page content below
73rd Economic Policy Panel Meeting
 15-16 April 2021

Unsafe Jobs, Labour Market Risk and Social
 Protection
 Gaetano Basso (Bank of Italy)
 Tito Boeri (Bocconi University)
 Alessandro Caiumi (University of California, Davis)
 Marco Paccagnella (OECD)
|1

 Unsafe Jobs, Labour Market Risk and Social Protection*
 Gaetano Basso (Bank of Italy), Tito Boeri (Bocconi University, CEPR and IZA),
 Alessandro Caiumi (Bocconi University and University of California, Davis) and Marco
 Paccagnella (OECD)

 Abstract

This paper proposes a new classification of occupations based on the extent to which they put
workers at risk of being infected with aerial-transmitted virus. We expand on previous work that
mainly focused on the identification of jobs that can be done from home by providing a more
nuanced view of infection risks and by identifying jobs that, although impossible to be done from
home, expose workers to a low risk of infection. We label jobs that cannot be done from home
and that present a high risk of infection as “unsafe jobs”. We combine our classification of
epidemiological risk with a list of “essential activities” that have been carried out even during the
most severe lockdown measures, obtaining a taxonomy of jobs exposed to different degrees of
contagion and labour market risk. Using both survey and administrative data, we show that this
taxonomy successfully predicts job-related epidemiological risk and labour market outcomes
(such as sick leaves, COVID-19-related work injuries, recourse to short-time work schemes and
work-from-home). We then apply our taxonomy to labour force survey data from 28 countries
and find that unsafe jobs are very unequally distributed across different types of workers, firms,
and sectors. More vulnerable workers (women, youngster, low educated, immigrants, and workers
on fixed-term contracts) are over-represented in this pool, and therefore more at risk of suffering
from the economic consequences of a prolonged pandemic. We finally discuss possible paths to
reform social protection systems, so that they can better support workers during the labour market
adjustments that are likely to be spurred by the COVID-19 pandemic.

*
 This paper was previously circulated under the title “The New Hazardous Jobs and Worker Reallocation”. Contacts:
Gaetano Basso, Bank of Italy, gaetano.basso@bancaditalia.it; Tito Boeri, Bocconi University, CEPR and IZA,
tito.boeri@unibocconi.it; Alessandro Caiumi, University of California, Davis, acaiumi@ucdavis.edu; Marco
Paccagnella, OECD Directorate for Education and Skills, marco.paccagnella@oecd.org. We thank Jérôme Adda,
Andrea Garnero, Eliana Viviano, two anonymous referee, seminar participants at the OECD and CEPR, and
participants to the annual VisitINPS conference for insightful comments. Francesco Armillei provided outstanding
research assistance. The views expressed are those of the authors and do not necessarily reflect those of the Bank of
Italy, nor of the Eurosystem.
2|

1. Introduction

Following the outbreak and the extended duration of the COVID-19 pandemic, epidemiological
risk is gaining an enormous importance as a dimension of workers’ safety. Such risk is unevenly
distributed across jobs and workers. In this paper, we provide a method to classify occupations
according to the risk of contagion. We expand on the previous literature that almost exclusively
looked at the feasibility of working from home by analysing other dimensions of risk, notably
considering the frequency of interactions with co-workers and customers. Starting from O*NET
data, which describe the characteristics of jobs at the current level of technology and in the pre-
pandemic scenario, we classify jobs in four categories by gradually relaxing some safety
constraints. This gives a more nuanced characterisation of the epidemiological risk of occupations,
encompassing working from home and various degrees of physical proximity required to work.
Our classification is necessarily based on the ways jobs were carried out at the onset of the
pandemic. It is therefore subject to change, to the extent that the set of tasks constituting a given
occupation changes in response to technological progress or to other events, including the
COVID-19 pandemic itself. While the classification will therefore need to be updated in the
future, the methodology offered in this paper will remain a useful tool for policy analysis well
beyond the contingency of the COVID-19 pandemic.
By using the information contained in the O*NET survey, and building on previous work by
Boeri, Caiumi and Paccagnella (2020) and Dingel and Neiman (2020), we classify jobs in four
mutually exclusive categories, characterised by decreasing degree of safeness. Safest jobs are
those that can be done from home, followed by jobs that only require infrequent contacts with co-
workers, and then by those which also require infrequent contacts with customer. The last, residual
category contains all other jobs, which we label “unsafe”. We argue that the risks associated to
jobs with a mild degree of risk (infrequent contacts with co-workers and infrequent contacts with
co-workers and customers), although higher than those associated with jobs that can be carried
out in from home, are still low enough to make them feasible even in a context where a virus is
spreading at large scale. Each job is classified in a given category if the average response of
workers to a set of O*NET items is above (or below, depending on how the question is phrased)
a pre-defined threshold. Drawing on data from the US Current Population Survey (CPS) and on
harmonised labour force survey data for European countries (EU-LFS), we estimate the share of
jobs falling in these four categories for 28 countries. Roughly 50% of jobs belong to the residual
category of unsafe jobs, although large cross-country variation exists, notably in the share of jobs
that can be done from home. This nuanced characterisation of job safety is one of the main
contributions of this paper and has clearly important policy implications.
We then combine our classification of health risk with a list of essential occupations that have
been carried out even during the most severe lockdown measures (Fasani and Mazza, 2020). This
allows us to interact epidemiological risk with labour market risk, i.e. the risk that health policy
measures prevent a worker from carrying out his or her job during a pandemic. By combining the
two dimensions of risk – epidemiological and labour market – we develop an eightfold taxonomy
of jobs with different degrees and types of risk. We validate such a classification with labour
market and job-related health risk administrative and survey data during the pandemic for the
countries for which such data are available (Italy, UK and the US).
We then examine in detail the characteristics of workers holding unsafe jobs in essential and non-
essential activities. We find that the most economically vulnerable workers, i.e., women, low-
educated workers, immigrants, low-wage workers, workers on temporary contracts, and part-
timers, are over-represented in unsafe jobs. Moreover, we show that about 60 percent of unsafe
jobs are in non-essential occupations: firms restructuring in these sectors may lead to a dramatic
drop in labour demand hitting these twice-vulnerable workers. We therefore discuss reforms of
|3

labour and social policies that – in addition to a better targeting of the vaccination campaign to
job-related contagion risk – could deal with these new dimensions of economic vulnerability.
Our contribution to the literature on the labour market consequences of the COVID-19 pandemic
is threefold. First, we consider a broader definition of potentially hazardous and non-hazardous
jobs: we focus not only on jobs that can be done from home, but we also identify jobs that, while
requiring physical presence on the workplace, can easily comply with physical distancing
protocols as they involve only infrequent contacts with other persons. Second, we evaluate
whether our classification predicts actual labour market and job-related health risks during the
pandemic. Third, we characterise the heterogeneity in the distribution of such risks across many
workers, jobs and firm characteristics in 28 countries, and we discuss the implications in terms of
the design of labour market and social policies dealing with these new dimensions of workers’
vulnerability.
The remainder of the paper is structured as follows. Following the literature review in Section 2,
we present our methodology to classify jobs according to their level of infection risk in Section 3.
In Section 4, we combine our classification with a list of essential jobs, and we validate our
taxonomy with actual data on job-related health risk and labour market outcomes. In Section 5,
we analyse heterogeneity in the incidence of such risks according to a large number of jobs and
workers characteristics in 28 countries. Section 6 discusses the implications of our results for
labour market and social policies dealing with the pandemic and its legacies. Section 7 concludes
the paper.

2. Identifying Unsafe Jobs
Since the first appearance of the pandemic, the literature on the economic consequences of
COVID-19 has been growing rapidly. A number of studies have attempted to estimate the share
of jobs that can be performed at home or remotely, and which are therefore compatible with the
most restrictive lockdown measures put in place to contain the pandemic. In what follows, we
focus only on the papers that are most related to our setup and analysis, but we acknowledge there
is a vast research in this field. 1 The earliest papers that attempted this exercise, and which have
been developed simultaneously and independently, are Boeri, Caiumi and Paccagnella (2020) and
Dingel and Neiman (2020). The latter focuses on the US and relies on the O*NET surveys to
estimate the feasibility of working from home; the former expands the perspective by taking into
account also jobs entailing only sporadic personal interactions. In this paper, we expand on Boeri,

1
 Among the extensive literature, we highlight the following papers. Alipour, Falck and Shüller (2020) quantify the
workers who can work from home in Germany in about 56 percent of the labour force despite only half of them
actually did: among the most vulnerable groups, there are low-skilled and low-wage earners. In an early attempt to
analyse the impact on COVID-19 on the Italian labour market, Barbieri, Basso and Scicchitano (2020) use the Italian
equivalent to O*NET (Sample Survey of Professions), to identify the sectoral characteristics in terms of exposure to
infection and disease, physical proximity and possibility to work from home. Different from this paper, however,
Barbieri et al. build only relative measures of proximity risks and disease exposure and do not quantify the absolute
number of workers at risk. Adams-Prassl et al. (2020) study heterogeneity within-occupations in the feasibility of
working from home. Using large surveys from the US and UK, they find that the share of tasks that can be done from
home is not constant across workers within occupations or industries: their ability to work from home varies both
across and within occupations and sectors. Another aspect that has been explored is the impact of lockdown across
different type of workers. Yasenov (2020) provides evidence of the distributional effects of stay-at-home orders
caused by the pandemic in the United States: workers with lower wages, lower levels of education, young, ethnic
minorities and immigrants are less likely to work in occupations for which working from home is feasible. Using
survey data from the project REPEAT for a number of OECD countries, Foucault and Galasso (2020) documents
unequal lockdown effects across categories of workers. Low-educated workers, blue collars and low-income service
workers were more likely to have suspended working activities and low-educated workers less likely to work from
home. Over the lockdown weeks, a higher share of workers become active from home: highly educated workers and
white collars benefitted the most from such adjustments.
4|

Caiumi and Paccagnella (2020) by further analysing multiple dimensions of risks and provide
evidence for different countries with a special focus on the employment effects of the pandemic
and the subsequent challenges for labour market protections.
Mongey, Pilossoph and Weinberg (2020) also classify jobs in terms of feasibility of working from
home and proximity with other people. They empirically validate their classifications with data
from the American Time Use Survey (ATUS), which contain information on the habits of workers
before the pandemic. 2 Linking such indicators with information from the Bureau of Labor
Statistics Current Population Survey (BLS CPS) and the Panel Study of Income Dynamics (PSID),
they conclude that workers in occupations that cannot be done remotely and work in physical
proximity with other are more likely to be economically vulnerable (i.e. they are less likely to
have a college degree, to have health insurance, to have liquid assets, to be white, to be US
natives). They also find that metropolitan areas (MSA) with lower shares of employment in work-
from-home jobs before COVID-19 experienced smaller declines in mobility, as measured using
mobile phone data, and that those predicted to be employed in low work-from-home jobs
experienced greater declines in employment with respect to pre-pandemic months. As in much of
the literature on tasks (Acemoglu and Autor, 2011; Dingel and Neiman, 2020), our classification
is based on arbitrary choices of the questions and the thresholds imposed. Yet it differs
substantially from Mongey et al. (2020), among others, who inherently calculate relative measures
by taking as reference values the median of an (arbitrary index) weighted by occupational
employment. In this sense, the advantage of our categorisation is that of providing absolute
measures of safeness that can be used to quantify the workforce vulnerable to the COVID-19
labour market crisis. Our procedure leads us to identify, for instance, the most unsafe jobs within
an economy, rather than a set of unsafe jobs in relative terms. Relative categorization, instead,
would be particularly problematic in performing comparisons across countries (as we do), because
the very same occupation, even if carried out under the same working conditions in two different
countries, could be classified differently just because of differences in the occupational
composition of each economy.
Attempts to categorise occupations across multiple countries have also been made, although
mostly with a focus on developing economies. Saltiel (2020) looks at ten low- and middle-income
countries, using data from the World Bank Skills Toward Employability and Productivity (STEP)
survey (as information from O*NET surveys may not be representative of the task content of
occupations in developing countries). He finds that in the ten countries analysed only 13% of
workers can work from home and that the feasibility of working from home is higher in high-
paying occupations, and for workers who have higher levels of education, a formal contract, and
higher household wealth. Gottlieb, Grobovšek and Poschke (2020) analyse how the share of
workers that can work from home varies with a country’s income level. They build a micro level
dataset for 57 countries and find that the share of workers in urban areas that can work from home
is about 20% for poor countries, while it is about twice as high in rich countries. This is largely
due to the higher share of self-employed workers not able to work remotely in poor countries. Our
paper complements these works by looking at the richest economies, but also extend the
dimensions of risks to provide a more comprehensive analysis of the impact of COVID-19 on the
labour markets. In an early attempt to associate workers’ safety risk and actual contagion,
Lewandowski (2020) estimates country-specific levels of COVID-19 spread (from the Johns
Hopkins CSSE) and social contacts and diseases exposure indicators (built from O*NET and the
European Working Condition Survey data). Analysing 26 EU countries, he finds that higher levels
of occupational exposure to contagion are positively correlated with faster growths in COVID-19
cases and deaths, in particular for workers aged 45-64. Our classification of occupations predicts
2
 Hensvik, Le Barbanchon and Rathelot (2020) rely on the American Time Use Survey (ATUS) and compute the
share of hours actually worked at home in different occupations and industries. They conclude that 15% of total
working hours are carried out from home and that workers in high-skilled occupations work more hours at home than
workers in less skilled occupations.
|5

an array of employment outcomes in 2020, including leave of absence due to medical reasons for
those jobs associated to a higher proximity on the workplace (unsafe jobs).
Closely related to our work, a set of papers focused on the unequal effects of the pandemic on
different groups of workers. Alon et al. (2020a, 2020b) show that women are suffering the most
in terms of unemployment during the pandemic recession also because of childcare needs. Borjas
and Cassidy (2020) use CPS data and find that the negative employment shock caused by the
pandemic in the United States hit immigrants severely. They argue that this can be explained by
the fact that the rate of job loss rose for immigrants more than it did for natives (partly because
immigrants are less likely to work in occupations that can be performed remotely) and that job-
finding rate for unemployed immigrants fell compared to natives. OECD (2020a) also documents
that in the sectors most affected by the COVID-19 containment measures, non-standard forms of
employment are over-represented. Fasani and Mazza (2020) focus on immigrants in the European
Union. They find that in EU27 13% of immigrants are employed in “essential” occupations that
were not affected by the most restrictive lockdown measures. Migrants account for 20 percent or
more of employment in occupations like cleaners and helpers, labourers in mining and
construction, personal care workers, and food processors. We expand on this line of research by
including an array of different dimensions and by providing preliminary evidence on the ex post
consequences of the first pandemic wave by looking at data from different countries. To do so,
we also borrow from Fasani and Mazza the classification of “essential” occupations and interact
it with our own classification to provide a broader picture on the health and employment risks for
workers.
Finally, another line of research looks closely at the potential for reallocation of workers hit by
the pandemic crisis. Using data from the Survey of Business Uncertainty (SBU), Barrero, Bloom
and Davis (2020) quantify the short-term impact of the pandemic on workers’ reallocation, and
conclude that the COVID-19 shock caused 3 new hires for every 10 layoffs. According to the
authors much of this impact will persist, with 42% of recent layoffs that will become permanent
job losses. They also develop forward-looking excess job reallocation measures (the difference
between job turnover and net employment growth), which rise sharply after the beginning of the
pandemic. Hensvik, Le Barbanchon and Rathelot (2021) examine the impact of COVID-19 on
job search by analysing vacancies posted online in Sweden. They find heterogeneity in the
negative impact of the pandemic across industries and occupations, with occupations
characterised by less home-working suffering more. At the same time, they find that job seekers
search less intensively and redirect their search towards high home-working or more resilient
occupations. The policy implications of our paper are intertwined with the reallocation that will
occur during the transition and the post-pandemic recovery: the evidence from this stream of the
literature complements our findings on workers exposed to higher health and economic risks.

3. Classifying ex-ante epidemiological risk

In this paper, we classify jobs, defined as fine occupation categories, in four mutually exclusive
group of risk within the context of the COVID-19 pandemic. We define safe jobs as those that
can be carried out with a minimal risk of being infected and of spreading the virus. The first three
groups are based on a gradual definition of safety and the last is built as a residual containing jobs
that do not satisfy any definition of safeness, not even the least restrictive one, and thus can be
deemed “unsafe”.
The first group contains all occupations that can be potentially performed remotely. These jobs
do not require workers to leave their homes, nor to interact with co-workers or customers in
6|

person. This measure provides the most restrictive definition of safety, as it essentially reduces
the risk of work-related contagion to zero. 3
The second category relaxes slightly these constraints by adding jobs that require at most a low
level of physical proximity on the workplace. Arguably, these jobs do not pose significant risks
to workers’ health under a pandemic. Job-related contagion risk arises mainly from (rather
infrequent) interactions with co-workers.
The third category still requires a low level of physical proximity, but allows for the inclusion of
jobs that involve some interactions with external customers. The need to interact with external
customers potentially increases the size of the network the worker is exposed to, which is clearly
an important element to consider in the context of a pandemic. These jobs are likely characterised
by an element of “mobility”, either because the workers have to visit customers, or because
customers have to visit the workers. 4
We sketch here the procedure used to build our classification: the methodological details including
the questions considered and the conditions imposed are reported in Annex A. To assign
occupations to these four categories, we rely on data from the U.S. Department of Labor O*NET
survey, which contains information on the most distinctive traits of each job in the United States.
Building on the work of Dingel and Neiman (2020), and on our previous classification of
occupations (Boeri, Caiumi and Paccagnella, 2020), we first select 27 questions from the “Work
context” and “Work Activities” sections of O*NET database that, according to our judgment,
provide information on the feasibility of working from home. As in Dingel and Neiman (2020),
we classify a job as not doable from home if the average response of workers to an item is above
(or below, depending on how the question is formulated) a pre-determined threshold. The answers
to each item can take values ranging from 1 to 5, where higher values denote a stronger intensity
or higher frequency of the trait under scrutiny. If any such condition is not satisfied, we classify a
job as not suitable for remote working. For instance, if the average answer for a given occupation
to the question “How frequently does your current job require electronic email?” is lower than 3.0
(where 3.0 represents the option “once a month or more but not every week”), we consider that
job as not suitable for remote working; we therefore exclude it from the category home/remote
working.
The second category (low physical proximity) includes those jobs that cannot be carried out from
home, but entail low physical proximity and limited exposure to customers and to the public. 5 The

3
 In our classification, jobs that can be performed from home also include occupations whose conditions might not
be considered as safe once the presence on the workplace of full workforce will be restored. However, anecdotal
evidence tells us that in the future both the share of people performing working tasks remotely and the frequency with
which such arrangements will be allowed will increase. The impact of the pandemic is likely to be long-lasting on
this aspect, so that making a further distinction within jobs that can be performed from home do not add much depth
for the purposes of a reallocation analysis. Also, even several months after the start of the pandemic, the vast majority
of people whose jobs can potentially be done from home continue to be encouraged, when not forced, to do so (when
it is not the case, often rotating schemes for the personnel are in place, which greatly reduce contagion risk on the
workplace).
4
 Any job that cannot be done from home presents an additional risk factor related to commuting, which mechanically
increases the risk of infection by increasing human interactions. Unfortunately, the data we use do not contain
information on commuting habits (although we do look at some rough proxy such as whether people live in urban or
rural areas). This additional risk is therefore very difficult to quantify, also because it varies significantly in ways that
are difficult to predict with available data, such as whether the worker use private or public transportation, how much
time is spent in commuting, and whether the travel takes place at peak or off-peak hours.
5
 To identify the jobs belonging to the second and third categories (infrequent contacts with co-workers, and
infrequent contacts with co-workers and customers), we complement the set of questions used for the remote working
category with two other questions on physical proximity and contacts with public and customers from O*NET. In
particular, we use the question from the Work context section – “How physically close to other people are you when
you perform your current job?” (Q21) – and from the Work activities section – “How important is performing for or
working directly with the public to the performance of your current job?” (Q32). We use a 3.5 threshold for question
|7

third category (infrequent contacts with co-workers and customers) further relaxes this criterion
by allowing jobs reporting higher values for “Performing for or working directly with public”, as
such jobs may also require substantial exposure to external persons, while still maintaining low
physical proximity. On the contrary, any job that does not meet the criteria outlined above or that,
even when meeting those criteria, is potentially exposed to diseases or infection (according to
high value answers to the O*NET question “Work section – Average respondent says they are
exposed to diseases or infection at least once a month”) is classified as unsafe. 6
Having classified all occupations in one of these four categories for each job in the 5-digit SOC
classification, we then aggregate them into 3-digit occupational codes as follows. First, we map
O*NET occupations to SOC occupations through simple averages whenever the correspondence
is not 1-to-1. Then we proceed with mapping from SOC to ISCO, again following Dingel and
Neiman (2020): ideally, each SOC would map to a unique ISCO, so that we could simply calculate
the ISCO categories as a weighted average of SOC categories, using the BLS counts as the
weights. However, given the many-to-many mapping, this approach would put disproportionate
weight on those SOCs that happen to map to a larger number of ISCOs. To address this issue,
when a SOC maps to multiple ISCOs, we allocate the SOC’s BLS weight across the ISCOs in
proportion to the ISCOs’ employment shares in Europe. 7 Thus, for each ISCO 3-digit code, we
obtain a coefficient ranging from 0 to 1 proxying the employment share in each category of
risk/safeness: each ISCO occupation is then associated to the group with the highest employment
share.
For the US data, instead, we convert the occupational codes of the CPS to SOC codes, and we
link then our taxonomy directly at the SOC level, without walking through the ISCO
classification. 8 One caveat to this approach is that we start from the characteristics of US jobs,
namely technology and labour market conditions, and we map these to European jobs. This
exercise necessarily entails some measurement error as long as technology differs across countries

Q21 corresponds to “Work more distant than arm’s length”, and a 3.0 threshold for question Q32 corresponds to
“Performing for or working directly with public is important”.
6
 While it is true that the selection of survey questions to build any classification may be subject to arbitrary decisions,
our choice is not completely independent from scientific evidence on the spread of the pandemic. With the questions
available in O*NET, we were able, for instance, to assign greater contagion risk to jobs requiring contacts with people
from outside the usual set of co-workers and to assign to unsafe jobs occupations where the workplace distance
between co-workers is less than arm’s length.
7
 For instance, if a particular SOC has 100 US employees and is associated with two ISCOs that have respective totals
of 3000 and 1000 employees in a EU-LFS, we allocate 75 of the SOC’s US employees to the larger ISCO and 25 to
the smaller one. Those values of 75 and 25 are then used as that SOC’s weight when calculating the average across
all SOCs within each ISCO for that country. Lastly, it must be noted that this process makes the resulting ISCO
classification specific to Europe. We use data from the Employment Projections (EP) program by the U.S. Bureau of
Labor Statistics for the crosswalk as it provides the most comprehensive collection of occupation-level data in the
US. For this purpose, we focus on the base-year only (2018 in our case) whose data are actual employment figures
derived from the OES program, CES program, QCEW and CPS. Indeed, the advantage of using EP program’s data
is to cover the universe of US occupations hinging on a combination of sources: nonfarm wage and salary employment
is covered by OES, CES and QCEW, whereas agricultural industry employment, self-employed workers, and workers
in private households are covered by the CPS.
8
 In general, our analysis entails several crosswalks across classifications of occupations. The CPS classifies
occupations using the official Census Codes. The 2010 version of the Census Code was replaced in the CPS starting
in 2020 by the 2018 version. The Census Codes are mapped 1-to-1 into the SOC classification using the crosswalk
provided by the US Census. Similar to the Census Codes, the SOC2010 classification was updated in 2018 and the
CPS implemented the new version in 2020. We map SOC2018 into SOC2010 using the crosswalk provided by the
US Census. However, the SOC codes used in the Census crosswalk are an aggregate version of the complete
SOC2010 classification (which instead is used to crosswalk to ISCO). Consequently, we covert this classification
into the granular version of SOC. This is a one-to-many matching and we assume that each aggregate SOC code is
equally split (in terms of number of workers) into the granular SOC codes it corresponds to. As far as the SOC2010-
to-ISCO08 conversion is concerned, this is a many-to-many matching: again, we assume that when the same SOC is
mapped into multiple ISCOs, it equally splits; while, when more than one SOC are mapped into a single ISCO code
we do a summation (or a weighted average).
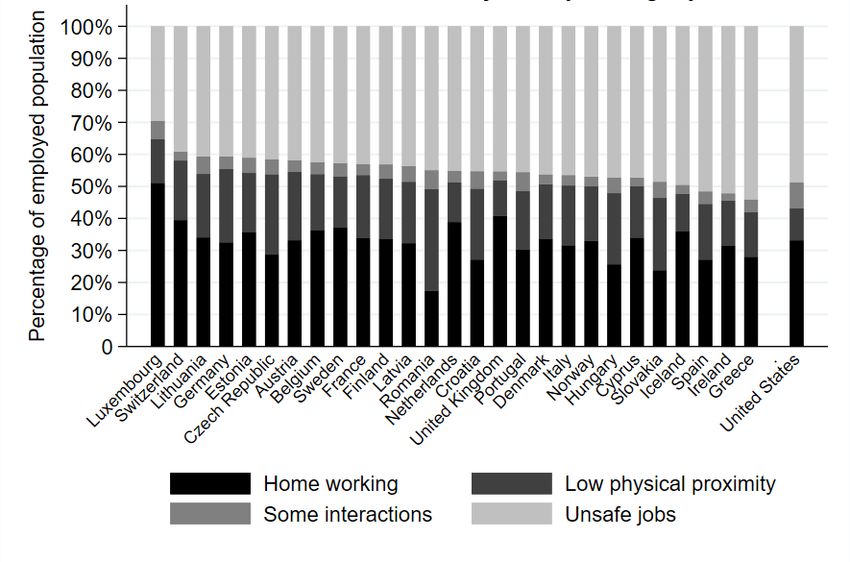
8|

and European occupations are carried out differently with respect to US ones. Thus, our results
need to be interpreted as if the US occupational technology was in place for each labour market
analysed. This crosswalk from O*NET to European labour markets is rather common in the
literature on “task-approach” to labour markets (Goos, Manning and Salomons, 2009).
Some occupations exemplify well the categories that we identified. 9 Examples of occupation
classified as safest as they belong to the remote working category, are information and
communications technology service managers (ISCO 133), finance professionals (241) and sales
and purchasing agents and brokers (332). Occupations belonging to the second safest group (low
physical proximity) are mixed crop and animal producers (613), blacksmiths, toolmakers and
related trades workers (722), wood processing and papermaking plant operators (817). In the third
category (infrequent contacts with co-workers and customers) we have social and religious
professionals (263) and heavy truck and bus drivers (833). Finally, a few examples of “unsafe”
occupations are medical doctors (221), primary school and early childhood teachers (234), nursing
and midwifery associate professionals (322), food preparation assistants (941), and waiters and
bartenders (513).
We would like to highlight two features of our classification. First, we opted for employing job
categories rather than a single continuous score, which would have required to introduce an ad-
hoc threshold along its distribution in order to distinguish between safe and unsafe jobs, making
even more difficult to characterise the set of safe jobs with multiple dimensions of risk. Second,
it is important to clarify upfront that this classification is necessarily based on the way jobs were
carried out in “normal times”, i.e. before the outbreak of the COVID-19 pandemic. This exercise
is therefore informative as to the number of jobs that will likely not require any major
organisational change. It is certainly possible that jobs that we are now classifying as unsafe will
be reorganised in ways that allow them to be performed at lower the risk of contagion, although
we are not yet in a position to assess the effects of these changes on productivity. A good example
is primary school teachers: we classify them as “unsafe”, because O*NET data tell us that
performing this job involves daily physical contacts with a large number of people, and still many
teachers have managed to switch to online lectures in many of the countries that have implemented
prolonged lockdown measures.
It is then natural to ask how many workers fall in the different categories we built. To answer this
question, we applied our classification of occupations to labour force survey data for 2019 for EU
countries (harmonised EU LFS data) and for the United States (CPS, averaging the 2019 12
monthly waves). 10
For each country, Figure 1 reports the share of workers (either employees or self-employed
persons) holding jobs that can be carried out from home (dark black portion of the bars), that
involve limited interactions with co-workers (dark grey portion) or with co-workers and customers
(light grey), and the residual category of unsafe jobs. The share of workers on jobs that can be
performed from home ranges from less than 20% in Romania to 50% in Luxembourg, with a
weighted average of 33% for the whole sample. The two intermediate categories of jobs that
cannot be carried out from home, but involve a limited number of personal interactions provide
employment to a relatively small fraction of the workforce (from 10% in the US and 11% in the
United Kingdom to 32% in Romania, and from 2% in Ireland to 6% Romania and 8% in the US,
respectively). “Unsafe” jobs are majoritarian in Spain, Ireland and Greece and are less than a third
of employment in Luxembourg (with a weighted average of 47% for the whole sample). Due to

9
 Detailed information on category coefficients for all ISCO 3-digit codes can be found in Annex A.
10
 We could not exploit data from Bulgaria, Malta, Poland and Slovenia due to missing information on many of the
dimensions analysed. The final sample is composed of 28 countries: Austria, Belgium, Croatia, Cyprus, the Czech
Republic, Denmark, Estonia, Finland, France, Germany, Greece, Hungary, Iceland, Ireland, Italy, Latvia, Lithuania
Luxembourg, the Netherlands, Norway, Portugal, Romania, the Slovak Republic, Spain, Sweden, Switzerland, the
United Kingdom and the United States.
|9

the limited relevance of the two intermediate categories, in the remainder we will often
concentrate on the two extreme categories of safe and unsafe jobs.

 Figure 1. Shares of jobs by category and country

 Note: The figure shows the percentage of workers holding a job belonging to the different categories of
 our taxonomy across the 28 countries of the sample. Data refer to 2019. Source: Current Population
 Survey (CPS) and European Labour Force Survey (EU LFS).

4. Comparing ex-ante and ex-post epidemiological and labour market risk

As stressed at the outset, our classification provides an assessment of potential job-related health
risk. One year after the pandemic hit OECD countries, it is possible to compare these ex-ante risk
assessments with actual, ex-post outcomes. This is important to evaluate the predictive power of
our classification, and to possibly use it in identifying measures that can mitigate the work-
contagion trade-off as well as in orienting the vaccination campaign. Information on actual job-
related epidemiological risk often becomes available when most decisions on actions to contain
the pandemic (e.g. lockdowns) and on the priorities for the vaccination campaign have already
been made. It is important to know if ex-ante risk assessments can offer a guidance to
Governments confronted with such hard decisions.
In this Section, we draw on information from multiple data sources and on the limited set of
countries for which data on ex-post job-related epidemiological risk are available. In particular,
we use administrative data from the Italian Work Injury Insurance (INAIL) and from the Italian
Social Insurance (INPS) administrations that were extracted for the first time for this study. We
also draw on household survey data on Italy, United Kingdom and the United States providing
detailed information on the use of remote working, reduction in working hours, sick leave and
wage adjustment during the pandemic.
It is clearly very hard to evaluate whether a person contracted the virus on the workplace or
elsewhere. Administrative data on claims for COVID-related fatal and non-fatal injuries provide
the best basis for such assessment. We were able to gain access to Italian data provided by INAIL
10 |

(the entity running the work accidents social insurance) at a sufficiently high level of
disaggregation by occupation. INAIL must carefully check the requirements for insurance
protection as the consequences and side effects must be compensated: these data provide therefore
the best available information on illnesses contracted at work. While the data are limited to one
country, Italy is also the OECD country with the longest history of pandemic and administrative
data on COVID-related work injuries, and these data seem to track pretty well the evolution over
time of the pandemic. According to such data, job-related contagion seems to have played a non-
negligible role in the spread of the virus: out of about 220,000 new infections registered between
March and May 2020 (i.e., during the first peak of the pandemic), about one-fifth originated work
injury claims. 11
Figure 2 displays the incidence of COVID-19 work injury claims processed by the Italian national
Work Injury Insurance administration in 2020 according to the four categories of ex-ante job-
related epidemiological risk defined in the previous section. There is clearly a very strong
concentration of risk in the category of (ex-ante) unsafe jobs defined by our classification. About
81% of all injuries concern 11 occupations in this category that represent 24.7% of total
employment in Italy. Claims for workers in occupations that, according to our classification, can
be carried out remotely or involve limited interactions with co-workers and customers are fairly
negligible.
 Figure 2. COVID-19 related work injuries by ex-ante job-related epidemiological risk

 Note: The figure shows the share of work injuries as reported in the claims data collected by the Italian
 Work Injury Insurance administration (INAIL) between January 2020 and January 2021. The
 occupation codes have been aggregated according to our taxonomy. Source: INAIL COVID-19 claims.

11
 The contagion data are available from the National Health Institute (ISS) at
https://www.epicentro.iss.it/coronavirus/bollettino/Infografica_29maggio%20ITA.pdf (in Italian, last accessed on
March 18, 2021). The work injury report due to COVID-19 are published by INAIL at
https://www.inail.it/cs/internet/comunicazione/news-ed-eventi/news/news-denunce-contagi-covid-31-maggio-
2020.html (in Italian, last accessed on March 18, 2021).
| 11

Another source of information on the actual spread of the virus among workers comes from
sickness benefit claims to the Italian Social Insurance administration (INPS). This data source
presents three limitations. The first issue is that privacy rules prevent to have information on the
nature of the illness inducing the sickness benefit claim. We deal with this problem by taking the
difference with the reported sickness leave claims over the same month in 2019. The implicit
assumption is that the time profile of this difference captures the effects of the pandemic, in terms
of both the spread of the virus among workers and the use of remote working to reduce the risk
of contagion. The second problem is that INPS data are available only by sector, as occupations
are not reported in the sickness benefit claims to social security. We had therefore to transform
our occupation-based into a sector-based classification of risk by calculating the occupational
distribution across sectors (obtained from the Italian Labour Force Survey) and assigning each
sector to any of the four category of risk of our taxonomy based on the prevalent occupation group
in that sector. The third problem is perhaps the most serious: the coverage of social insurance in
the case of sickness benefits, unlike work injury claims, is not conditional on where the person
was infected, i.e., whether at the workplace or elsewhere. Hence, we can attribute the different
incidence of sickness leave to job-related epidemiological risk only insofar as the non-job related
contagion risk is distributed uniformly across workers over the four categories of our
classification. As this is probably unrealistic (as persons operating remotely or benefitting from
short-time work and leaves of absence are likely to be infected only outside their usual workplace),
we bring in another dimension of heterogeneity across jobs, notably the distinction between
essential and non-essential activities.
We draw on a list of essential occupations developed by Fasani and Mazza (2020), which
identifies the occupations that need to be performed even during a pandemic in order to keep
citizens healthy, safe and fed. The list of such “key” occupations can be found in Table A.4 in
Annex A.
With the above caveats in mind, Figure 3 shows the evolution of average daily sickness benefit
claims across four groups of sectors depending on the incidence of safe versus unsafe occupations
and on the relevance of essential or non-essential activities in these sectors. Sickness leaves appear
to replicate the two waves of the pandemic: there is a peak in March-April 2020 and then again in
November of the same year. More importantly, sectors with most jobs that can be carried out from
home according to our classification display a lower number of sickness benefit claims with
respect to same month in 2019 throughout the entire 2020, and the decline is more marked since
February, that is, after the pandemic outbreak. The opposite happens for unsafe jobs, notably for
unsafe jobs in essential occupations, which register a strong increase with respect to the same
month of 2019 during the two waves of the pandemic.
12 |

 Figure 3. Sickness benefit claims by job-related epidemiological risk

 Note: The figure shows the year-on-year (2020 on 2019) relative variation in sickness benefits for
 each month as reported in the claims data collected by the Italian Social Insurance administration
 (INPS). The sectors are classified according to our taxonomy based on the most prevalent occupation
 group calculated from the Labour Force Survey data. The definition of “essential” and “non essential”
 occupation is taken from Fasani and Mazza (2020) as described in the text. The vertical dotted line
 shows the date of the first COVID-19 case in Italy. Source: INPS sickness benefits claims.
Labour Force Survey (LFS) data also offer valuable information on ex-post job-related
epidemiological risk. An advantage of LFS data is that they cover a wider range of labour market
outcomes (as well as workers’ and jobs’ characteristics), thus allowing to validate our
classification against a number of theoretical predictions. One obviously important outcome is the
extent to which workers were actually able to work from home during the pandemic. Another
outcome is the recourse to short-time work schemes, which are a reasonable proxy for the labour
market risk generated by health policy measures. Ex-post job-related epidemiological risk has
relevant interactions with working hours reductions, which took place suddenly and at
unprecedented levels during the pandemic. Most OECD countries introduced severe lockdown
measures to contain the spread of the pandemic, closing down entire sectors, subsidizing short-
time work on a large scale as well as extending parental leave (also to cope with school closures),
and other forms of leave of absence. Only firms providing a well-defined range of essential
services were allowed to operate at full capacity throughout the pandemic. Even where severe
lockdown measures were not undertaken, the fear of contagion kept consumers away from a wide
range of non-essential activities concentrating work reductions therein.
While comparing ex-ante and ex-post epidemiological and labour market risk we will draw once
more on the distinction between essential and non-essential activities transforming de facto our
fourfold classification of job-related epidemiological risk into an eightfold taxonomy of risks, as
visually characterised in Figure 4.
| 13

 Figure 4. Taxonomy of occupations, health and labour market risks

 Note: The figure shows the eightfold taxonomy of job-related epidemiological and
 labour market risk as described in the text.

We expect working from home to increase during the pandemic in those activities that can
potentially be carried out remotely, independently of whether or not they contribute to essential
services. Lockdown measures and the fear of contagion are likely to have concentrated working
time reductions in terms of short-time work schemes and leaves of absence in non-essential and
unsafe jobs. Sick leaves can be expected to have increased most notably in essential and unsafe
jobs. In presence of a rigid (derived) labour demand for these sectors and contracting labour
supply due to the fear of contagion, wages could also have increased in essential and unsafe jobs. 12
These predictions can be tested based on LFS data for Italy and the UK and CPS data for the US
covering the second quarter of 2019 and of 2020, thus comparing the middle of the first wave of
the pandemic with the same quarter the year before. We estimate a simple linear probability model
on the outcomes of interest as follows:

 , , = + � , + � � ∗ , � + , + (

 ∗ , ) + , , ′ + , ,
 (1)
where i stands for the individual, o for the occupation, j indicates the category of risk according
to our classification (the omitted group is home working; we aggregated the two intermediate
groups of occupation for easing the reader). post is an indicator equal to 1 for the second quarter
of 2020 (and 0 for the second quarter of 2019), and X are individual and job characteristics. 13

12
 There is evidence that workers are redirecting search away from risky occupations (Hensvik, Le Barbanchon and
Rathelot, 2021).
13
 We include as controls individuals’ age and its square, dummies for the level of education also interacted with age
and its square, dummies for immigrant status, gender, the number of children (also interacted with gender), sector
and working time arrangement, whether part-time or full time (the coefficients are not reported, but available upon
request). The table does not report also the estimated effects on the risk group not interacted with the post dummy
14 |

The data come from three different sources, and we did our best to select variables that are as
comparable as possible across countries. In particular, short-time work schemes are designed
differently in the three countries: for Italy, that has long-established STW, we use an indicator for
the Cassa integrazione guadagni; for the United Kingdom, which introduced the scheme during
the pandemic, we use a dummy indicating whether the respondent has worked fewer hours than
usual because of layoff, short time, or interrupted work for economic reasons; finally, for the US,
we use a dummy that, following CPS guidelines, identify workers on temporary layoff, i.e.
individuals on layoff or absent from work, who either already know the date in which they will
be recalled to work or that expect to be recalled within six months.
The definition of sick leave is more comparable across countries, as we use a dummy indicating
whether the worker was absent from work (in the UK, worked fewer hours than usual in the
reference week), because of illness or personal health issues.
Unfortunately, information on working from home is available in the US data only starting in May
2020: as a consequence, we cannot interact it with the post dummy in Equation 1. The associated
coefficients in Table 1 thus refer to occupation categories, not interacted with the post dummy.
The results of this exercise are presented in Table 1. We then run the same set of regressions on
separate subsamples of essential and non-essential workers, and we present those results in Table
2.
Four sets of results are worth highlighting. First, in all countries there has been a substantial
increase in the percentage of persons working from home. This phenomenon has been driven by
workers having precisely those jobs that we classify as having the highest potential for remote
working. For instance, in Italy the probability of working from home has increased by more than
30 percentage points (from a baseline level in 2019 of about 5%) and this boom is almost entirely
explained by jobs that can be done in “remote working” according to our classification. In the UK
the increase in remote working has been milder (+5 percentage points) and once more this
development has been driven by those jobs that we classify as “remote working” jobs. For the US
we cannot estimate the increase with respect to 2019, but for May and June 2020 the results clearly
indicate that the probability of working from home is much higher for jobs that we classify as
suitable for remote working.
Second, short-time work (STW) has also increased substantially in the aftermath of the COVID-
19 outbreak in non-essential activities. The increase in this case is stronger in the UK (+26
percentage points) – a country without a tradition in STW and leaves of absence – than in Italy
and the US. More importantly, the strongest increase in the use of these measures reducing
working hours is observed in unsafe and non-essential jobs. In Italy and in the UK, the increase
for this category of jobs is about 7-8 percentage points higher than for non-essential jobs that can
be done from home (3 percentage points in the US, see Table 2).
Third, the large increase in sick leave observed in all countries has been driven everywhere by
what we label as unsafe jobs in essential activities, and, to a lesser extent, by jobs that cannot be
carried out in remote, but involve a limited number of interactions with co-workers and customers.
In particular, in the US the increase in sick leave relative to the pre-COVID-19 period is about
one percentage point higher than for jobs that can be carried out remotely. Interestingly, results
from Italy are similar and even more striking: the increase in sick leave for workers in unsafe jobs
is 5 percentage points higher than for home workers, twice as much for workers in low proximity
jobs. For the UK, instead, the results on sick leave are more mixed and do not allow to depict a
clear pattern.

because of space constraints. All the regressions are weighted by sample weights and standard are robust to
heteroskedasticity.
| 15

Fourth, the results for wages in Italy show an interesting pattern: despite a general drop, essential
occupations show a marked increase in hourly wages in the order of 3 percent in 2020. A similar
pattern, but not statistically significant and smaller in magnitude can be observed also in the US.
This result, although suggestive, based on just one quarter of data and available only for
employees, is also in line with the predictions of our classification as we expect these wages to
result from broadly unchanged labour demand (or even an increase in demand) and a decline in
labour supply, due to the fear of contagion.
In interpreting this set of results across countries, one should not forget that the evolution of the
pandemic has not been the same in all of them. Italy was most severely hit in the Spring,
implemented very strict containment policies, and then had an extremely low incidence over the
Summer, where most economic activities resumed as normal. The United States, on the contrary,
were hit with a few months lag, and contagions were higher during the Summer. In the UK, the
pandemic hit also with a lag, and cases remained at a higher level than Italy throughout the
Summer. We can replicate the same set of regressions presented in Tables 1 and 2, looking at the
third quarter of 2019 and 2020 (see Tables A6 and A7 in the Annex). Results for the probability
of working from home, for short-time work schemes and for the incidence of sick leaves are
mostly similar to those observed in the second quarter. On the contrary, we do not see any more
an effect on wages in Italy, while we do see a (relative) increase in hourly wages for unsafe jobs
in the United States.
Overall, the available evidence on job-related epidemiological risk as well as on labour market
adjustment after the COVID-19 is broadly supportive of the predictive power of our classification
of unsafe jobs. Our ex-ante risk assessments well capture the actual distribution of COVID-19
related work injuries and sick leave both in administrative and in survey data. When interacted
with a list of essential activities to be carried out even during the most severe lockdown measures,
our classification contributes to explaining the heterogeneity in labour market adjustment across
different margins (shift to remote working, hours, leaves of absence and wages) during the
pandemic.
Based on these findings we believe that characterising the distribution of unsafe jobs across
worker and firm characteristics is particularly useful from a policy standpoint as the classification
highlight areas of vulnerability that should be possibly addressed before such risks materialize.
16 |

Table 1. Ex-ante risk and ex-post labour market outcomes
 Work from Home Short-time work Sick leave Log Wages
 (1) (2) (3) (4)
 Italy
 Post 0.315** 0.076** 0.053** -0.017**
 (0.006) (0.003) (0.003) (0.005)
 Post*Low proximity -0.314** 0.069** 0.028** -0.022**
 (0.007) (0.005) (0.004) (0.008)
 Post*Unsafe jobs -0.303** 0.068** 0.043** -0.033**
 (0.006) (0.004) (0.004) (0.007)
 Essential -0.037** 0.020** 0.009** 0.052**
 (0.003) (0.002) (0.002) (0.005)
 Post*Essential 0.118** -0.068** -0.045** 0.030**
 (0.005) (0.004) (0.003) (0.007)
 R2 0.254 0.086 0.045 0.311
 N 95,432 95,432 95,432 72,012
 Mean of dep. var. 0.046 0.002 0.008 9.25
 UK
 Post 0.057** 0.261** -0.033** 0.009
 (0.004) (0.006) (0.004) (0.013)
 Post*Low proximity -0.038** 0.079** -0.003 0.014
 (0.006) (0.012) (0.010) (0.024)
 Post*Unsafe jobs -0.051** 0.071** -0.018** 0.018
 (0.004) (0.008) (0.006) (0.018)
 Essential -0.006* 0.028** -0.000 0.022*
 (0.003) (0.003) (0.006) (0.011)
 Post*Essential 0.002 -0.058** 0.006 -0.006
 (0.004) (0.008) (0.007) (0.017)
 R2 0.093 0.168 0.040 0.382
 N 75,847 29,540 29,540 16,767
 Mean of dep. var. 0.057 0.003 0.077 15.70
 US
 Post 0.026** 0.002** 0.064**
 (0.001) (0.001) (0.010)
 Post*Low proximity -0.181** 0.005** 0.006** 0.002
 (0.006) (0.002) (0.001) (0.015)
 Post*Unsafe jobs -0.222** 0.029** 0.007** -0.012
 (0.005) (0.002) (0.001) (0.013)
 Essential 0.008+ 0.003** 0.001 0.047**
 (0.004) (0.001) (0.001) (0.008)
 Post*Essential -0.011** -0.001 0.011
 (0.002) (0.001) (0.012)
 R2 0.297 0.032 0.006 0.250
 N 80,643 289,522 289,522 64 806
 Mean of dep. var. 0.330 0.004 0.006 25.56
Notes: The table reports the estimated coefficients of equation (1) calculated on the Italian and the UK Labour Force Survey
and on the US CPS. The sample period is the second quarter of 2019 and of 2020: the dummy post stands for the second
quarter of 2020. Data on Work from Home for the US are only available for May and June 2020: the coefficients shown in
the table are therefore not interacted with a post-Covid dummy. The occupation categories are those described in the text:
the omitted category is remote working. We control for age and age square, the level of education also interacted with age
and its square, immigrant status, gender, the number of children (also interacted with gender), sector and working time
arrangement (part-time or full time; the coefficients are not reported, but available). The table does not report also the
estimated effects on the risk groups not interacted with the post dummy because of space constraints. The mean of the
dependent variable is computed as the baseline level in the 2nd quarter of 2019. All the regressions are weighted by sample
weights and standard errors are robust to heterosckedasticity. * and ** denote significance at 5 and 10 percent level,
respectively.
You can also read