LARGE 2017 REPORT CARNIVORES - Kora
←
→
Page content transcription
If your browser does not render page correctly, please read the page content below
PROVINCIA
AUTONOMA
DI TRENTO

                 REPORT

   2017
  LARGE
CARNIVORES

            grandicarnivori.provincia.tn.it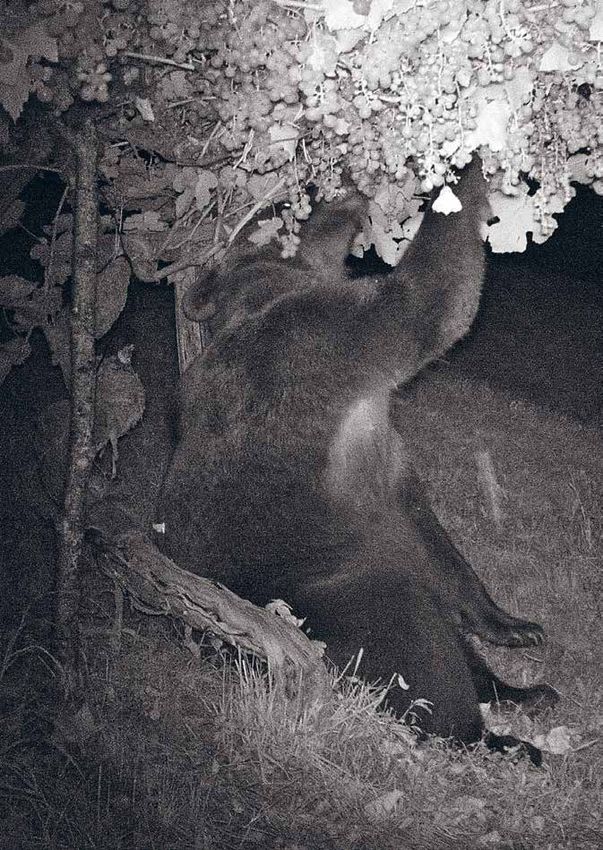
PROVINCIA AUTONOMA
             DI TRENTO
   PROVINCIA AUTONOMA
        DI TRENTO

APT FORESTRY AND WILDLIFE DEPARTMENT
         Large Carnivores Division

2017 LARGE
CARNIVORES
REPORT

grandicarnivori.provincia.tn.it
grandicarnivori@provincia.tn.it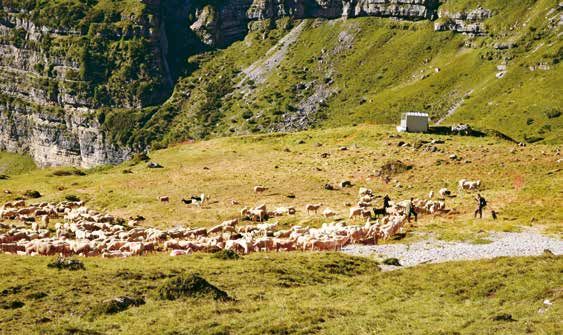
Supervision
Maurizio Zanin - Manager of the APT Forestry and Wildlife Department

Coordination
Claudio Groff

Edited by
Fabio Angeli
Daniele Asson
Natalia Bragalanti
Claudio Groff
Luca Pedrotti
Renato Rizzoli
Paolo Zanghellini

With the contribution of
Museo delle Scienze di Trento (MUSE), Parco Naturale Adamello Brenta (PNAB),
Parco Naturale Paneveggio - Pale di San Martino (PNPPSM), Istituto Superiore per la Ricer-
ca Ambientale (ISPRA) and the Fondazione Edmund Mach (FEM).

Recommended Citation
“Groff C., Angeli F., Asson D., Bragalanti N., Pedrotti L., Rizzoli R., Zanghellini P. (editors), 2018.
Large Carnivores Report, Autonomous Province of Trento’s Forestry and Wildlife Department.”
All the graphs, maps and all the data contained in this report may be quoted, making reference
to the above citation.

Cover page
“Bear, wolf and lynx captured by a camera trap in Trentino in 2017”
Photos: Matteo Zeni (bear), Ivan Stocchetti (wolf), Tullio Balduzzi (lynx) - APT Forestry
and Wildlife Department Archive

Back cover
Photo by Ivan Stocchetti - APT Forestry and Wildlife Department Archive

Photos without captions
APT Forestry and Wildlife Department Archive

Layout and graphics
APT Large Carnivores Division - Publistampa Arti grafiche

Printed in 200 copies by:
Print centre of the Autonomous Province of Trento
Trento, April 2018

Digital version at:
grandicarnivori.provincia.tn.it/Rapporto-grandi-carnivori-2017/
CONTENTS

THE BEAR
1. Monitoring                                             page.    5

  Box 1 - Systematic monitoring with camera traps         page.    7

  Box 2 - Ecology of the brown bear population:
  the usefulness of the various types of available data   page.   15

2. Damage compensation and prevention                     page.   20

  Box 3 - Damages by bears: type and trend                page.   21

3. Management of emergencies                              page.   27

4. Communication                                          page.   33

5. Staff training                                         page.   35

6. National and international networking                  page.   37

THE WOLF
1. Monitoring                                             page.   40

2. Damage compensation and prevention                     page.   42

3. Communication                                          page.   45

4. Staff training                                         page.   47

THE LYNX                                                  page.   48
The information provided in this report derives from the work of many people, to whom we
express our most heartfelt thanks: Forestry Service personnel, staff of the involved Parks, fo-
rest wardens, gamekeepers from the Associazione Cacciatori di Trento, volunteers and others.
2017 LARGE CARNIVORES REPORT

                                      THE BEAR
    Concerning the bear, the provincial Government sets out the operational guidelines in Resolutions
no. 1428 and no. 1988 of 21 June 2002 and 9 August 2002. Specifically, six Programmes of Action
were identified (Monitoring, Management of Damages, Management of Emergencies, Staff Training,
Communication and National and International Networking), to which this section refers.

1. Monitoring
                                                                 Bear Monitoring (photo 1) has been contin-
                                                             uously carried out by the Autonomous Province
                                                             of Trento (APT) since the 1970s. Over the years,
                                                             together with the traditional survey techniques
                                                             in the field, radiotelemetry (a method first used
                                                             in Eurasia in 1976), automatic video controls by
                                                             remote stations, camera traps and finally, since
                                                             2002, genetic monitoring have started to be used.

                                                                 Genetic monitoring is based on the collec-
                                                             tion of organic samples (hairs, scats, saliva and

Photo 1 - Monitoring activity (C. Groff - APT Forestry and
Wildlife Department Archive)

tissues) and is implemented using two methodol-
ogies.
    Systematic monitoring is based on the use
of traps made with barbed wires and scent bait,
designed to “capture” bear hairs, while oppor-
tunistic monitoring is based on the collection of
organic samples found in the area during routine
activities, at damage sites and by checking rub
trees (photo 2).
    Systematic monitoring follows a planned and
standardized sampling protocol organized at a
spatial and temporal scale, with the purpose to
estimate the number of individuals present in the
area without necessarily “capturing” all of them
through genetic testing. A correct sampling proto-
col allows to apply statistical models able to quan-
tify the average probability of a bear being genet-
ically “captured” in the most effective way. In the
last few years, genetic monitoring has represented           Photo 2 - Monitoring of rub trees (C. Groff - APT For-
the key technique for collecting information on the          estry and Wildlife Department Archive)

                                                                                                                      5
2017 LARGE CARNIVORES REPORT
bear population inside the province of Trento. The monitoring was conducted in 2017 as well, for
the sixteenth consecutive year, coordinated by APT Forestry and Wildlife Department, with the
collaboration of FEM, ISPRA, PNAB, MUSE, Trentino Hunters Association (ACT) and volunteers.
In particular, during 2017 systematic monitoring was carried out at 78 sites, from 23 May to
17 October. This provided 241 organic samples out of a total of 749 samples collected; of these,
466 were analyzed. According to the theory of a progressive extension of the area used by the pop-
ulation, the sampling area of the systematic monitoring was extended, including the northern and
southern parts of western Trentino (respectively a new site in Sole valley, one in the upper part of
Non valley and four new sites in Rendena valley and in the Giudicarie).
For the second year, thanks to the collaboration of the Autonomous Province of Bolzano, the
Province of Brescia and ERSAF (Regional Institution for Agriculture and Forestry), the systematic
monitoring area was extended to areas adjacent to the Non valley in the province of BZ (14 sites),
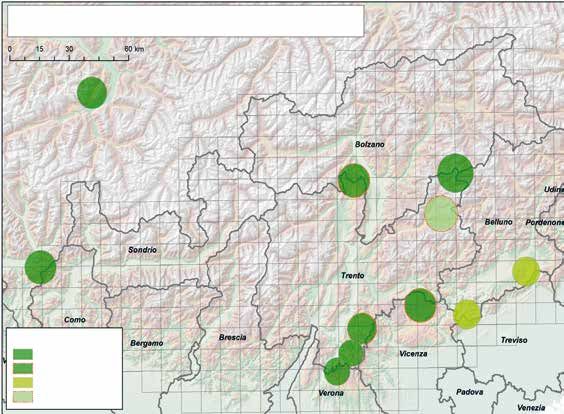
Valcamonica, Caffaro valley, Trompia valley and the upper Lake Garda area (9 sites) (Figure 1). 6
further samples were collected at the new sites. As shown in Figure 1, most of the organic samples
collected using hair snare traps are concentrated in the central part of the sampling grid, where
density and level of presence of the bears are higher.
Further samples were col-
lected in an opportunistic
manner outside the province,
contributing to determine the
total number of bears identi-
fied belonging to the central
Alps brown bear population;
the relative data were kindly
provided by the Autonomous
Province of Bolzano, the Au-
tonomous Region of Friuli
Venezia Giulia, the Univer-
sity of Udine, Department of
Agrarian, Environmental and
Animal Science, the Lom-
bardy and Veneto Regions
and the Provinces of Brescia
and Sondrio.
The data were yearly col-
lected and processed, with ref-
erence to the solar year (1/1
– 31/12), which effectively
coincides with the “biological
Figure 1 - Geographical distribution
of the areas in which the hair snares
were set and checked in 2017; red
circles show successful genetic de-
termination for hairs collected using
systematic monitoring; green circles
represent successful genetic deter-
mination of organic samples collect-
ed in the context of opportunistic
monitoring
62017 LARGE CARNIVORES REPORT
year” of the bear, allowing to get an overview of the situation just before the new births and during
the period of bears least activity.
It is nevertheless implicit that the cited monitoring techniques do not guarantee the detection
of all the bears present in the area. However, retrospective reconstruction of the population and
the application of statistical methods to systematic and opportunistic monitoring, allow to provide
population estimates.
In 2017 genetic testing was carried out in a fully coordinated manner by the Conservation Ge-
netics Research Unit of the Fondazione Edmund Mach for samples collected within the Province of
Trento and by ISPRA for some fast analyses of samples from the Province of Trento and for samples
collected in the remaining territory.
In 2017 systematic monitoring based on the use of camera traps continued, the updates being
illustrated in the following Box 1.
BOX 1 - Systematic monitoring of large mammals using camera traps. Up-
date of the third year of sampling
This box presents some of the results, with particular reference to those on brown bears,
of the long-term wildlife monitoring program through the systematic use of camera traps,
begun in summer 2015 and repeated in 2016 and 2017. The project is included in the agree-
ment between APT and MUSE for the monitoring of large carnivores. The monitoring protocol
adopted, which is characterised by the systematic nature of the sampling and the reliability
of the data generated, derives from the positive experience gained from the use of camera
traps to study the use of rub trees by bears, carried out in 2011, 2012 and 2013, with the more
general objective to monitor the whole community of medium-sized and large mammals over
time. Here we provide some results on brown bears obtained in 2017, with purely descriptive
report of the results obtained in previous years.
The study area (around 220 km2), defined during the starting phase of the project in 2015,
was selected in order to represent the elevation gradient and the forest habitats of the area,
and overlaps partially with the Parco Naturale Adamello-Brenta (PNAB) and the core area of
the brown bear population, the target species of greatest interest in the study. In accordance
with the protocol, in summer 2017 the sites chosen in 2015 were sampled again, using Reco-
nyx HC500 camera traps. Set at over 60 points (Figure A) and active for at least 30 consecutive
days each, the cameras were originally used at 30 sites for a month and then subsequently
transferred to the remaining 30 sites for a further month. The sampling stations were at
around 1.5-2.5 km from one another, on footpaths or forest roads, in order to be represent-
ative of all the elevation bands between 500 m and 1900 m. The cameras were attached to
trees opposite to the footpath/road, at a distance of 2-4 metres. They were set to photo mode
(3 consecutive shots per passage), continuously working mode, and equipped with a memory
card of at least 4 GB, which can store several thousand images.
According with previous years, in 2017 the sampling was carried out from 4 June to 24
August, with a total of 2001 camera days (average of 33.9). Two camera traps were stolen
during the sampling period. One of the stolen camera traps was replaced, because it was
stolen before the routine monitoring surveys. This allowed to include the site in the analysis,
with a total of 59 sites usable for statistical purposes in 2017. The cameras recorded a total of
72017 LARGE CARNIVORES REPORT
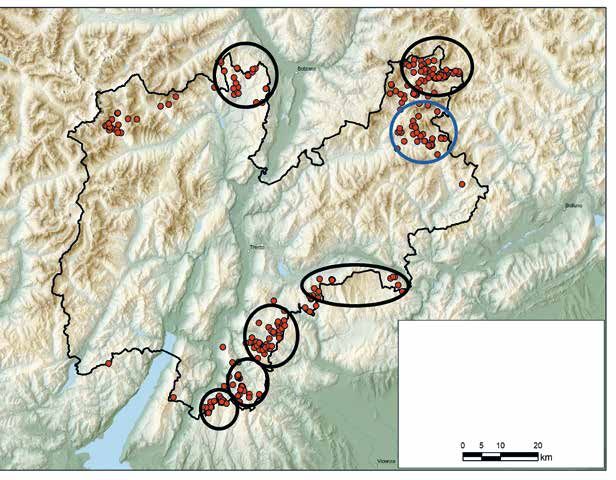
Figure A - Map of the 60 camera trap sites in the study area in 2017. The territory of the Parco Naturale Adamel-
lo-Brenta is shown in green
70,547 images, of which 16,059 were images of wild mammals belonging to 9 species. Once
again, the presence of domestic species and of man (on foot and in vehicles) was recorded
and quantified as well. In addition, to register the number of sites where each species was
recorded, and the ratio with the total number of surveyed sites (naïve occupancy), the number
of “independent events” for each species was calculated. This was obtained eliminating se-
quential images from the calculation, because they refer to a single event (as in the case of an
animal remaining in front of the camera and generating several images), considering a stand-
ard interval of time (15 minutes). Events are, therefore, a more informative and comparable
measurement of the frequency of passage than the number of images. In 2017 the presence
of the brown bear was recorded at 23 out of the 59 overall sites, with 43 independent events
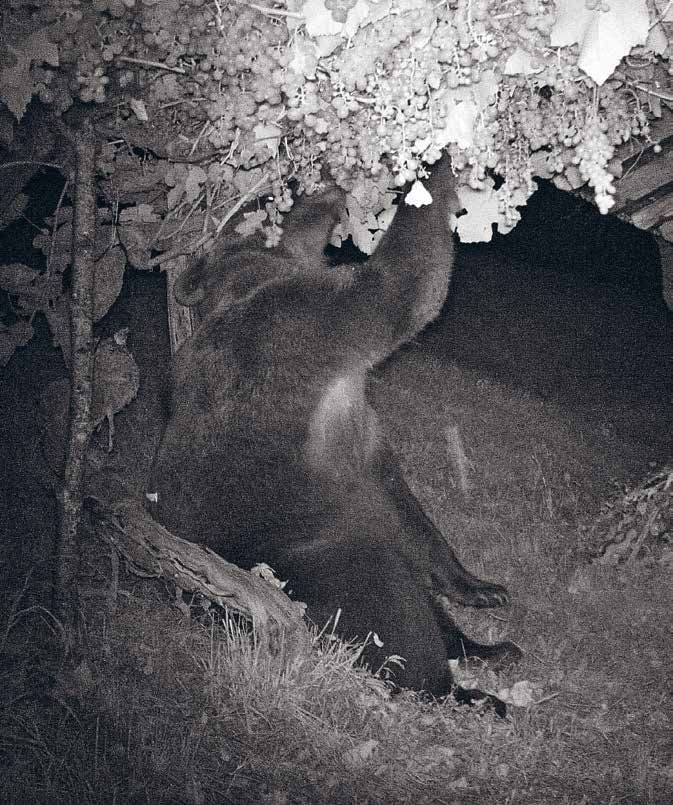
Photos A and B - Images of brown bears taken by camera traps in 2017
and a maximum of 4 at a single site. 4 camera traps recorded 4 events, distributed over the
two positioning grids. The results were consistent with those for both 2016 and 2015, which
recorded 22 and 20 sites respectively, with 51 and 39 independent events, with a maximum of
7 events at a single site in 2016 and 6 in 2015. There were 7 sites of passage identified in allthe
three years (Figure B and Graphs A, B and C).
Besides the bear, the presence of a number of other mammals was recorded: fox, roe
deer, red deer, chamois, hare, marten, badger and squirrel (in descending order in terms of
events). Once again there were no events involving the wolf, photographed only by a camera
trap in summer 2015 in the Val Algone, in a single occasion.
Finally, it should be pointed out that, while representing a significant amount of data, three
years of sampling do not allow to obtain temporal trends for the presence of the studied spe-
82017 LARGE CARNIVORES REPORT
Figure B - Map of camera trap sites and events involving brown bears in cies, including the bear. With
the study area in the 2015-2017 three-year period, within the systematic
monitoring project
at least five consecutive years
of data, it will be possible to
begin investigating temporal
dynamics for the populations,
thus distinguishing between
real trends and normal annual
oscillations.
During 2017 a study show-
ing the results of the analysis
on the data collected in the
first year of systematic mon-
itoring (2015) was published,
and described distribution
and rate of daily activities of
the species photographed
with camera traps. The study
investigated in particular the
response of different wild
species to different types of
anthropogenic disturbance in
terms of distribution in space
and time. One interesting re-
sult for the bear, already not-
ed in the 2016 Bear Report,
concerns the “contactability”
of the species, namely the
ease with which the species
can be recorded. The results
show that the probability of
detecting the “presence” of
BEAR EVENT NO. OF SITES NAÏVE OCCUPANCY
60
50 25 0,5
40 20 0,4
30 15 0,3
20 10 0,2
10 5 0,1
0 0 0
2015 2016 2017 2015 2016 2017 2015 2016 2017
Graphs A, B and C - Camera trap events involving brown bears in the period 2015-2017 : respectively, number of
independent events, number of camera trap sites and naïve occupancy (ratio between sites where the species was
caught on camera and the number of sampled sites)
92017 LARGE CARNIVORES REPORT
the brown bear increases with the increase of the distance from inhabited areas and decreas-
es with the increase of human passages, confirming that the bear tends to avoid men. Further
analysis of the effect that the presence of men has on bear presence, and more generally on
competition between wild species, namely the effect that the presence of certain species has
on the distribution of others, is currently under analyses by MUSE researchers and staff.
For further information: Oberosler V., Groff C., Iemma A., Pedrini P. and Rovero F., 2017.
The influence of human disturbance on occupancy and activity patterns of mammals
in the Italian Alps from systematic camera trapping. Mammalian Biology-Zeitschrift für
Säugetierkunde.
Preliminary data on the presence of dogs in the area used by bears
A brief analysis of data regarding the presence of people accompanied by dogs in the areas
systematically monitored with camera traps is presented here. The subject is interesting,
given the relevance that the presence of dogs can have in relation to the risk of aggressive
behaviour by bears.
All the images showing dogs obtained during the three-year period 2015-2017 (645) were
considered in the study, distinguishing between dogs on and off the leash. Thus the rare
cases of free ranging dogs not accompanied by men were excluded, considering only dogs
photographed together with their owners or at a short distance from them.
The results showed a clear prevalence (78%) of cases involving loose dogs as compared to
dogs on the leash (22%) (Graph D).
LOOSE DOG
Graph D - Number of events
involving the passage of dogs
DOGS ON THE LEASH at camera trap sites during the
three-year period 2015-2017, re-
200
spectively loose and on the leash.
160
Number of events
120
80
40
0
2015 2016 2017
The presence of dogs off the leash represents a risk factor in the event of close encounters
with a bear, something that should be limited as much as possible. It should also be consid-
ered that free-ranging dogs are more likely to disturb wildlife in general.
By Valentina Oberosler, Aaron Lemma and Francesco Rovero MUSE - Museo delle Scienze
102017 LARGE CARNIVORES REPORT
Status of the bear population in 2017
Definitions
• “Cubs”: bears between 0 and 1 year of age;
• “Young bears”: males between 1 and 4 years of age and females between 1 and 3 years of age;
• “Adults”: males with more than 4 years of age and females with more than 3 years of age, consid-
ered sexually mature and capable of reproducing;
• “Effective population”: portion of the population capable of participating in reproduction;
• “Detected bears”: bears whose presence has been assessed during the last year, either genetically
or on the basis of repeated and unequivocal observations (for example linked to telemetry data);
• “Undetected bears”: bears not detected only in the last year;
• “Dispersal”: movements by bears born in this territory (western Trentino) outside their core area.
The dispersal movements are concentrated parcticularly in the western part of Trentino, without
reaching the territory usually frequented by bears belonging from the Dinaric-Balkan bear popu-
lation;
• “Emigration”: the movements by bears present in Trentino, towards the territory usually fre-
quented by bears belonging to the Dinaric-Balkan bear population;
• “Immigration”: the arrival of bears from the Dinaric-Balkan bear population in the territory
where the Trentino bear population permanently live.
Data processing for the 2017 have provided the following information about the identification
of bears, the minimum population size, the population size estimate, the estimate of the number of
litters, the survival rate, the population dynamics and the habitat use.
It has to be highlighted that the graphs regarding bear demography have been updated not only
by entering data for the last year, but also by adding and elaborated data of the previous years on
bears that were not detected in the past years but were identified again in 2017 and which, thus, are
considered “present” in the previous years as well. This explains the differences that can sometimes
112017 LARGE CARNIVORES REPORT
be found comparing graphs of previous Reports. The data updates published every year in the offi-
cial Report are therefore constantly ongoing, this meaning that the new graphs and data analyses
have necessarily to be considered as the new overview, replacing the old ones.
Bear cubs
In 2017 the presence of 8 new litters during the year was estimated, with a total of 11-13 cubs.
The estimate was obtained through genetic analyses and through their geographic distribution, to-
gether with data from direct observations of female bears with cubs recorded during the year (photo
3). Nine of these cubs, were genetically determined and assigned to the cub category on the basis
of paternal analysis, while one was observed in images from a camera trap, associated with genet-
ic identification of the mother,
one on the basis of direct obser-
vation, and two were observed
during an infanticide. Thus the
estimate of alive cubs at the
end of autumn 2017 is 9-11.
Furthermore, thanks to ge-
netic analyses, 17 bears not
detected in the past years were
detected, during 2017, one
of which was found dead. Of
these, 8 bears were identified as
one-year-old individuals, thus
born in 2016.
Photo 3 - Female bear with cubs (APT Forestry and Wildlife Department
Archive)
Dead bears
In 2017 the death of four
bears was recorded.
Two cubs (perhaps three)
were killed by a male bear
in Val Ceda on 11 April 2017
(photo 4).
The female bear KJ2 (aged
15) was shot on 12 August
2017, in compliance with an
extraordinary emergency order
for public safety reasons. Photo 4 - Male bear with a cub in its mouth (A. Caliari - APT Forestry and
Wildlife Department Archive)
122017 LARGE CARNIVORES REPORT
Finally, the female bear F19 (aged 5) was
found dead between Fai and Mezzolombardo on
18 August 2017, the cause of death being unknown
(photo 5).
Thus from 2003 up to the present day, 33 bears
belonging to the central alpine population (thus
including those outside Trentino) died. In 10 cases
they died for natural causes (30%), in 15 cases
the cause of death was human-induced (45%)
and in 8 cases the cause is unknown (25%). It
should be underlined that these figures do not re-
flect either the total number of dead bears, nor the
real ratios in terms of death cause, considering the
Photo 5 - Bear found dead between Fai della Paganella different likelihood of retrieval (for example, it is
and Mezzolombardo (D. Asson - APT Forestry and Wild- much easier to find bears hit by vehicles on roads
life Department Archive) than those dying from natural causes).
Thus, the deaths of 15 of the 25 bears dead for known causes, can be attributed to man: 27% died
for illegal killings (4), 46% died accidentally (7) and 27% due to authorised shooting (4, of which
one in Germany, two in Switzerland and one in Trentino).
Graph 1
Mortality causes (2003-2017 - no=33)
7
6 HUMAN
UNKNOWN
5 NATURAL
No. of bears
4
3
2
1
0
2003 2004 2005 2006 2007 2008 2009 2010 2011 2012 2013 2014 2015 2016 2017
Year
Graph 2
Survival rates
Survival rates by age class (2002-2017)
The new data available al- 100
95,5
low the update of the survival 95
91,7 90,7
89,7
rates for the three different 90
85,7
87,9
91,8 91,3
age classes, for the two sexes 85
% survival
87,0 Females
(Graph 2). The data refer to a 80 Males
16 years (2002-2017) period 75 General
during which it was possible to 70
record survival or death of 110 65
different bears, with 549 pas- 60
sages from one year to another cubs youngs adults
Age classes
(549 bear-years).
132017 LARGE CARNIVORES REPORT
Status
Considering the difficulty of acquiring complete and reliable data on births, it is appropriate not
to include the cubs in the estimate of the minimum certain number of bears.
Based on this criterion, the minimum certain number of young and adult animals present in
2017 was 43, of which 20 males and 23 females (Graph 3) (sex ratio M-F 0.87:1 - n = 43).
Graph 3
Population structure at the end of 2017
17
16 females
15
14 males
13
12
Age (in years)
11
10
9
8
7
6
5 sexual maturity of males
4 sexual maturity of females
3
2
1
KJ1
MJ4
MJ5
MJ2G1
JJ4
DG3
M4
F2
F3
F4
M7
F7
F8
F9
F12
M15
M18
M19
M22
F13
F14
F16
F24
M29
F15
M31
M47
F20
M38
M48
M42
M43
F25
F26
F28
M46
M49
M50
M51
F32
F33
F34
F35
Bears
At the end of 2017 the population structure (excluding cubs) was, thus, as follows: 26 adults
(60% - 10 males and 16 females) and 17 young bears (40% - 10 males and 7 females). The average
age of known bears (excluding cubs) was 5.17, with a significant difference between males (4.7)
and females (5.6).
Taking into account the number of cubs born in 2017 (9 - 11, as reported above), and the in-
dividuals not genetically detected only in the last year (9), the overall population estimate, thus,
is within a range of 52 - 63 bears.
Estimate of the number of young and adult bears is also calculated by applying capture, marking
and recapture (CMR) models deriving from systematic and opportunistic monitoring. The relative
data significantly contribute to increase the knowledge on the bear population status and trend.
Trend
The population trend for young and adult bears (again excluding cubs) is shown in Graph 4.
The columns show the minimum certain numbers of young and adult bears determined year by
year, updated and supplemented on the basis of data acquired in subsequent years.
The graph also shows the past estimates recorded year by year, represented by the red interval
(minimum certain number and estimated number, also considering bears absent for only one year,
again excluding cubs); the respective figures effectively provide a “snapshot” of each season, not
modified by the supplementary data of the following monitoring.
It also shows the trend for the so-called “effective population” (Ne), calculated by considering
142017 LARGE CARNIVORES REPORT
the number of reproductive males, plus the number of reproductive females, divided by two
(as they can usually reproduce in alternate years).
Graph 4
Population trend 2002-2017 without cubs
60 20
minimum certain number serie 3
estimate recorded during the year 18
50
16
Effective population
No. of bears
40 14
12
30 10
8
45 43
20 40 41
37 6
33
27 29
26 4
10 20 20
14 12 2
8 9 10
0 0
2002 2003 2004 2005 2006 2007 2008 2009 2010 2011 2012 2013 2014 2015 2016 2017
Year
BOX 2 - The ecology of the brown bear population: the usefulness of the various
types of available data
Reliable estimates of the density of individuals and the space use (size of the home
range) helps to understand processes regulating ecological dynamics for the brown bear
in the central Alps in terms of space and time. Understanding these processes is in its turn
highly relevant for improving and adjusting actions for the management and conservation
of the species.
Obtaining reliable estimates of density and the space use is notoriously difficult for an
elusive species such as the brown bear. Its elusiveness and the limited funding for moni-
toring can have a negative effect on the quality of the data collected. The possibility of sup-
plementing information from different sources mathematically is particularly interesting
for investigating the aforementioned processes at population level. Furthermore, oppor-
tunistic data, i.e. collected outside sampling standard protocols, can represent a further
source of information, whose reliability however has not been investigated for the species.
In the case of the brown bear, this regards opportunistic data coming from the collection of
organic samples, allowing the identification of individuals through DNA testing.
In 2017 the MUSE-APT collaboration led to the publication of an article* presenting an
analytical approach able to integrate (i) spatial capture-recapture data systematically col-
lected (from hair traps and rub trees), (ii) spatial capture-recapture data opportunistically
collected and (iii) telemetry data. The framework was applied for the first time to data col-
lected in 2013 for the brown bear population in the central Alps, and was used to check the
extent of the information collected through the three aforementioned techniques. In other
words, the analytical approach developed by MUSE-APT allowed to test the compatibility
152017 LARGE CARNIVORES REPORT
of different types of data, quantitatively checking whether the different methods provide
consistent information about density and extent of the brown bear home range.
The results of the study show that simultaneous analysis of the three types of data can
increase precision, that is reduce uncertainty, when estimating density and space use by the
brown bear. In particular, even if referred to a few individuals, the addition of telemetry and/
or opportunistic data to systematic capture-recapture data (from hair traps and rub trees)
can improve density estimates, as long as the telemetry and/or opportunistic data contain
information about space use, similar to those provided by data coming from hair traps and
rub trees. Although telemetry provides more informative data on space use, in terms of mul-
tiple georeferenced locations for each collared animal, it is often applied to a very limited
number of individuals. Therefore, opportunistic data from organic samples, appropriately
supplemented by systematic data from hair traps (and eventually rub trees) can represent an
important source of information for estimating space use and density of animals, even in the
absence of telemetry data. Indeed, compared to telemetry data, systematic and opportunistic
data are generally characterised by a smaller number of georeferenced locations per individ-
ual, but have the advantage of belonging from a much higher number of animals compared to
those usually fitted with a collar. Each data source, thus, has advantages and disadvantages,
but data systematically collected (for example with hair traps) are the basis of the analyses
that allow to estimate the population size, and on a long-term basis, the demographic param-
eters that regulate the population, although these data can be affected by the behaviour of
each individual, which make the location data not representative of the real space use.
* Tenan S., Pedrini P., Bragalanti N., Groff C., Sutherland C. (2017), Data integration for in-
ference about spatial processes: A model-based approach to test and account for data in-
consistency. PLOS ONE 12(10): e0185588. https://doi.org/10.1371/journal. pone.0185588
Territory use
39 of the 43 bears recorded in 2017 were detected in the territory of Trentino. 4 adult males
were only detected outside the province: M29 in Switzerland, M4 in Friuli V.G., M47 in Lombardy
and M48 in the province of Bolzano. 4 of the bears present in Trentino were also present in neigh-
bouring provinces/regions, particularly M18 and M31 in Lombardy, M19 in Veneto and M22 in the
province of Bolzano.
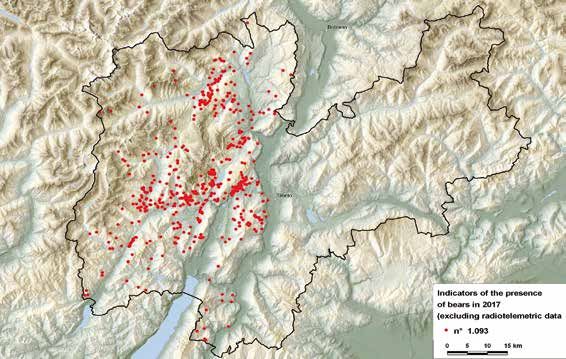
The 1,093 signs of presence of bears collected in the province of Trento during 2017 (all
recorded signs, with the exception of those from GPS monitoring of 3 collared bears) are shown
162017 LARGE CARNIVORES REPORT
Figure 2 - Reports of bears in the province of Trento in 2017
Figures 3, 4 and 5 Home range of F4, DG3 and M18 in 2017
in Figure 2. No data were collected for eastern
Trentino (for the second consecutive year).
In 2017 3 adult bears - F4, DG3 and M18 –
were monitored using satellite telemetry. Their
home ranges, calculated using the minimum con-
vex polygon (MCP) method, are shown in Figures
3, 4 and 5 (respectively between the Paganella
and Monte Bondone for F4, in the southern Brenta
area for DG3, and again in the Paganella-Bondone
area, with a wide movement westward, during
autumn, up to the Bergamo Alps for M18).
172017 LARGE CARNIVORES REPORT
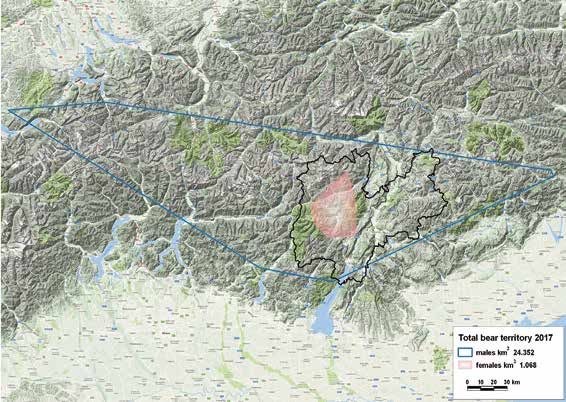
Area occupied by the bear population
Considering also the longest journeys made by young males, the population of brown bears in
the central Alps was distributed over a theoretical area of 24,360 km² in 2017 (Figure 6). The
area permanently occupied by the female bears is considerably smaller (1,068 km²) and entirely
situated within the province (western Trentino). The occupied areas were estimated using the mini-
mum convex polygon method, applied to 100% of the validated signs of presence. This leads also to
include large areas not suitable and/or not actually used, especially within the macro-area covering
the movements of young male bears.
Figure 6 Area occupied by bears in the central Alps in 2017 (shown in blue) and, within it, the area occupied by female
bears (highlighted in pink)
Area frequented by bears
2017
TOTAL AREA: 24,360 km²
AREA OCCUPIED BY FEMALES: 1,070 km²
Population density
The population density of the area occupied by the females (1,068 km2) was 3.3 bears/100
km (35 bears, excluding the cubs of the year). This data should be read according to the following:
2
• the density refers to a dataset collected over a long period of time (a solar year), therefore, the
number of bears present in the area at a certain moment, which would provide a datum closer to
the real average density, would likely be lower;
• some bears (males) frequented also areas outside the range occupied by the females in the consid-
ered time interval. This also makes the effective density lower than the indicated one.
182017 LARGE CARNIVORES REPORT
Figure 7 Number of bears identified in each sector of This density may be locally different, as it is
western Trentino during 2017
partly evident in Figure 7, which shows the min-
imum number of bears, excluding cubs, identi-
fied with certainty (through genetic analyses or
telemetry) in each sector of western Trentino.
Many animals were present in more than one
sector, also depending on the different sea-
sonal trophic availability, and therefore, may
have been identified in several of them. Con-
sequently, the total minimum number assessed
inside the province and neighbouring areas in
2017 remains 39 bears (excluding cubs) and,
thus, summing data from the individual sectors
would make no sense.
Dispersal
During the years 2005-2017 episodes of
dispersal (see the definition on page 11) were
documented, involving 34 bears (all of them
males). 16 of them (47%) died or disappeared,
9 (26.5%) returned, 2 (6%) emigrated and 7
(20.5%) are still roaming. No dispersal by
females born in Trentino has yet been docu-
mented.
192017 LARGE CARNIVORES REPORT
2. Damage compensation and prevention
With a forty-years experience on compensation and prevention of damages caused by brown
bears, the APT since 1976 has reimbursed damages by bears up to the 100% of the material value.
It is also possible to acquire prevention tools (mostly electric fences or livestock guarding dogs).
The relative regulations (article 33 of provincial law no.24/91), have been revised and updated sev-
eral times over the years, also on the basis of rules imposed by the provincial government with the
resolution no. 1988 of 9 August 2002.
With resolution no. 697 of 8 April 2011, the provincial government further reviewed the regu-
lations for damage compensations, foreseeing the compensation of ancillary expenses as well, and
extending the compensation tho damages caused by lynx and wolf up to the 100% of their value.
Prevention is implemented mostly following two main lines of action: funding covering up to
90% of the cost of the prevention tools or gratuitous loans. The support/consultancy given to farm-
ers through the activities of zootechnical officers, mentioned below, should also be mentioned.
Compensation for damages caused by bears
In 2017, 216 reports of presumed damage caused by bears were forwarded to the Forestry and
Wildlife Department.
154 claims for compensation were received by the department. In the remaining cases the claims
for compensation were cumulative claims for several damage reports (48) or compensation was not
claimed (14).
Of the 154 claims, 144 were accepted and 10 were rejected (in 3 cases the preventions tools were
not used, while in 7 cases the deadline for claiming compensation was not respected).
In 95% of cases the damage claim was followed by an inspection by forestry staff, who drew up
a report.
The total amount for the compensation of damages caused by brown bears in 2017 was € 82,979.54,
of which € 22,708.44 for damages to apiaries, € 43,421.32 for damages to crops, € 15,544.65 for dam-
ages to livestock (photo 6) and
€ 1,305.13 for other damages.
In 99 cases (46% of the
overall assessed damages), it
was possible to identify with
certainty the bear involved,
thanks to genetic analyses of
the organic samples collected.
Generally, 30 different geno-
types were identified (15 males
and 15 females), representing
58% of the population detected
in 2017. Considering only bears
with more than one year of age,
12 (6 females and 6 males) were
Photo 6 - Sheep preyed upon and eaten by a bear (V. Calvetti - APT Forestry and
Wildlife Department Archive) detected at a single damage site,
202017 LARGE CARNIVORES REPORT
5 (4 females and 1 males) at 2 damage sites, 2 (male M49 and female JJ4) at 3 damage sites,
3 (males M7, MJ4 and MJ4 and female F7) at 4 damage sites, 3 (female KJ2 and males M31 and M43)
at 5 damage sites, 1 (male MJ2G1) at 6 damage sites, 1 (male MJ5) at 9 damage sites and 1 (female
KJ1) at 12 damage sites.
The damages to vineyards (consumption of products) and cherry orchards (consumption of
products and damage to plants) was financially significant. It seems that some areas and assets are
more exposed to damage risk, by their nature or due to their location. The protection of assets dam-
aged by bear, when technically possible, will be a focus priority in these areas.
Graph 5 shows the trend of damags caused by bears and the amount of compensations.
Graph 5
Compensation for damages caused by bears 1990-2017
140.000,00 240
Euro
N. of cases of damage
120.000,00
N. of cases of damage 190
100.000,00
80.000,00 140
Euro
60.000,00 90
40.000,00
40
20.000,00
-10
1990
1991
1992
1993
1994
1995
1996
1997
1998
1999
2000
2001
2002
2003
2004
2005
2006
2007
2008
2009
2010
2011
2012
2013
2014
2015
2016
2017
Year
BOX 3 – Damages by bears: types and trends
After 19 years from the first release of bears in the province it is possible to draw up a
concise balance sheet of the damages caused by bears, their intensity and the total compen-
sations paid.
A correct and constant collection of data
over time is crucial for the Province admin-
istration, to ensure a prompt and efficient
support and compensation. The constant
work and dialogue with the people whose
crops,apiairies or livestock have been dam-
aged by brown bears must have the aim of
improving the conditions for a human-bear
coexistence.
The costs annually covered by the Prov-
ince administration for damage compensa-
Graph A - Relationship between the total amount of dam-
tions have clearly risen with the progres-
age compensations annually paid and the estimate of the sive increase of bears in the area (Graph
number of bears in the population. A). However, the relationship between the
212017 LARGE CARNIVORES REPORT
increase of damage compensations and the increase of the bear population size does not
seem to be consistent.
Over time, the “average cost” in terms of damage per bear has, indeed, progressively
decreased. The graph also highlights some irregular annual peaks in terms of damage, due
to several factors, including the presence of particularly damaging bears in some years
(which have a noticeable effect in a small
population) and the different availability of
natural food (e.g. beech tree nuts) in the
years.
It is interesting to compare what was
foreseen by the Feasibility Study, carried
out to support the reintroduction project,
and what has effectively occurred in terms
of damages. In the cited study, a quantita-
tive framework of the damage amount that
could have occured in relation to the pop-
ulation growth and to different scenarios
in terms of population “harmfulness” was
provided, estimated on the basis of real
Graph B - Evolution of the amount of bear damage com- data regarding other European bear popu-
pensation paid over the years lations. The study provided trends for min-
imum, medium and maximum scenarios of
possible damages; Graph B shows the min-
imum and medium scenarios of the Fea-
sibility Study with the real numerical evo-
lution of the Trentino population in terms
of compensation, demonstrating that it is
close to the medium scenario of the Study
(Graph B).
When representing the economic impact
percentage of the main assets damaged in
the last 18 years, beekeeping, livestock and
crops, in this order, represent almost all
the events (Graph C). It is also worth point-
ing out that for beekeeping and livestock,
Graph C - Percentage distribution of the amount of dam- the concept of a predatory event is usually
age compensations, divided by the main types of assets well-defined in terms of time and space,
affected and is individually assessed and recorded,
whereas for crops, the damage usually con-
sists of several events that are summed up and recorded as a single event at the time of
the inspection. Overall, 38% of predatory events were linked to apiaries, 35.4% to livestock,
19.9% to crops and 6.5% to other categories. The “others” category includes all the events
in which the main damage was to facilities and materials.
In terms of predatory events causing damage to livestock, 49% of them concerned
sheep, 11.2% goats, 3.8% cattle, 5.7% equines and 25.5% poultry, confirming that sheep
and goats are the domestic animals with major predation risk (Graph D).
222017 LARGE CARNIVORES REPORT
In terms of financial compensation,
damages to sheep and goats represents the
most significant category (57.2%), although
the number of predatory events is low-
er than that for other categories, damage
to cattle represents 16.4% of the total and
damage to equines 12%.
When considering crops, orchards are
the mostly damaged category (51.9%), fol-
lowed by vineyards (28.6%), maize (10.4%)
and damage to other crops (9.1%). Con-
cerning the amount of compensations paid,
Graph D - Number of events involving damages to live-
stock orchards are even more significant (66.8%),
because, sometimes the bears damage the
plants (Graph E).
Graph E - Amount of compensations for damages to crops
232017 LARGE CARNIVORES REPORT
Prevention of damages by bears
In 2017, 129 applications to ask for prevention measures (electric fences and guarding dogs)
to protect livestock (cattle, equines, sheep and goats) and beekeeping assets from brown bears
were sent to the Forestry and Wildlife Department. Of these, 112 were processed by the District
Forestry Offices by gratuitous loans: 78 were
designed to protect beehives and 34 for livestock
custody (photo 7). The overall cost amounted to
€ 65,000.
The remaining 17 applications were processed
by the Large Carnivores Division through capital
grants. The total amount was around € 7,150 and
mainly concerned electric nets and fences, along
with guarding dogs.
The long-term trend for the number of preven-
tion measures provided and the relative costs are
Photo 7 - Prevention measures (D. Asson - APT Forestry shown below (Graph 6).
and Wildlife Department Archive)
Graph 6
Prevention measures provided from 1989 to 2017 for protection from bears
70.000 140
Euro
60.000 120
N. of cases of damage
N. of measures
50.000 100
40.000 80
Euro
30.000 60
20.000 40
10.000 20
- -
1989
1990
1991
1992
1993
1994
1995
1996
1997
1998
1999
2000
2001
2002
2003
2004
2005
2006
2007
2008
2009
2010
2011
2012
2013
2014
2015
2016
2017
Year
Since 2016 a further financial instrument allowing the provision of prevention measures through
funding is the Rural Development Plan (PSR), Measure 442 “Traditional fences in wood, resto-
ration of stone walls and prevention of damage by wolves and bears”. Through this measure, it is
possible to fund, among other things, fixed structures to defend beehives (Bienenhaus) and electrifica-
tion systems for damage prevention. The protection system typology is essentially the same adopted by
the Province of Trento for prevention tools provided through loans/funding. In 2017 two fences were
funded, they will be completed during 2018 (total of c. 1660 m of electric fence), with a total cost of
€ 58,800.
242017 LARGE CARNIVORES REPORT
Livestock guarding dogs
Guarding dogs are used to protect livestock from attacks by wolves and bears; the first two
dogs in Trentino were delivered to a sheep and goat farmer in Val di Non in 2014 (see the 2014
Report, page 43). Since then, the use of guarding dogs has steadily increased.
In 2017 6 applications for the provision of 7
dogs were presented to the Forestry and Wild-
life Department; of these, 5 applications were
accepted and 1 was rejected. In total, funding
of around € 3,500 was provided to purchase 6
dogs (2 of these will be delivered in the first
few months of 2018). The animals provided
were purchased from specialist/certified breed-
ers belonging to ENCI (Ente Nazionale Cinofilia
Italiana), guaranteeing health standards and
genetic lines with an attitude for the job. By the
end of 2017 a total of 13 guard dogs, used main-
ly to defend against bears, had been delivered
by the APT.
Photo 8 - A vet examines a guarding dog (D. Asson - APT
Forestry and Wildlife Department Archive)
Once again in 2017, with the assistance of a
specialised vet and thanks to funding from the
project LIFE DINALP BEAR (photo 8), a series
of behavioural assessment visits were carried
out on the delivered dogs, aiming at evaluating
their health and learning progress, but also to
provide useful information to the farmers.
Furthermore, during 2017, thanks to fund-
ing from the LIFE DINALP BEAR Project the
Forestry and Wildlife Department produced a
sign (photo 9), created to provide information
about the guarding dogs protecting flocks and
about the correct behaviors to keep in their
presence. Photo 9 - Informative sign (D. Asson - APT Forestry and
Wildlife Department Archive)
Meetings with the interested economic categories
In 2017 the dialogue already started in the past years with the economic categories most affected
by the presence of bears and other large carnivores in the territory continued.
The Round Table with representatives of breeders, farmers and beekeepers met twice, on 8
May and on 21 November 2017.
252017 LARGE CARNIVORES REPORT
Support to livestock farms
Supporting the presence of shepherds and of flocks/heards on alpine pastures is one of the
objectives of the provincial administration. The presence of the shepherd and the adoption of the
most appropriate damage prevention systems, along with fair compensation and constant dialogue
with the Forestry personnel in the area, are fundamental to guarantee coexistence between large
carnivores and livestock in the mountains. These objectives are also pursued through the activities
carried out by the zootechnical officers.
In 2017 support to shepherds continued and was consolidated, and they were provided with fenc-
es (105 cm high) and fence electrifiers of adequate power (2.6 joules), with rechargeable batteries
fuelled by solar panels.
Overall, a total of 50 Alpine pastures, 25 of which agreed to get prevention measure (photo 10)
during the grazing period (usually from June to September), were supervised and supported by the
zootechnical officers. In total, the initiative concerned 12,842 sheep and goats, 62 equines and
124 cattle.
Furthermore 4 prefabs were transported up to the mountains to enable the shepherds to stay
close to the flock at night.
The results were once again good: for mountain pastures equipped with prevention measures
only 3 attacks on protected livestock were recorded, leading to an overall assessed loss of 4 sheep,
namely 0.03% of protected livestock at alpine pastures.
As it was in the previous years, it was thus confirmed that the correct use of prevention measures
(electric fences and guarding dogs), the presence and expertise of shepherds and the constant con-
sultancy and support provided by the zootechnical officers allow to reduce damages.
Photo 10 - Alpine pasture equipped with electric fence and prefab for the shepherd (D. Asson - APT Forestry and
Wildlife Department Archive)
262017 LARGE CARNIVORES REPORT
3. Management of emergencies
In the province of Trento the management of emergencies is a field of action in which it has
been necessary to work since long ago, and more specifically in relation to the presence of bears
considered “problematic”.
A problem bear or a bear in critical situations, can be subject of control actions, in accordan-
ce with the European rules (Directive 92/43/EEC – Habitat Directive) and national regulations
(D.P.R. 357/97, article 11, paragraph 1; L. 157/92, article 19, paragraph 2; L. 394/91, article 11,
paragraph 4 and article 22, paragraph 6).
Indeed, in order to reduce the conflict with human activities and for reasons of public safety
or for other compelling reasons of significant public interest, the possibility of an exception to the
ban to capture or kill wild protected animals is foreseen, with the authorisation of the Ministry
for the Environment, Land and Sea (MATTM), having consulted ISPRA, if there are no other
practicable solutions and if the exeption to the ban does not affect the favourable conservation
status of the populations of the protected species (D.P.R. 357/97, article 11.1). If the public safety
is at risk, capturing or killing an animal can also be ordered by the President of the Province, with
an extraordinary emergency order, according to articles no. 52.2 of the DPR of 31/8/1972, no.
670 and no. 18.2 of the L.R. of 4/1/1993 no. 1, as specifically allowed by the PACOBACE.
With resolution no. 1.523 of 7 September 2015 the provincial government set up a Technical
Committee including representatives of MATTM, ISPRA and APT and a Technical Operations
Group (with APT, MUSE and PNAB) to manage the bear and other large carnivores within the
province (hence in relation to all fields of action, not just for the management of emergencies).
Both have continued to operate profitably during 2017.
The PACOBACE (Interregional Action Plan for the Conservation of the Brown Bear in the
Central-Eastern Alps) represents the reference document for the management of emergencies
in the province of Trento (and in the rest of the Italian Alpine region), on the basis of which the
Forestry and Wildlife Department has identified, trained and equipped the responsible personnel.
Operational organization is carried out by the Provincial Forestry Service (PFS), of the Forestry
and Wildlife Department, through an On-call Special Unit, included in the official availability
system, according to weekly turns involving a coordinator and, from 1 March to 30 November one
emergency team with two people involved (on-call 24 h/day), along with veterinary personnel
from the Azienda Provinciale per i Servizi Sanitari (APSS) – the Provincial Health Services Office–
whenever necessary. The latter are essential for all the activities involving bear handling (injured
bears, captures etc.).
During 2017 the coordinators received 830 calls regarding possible damages by bears (225)
or wolves (68), direct sighting or evidences of possible signs of presence (191 for bears, 54 for
wolves and 2 for lynx), predations on wild animals (44 for wolves, 2 for bears), potentially pro-
blematic situations (40) or other issues (204).
In 2017 there were no real problems linked to confident animals, with the exception of one
case in the Municipality of Comano Terme, where a male bear insistently frequented farming
areas in the immediate vicinity of the towns of Lundo, Poia and Comano, to feed on cherry and
peach trees or beehives.
272017 LARGE CARNIVORES REPORT
Activity of the Emergency Team
The activities of the Emergency Team were carried out from 6 March to 27 November 2017 with
a total of 33 call-outs (Graph 7). Only in two cases the team members implemented direct aversive
actions to discourage the animal (use of rubber bullets).
Graph 7
Emergency team call-outs 2002-2017
90
Brackets contain the
(5)
80 number of direct (15)
No. of interventions
70 interventions on bear
60 (6) (2)
50
40 (6)
(7) (2) (8) (2)
(4) (2)
30
(0) (0)
(1) (1)
20 (0)
10
0
2002 2003 2004 2005 2006 2007 2008 2009 2010 2011 2012 2013 2014 2015 2016 2017
Year
Close encounters between men and bears
During the year there was one attack on humans and two cases of aggressive behaviour.
On 22 July 2017 a man was attacked; he was out, walking, accompanied by his dogs at a place
called “Predara”, about two km away from Terlago and had a close encounter with a female bear
which attacked him. The man was pawed and bitten, he got injuries to his arms and legs requiring
hospitalisation. On the following day, the President of the Autonomous Province of Trento issued
an extraordinary emergency order for reasons of public safety, in accordance with the provisions
of the PACOBACE, which provided for:
• intensive monitoring of the area where the incident took place;
• genetic identification of the bear responsible for the attack and its recognition by fitting it with
a radio collar;
• removal of the animal.
Collection of organic samples (saliva taken from the clothes of the attacked person) allowed
to determine that the aggression was certainly carried out by KJ2, a 15-year-old female bear hav-
ing two cubs and which had already attacked a man during summer 2015. A capture session, to
identify the bear and enable recognition of the animal was implemented and was successful on 1
August 2017; subsequent genetic testing confirmed that the animal captured, fitted with a collar
and released was KJ2.
In compliance with the provisions of the extraordinary emergency order, issued for reasons of
public safety by the President of the Autonomous Province of Trento, the bear was shot on Monte
Bondone on 12 August 2017.
According to the application of the guidelines drawn up by APT, in collaboration with ISPRA
in 2014, specific monitoring with camera traps and hair traps was organised for KJ2’s two cubs,
their identity having been genetically confirmed. The cubs were detected several times, up to the
282017 LARGE CARNIVORES REPORT
second half of October, always
in the Monte Bondone area
and showing good physical
conditions (photo 11).
From last November the
two cubs probably reduced
their activities as winter ap-
proached. The monitoring will
continue also during 2018.
On 2 July 2017, at Bria-
del in the Vigo Rendena area
(right side of the Sarca river)
a mushroom picker sighted a
bear at a distance of 6/7 me-
Photo 11 - Monitoring of KJ2 cubs using a camera trap (APT Forestry and
tres. After standing up on its
Wildlife Department Archive) hind legs for a moment, the
bear bounded towards him,
snoring. At this point the man
ran towards his mountain hut, at the same time becoming aware of the presence of a cub. After
having covered around thirty metres the man stopped and, turning around, discovered that the
bear, accompanied by the cub, moved away. It was not possible to find organic samples to identify
the bear.
On 21 July 2017, at Vallene in the Terlago area, a woman, doing jogging along a path though
thick vegetation, came across a bear at a distance of around 30 metres. The bear turned around
and galloped towards her. The woman then did an about-face and moved away; however, hearing
that the bear was still following her, she left the path, moving rapidly over the slope covered with
vegetation. The chase continued for around 50 metres. No cubs were observed on this occasion
and it was not possible to collect organic samples to identify the bear, but the vicinity of Vallene
to the place in which KJ2 attacked the man the day after, bring to the hypothesis that the bear
would have been the same.
Captures
Within the emergency management, a sig-
nificant role is played by the “Capture Team”,
formed by the personnel of the Forestry Service
trained for such activities and supported by the
vets from the APSS for the sanitary aspects.
Within the LIFE DINALP BEAR project, in
2017 capture sessions were organized and other
four bears (in addition to the previously cited
KJ2) were fitted with GPS collars. All the bears
were captured using tube traps: Photo 12 - A phase in the capture of M18 (APT Forestry
• an adult male (photo 12), 5.5 years old and Wildlife Department Archive)
292017 LARGE CARNIVORES REPORT
(M18), captured on 5 April in the woods
above Lasino; when captured, the male was
accompanied by the young female F26. This
confirms that mating interactions can start at
the beginning of spring and can involve also
females of only 2.5 years of age.
• an adult female aged 11.5 years (DG3), cap-
tured on 30 May in Val Algone (photo 13).
Photo 13 - A phase in the capture of DG3 (APT Forestry • an adult female aged 9.5 years (F4), captured
and Wildlife Department Archive)
on 27 July in the woods above Lasino (photo
14).
• an adult female aged 3.5 years (F20), cap-
tured on 18 September in Val Genova (photo
15). In this case, the collar was equipped with
an innovative system for automatic deterrent
measures, but the bear managed to slip out of
it a few days after the capture.
On 9 April 2017 action was taken to detach
Photo 14 - The capture of female bear F4 (APT Forestry the collar of the female bear F26, captured on
and Wildlife Department Archive) 9 September 2016, again within the LIFE DI-
NALP BEAR project, because of malfunctioning
(photo 16). It was detached using the “drop off”,
system, which allows to unlock the collar from
a distance and let it drop from the bear, using a
radio signal.
At the end of 2017, in order to minimize the
risk of capturing females with cubs of the year,
the tube traps were slightly modified (photo
17), in order to improve the reliability of the
Photo 15 - The capture of female bear F20 (APT Forestry closing mechanism, when the entrance is not
and Wildlife Department Archive) free (due for example to the presence of cubs).
The tube traps were modified by the Fon-
dazione Bruno Kessler (FBK), Materials and
Microsystems Center, MNF (MicroNanoFacility)
Unit, Area Testing.
The main modifications to the traps are de-
scribed below:
• Addition of an electromechanical release
mechanism to the existing system;
Photo 16 - Retrieval of a collar with a bear dog (C. Groff - • Addition of an electrical sensor (capable of
APT Forestry and Wildlife Department Archive) adjusting the tensile force necessary to trigger
30You can also read