EU Market Outlook For Solar Power / 2019 2023
←
→
Page content transcription
If your browser does not render page correctly, please read the page content below
EU Market Outlook
For Solar Power / 2019 - 2023

Supported by:

FOREWORD

Welcome to SolarPower Europe’s first EU Market Outlook.
The time has come to look at solar PV in the European Union much more thoroughly. While SolarPower Europe has
been publishing a Global Market Outlook for many years, Europe has just been one part of this comprehensive, annual
overview of developments in the solar sector worldwide, which have seen solar demand mostly taking place in Asia
in recent times. In 2019 that’s different – increasing by more than 100% over the past year, solar growth in the European
Union has outpaced most of the leading global solar regions. In addition, more new capacity was installed for solar
than any other power generation technology in the EU this year. Our first EU Market Outlook provides details on what
we expect to be the prelude of a European solar renaissance for the coming decade and beyond.
The main reason for solar’s success in the EU is its low cost. Solar power is often cheaper than any other technology
today – this is true for retail electricity and, increasingly, wholesale power as well. And with the steepest cost
reduction curve ahead, solar PV’s competitiveness will increase further. Other markets outside the EU also have an
opportunity to benefit from solar’s cost advantage.
What's changed: Brussels has already done a sizeable part of its homework to prepare for the future new energy
world based on solar and its renewable energy peers. The binding national 2020 targets of the first renewable energy
directive have led several countries that are still struggling to meet their obligations to finally opt for solar. The 2019
‘Clean Energy for All Europeans’ legislative package contains many pro-solar provisions that will support the
dissemination of PV power until 2030. As the most versatile, easy and quick to install, and often lowest-cost means
of expanding the share of renewables, solar is the most popular power generation source among European citizens
– and this attractiveness is now increasingly translating into real solar investments.
Despite solar’s popularity and its enormous potential, Europe is still very much at the beginning of the solar age.
Today, solar power’s total share in EU electricity generation is just about 5%. We can look at this from several
perspectives. For example, over 90% of EU rooftops are unused; rooftops which present an opportunity to generate
power equal to around one-quarter of the EU’s electricity demand – and that doesn’t include the vast amount of
idle space on building façades. Europe also needs to strengthen the solar manufacturing sector as a cornerstone
of the European green economy and position solar technology as a major element in the EU’s industrial strategy.
To ensure both Europe’s long-term security of supply and industrial leadership in clean energy technologies, it is
key to establish solar as a strategic value chain.
While solar in the European Union is now on the right path, it will take further efforts to establish sustainable
leadership in this clean power technology, especially as Europe now strives to become the world’s first climate-
neutral continent by 2050 with the European Green Deal. We have outlined seven policy recommendations on
topics that are crucial for solar to thrive in Europe (see p. 5).
SolarPower Europe and its members are very much looking forward to working together with EU policy stakeholders
to enable solar to deliver its great promise to turn the European Green Deal into reality.
Enjoy reading our EU Market Outlook,

                                                                                    Thanks to our Sponsor Members:

WALBURGA             MICHAEL SCHMELA
HEMETSBERGER         EXECUTIVE ADVISOR
CEO

                                                                               SolarPower Europe / EU MARKET OUTLOOK / 3
TABLE OF CONTENTS

                                                 FOREWORD                                                                                 3
                                                 POLICY RECOMMENDATIONS                                                                   5
                                                 EXECUTIVE SUMMARY                                                                        6
                                                 1     EU SOLAR MARKET                                                                    7
                                                       EU SOLAR MARKET UPDATE 2019                                                        7
                                                       EU SOLAR MARKET UPDATE / SEGMENTS                                                 14
                                                       EU SOLAR MARKET PROSPECTS 2020 – 2023                                             15

                                                 2     EU SOLAR TRENDS                                                                   21
                                                       1 Industrial Solar Strategy                                                       22
                                                       2 Solar Buildings                                                                 24
                                                       3 Digital Solar                                                                   26
                                                       4 Solar Grid Integration                                                          28
                                                       5 Sustainable Solar                                                               30
                                                       6 Solar Mobility                                                                  32
                                                       7 Renewable Financing                                                             34
                                                       8 Solar Powered Businesses                                                        36
                                                       9 Emerging Solar Markets                                                          38
                                                       10 Solar to Hydrogen                                                              40

                                                 3     TOP 5 EU SOLAR MARKETS                                                            43
                                                       1 Spain                                                                           44
                                                       2 Germany                                                                         46
                                                       3 The Netherlands                                                                 49
                                                       4 France                                                                          51
                                                       5 Poland                                                                          54

Project manager & lead author: Michael Schmela, SolarPower Europe.
Market intelligence: Raffaele Rossi, Michael Schmela, SolarPower Europe.
Internal co-authors: Aurélie Beauvais, Miguel Herrero Cangas, Naomi Chevillard, Máté Heisz, Merce Labordena, Raffaele Rossi, SolarPower Europe.
External co-authors: José Donoso & Alejandro Labanda, Unión Española Fotovoltaica (UNEF); Jaap Baarsma, Holland Solar; Samy Engelstein,
Syndicat des Énergies Renouvelables (SER); Stanislaw M. Pietruszko, PV POLSKA.
External contributors: ANIE Rinnovabili, APESF, APREN, EDORA, Elettricità Futura, ENERPLAN, Estonian PV Association, European Energy,
Fortum, HELAPCO, ISEA, MANAP, ODE, PV Austria, RENERGY, Solární Asociace, STA, Svensk Solenergi.
Design: Onehemisphere, Sweden.
Supported by: Intersolar Europe.
Disclaimer: Please note that all historical figures provided in this brochure are valid at the time of publication and will be revised when new
and proven figures are available. All 2019 numbers are preliminary and extrapolated based on numbers that were available mostly for the first
three quarters of the year. Forecasts for 2020 to 2023 are based on SolarPower Europe’s Global Market Outlook for Solar Power 2019-2023. Please
also note that forecast figures have been rounded.
SolarPower Europe’s five-year forecast consists of Low, Medium and High Scenarios. The Medium scenario anticipates the most likely
development given the current state of play of the market. The Low Scenario forecast is based on the assumption that policymakers halt solar
support and other issues arise, including interest rate hikes and severe financial crisis situations. Conversely, the High Scenario forecasts the
best optimal case in which policy support, financial conditions and other factors are enhanced.
Segmentation is based on the following system size: Residential (
POLICY RECOMMENDATIONS

Solar energy is ready to take a key role in delivering the European Green Deal, securing ambition, a just and
fair transition, and ensuring Europe’s security of supply. To fully tap into the potential of the seven solar
solutions outlined below, the mobilisation of substantial public and private investment will be paramount. The
European Green Deal and upcoming legislation on Sustainable Finance will play a critical role in leveraging
these funds and guaranteeing that future investments are directed towards solar and other technologies and
assets that will support Europe’s carbon neutrality and industrial leadership in clean energy.

Delivering solar industrial leadership
Solar manufacturing should be strengthened as a cornerstone of the European green economy and has to be a major
element in Europe’s Industrial Strategy. The solar sector must be established as a strategic value chain in order to both
ensure Europe’s security of supply and deliver industrial leadership in clean energy technologies. Supporting the large-
scale industrial deployment of existing innovative, European, renewable technologies will be key.

#Solar4Buildings
We propose a mandate for solar to be installed on all new and renovated residential, commercial, and industrial
buildings in the EU. Currently 90% of European rooftops are unused and fitting this space with solar offers the
potential to save up to 7 million tonnes of CO2 each year, producing at least 680 TWh of clean electricity supply.

Transitioning former coal regions to solar
Coal regions can greatly benefit by transitioning to solar – with huge untapped solar potential, they are attractive
business environments for solar deployment and manufacturing. The EU Platform for Coal Regions in Transition must
work with the Clean Energy Industrial Forum to foster synergies between solar industrial policy and a just transition.

Providing skills and training programmes to support the energy transition
It is a priority to adapt the EU Skills Agenda in order to facilitate European solar jobs across key sectors and avoid
bottlenecks. With the proper regulatory framework, solar could create at least 500,000 highly skilled jobs by 2030,
and 1.7 million by 2050 in Europe alone.

Unlocking the potential of flexible large-scale solar installations
Solar is a flexible and reliable technology that can provide valuable flexibility services to the grid, more accurately than
conventional technologies. The potential of large-scale solar installations to support the transmission grid is largely untapped
in Europe, therefore, it is urgent to remove existing barriers to their deployment, such as size caps in public tenders.

Accelerating solar-powered mobility
Solar is highly versatile and can be directly connected to most charging infrastructure, delivering truly sustainable
electric mobility. As solar's highest generation capacity occurs during traditional working hours, it is a particularly
attractive option for charging facilities located in public and commercial buildings as well as working spaces. We
must ensure that appropriate infrastructure is in place to facilitate the roll-out of solar-powered electric vehicles;
including personal cars, trucks, trams, and buses.

Prioritising renewable-based electrification of the European economy and developing
truly renewable hydrogen
In the short term, the renewable-based electrification of our building, transport, and power sectors is the most cost-efficient
way to decarbonise the European economy and can already contribute significantly to reaching the EU energy and climate
targets. Solar-based solutions in particular are very appealing because of their unique versatility and ability to provide direct
renewable electricity to homes, public buildings, farms, businesses, carports and charging stations,to name a few. By 2050,
renewable-based gases will be necessary to fully deliver the European Green Deal, especially for difficult-to-decarbonise
sectors, such as energy-intensive industries and heavy transportation. In only 10 years, the price of solar panels has dropped
by more than 96%, making solar a cost-effective electricity supply for hydrogen production. In order to produce renewable
hydrogen, the sector requires political commitment and a regulatory framework to end new investments in conventional
generation and redirect all available financing away from fossil fuels to deliver a truly renewable hydrogen economy.

                                                                                   SolarPower Europe / EU MARKET OUTLOOK / 5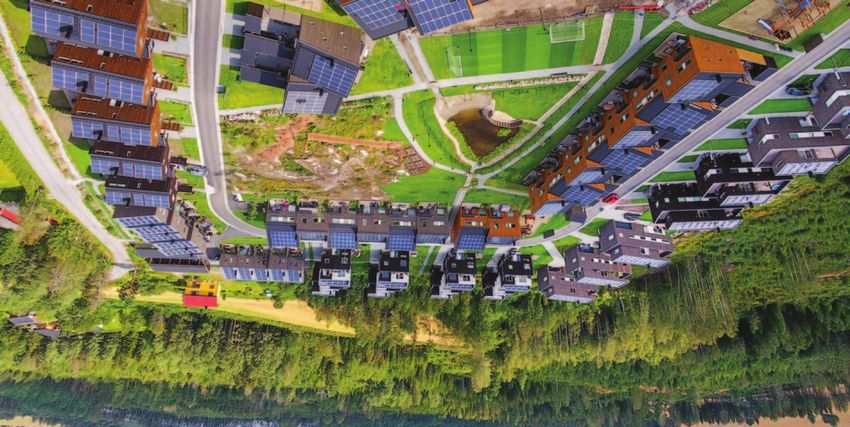
EXECUTIVE SUMMARY

2019 was one of the best years ever for solar in the European Union. The region installed 16.7 GW – a 104%
increase over the 8.2 GW added the year before. Further, 2019 also showed the strongest solar growth since
2010, when the EU PV market also increased by 104% during the first European solar boom, although to a lower
level, reaching 13.4 GW.
Adding an estimated 4.7 GW in 2019, Spain was both the EU’s and Europe’s largest solar market. The sunny country
returns to the continent’s top solar spot, 11 years after it last held the position. Completing the Top 5 EU solar markets
list are Germany (4 GW), the Netherlands (2.5 GW), France (1.1 GW), and, surprising to many, Poland, which nearly
quadrupled its installed capacities in 2019 to 784 MW. For this report, we have invited respective national associations
among our members to provide in-depth overviews on the latest developments in these leading EU solar markets.
In total, the EU’s Top 5 solar markets were responsible for over three quarters of the region's installed capacity in 2019.
When looking at the Top 10, the share increases to 93% based on a combined capacity of 15.6 GW, which is more than
double the 7.5 GW added in 2018. Despite the relatively small contribution of the other 18 EU member states, it seems
that the vast majority are now moving in the right direction, even if this is occurring on a much lower level. In 2019, 26
of the 28 EU markets installed more solar capacities than the year before.
The broadening of solar support in the EU resulted in a total of 131.9 GW by the end of 2019, a 14% increase over
the 115.2 GW operating the year before.
There are several reasons for Europe’s new solar boom. First, the key to solar’s growth in the EU and beyond is its
competitiveness. Solar power is often cheaper than any other power generation source today, and its attractiveness
is only increasing as the cost reduction curve continues at a much faster pace than for any other technology. Another
major factor for the growth of solar in the EU today is the close deadline for member states to meet their binding
national 2020 renewable energy targets. At the same time, EU countries have already started to prepare for their
compliance with the Clean Energy Package’s 32% renewables target by 2030. With solar being the most popular
power generation source among EU citizens, as well as the most flexible, easy to install, and often lowest-cost means
of expanding the share of renewables, governments are increasingly embracing solar in their climate strategies.
The set of tools and technologies backing solar is immense: from tenders that show utility-scale solar is able to
win technology-neutral tenders against all other power generation technologies; to self-consumption and storage
attracting prosumers that are looking to reduce their electricity bills; to new business models that are enabled by
digitalisation, such as peer-to-peer electricity supply. The latest trend that has supported the rise of solar is
corporate renewable power sourcing. This has become a crucial part of the energy and sustainability strategy of
many leading corporates, who have invested in on-site solar as well as signing ‘subsidy-free’ direct bilateral solar
PPAs from large off-site solar power plants that increasingly compete with wholesale power markets in a number
of European countries.
In our first EU Market Outlook we examine the major trends that will shape the growth of solar in the EU. We have
selected 10 topics that are our top priorities in day-to-day work, presenting the challenges and opportunities in
the fields that are critical to understand in order to enable the fast and sustainable dissemination of low-cost solar
power – from an industrial solar strategy, that Europe urgently needs, to solar buildings, which offer huge
untapped potential, to solar grid integration, where solar offers grid-friendly solutions that are often unknown,
and sustainable financing, which is key to large-scale deployment of solar power.
Our Medium Scenario for the EU’s annual solar PV market development until 2023 expects continued growth for
the region. After demand more than doubled in 2019, we foresee 26% growth beyond the 20 GW level to 21 GW in
2020. In 2021, installations are expected to reach 21.9 GW – close to the all-time high for solar installations in the
EU, reached in 2011 with 22.2 GW. This record is anticipated to be overtaken in 2022 with 24.3 GW of new additions,
and again in 2023 with 26.8 GW of newly-installed solar capacity. Our ‘weather forecast’ for EU solar markets
remains bright and sunny, with very few clouds on the horizon and no rain ahead.
The report and all figures can be downloaded at:
www.solarpowereurope.org

6 / SolarPower Europe / EU MARKET OUTLOOK
1
EU SOLAR MARKET
UPDATE 2019
                                                                                                            © BayWa r.e.

Don Rodrigo, Spain, 175 MW.

There are many reasons why solar      Solar’s versatile nature enables deployment on a small to large-scale, from
was the energy source that added      consumer applications to building-integrated solutions, from floating power
more capacity than any other          plants to centralised utility-scale power plants. People simply like solar. But
power generation technology in        most of all, it is solar’s competitive cost structure, which is expected to
the European Union in 2019 – and      continue its impressive downward trend seen in recent years for decades
there are many reasons why solar      to come. Today, solar power can be generated at a levelised cost of energy
is very likely to continue to be at   (LCOE) of 0.05 EUR per kWh in a Northern European city like Helsinki. This is
the forefront in the future as the    expected to decrease to less than 0.02 EUR per kWh in 2050, according to
region strives to become carbon-      the European Technology and Innovation Platform for Photovoltaics (ETIP
neutral by 2050.                      PV). In a Southern European city like Malaga, utility-scale solar LCOEs are at
                                      around 0.03 EUR per kWh today and are expected to reach the 0.01 EUR per
                                      kWh range in 2050 (see Fig. 1.1).

                                                                          SolarPower Europe / EU MARKET OUTLOOK / 7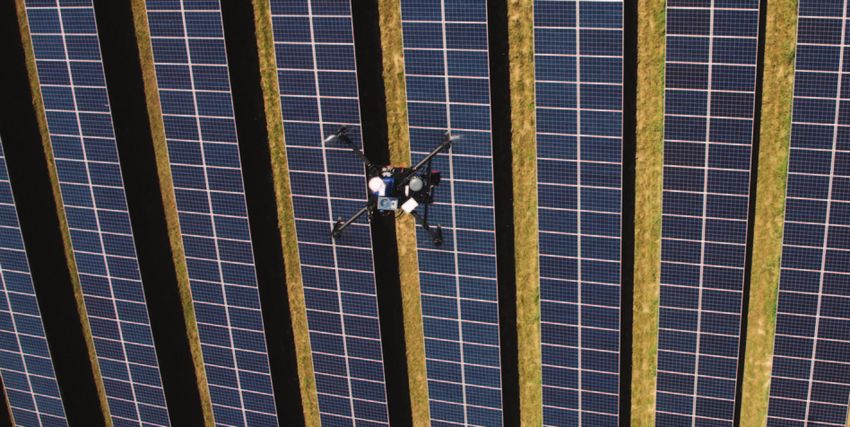
1 EU SOLAR MARKET
UPDATE 2019 / CONTINUED
FIGURE 1.1 PV LEVELISED COST OF ELECTRICITY (LCOE) IN SIX EUROPEAN LOCATIONS, 2019-2050
110
100
90
80
Utility-scale PV LCOE (EUR/MWh)
70
60
50
40
30
20
10
0
2019
2020
2025
2030
2040
2050
2019
2020
2025
2030
2040
2050
2019
2020
2025
2030
2040
2050
2019
2020
2025
2030
2040
2050
2019
2020
2025
2030
2040
2050
2019
2020
2025
2030
2040
2050
Helsinki London Munich Toulouse Rome Malaga
Current industrial electricity prices * Additional LCOE with 10% nominal WACC
Current wholesale electricity prices ** Additional LCOE with 7% nominal WACC
Additional LCOE with 4% nominal WACC
PV LCOE with 2% nominal WACC
*: H1 2019 average national price for medium size industrial consumers (without taxes).
**: H1 2019 average national price for wholesale baseload electricity.
Source: European Commission (2019); Eurostat (2019); Vartiainen et al. (2019). © SOLARPOWER EUROPE 2019
2019 was one of the best years ever for solar in the Top 5 EU solar markets 2019
European Union. The region installed 16.7 GW in 2019 –
While the EU’s current solar decade has been mostly
a 104% increase over the 8.2 GW added the year before
dominated by Germany – which only had to give up the
(see Fig. 1.2). In fact, this is the strongest solar growth in
top spot to the UK for three years – there’s now a new
the EU-28 since 2010, when the PV market also grew by
member state in the top position. Spain was Europe’s
104% during the first European solar boom, although to
largest solar market in 2019. The sunny Southern
a lower level, reaching 13.4 GW. The impressive EU-28
European country returns to the continent’s top solar
solar market growth in 2019 was close to what we had
spot 11 years after it last held the position. In 2008, during
forecasted in our Global Market Outlook for Solar Power
a brief FiT-based solar rush, Spain installed 3.1 GW. Now,
2019-2023, published in May 2019. Our Medium
at around 4.7 GW DC (based on 3.9 GW AC), Spain is the
Scenario forecast saw the EU-28 adding 17.1 GW in 2019.
clear market leader in both the EU and Europe.
8 / SolarPower Europe / EU MARKET OUTLOOK
FIGURE 1.2 EU28 ANNUAL SOLAR PV INSTALLED CAPACITY 2000 - 2019

     25

     20

                                                                                                                                                            16.7

     15
                                                                                                                                                   104%
GW

     10

                                                                                                                                           37%
                                                                                                                                      1%
       5

       0
             2000

                    2001

                            2002

                                   2003

                                          2004

                                                 2005

                                                        2006

                                                               2007

                                                                       2008

                                                                                2009

                                                                                        2010

                                                                                               2011

                                                                                                      2012

                                                                                                              2013

                                                                                                                     2014

                                                                                                                            2015

                                                                                                                                   2016

                                                                                                                                           2017

                                                                                                                                                     2018

                                                                                                                                                             2019e
     Spain             Germany               Netherlands              France               Poland              Hungary             Belgium

     Italy             UK                    Portugal                 Austria              Sweden              Denmark             Rest of Europe

                                                                                                                                                  © SOLARPOWER EUROPE 2019

The main driver for Spain’s 2019 solar boost were its                                  ground-mounted systems above 750 kW were
auctions in 2017, when around 4 GW of solar was awarded                                responsible for less than 20%. The Mieterstrommodel
with a grid-connection deadline at the end of 2019.                                    (on-site community solar) regulation, introduced in
In addition, the first PPA/wholesale-based solar power                                 2017 to enable collective self-consumption of PV
plants came into the picture, from an over 100 GW large                                installations on apartment buildings, also continued to
pipeline under development, as well as solar rooftop                                   attract very limited interest in 2019 as participants are
systems based on self-consumption which became                                         subject to full EEG levy payments. However, 2019 will
attractive after the Spanish ‘Sun Tax’ was eliminated.                                 also go down in the solar history books as the year when
                                                                                       the first German subsidy-free solar PV system was built
The second largest EU solar market in 2019 was
                                                                                       – an 8.8 MW system by BayWa r.e. – and several others
Germany, which had to hand over its title as the number
                                                                                       are currently in the development phase.
one EU solar market after only two years. Still, the
German market continued its recent solar growth path.                                  Another country that fell back in the rankings despite
At around 4 GW, solar PV demand in Germany increased                                   strong growth is the Netherlands. The country, now
by 35% in 2019, after the country installed 2.9 GW in                                  ranked third, added an estimated 2.5 GW; up 66% from
2018, which was already up 67% from 1.7 GW in 2017.                                    1.5 GW installed in 2018, when it exceeded the GW-level
                                                                                       for the first time. The biggest market segment in the
Like the year before, the main drivers for the country’s
                                                                                       country in 2019 was again the rooftop solar market, with
solar boost in 2019 were self-consumption/feed-in
                                                                                       around 40% in the C&I segment and an equal share in
premiums for medium- to large-scale commercial
                                                                                       the residential segment. The utility-scale solar segment,
systems ranging from 40 kW to 750 kW. Tender-based,

                                                                                                             SolarPower Europe / EU MARKET OUTLOOK / 9
1 EU SOLAR MARKET
     UPDATE 2019                    / CONTINUED

including ground-mounted and floating solar plants,                     A big surprise to many observers is Poland’s solar
was responsible for around 20% of the market. Again,                    market development. Newly installed capacities of
the major driver for solar in the Netherlands was the                   around 784 MW in 2019 mean that the solar market
SDE+ technology neutral tender programme, which is                      almost quadrupled compared to the 203 MW connected
the base for the growth of the C&I and utility-scale solar              to the grid in 2018. The foundation for the growth of the
segments. Meanwhile, the country’s net metering                         Polish solar PV market is self-consumption systems;
scheme, almost the only one of its kind in the EU, has                  over 550 MW were operational at the end of Q3/2019,
been instrumental in the success of residential solar.                  which is around half of the total installed PV capacity at
                                                                        the time. In particular, small systems below 50 kW – so-
In France, ranked fourth again, the solar year 2019 began
                                                                        called micro-installations – are in high demand as they
as the previous year had ended – somewhat
                                                                        don’t need permits for grid-connection and have
disappointing. Only around 200 MW went on-grid in
                                                                        become increasingly attractive with falling PV product
Q1/2019 – a 4% decrease over the same quarter in 2018,
                                                                        prices. This market segment is complemented by a RES
which saw newly installed capacities of 873 MW. But
                                                                        auction scheme that started in 2016, which was
installation activity grew stronger over the course of the
                                                                        followed by two further biddings in 2017 and 2018.
year. There is a very good chance that France installed
                                                                        Although to a minor extent, the 2019 solar market boost
over 1 GW in 2019 (our assumption is 1,068 MW), after
                                                                        also stems from a mid-year installation deadline for the
around 707 MW were grid-connected by the end of the
                                                                        second auction system awards.
third quarter. The key to the growth of the French market
is its solar tenders, which include systems as small as 100             In total, the European Union’s Top 5 solar markets were
kW – and it looks like the installation rates from awarded              responsible for over three quarters of the 2019 installed
tenders in the last few years are finally gaining traction.             capacity in the region. When looking at the Top 10, the

FIGURE 1.3 EU28 TOP 10 SOLAR PV MARKETS, 2018 - 2019

     5,000

              4,680
     4,000
                            3,985

     3,000
                                2,947
MW

                                        2,496
     2,000

                                            1,500
                                                    1,068
     1,000                                                  873
                                                                  784          653         605         598
                                                                                     410         367         485   374 286     367
                      288                                               203                                                           91
        0
                 Spain      Germany Netherlands France            Poland       Hungary     Belgium      Italy        UK        Portugal

                                                                        2019           2018

                                                                                                                     © SOLARPOWER EUROPE 2019

10 / SolarPower Europe / EU MARKET OUTLOOK
share increases to 93% based on a combined capacity also a 10 GW solar market, after adding an estimated
of 15.6 GW, which is more than double the 7.5 GW added 1.1 GW led to 9.97 GW in total by the end of 2019.
in 2018. Despite the small contribution of the other 18
Next to the four two-digit GW EU solar markets, 12 EU
EU member states, it seems that the vast majority is now
countries had solar capacities in the one-digit GW
moving in the right direction, even if this happens to be
category, two of which are located in the medium range
partly on very low levels. In 2019, 26 of the 28 EU
– the Netherlands with 6.7 GW and Belgium with 4.7 GW
markets installed more solar than the year before.
– while the bulk of EU countries fall in the 1-2 GW category
The pattern of EU-28 total solar installed capacities in (Austria, Bulgaria, Czech Republic, Denmark, Hungary,
2019 is similar to 2018 (see Fig. 1.4). Like in the past, Greece, Poland, Portugal, Romania). It’s noteworthy that
Germany remains the region’s largest solar power plant three countries exceeded the cumulative installed GW
operator by far - with 49.9 GW of total installed capacity – level for the first time in 2019, Denmark, Hungary and
followed by Italy which has now exceeded the 20 GW Poland, turning the tide to the majority of EU member
mark, reaching 20.5 GW. Again, Germany (38%) and Italy states having more than 1 GW of solar installed.
(16%) are home to over half of the EU’s solar power
In summary, solar in the European Union has
generation capacities. However, their combined share
accelerated its upswing phase. In 2019, the number of
slightly decreased again; 53% vs. 57% in the previous
EU member states that connected more solar to the
year. In 2018, only one other EU market – the UK – had
grid than the year before increased by four to 26. The
more than 10 GW of solar PV installed, now at 13.3 GW
broadening of solar support in the EU lead to a total
equal to a 10% share. In 2019, Spain also entered the two-
of 131.9 GW by the end of 2019; a 14% increase over
digit GW solar market category with 10.6 GW, after grid-
the 115.2 GW operating the year before.
connecting around 4.7 GW. If rounded up, France is now
FIGURE 1.4 EU28 TOTAL SOLAR PV INSTALLED CAPACITY 2000 - 2019
140 131.9
120
100
80
GW
60
40
20
0
2000
2001
2002
2003
2004
2005
2006
2007
2008
2009
2010
2011
2012
2013
2014
2015
2016
2017
2018
2019e
Spain Germany Netherlands France Poland Hungary Belgium
Italy UK Portugal Austria Sweden Denmark Rest of Europe
© SOLARPOWER EUROPE 2019
SolarPower Europe / EU MARKET OUTLOOK / 111 EU SOLAR MARKET
UPDATE 2019 / CONTINUED
Several reasons for Europe’s New Solar Boom Self-consumption, digitalisation and storage: Solar
power is much cheaper than retail electricity in most
What could already be seen last year has accelerated
European markets and its cost will continue to reduce,
in 2019: The European Union’s solar market is on a
which is increasingly a major driver for people and
growth streak – and it looks like this development will
companies to invest in on-site power generation. The
continue for many years to come, unlike the period
rapidly falling cost of battery energy storage combined
from 2008-2012, when high feed-in tariffs in very few
with the benefits of digital and smart energy products
EU member states drove a gigantic, but rather brief,
supports the sales case for solar, as many consumers
solar boom.
prefer to have better control over their energy bill.
Cost competitiveness: The key to solar’s growth in the However, in order to empower prosumers, it is key that
EU and beyond is its competitiveness. Solar power is solar is not inappropriately taxed and that market
often cheaper than any other power generation source design is adapted to the needs of the new energy world
today – and its attractiveness is only increasing as the to enable peer-to-peer and other digital business
cost reduction curve continues at a much faster pace models, as stipulated in the EU’s Clean Energy Package.
than for any other technology.
Emerging and reawakening markets: The low cost of
EU 2020 targets: One major factor for the growth of solar is now starting to attract the majority of European
solar in the EU these days is the deadline for countries, including those that haven’t been very active
EU member states to meet their binding national in the field in the past. There are also EU solar pioneers
2020 renewable energy targets, which is quickly that have turned to low-cost solar again: Spain, a global
approaching. An update from the EU statistics office solar shooting star for a very brief period in the first
Eurostat published in 2019 revealed that only 11 out of decade of this century and then dormant for another
28 EU member states had already fulfilled their decade, has shown a strong comeback in 2019, even
obligations by the end of 2017, the majority was still on becoming Europe’s largest PV market.
its way, and several had quite some way to go. With
Corporate power sourcing: Sourcing renewable power
solar being the most popular power generation source
has become a crucial part of the energy and
among EU citizens, the most flexible, easy to install and
sustainability strategy of many leading corporates. With
often the lowest-cost means to expand the share of
the costs of renewables continuing to decrease, the
renewables, governments increasingly take solar into
appetite for cost-competitive solar and wind power is
account in their climate strategies.
growing very quickly. Beginning in the US, today’s
Tenders/Auctions: Many EU countries have embraced leading market for corporate renewable power sourcing,
tender/auction tools to control cost and the installation this trend is now rapidly being embraced in Europe as
volumes of solar power. These tenders have played a well. So far, corporates have primarily chosen wind over
key role in bringing down solar power prices and prove solar for renewable PPAs as it has been easier to access
to politicians, businesses and the public how cheap large renewable power volumes from big wind farms;
solar actually is. In several European countries, smaller, commercial solar systems have rather been
including Denmark, Germany, the Netherlands and directly installed on-site. With the advent of large-scale
Spain, solar has also shown that it can win technology- solar PV power plants in Europe, low-cost solar is going
neutral tenders against any other renewable technology to play a much bigger role in corporate sourcing.
if the boundary conditions are set properly. The next
stop has to be ‘intelligent’ tenders, which strive to
support system and grid services. Germany was
planning to launch such a tender in September 2019 but
that has been delayed.
12 / SolarPower Europe / EU MARKET OUTLOOKMerchant solar/PPAs: We are starting to see more and Clean Energy Package/European Green Deal: The
more direct bilateral solar PPAs increasingly competing outcome of the EU’s ‘Clean Energy for All Europeans’
with wholesale power markets in a number of European legislation is very positive for solar and energy storage.
countries. This development will take place primarily in Fully passed in mid-2019, it has set a higher-than-
member states with the widest span between solar and expected 32% renewables target by 2030, ensures the
wholesale power prices, and where access to ancillary right to self-consumption, and maintains priority
service markets is granted. There had been talk about dispatch for small-scale solar installations, among many
pure PPA-based projects for some time, in particular in other pro-solar provisions. Finally, it has addressed the
Spain with its very sunny and vast space, but it took until need for a flexible, renewable energy system by creating
2018 before the first of these systems was built; a 175 a new electricity market design framework and
MW system from BayWa r.e. was sold before final grid- implementing new tools.
connection to the asset manager of Munich RE/Ergo at
While an important milestone has been reached with
the end of 2018, and in early 2019 the world’s largest PPA
the Clean Energy Package, with the next steps being the
was signed for a 708 MW solar project portfolio in Spain
implementation of its directives in member states, a
and Portugal. In the meantime, the pipeline of projects
new bold move comes from Brussels. The new
under development in Spain has exceeded the 100 GW
European Commission under Ursula von der Leyen has
level; the barriers for implementation are grid
announced a European Green Deal to make Europe the
constraints. In Germany, where wholesale power prices
world’s first carbon-neutral continent by 2050. Moreover,
are lower than in Spain, the first large-scale, ‘subsidy-
an impact assessment of the European Commission in
free’ solar system with a capacity of 180 MW will be built
2020 might result in stricter 2030 targets with a
in 2020 by EnBW.
commitment to reduce CO2 reductions by 55% (up from
a current target of 40%) – all of which will have to result
in more support for solar power.
© IKEA
SolarPower Europe / EU MARKET OUTLOOK / 131 EU SOLAR MARKET
SEGMENTS
When looking at the EU solar market segmentation for basically uncapped – and that’s where demand is higher.
total installed capacities, it still reflects the historical In several Western European markets, like Austria, Belgium
development in the respective countries (see Fig. 1.5). or the Netherlands, utility-scale solar traditionally did not
play a role in the past; these countries have been always
Member states that at some point offered very attractive
focussing on rooftop solar. That changed in the
feed-in tariff programmes are still dominated by the utility-
Netherlands after solar’s low cost enabled it to win large
scale solar segment. However, hardly anything has been
shares in the renewables tender SDE+ scheme, a
installed since the FIT schemes were terminated. This is
development that has also started to drive growth for
the case for the Eastern European countries Romania,
large commercial and utility-scale systems.
Bulgaria and Czech Republic, and until 2018, also for
Spain. But this is now quickly changing – in Spain and By the end of 2018, 19% of EU’s cumulative PV system
soon in other such markets as well. After the November capacity was installed on residential rooftops and about
2018 termination of Spain’s ‘Sun Tax’, significantly more 30% on commercial roofs, while the industrial segment
self-consumption systems are being installed in Spain’s accounted for 17% and the utility-scale market for 34%
new solar growth phase. However, the bulk of the new (a breakdown for 2019 will be published in June 2020 in
installations are tender-based and PPA/merchant ground- the Global Market Outlook for Solar Power 2020-2024).
mount power plants, which have begun to revive the
Further development of the different solar segments in the
utility-scale market segment. Such a development is
European Union will depend on the boundary conditions
starting to be seen in Portugal as well.
and policy frameworks of the individual member states.
In solar markets with more or less continuous solar While utility-scale power plants and large rooftop systems
demand, like Germany, the distribution between the will prosper in any country with regular tenders and
different segments has been much more balanced. While attractive conditions for merchant/PPA systems,
the earlier uncapped, large-scale FIT schemes were distributed rooftop solar in particular needs environments
substituted by auctions with limited volumes, self- where self-consumption is not restricted through high
consumption/premium FIT distributed systems are still taxes or excessive fixed grid tariffs.
FIGURE 1.5 EU SOLAR PV TOTAL CAPACITY SEGMENTS UNTIL 2018 FOR SELECTED COUNTRIES
100
90
80
70
60
%
50
40
30
20
10
0
ia
ia
ia
ia
n
l
nd
ce
m
om
ic
k
ce
y
ly
s
ry
ria
ga
an
nd
ar
ai
Ita
en
ak
an
ar
bl
ga
iu
an
e
st
la
Sp
rtu
nm
d
pu
m
re
lg
lg
rla
ov
m
ov
Po
Au
un
ng
Fr
Bu
Be
er
G
Po
Ro
Re
he
De
Sl
Sl
H
Ki
G
et
ch
d
N
te
ze
ni
C
U
Residential Commercial Industrial Utility scale
© SOLARPOWER EUROPE 2019
14 / SolarPower Europe / EU MARKET OUTLOOK1 EU SOLAR MARKET
PROSPECTS 2020 – 2023
FIGURE 1.6 EU28 ANNUAL SOLAR PV MARKET SCENARIOS 2020 - 2023
45
41.4
40
35
29.5
30
10%
25 11%
GW
4%
26%
20
16.7
14.1
15
11.4
10
5
0
2014 2015 2016 2017 2018 2019 2020 2021 2022 2023
Historical data Low Scenario High Scenario Medium Scenario
© SOLARPOWER EUROPE 2019
As forecasted in our recent Global Market Outlook for world largest market’s PV product manufacturers have
Solar Power 2019-2023, 2019 was indeed an exceptionally a strong interest in shipping larger volume to Europe
good year for solar power in the European Union. Our and other growth regions – in the short run, because
Medium Scenario for the EU’s annual solar PV market they need this demand abroad and in the mid run, to
development until 2023 expects strong growth for the diversify their business activities.
region next year (see Fig. 1.6). After demand more than
We expect a somewhat lower growth rate of 4% from
doubled in 2019, we foresee 26% growth beyond the 20
2020 to 2021 after several EU countries will have met their
GW level to 21 GW in 2020. In 2021, installations are
2020 targets. But the fall in demand is assumed to be very
supposed to reach 21.9 GW – close to the all-time high for
brief. We remain more optimistic for the EU in the period
solar installations in the EU, reached in 2011 with 22.2 GW.
from 2020 to 2023 than in our 2018 analysis, as we see
This record is anticipated to be overtaken in 2022 with
that member states already have the 2030 horizon on
24.3 GW of new additions, and again in 2023 with 26.8 GW
their radar (by the end of 2019, all final National Energy
of newly installed solar capacity.
and Climate Plans (NECPs) have to be submitted to the
The main drivers for the high-demand assumptions are European Commission). In addition, utilities, corporates
the same as in 2018. Solar, as the lowest-cost power and big funds in Europe are putting renewables high on
generation source, the most versatile and flexible as well their agenda – and low-cost and flexible solar will be their
as easy and quick to install renewable energy favourite means for clean power sourcing and investment
technology, has become the preferred solution for in new generation capacities.
several of the EU-28 countries still working on meeting
While our Medium Scenario forecasts constant annual
their 2020 binding national renewable energy targets.
demand growth, and mostly two-digit growth in the
Moreover, the fundamental restructuring of the Chinese period until 2023 (except for 2021) to a new high of
solar market design announced in mid-2018 is still nearly 27 GW, our Low Scenario anticipates shrinking
taking its toll on local demand. In consequence, the demand in 2020 and installations at a level of 14.1 GW,
SolarPower Europe / EU MARKET OUTLOOK / 151 EU SOLAR MARKET
PROSPECTS 2020 – 2023 / CONTINUED
FIGURE 1.7 EU28 TOTAL SOLAR PV MARKET SCENARIOS 2020 - 2023
300
276.8
250
13%
200 14%
180.1
164.8 14%
GW
150 131.9 16%
141.3
100
50
0
2014 2015 2016 2017 2018 2019 2020 2021 2022 2023
Historical data Low Scenario High Scenario Medium Scenario
© SOLARPOWER EUROPE 2019
which is nearly half of the new additions in the Medium power. It also anticipates that interest rates stay low and
Scenario in 2023. The Low Scenario is modeled on there will be no major macroeconomic issues in the EU.
major EU markets cutting their solar support, an
A look at the EU’s cumulative PV market scenarios from
outcome that is obviously very unlikely when taking into
2020 to 2023 shows constant, low two-digit annual
account current solar activities and new policy
growth rates, with the Medium Scenario forecasting
frameworks in the EU, where the climate crisis is very
nearly 100 GW capacity more online than today,
high on many decision-makers’ agendas.
resulting in a total installed solar capacity of 226 GW in
On the other hand, our High Scenario forecasts up to 2023 (see Fig. 1.7). While the High Scenario sees the EU
41.1 GW of newly installed solar capacity in 2023, which reaching a 277 GW level in 2023, we consider solar’s
sounds extremely optimistic from today’s perspective. business case to be very strong in any case over the next
But not only has solar rather often surprised everyone four years – even in our Low Scenario, the EU is
positively in the past – and with some major EU anticipated to add nearly 50 GW and operate 180 GW of
countries expected to miss their EU 2020 targets, solar solar power plants by the end of 2023.
is the key to catch up in order to meet the 2030
For the 15 EU markets with the highest 5-year
obligations. Our High Scenario is based on a context
installation potential (in the order of High Scenario
where no import taxes for solar products, no prohibitive
assumptions), the outlook is more buoyant and mostly
taxes or fees on self-consumption/storage, or any other
anticipates much larger installation volumes until 2023
barriers could slow down flexible and distributed solar
than in last year’s analysis (see Fig. 1.8.) However, the
16 / SolarPower Europe / EU MARKET OUTLOOKFIGURE 1.8 EU28 SOLAR PV ADDITIONS FOR HIGH AND LOW SCENARIOS 2019-2023
Germany 34.0
12.0
26.6
Spain
13.2
23.9
Netherlands
12.1
19.1
France
9.6
Italy 15.5
5.4
9.7
Portugal
2.3
4.6
Poland
1.3
4.2
Hungary
1.8
United Kingdom 3.6
1.2
Belgium 3.5
1.5
High Scenario
Ireland 3.0
0.4
Austria 2.8 Low Scenario
0.9
Greece 2.7
0.9
2.2
Sweden
0.3
1.4
Denmark
0.5
0 5 10 15 20 25 30 35 40
GW
© SOLARPOWER EUROPE 2019
pattern remains similar: few countries will install the bulk The Top 5 EU solar markets are expected to add 119.2
of all solar system capacity, though diversity and the GW from 2019 until 2023 in the High Scenario and 52.4
number of GW-scale markets is growing. This time, we GW in the Low Scenario. In comparison, the Top 15 are
expect four countries to install over 10 GW until 2023 in supposed to install 156.9 GW from 2019 until 2023 in the
the Low Scenario – Germany, Spain, The Netherlands and High Scenario and 63.6 GW in the Low Scenario.
France if rounded up (last year, it was only Germany).
SolarPower Europe / EU MARKET OUTLOOK / 171 EU SOLAR MARKET
PROSPECTS 2020 – 2023 / CONTINUED
FIGURE 1.9 EU28 SOLAR PV MARKETS' PROSPECTS
2018 2023 2019 - 2023 2019 - 2023
Total Capacity Total Capacity Medium New Capacity Compound Annual Political support
(MW) Scenario by 2023 (MW) (MW) Growth Rate (%) prospects
Germany 45,920 72,611 26,692 10%
Spain 5,915 25,601 19,686 34%
Netherlands 4,181 19,948 15,767 37%
France 8,900 22,07 13,173 20%
Italy 19,877 29,395 9,518 8%
Portugal 660 4,647 3,987 48%
Poland 496 3,503 3,007 48%
Hungary 797 3,713 2,916 36%
United Kingdom 12,962 15,473 2,510 4%
Belgium 4,075 6,475 2,400 10%
Ireland 54 2,172 2,118 110%
Austria 1,438 3,320 1,882 18%
Greece 2,669 4,504 1,835 11%
Sweden 472 1,935 1,463 33%
Denmark 955 2,015 1,060 16%
Our ‘weather forecast’ for the EU remains bright and is huge but grid connection issues are expected to
sunny with very few clouds on the horizon. When restrict growth for the moment. The new number 3
looking at the Top 15 EU solar PV markets prospects 2019 prospect is the Netherlands, where a large solar project
– 2023, we are very upbeat on 13 of these countries. For pipeline from the continuing SDE+ tender programme
just two countries, the political support prospects are combined with a solid net-metering backed residential
considered cloudy (Italy and United Kingdom), while we rooftop market will encourage further strong growth,
see no rain ahead anywhere in the EU (see Fig. 1.9). although land and grid-connection issues are
increasingly becoming challenges that need to be
While the largest four EU solar prospects have not
mastered as well. France is now supposed to finally
changed compared to 2018, their order did in 2019. We
deliver on its solar promises, but that was believed to
still expect Germany to add the biggest solar volume
happen already in the last few years when the country’s
until 2023 (as we forecasted in the Global Market
solar volumes were very disappointing. In the period
Outlook for Solar Power 2019-2023, the 52 GW FiT cap
2019-2023, we forecast that Germany will add 26.7 GW,
that will likely be reached in 2020, was agreed by the
Spain will install 19.7 GW, the Netherlands will grid-
German government to be lifted to 98 GW). The next
connect 15.8 GW, and France will see 13.2 GW of new
hottest market in the near future will be Europe’s largest
solar capacity.
market, Spain, where the potential for subsidy-free solar
18 / SolarPower Europe / EU MARKET OUTLOOKIn total, we expect the leading 15 EU solar markets to will be roughly 10 GW larger than today, with Germany
add 108 GW in the 5-year forecast period based on our again expected to be the largest market ahead of Spain,
most probable Medium Scenario. In 2023, the EU market France and the Netherlands (see Fig. 1.10).
FIGURE 1.10 CAPACITY ADDITIONS AND SHARES OF TOP 10 EU28 SOLAR PV MARKETS IN
2019 AND 2023
2019 2023
Rest of Europe
6%;1,068 MW
Spain Rest of Europe
Portugal 2%; 367 MW 28%; 4,680 MW 10%; 2,768 MW Germany
UK 2%; 374 MW Ireland 2%; 530 MW 23%; 6,140MW
Italy 4%; 598 MW Hungary 2%; 603 MW
Belgium 4%; 605 MW Poland 2%; 623 MW
UK 2%; 630 MW
Hungary 4%; 653 MW Portugal 4%; 1,085 MW
Poland 5%; 784 MW 16.7 GW 26.8 GW
France 6%; 1,068 MW Spain
Italy 11%; 3,267 MW 14%; 3,844 MW
Germany
Netherlands 24%; 3,985 MW
Netherlands
15%; 2,496 MW France
12%; 3,628 MW 14%; 3,712 MW
© SOLARPOWER EUROPE 2019
SolarPower Europe / EU MARKET OUTLOOK / 192
EU SOLAR TRENDS
10 TRENDS CRUCIAL FOR SOLAR
GROWTH IN THE EUROPEAN UNION
© AKUO
Piolenc, France, 17 MW.
The next growth phase of solar Solar’s electricity share in the EU is still small at around almost 5%, which
power has begun in Europe. With means the business opportunities are gigantic to tap its full potential both
solar combining critical growth in the distributed and central power generation fields – and in the power,
features of unmatched flexibility, heat and transport energy segments.
versatility, low cost – and the
In our first European Market Outlook we are taking a close look at the major
highest popularity of power
trends that will shape the growth of solar in the EU. We have selected 10
generation sources among
topics that are top priorities in our day-to-day work and present the
European citizens, it will take a key
challenges and opportunities in the fields that are critical to master in order
role for the European Union
to enable fast and sustainable dissemination of low-cost solar power.
meeting its 2030 climate targets.
1 Industrial Solar Strategy
2 Solar Buildings
3 Digital Solar
4 Solar Grid Integration
5 Sustainable Solar
6 Solar Mobility
7 Renewable Financing
8 Solar Powered Businesses
9 Emerging Solar Markets
10 Solar to Hydrogen
SolarPower Europe / EU MARKET OUTLOOK / 212 EU SOLAR TRENDS / CONTINUED
1. INDUSTRIAL SOLAR STRATEGY for at least 36% by 2050 according to Bloomberg NEF,1
and up to as much as 62% in a 100% renewables
As solar is on the brink of a renaissance in Europe, it’s scenario of Finland’s LUT University.2 Solar energy will
crucial to connect the dots for supporting local PV not only play a key role in delivering Europe’s renewable
technology manufacturers to compete at home and electricity targets, it has also a huge potential to
on a global level produce renewable hydrogen, which can help
Since the adoption of Europe’s first “2020 climate and decarbonise hard-to abate sectors.
energy package” in 2008, up to the approval of Europe’s Apart from decarbonizing the European Economy and
new 2030 targets in December 2018, the EU has shown leading by example, there is also an opportunity for
strong climate leadership. In 2018, the share of Europe’s 4th industrial revolution, with clean energy
renewables rose to 32.3% of total EU electricity technologies at its core. The Green Deal package should
generation. Solar in particular has impressive growth plant the seeds and come forward with a robust
prospects for the near future: following a 36% increase industrial strategy proposal. One of the key challenges
in 2018, additional solar installations rose to over 100% for EU policymakers will be to identify strategic
in 2019, reaching close to 17 GW, and meeting a critical European industrial value chains to deliver on three
milestone of 20 GW of annual installations in 2020. This critical priorities: (I) achieve higher climate ambitions,
is just the start of the second solar wave in Europe. (II) ensure a fair transition that creates jobs and growth
As the European Union steps up its leadership and across all EU countries, and (III) safeguard Europe’s
ambitions to become the first carbon neutral continent, security of energy supply. The European solar industry
solar power is ready to play a crucial role. From about has the potential to contribute significantly to all three
5% of Europe’s electricity mix today, solar might account strategic pillars.
© SMA.
1 Bloomberg NEF (2018): New Energy Outlook.
2 Lappeenranta University of Technology (2018): Global Energy System
based on 100% Renewable Energy.
22 / SolarPower Europe / EU MARKET OUTLOOKFirst, Europe is leading when it comes to R&D institutes Finally, with a major share in Europe’s 2050 electricity
providing world-renowned PV innovations. European mix, solar energy will play a key role for the continent’s
companies have joined forces with Europe’s leading economies. In order to guarantee security of supply, the
R&D institutes to develop state-of-the-art solar EU should also be able to access PV products along the
technologies and enhance a competitive upstream value chain manufactured domestically, and not only
solar industry; including silicon, wafers, cells, and rely on PV products developed and manufactured
modules. However, such initiatives lack the necessary outside of Europe.
support to scale up their production, which is crucial in
Now is the right time to support the growth of a robust
order to achieve global competitiveness
solar industry in Europe and develop a business
Second, PV production can deliver valuable growth environment that can provide EU solar companies with
activities in European regions that are undergoing an the means to compete at a global level. In line with the
economic restructuring. Solar is the most job-intensive approach developed by the Strategic Forum for
renewable energy source and can deliver a socially just Important Projects of Common European Interest
energy transition for Europe, creating over 500,000 (IPCEI), the new European Commission must establish
highly skilled jobs by 2030 and socio-economic benefits the European solar industry as a strategic value chain
across all member states. In particular coal regions for Europe. EU funding to support large-scale
represent a tremendous opportunity for further solar manufacturing, new financing tools, globally
growth and for the deployment of cutting-edge competitive electricity costs and tax exemptions, are
manufacturing sites that support industrial conversion. needed fast, to ensure that EU companies will fully
benefit from the European solar renaissance.
Author: Aurélie Beauvais; SolarPower Europe.
CHALLENGES OPPORTUNITIES
• EU and its member states lack industrial strategy for • EU benefits from a unique R&D ecosystem, which has
solar: The European solar industry faces increasing global developed world leading solar technology innovations
competition, while it misses a clear commitment from that could be industrialised in Europe.
European policy makers. Solar has not been identified as
• Big market prospects for solar in Europe open a chance
a strategic value chain whereas it will play a critical role in
for existing and new European PV manufacturers to
powering European industries and businesses.
re-establish a complete solar value chain and scale-up
• Single-sided focus on deploying renewables to their production and become globally competitive.
achieve carbon neutrality at lowest possible costs by
• Opportunity to brand the European solar industry as a
2050 without ensuring a robust European industrial
sustainability leader at the global level.
base at the same time.
• Keeping and further advancing solar technological
and industrial know-how in Europe.
• Insufficient European and national financial
instruments to support investment in innovative
technologies and industrial upscaling.
SolarPower Europe / EU MARKET OUTLOOK / 232 EU SOLAR TRENDS / CONTINUED
2. SOLAR BUILDINGS There is indeed a common denominator to almost all
buildings in the EU: unused rooftop space. In the EU,
Harvesting EU’s built environment for climate and only less than 10% of the available roof space is
industrial leadership currently equipped with solar panels, reaching a total
Buildings currently represent about 36% of the EU’s GHG installed capacity of around 80 GW. However, the cost-
emissions and almost half of its final energy effective rooftop potential of solar PV of existing
consumption. As such, the decarbonation of the buildings in the EU is huge, estimated to be about
building sector will be a critical driver to achieve carbon 680 TWh, or 25% of current electricity consumption,
neutrality in Europe by 2050. according to the European Commission.4 The available
surface area that could be used productively is greater
The Energy Performance of Buildings Directive (EPBD) when considering Building Integrated Photovoltaic
adopted in 2018 sets ambitious requirements for all new (BIPV) materials that can be applied beyond rooftops on
buildings (and those undergoing major renovations) to building façades, and also be installed on buildings
be Nearly-Zero Energy Buildings3 (NZEBs) by 31 protected by cultural heritage rules. Installing solar on
December 2020. Notwithstanding, new buildings will only all new and renovated buildings in the EU can save up
represent between 10% to 25% of the European building to 7 million tonnes of CO2 each year.
stock by 2050. However, it is not possible to tackle the
climate emergency unless bold steps are taken to On top of this, solar roofs are a great help to
accelerate the decarbonation of the EU's existing building complement energy efficiency measures at building
stock – and that’s where solar roofs step in. level. According to the recently adopted Energy
Furumo, Norway. © Otovo.
3 Buildings with a high energy performance where all or most of the energy
consumption is met by on-site or nearby renewables.
4 European Commission, Joint Research Centre (JRC) (2019): A high-
resolution geospatial assessment of the rooftop solar photovoltaic
potential in the European Union.
24 / SolarPower Europe / EU MARKET OUTLOOKEfficiency directive (Article 7), up to 30% of annual final The benefits are clear – and several EU and worldwide
energy savings can be achieved with on-site generation. cities are taking the lead to harvest this potential, by
implementing mandatory solar rooftop programs. In
Solar-powered buildings could bring significant gains in
2018, the German city of Tübingen introduced a
energy efficiency as well as improving health and air
requirement for solar PV to be installed on roofs of
quality in urban areas. In particular, heat pumps
buildings wherever cost-effective, with municipally led
combined with solar power will play a central role in
leasing options for those unable to self-finance the
driving solar-based electrification in residential buildings,
systems. More recently, following the introduction of a
whether directly installed in homes or used in district
solar obligation for new public buildings, the city of
heating networks. On-site solar combined with storage,
Vienna is currently revising its cadastre to address
demand response, digitalisation and home automation
building integrated PV solutions and the combination of
appliances will guarantee a direct and stable renewable
solar PV with green roofs, a combination that creates
energy supply to Europe’s future building stock and will
synergies between clean energy, energy efficiency and
contribute to power system flexibility, providing valuable
urban sustainability. In this new mandate, the European
services to the electricity system.
Union can take bold action to realize this potential by
Finally, the increasing cost-competitiveness of solar facilitating the access to finance for local authorities and
roofs make it a true driver to fight against energy EU citizens, boosting the renovation of existing buildings,
poverty. Today in Germany, a typical four-person family and develop an ambitious strategy for the training and
household with an average annual electricity up-skilling of EU workers in the electrical, renewable, and
consumption of 3,600 kWh could save more than building sector. Skills are a key missing block – altogether,
EUR 500 each year if equipped with an average sized more than 20 million jobs could be created by 2050, with
rooftop solar system. an ambitious policy for sustainable buildings.
Author: Miguel Herrero Cangas; SolarPower Europe
CHALLENGES OPPORTUNITIES
• The transposition by member states of the Energy • The potential for solar rooftops in Europe is gigantic:
Performance of Buildings Directive, which requires all At least 600 GW of rooftop capacity remains untapped
new buildings to be NZEBs by January 2021, is not yet across the EU.
complete. Definitions of NZEBs vary widely among
• Stepping up energy renovations can play a crucial role
member states, making direct comparisons problematic.
to deliver a just and fair transition by securing more
Further, not all member states include direct renewable
than 20 million jobs across the construction sector and
energy requirements in domestic legislation.
unlocking new opportunities local and qualified jobs.
• Addressing the energy performance of existing
• Security of supply: Deployment of on-site solar as part
buildings: EU legislation on energy performance of
of energy renovations can support security of supply of
buildings only covers new buildings, which will account
EU regions, cities and citizens, guaranteeing direct
for 25% of Europe's building stock in 2050. As a result,
renewable energy supply for electric vehicles.
energy renovation rates of existing buildings need to at
least triple to meet energy and climate objectives. • The renewable-based electrification of EU buildings
boosted with on-site solar installations can provide
• Slow uptake of solar rooftop installations despite its
valuable services to the electricity system.
huge potential in Europe due to lacking access to
finance, need to address re-skilling and upskilling of • An ambitious strategy to renovate the EU’s building
existing construction and electrical workers, and need stock would contribute to EU global leadership in
to raise awareness among EU citizens. clean building technologies such as in building energy
performance technology, complex on-site PV solutions
and high-tech BIPV products. It would also strengthen
Europe’s BIPV manufacturers.
SolarPower Europe / EU MARKET OUTLOOK / 25You can also read