Testing the Self-Interested Voter Hypothesis Evidence from the Macron victory in France - MIT Economics
←
→
Page content transcription
If your browser does not render page correctly, please read the page content below
Testing the Self-Interested Voter Hypothesis
                   Evidence from the Macron victory in France ∗

                                                    Antoine Levy†

                                                  August 10, 2020

                                                        Abstract

            Narrow material campaign promises can win elections. This paper demonstrates that a promise
        to abolish a broad-based housing tax accounted for a substantial share of Emmanuel Macron’s
        electoral success in the 2017 French presidential election. Using quasi-random spatial variation
        in the pre-reform tax burden across more than 35,000 municipalities, and instrumenting expected
        tax savings at the town level by formulaic real estate assessments established in the 1970s, I show
        that a one standard deviation (c. 1 percent of median household income) in exposure to the tax
        cut per household was associated with a c. 1.5 percentage point municipality-level increase in the
        Macron vote share in the first round of the election. These results are robust to adjusting for a
        rich variety of observable characteristics of the municipality’s electorate, including the predicted
        vote share for Macron from nation-wide polling shifts prior to the campaign promise. The implied
        aggregate boost was enough for the promised repeal to allow Macron to reach the run-off stage.
        Using high-frequency online search, polling, and prediction market data, I show that the timing of
        the promise coincided with a significant increase in voter information search, in Macron’s polling
        intentions, and in his market-based predicted chances of victory. My results evidence the crucial
        role of distributive politics for marginal voters, even in elections marked by ideological polariza-
        tion around non-economic issues.

        JEL codes: D72, H71, R38.

        Keywords: distributive politics, housing tax, France.

  ∗I   thank Arnaud Costinot, and Ivan Werning for their invaluable guidance. I am also grateful to – without implicating
– Treb Allen, David Amiel, Alexandre Andorra, Martin Bocquet, Elizabeth Cascio, Daniel Cohen, Celine Colange, William
Fischel, Joel Gombin, Quentin Jeantet, Mathilde Muñoz, Jacob Moscona, and Francesco Passarelli for helpful discussions
and feedback. Part of this paper was written while in residency at Dartmouth College, whose hospitality is gratefully
acknowledged.
   † MIT Economics Department (email: levya@mit.edu)
1     Introduction

American journalist and satirist H.L. Mencken once quipped that ”every election is a sort of advance
auction sale of stolen goods”1 . The cynicism of that proposition notwithstanding, it is a widely ac-
cepted tenet of political economy discussions that rational voters elect candidates based on their
narrow self-interest, and that expected material gains from one policy platform over another could
push marginal voters to choose a side in electoral contests.2 During local or national campaigns,
candidates indeed regularly promise redistributive transfers, reductions in taxes, or ”pork-barrel”
government spending targeted towards certain locations, production factors, or specific segments of
the electorate. Whether these electoral promises mostly constitute ”cheap talk” of little credibility, or
whether, on the contrary, campaign announcements indeed shape voting behavior, is a crucial ques-
tion for the empirical content of economic models of the vote. Can politicians win elections by merely
promising higher transfers or lower taxes on certain constituencies once elected?
In this paper, I leverage quasi-random exposure variation across more than 35 000 townships (com-
munes) in France to estimate the causal impact of a promised local tax cut on voter support. In the
months leading to the highly disputed first round of the 2017 French presidential election, new-
comer candidate Emmanuel Macron promised to repeal a widely unpopular local residence levy, the
”taxe d’habitation” (TH), while committing to compensate municipalities for any lost revenue. The
promised repeal of the TH, combined with the implicit assurance that municipalities would not have
to raise additional taxes to replace foregone receipts, generated significant spatial heterogeneity in
expected net savings from this nationwide policy platform, depending on the initial TH tax bill. Us-
ing administrative data on variation in the local TH burden, which hovered around 2 percent of local
disposable household income, and polling-place-level electoral returns from the first round of the
2017 election, I show that expected benefits per household causally explain a substantial share of
Macron’s electoral support, over and beyond his predicted success based on the characteristics of the
local voting body.
The average initial housing tax bill in a town may plausibly have been correlated with observed and
unobserved determinants of the propensity of the municipality’s electorate to lean towards a specific
candidate. Such endogeneity could arise because households of different political stripes sort them-
selves across towns with varying housing values, through spatial sorting of political preferences, as
in Rodden (2010). Alternatively, it could come from municipal councils elected by potential Macron
    1 Sham
         Battle, The Baltimore Evening Sun, October 26, 1936
    2 See e.g.
            the seminal contributions of Downs (1957), Lindbeck and Weibull (1993), Lizzeri and Persico (2001); or Persson
and Tabellini (2016) for a general treatment of economic voting models.

                                                            2
supporters being more prone to set high local housing tax rates, making the initial tax bill correlated
with local political ideology. As described in detail in section 2, however, the tax base for the TH
was devised in reference not to current housing market values, but rather to outdated rental rates,
assessed in the early 1970s for a few ”reference units” at the municipality level, never updated since
besides a nationwide inflation adjustment, and outside the control of today’s local authorities. These
institutional features implied large, conditionally random variation in taxes between otherwise com-
parable municipalities, depending on 1970 assessments. They also generated substantial redistribu-
tion between similar households across locations, and thus drew attention to the horizontal inequity
of the tax before the election. Therefore, ”assessed rental values” from the 1970s, aggregated at the
municipal level, constitute an instrument for the expected tax savings, both strongly relevant – as
they directly enter the tax computation, and plausibly orthogonal to other local determinants of the
propensity to vote for Macron, conditional on current housing values interacted with current local
tax rates.
Controlling for housing values – using exhaustive transaction data on more than three million pre-
election home sales – and administrative measures of local tax rates, I show that higher local expected
savings from the TH repeal, driven by variation in 1970 assessments of the tax base, causally increase
the Macron vote share. Adjusting for socio-demographic characteristics, election day returns show
that municipalities with a one standard deviation higher tax bill (instrumented by the initial 1970
average house assessment in the town) exhibit a statistically significant improvement of the voting
performance of Emmanuel Macron of close to 1.5 percentage points, relative to its predicted value
based on past electoral results. Voters were more likely to choose Emmanuel Macron when they ex-
pected his election to offset a higher initial local tax bill.
Heterogeneity analysis using census data lends credibility to this causal mechanism. Localities with a
larger share of homeowners (who stood to gain more, through capital gains, from reduced user costs
of housing) and a smaller share of households exempt from the tax, were more responsive to the pol-
icy promise. The results survive a battery of robustness checks, ranging from including additional
controls, to comparing only municipalities that share a geographic border to adjust for spatially cor-
related political shifts, to using other electoral contests when the TH was not up for debate as placebo
tests. Moreover, I show that voter search for information about Macron’s proposal on the housing
tax, as inferred from Google searches, spiked around the announcement and close to election day.
Event studies, using aggregate high-frequency polling and prediction markets data, also display a
nationwide impact of the tax cut announcement on Macron’s winning chances, consistent with esti-
mated local effects.
3Therefore, using the conditionally random components of pre-treatment exposure to the planned cut
in the housing tax at the municipality level, across more than 35,000 incorporated towns, I validate
the hypothesis that material self-interest constitutes a key motivation for voting behavior, even in
ideologically polarized contests such as the 2017 French presidential election, hailed worldwide as
a defining showdown between a populist far-right animated by identity concerns and a progressive
center.3 The results suggest that tax cuts aimed at peculiarly salient, lump-sum, and politically con-
troversial levies, might be especially efficient in triggering increased electoral support.
Politicians regularly make campaign promises involving substantial amounts of fiscal and non-
fiscal redistribution across income levels, age groups, or other constituencies. A considerable body of
theoretical work has studied the pre-election role of such ”distributive politics” (Weingast, Shepsle, &
Johnsen, 1981), and the resulting incentives for politicians to engage in material campaign promises
(Aragonès, Postlewaite, & Palfrey, 2007; Feldman, 1982). The pivotal role of such promises is a staple
of political science modelling, and the ability of politicians to credibly commit to implement their
campaign platforms has been the object of widespread theoretical controversy. While it is commonly
accepted that voters may make electoral decisions based on their own self-interest, credible empirical
evidence is surprisingly limited. This paper contributes to this literature.
On the one hand, a large empirical corpus, summarized early on by Lewis-Beck and Stegmaier (2000),
has explored the ”retrospective” economic determinants of the vote. Most existing work has focused
on the role of cyclical economic outcomes, or windfall gains, for the electoral success of incumbents,
at the national or local level. Studies in this strand of literature have made use of either time series
evidence (Brender & Drazen, 2008), or, more recently, quasi-random spatial shocks to economic per-
formance (Brunner, Ross, & Washington, 2011) or wealth (Bagues & Esteve-Volart, 2016) to test for
the role of retrospective or ”attributional” motives in the vote share received by incumbents. Some
researchers have examined more specifically the role of past fiscal transfers for electoral outcomes,
using credibly exogenous geographic variation in expenditure outlays (Levitt & Snyder Jr, 1997) or
truly randomized cash payouts (De La O, 2013; Manacorda, Miguel, & Vigorito, 2011; Zucco Jr, 2013),
although tax cuts have received comparatively less attention.
As in this paper, a handful of contributions have exploited local variation in exposure to a nationwide
policy action, also with the goal of estimating the ex post electoral impact for local incumbents of tax
and spending policies, a distinct question from my focus on campaign promises and their nationwide
impact. For example, Casaburi and Troiano (2016) have shown that an increase in tax enforcement
3 See e.g. Financial Times, April 26, 2017, ”Emmanuel Macron offers the patriotic antidote to nationalism”.
4intensity in Italy, hitting various regions differentially, had a positive impact on local reelection prob-
abilities. Fetzer (2019) estimates the impact of austerity measures in the United Kingdom on local
and individual-level support for the UKIP party and Britain’s exit from the European Union. This
strand of literature has heretofore focused on ”retrospective”, or so-called ”pocketbook”, motives,
whereby voters receiving higher (lower) transfers reward (punish) incumbents. While I also rely on
plausibly exogenous spatial variation in policy exposure, my focus is on the ex ante response of the
vote to a campaign promise in a national - rather than local - electoral contest, before the program is
implemented.
Only a few studies have explored topics closer to the subject of this paper: whether campaign
promises of future tax and transfers shape electoral support. Recent work on campaign efficacy
has taken advantage of differential quasi-random or truly randomized exposure to information about
politicians’ platforms (Cruz, Keefer, Labonne, & Trebbi, 2018; Kendall, Nannicini, & Trebbi, 2015;
Spenkuch & Toniatti, 2018), to estimate voting responses by focusing on the role of voter knowledge,
leaving aside differential exposure to actual policies implemented. Work by Elinder, Jordahl, and
Poutvaara (2015) studies a Social-Democrat Party campaign proposal in Sweden affecting tax and
transfers differentially for parents with children of various ages. Exploiting declarative survey data
and the differential targeting of parents with kids in various age brackets, they demonstrate the qual-
itative relevance of prospective self-interested voting: exposed parents were more likely than their
less affected counterparts to vote for the party promising increased transfers. My strategy instead
exploits quasi-random geographic variation across locations in exposure to a promised tax cut, relies
on exhaustive municipality-level electoral returns and administrative tax data as opposed to survey
evidence, and is concerned with a much larger tax cut proposal, representing close to 2 percent of
household annual income. My paper’s main contribution is thus to expand our understanding of the
electoral efficacy of campaign promises at the national level, leveraging differential quasi-random
local exposure, and controlling for ideological shifts and socio-demographic composition.
Finally, by focusing on the differential electoral impact of a local residence tax repeal, this paper
speaks to the literature on the political economy of local taxation. Existing work suggests that munic-
ipalities tend to reduce local business and real estate tax rates in election years. While several authors
have investigated the existence and magnitude of such local political budget cycles (e.g. Aidt and
Mooney (2014) in London, Foremny and Riedel (2014) in Germany, or Alesina and Paradisi (2017) in
Italy), the role of these taxes for national electoral outcomes remains mostly terra incognita. Despite
the sizeable effect of local taxes on voters’ disposable incomes in many advanced economies, this
5paper is the first in the literature, to my knowledge, to explore the interaction between local taxes and
national politics.
2 Institutional background and data
2.1 The 2017 French presidential election
I study the electoral benefits of material campaign promises in the 2017 presidential election in
France. France has a democratic presidential regime; the president is elected every five years by pop-
ular vote in a two-rounds majoritarian electoral system. In April 2017, the first round pitted eleven
candidates against each other; the two candidates who obtained the most votes in the first round
(center-left Emmanuel Macron and far-right Marine Le Pen in 2017) advanced to a runoff stage in
which they faced each other, two weeks later. The 2017 election exhibited a series of unusual fea-
tures, making it especially well-suited for the study of the electoral efficacy of campaign promises.
First, the incumbent president, Socialist Party’s Francois Hollande, facing historically low popularity
ratings, decided not to run for re-election on December 1st , 2016. A rare occurrence in French pol-
itics, the decision is also a key advantage for my empirical design, as the absence of an incumbent
candidate voids the usual difficulty associated with disentangling retrospective voting, motivated by
”rewarding” or ”punishing” incumbents, from the impact of campaign promises.
Second, two major traditional parties, the right-wing Les Republicains (LR) and left-leaning Parti So-
cialiste (PS), held open primaries for the first time since the beginning of the Fifth Republic in 1958.
Both chose ”surprise” candidates, former Prime Minister Francois Fillon for LR and former Education
Minister Benoit Hamon for PS, instead of the respective early poll leaders, former Prime Ministers
Alain Juppe (LR) and Manuel Valls (PS). Competition in the general election was thus open, with
five candidates (Fillon, Hamon, Macron, Le Pen, and Jean-Luc Melenchon, leader of far-left party La
France Insoumise-LFI) enjoying plausible chances of advancing to the runoff stage.
Third, the candidate for the main opposition party (LR), Francois Fillon, was engulfed in a political-
financial scandal. Le Canard Enchaine, a satirical weekly newspaper, revealed in January 2017 that Mr
Fillon had employed his wife and two of his children as aides while a member of parliament, and
that they were paid in exchange for little actual work. This scandal made Fillon, the early polling
leader in January, drop to third place in a few weeks, and generated substantial volatility in polling
intentions.
In this context of heightened political uncertainty among traditional parties, Emmanuel Macron, a
6former economic advisor and then Economy Minister in Francois Hollande’s cabinet, but a relative
newcomer in electoral politics, mounted a bid for the presidency. He founded a new political party,
En Marche, in April 2016, kick-starting his campaign by a show of force in his hometown, Amiens. He
formally announced his bid for the presidency on November 16th , 2016, after a series of encouraging
polls suggested he could capture a non-trivial share of votes in the first round. Fillon and Hamon
had run primary campaigns to the right- and left-wing of their respective parties, opening substantial
political space for a centrist candidacy, according to observers4 . On February 24th , 2017, Emmanuel
Macron was a guest on one of France’s most watched morning shows, Bourdin Direct. He announced
that, if elected president, he would exempt the bottom 80% of households by income (c. 18 million
households) from the taxe d’habitation, a local residence tax. On April 23rd , Macron received the most
votes in the first round of the presidential election, with 24.01% of the overall vote. He advanced to
the second round, facing populist right-wing candidate Marine Le Pen. On May 7th 2017, Macron
won the second round of the presidential election with c. 66.1% of the vote, becoming the eighth
elected president of the Fifth Republic.
2.2 The French housing tax
The taxe d’habitation (TH) that Mr Macron promised to repeal is a housing tax assessed by the State
on behalf of local governments. The TH is collected on all furnished housing units and remitted
by resident households, irrespective of their ownership status (renters or owner-occupiers).5 It is
one of four main sources of recurring tax revenue for local authorities in France.6 While the TH
follows a complex array of rules, deductions, and exemptions,7 it is broadly the product of a tax base
(historical rental values determined in 1970 for each unit and never locally adjusted since, minus
some progressive deductions and allowances) and two tax rates, respectively set by municipalities
(communes) and inter-municipal cooperations (Etablissements publics de coopération intercommunale),
4 Daniel Boy, a researcher at the CEVIPOF, France’s largest political science research center, remarked in January 2017:
”Between these two candidates, substantial political space is emerging in the center and the context is ideal for Emmanuel
Macron.” Historian Jean Garrigues concurred: ”Part of voters who supported [centrist candidates] Alain Juppe in the LR
primary and Manuel Valls in the PS primary feel incompatible with the primary winners. There is a programmatic and
political space in between.” Présidentielle: Entre Fillon et Hamon, Macron a-t-il un boulevard au centre?, 20 Minutes, January
31st , 2017
5 Residents of occupied units are defined as the owner-occupier or the renter occupying the housing unit as of January
st
1 of each year; for vacant units, the tax is paid by owners.
6 These also include a property tax (the taxe fonciere sur les proprietes baties), a tax on undeveloped land (taxe fonciere sur
les proprietes non-baties), and a local business tax (the Local Economic Contribution or Contribution Economique Territoriale,
a successor to the Taxe Professionnelle). Breuillé, Duran-Vigneron, and Samson (2018) provide a detailed overview of the
various components of municipal taxation in France. Municipalities also rely on direct government grants to fund their
operations.
7 In 2018, the French government made the source code for the computation available as part of its open data policy, at
the following address: https://github.com/etalab/taxe-habitation/tree/master/codeT H.
7with the largest share attributable to the municipality. I describe its main features of interest for the
empirical strategy succinctly below, and provide additional details on its computation in appendix
A.
Tax base The tax base is an assessed annual renting value of the unit, the valeur locative cadastrale
(VLC). The VLC, also used for the computation of other local taxes in France, is not predicated on the
market value of the unit. Rather, it is the product of an estimated weighted square footage (surface
ponderee), and an imputed reference rent per square meter (tarif de reference). The weighted square
footage takes the actual square footage of a housing unit in 1970 (or at the time of construction), and
re-weights it according to a complex parametric formula depending on size, ”quality ladder”, 1970
condition, 1970 neighbourhood quality, and the presence of what were deemed in 1970 to be ”com-
fort” elements, like running water or an elevator. The actual rents of a few ”representative units”
(5.2 percent of units nationally) were observed as of January 1st , 1970, for each quality ladder in each
town, dividing the market rent by the ”weighted square footage” of these units. Other housing units
in a municipality were allocated the corresponding category-specific ”reference rent” per square me-
ter. Multiplying the ”reference rent” by the ”imputed square footage” of the unit yielded a nominal
VLC as of January 1970, or VLC70.
The law calls for a revision of the VLC70 every three years. However, in practice, revisions never oc-
curred due to the administrative complexity of the task, and almost no changes to the imputed square
footage of a unit were made even in the case of remodellings or additions. VLCs were ”actualized”
once in 1980 at the province-level, yielding VLC80.8 . Since 1981, the French Parliament establishes
an annual indexation coefficient applicable nationwide, yielding current VLC in year n (VLCn) for
each unit. Special deductions are available for older citizens, lower-income households, people with
disabilities, and households with children.9
Tax rates Given their determination, the VLC are outside the control of today’s municipalities. In-
deed, smaller municipalities often only receive information from the national revenue service on the
aggregate VLC in the town, not that of individual units. City councils, on the other hand, vote every
year on the tax rate applied to the base.
As of 2016, there were two main rates in force: at the municipality level, and at the level of the
8 There
are 96 provinces or departements, each of which contains c. 350 municipalities on average, making the 1980
adjustment rather crude. More details are provided in appendix A
9 They take the form of a fixed rate (e.g. 10% per additional child) multiplied by the average VLC in the municipality,
VLC jt .
8inter-municipal cooperation (a syndicate of towns jointly providing local public services). Tax rates
vary widely across municipalities, reflecting political priorities and funding needs, conditional on as-
sessed values. Given their absence of control over the tax base, the rate of the TH was one of the main
instruments for municipal councils to balance their budget until 2017. The distribution of tax rates as
of 2016 is described in figure 1, and exhibits substantial dispersion across municipalities. Additional
tax rates accruing to the central government are applied to units with a VLC above some threshold B̄,
and to secondary homes. Some households (people above 60, disabled individuals, and widowers)
with an income below a threshold close to the national poverty line adjusted for household size, are
exempt from the tax. Finally, the tax is subject to a ceiling of 3.44% of the household’s annual fiscal
income.
Summary of the tax computation The total tax due by a household is equal to the product of the
tax base by the local tax rates set by municipalities and inter-municipal cooperations. It is increased
by a flat fee Ft of 1 to 3 percent of the tax due, to finance the administrative collection workload. The
tax owed by a household h with income Yht and characteristics Xht , residing in municipality j in year
t, for a unit classified in category k, abides by the following formula:
0 if Yht ∈ Ωt ( Xht ), the exoneration set for households with characteristics Xht
Taxhjkt =
min [1 + F ] × τ Com + τ EPCI( j) + τ High 1[Base
hjkt ≥ B̄ ] × Basehjkt ; 0.0344 × Yht otherwise
t jt t t
(1)
where the base is the VLC, minus deductions that depend on household characteristics, city council
choices, and the average VLC in the town. The VLC itself the product of weighted square footage
– depending only on the housing unit, and reference rents varying by category k, municipality j,
departement-level actualization in 1980 (A) and national indexation from 1980 to t (I) coefficients:
VLC70 jh
= WeightedSqFthk × Rate jk,1970 ×ADep( j),1970→80 × ∆I1980→t − ∑ DedRaterjt ( Xht ) × VLC jt
z }| {
Basehjkt
| {z } r
VLC jht
(2)
Heterogeneity of the tax burden The absence of local revisions of rental rates and imputed square
footage over more than 45 years led to a substantial geographic disconnect between current market
valuations and the formulaic assessments. Housing units in some regions, such as the Mediterranean
Coast or the hinterland of Britanny, and homes in suburban areas within municipalities, were newly
9built in 1970. These units were deemed in good condition as they benefited from then ”modern”
amenities, leading to high reference rents in what had become mostly decayed social housing units
or periphery areas forty-seven years later, in 2017. On the contrary, city centers in most of France’s
large cities, including Paris, Bordeaux, or Lyon, were only rehabilitated in the 1980s and 1990s un-
der the impulse of the ”Malraux” fiscal incentive scheme.10 Along with some newly gentrified rural
towns, these areas had implausibly low VLC70s and assessed rental rates as of 2017, both due to their
decayed condition in 1970, and to their relatively poor geographic situation back then.
The TH was thus widely decried as France’s most unfair tax, mostly due to horizontal equity con-
cerns.11 The proportional tax burden was substantially less on single-family homes and recently
renovated apartment buildings in city-centers, mostly populated by higher-income households, than
in rural periphery towns and large social housing projects in poorer suburbs. This burden-shifting
regularly led to Parliamentary reports,12 the creation of advisory committees, and popular press out-
cry. The housing tax was particularly burdensome for younger households and poorer individuals in
rural townships, given its applicability to renters and its one-time annual lump-sum payment. Since
only 43 percent of households paid any progressive income tax (Impot sur le revenu) in 2016, the TH
was the only broadly applicable and salient tax payment remitted by households at almost all income
levels above the poverty line.13
2.3 Data description
I describe succinctly below the use of electoral, local government finance, administrative house sales,
census, and geocoded data for the construction of my main sample. Additional details on the con-
struction of the data are provided in appendix B.
Electoral outcomes To construct my outcome variables, I use exhaustive data on electoral outcomes
for all municipalities in France in the first and second rounds of the 2017 and 2012 presidential elec-
tions from the French Interior Ministry. In 2017, all 35,281 municipalities in France’s mainland ter-
10 For historical details, see notably Vignolles (2014).
11 See e.g., among countless examples, Challenges, a popular weekly, on November, 13th , 2014, titling: ”Why the housing
tax is the most unfair of all taxes”.
12 Together, the Senate, National Assembly, and two advisory and control bodies, the Cour des Comptes, and Conseil des
Prelevements Obligatoires, authored more than twenty reports dedicated to the need for a general revision the imputed rental
values from 1990 to 2017.
13 Most households not subject to the progressive income tax but receiving wage or pension income do pay the c. 20
percent Value Added Tax on consumption, a c. 10 percent flat wage tax (CSG/CRDS), and social security contributions
covering health and unemployment insurance ranging from 30 to 60 percent of total labor costs. Nonetheless, because
these are either directly subtracted from gross income or included in sale prices, these contributions are generally not as
salient as direct tax payments from the point of view of households (see e.g. Bozio, Breda, and Grenet (2017)).
10ritory reported exhaustive electoral data. Out of these municipalities, more than 80 percent only
include one polling place; 60 percent of registered voters live in municipalities with less than 10
individual polling places.14
Local taxation Using the French Treasury’s Recensement des Elements d’Imposition a la Fiscalite Locale
(REI) database as of 2016 – the last year of taxes known to households at the time of the election
– I obtain detailed information on TH tax rates, tax revenues, aggregate and average rental values
(VLC), as well as municipality-specific deduction rates, and the number of beneficiaries of all deduc-
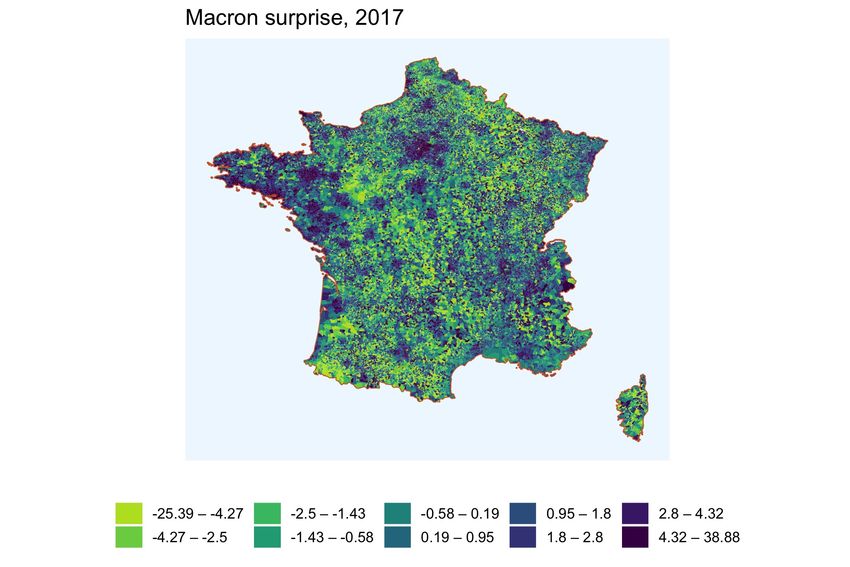
tions and exemptions. The map in figure 3a displays the spatial variation in my main dependent
variable, the average TH receipts per household subject to the tax in a municipality, across the French
mainland territory. The baseline measure of average tax burden in 2016, THj1 , is available for 35,197
municipalities in France that I can merge to both 2017 and 2012 electoral data. These 35,197 munic-
ipalities, representing 99.97 percent of municipalities and close to 94 percent of the electorate in the
2017 election, constitute the baseline sample.15 Across these main-sample townships or communes,
with a median number of registered voters of 345 (mean: 1260), the average housing tax burden
(weighted by number of registered voters in the municipalities) was around 733 euro, with a stan-
dard deviation of 245 euro. On average, it represented 2.3 percent of mean income per household in
the municipality.
Housing market values When using historical assessments as an instrument for the local tax bur-
den, I control for current house values. To do so, I construct market values from administrative
transaction data on c. 3 million home sales from 2014 to 2017, using the Demande de Valeurs Foncieres
(DVF) database provided by the French Finance ministry.16 Matching geo-coded transactions to their
municipality, I compute median and mean home values, and price per square meter, for home sales
in each municipality. Current house prices are correlated at the municipality level with the mean as-
sessed rental value (VLC) obtained from the REI file, since long-run persistence in consumption and
production amenities suggests that house prices should exhibit substantial auto-correlation, even
over close to five decades. The (log) VLC based on 1970 values, and the current (log) median home
14 Precinctsor polling places, which count 670 registered voters on average and are recommended not to exceed a maxi-
mum of c. 1000 voters, are the smallest unit level at which votes are recorded, but do not correspond to any administrative
tax unit. Votes are also recorded at the municipality level, which is the relevant TH administrative layer. The average
municipality counts 1260 registered voters.
15 When including additional controls, the sample size varies slightly according to data availability, because INSEE does
not disclose municipality-level data when it can be used to re-identify information about less than fifty households or a
hundred individuals.
16 See Casanova Enault, Boulay, and Coulon (2019) for a detailed description of the DVF database and potential caveats
in the reporting of the data.
11value line up relatively closely, as shown in figure 4, with a correlation of 0.57 (0.52 when using the
mean home value). Nonetheless, there remains substantial heterogeneity in VLCs even conditional
on current home values.17
Municipality characteristics As described in detail in B, I use additional variables at the munic-
ipality level from a variety of sources: local income by decile and income composition by source
from the FiLoSoFi database, mean income from the Dotation Globale des Collectivites Locales dataset,
aggregate income tax payments from the Impot sur le Revenu des Communes file. I use Housing Census
data to compute the share of homeowners and the share of secondary residences in a municipality,
and OpenStreetMap, a collaborative geographic information project, to identify neighbouring mu-
nicipalities. Table 1 describes summary statistics across municipalities for two subsets of controls:
those used in the full sample (panel (a)), and those restricted to the subset of larger municipalities (or
county seats, chefs-lieux de canton) with available details on the full distribution of household income
by decile (panel (b)).
Aggregate data I use nationwide polling data from Elabe to adjust local Macron voting intentions by
aggregate polling shifts from 2012 candidates to 2017. Data from a polls aggregator, PollsPosition, as
well as Google Trends Internet search data, and prediction market prices from PredictIt, are employed
to study the dynamics of voting intentions around the TH repeal announcement in February 2017.
3 Conceptual framework and estimation strategy
3.1 Identification concerns
Documenting the efficacy of material campaign promises in delivering electoral support is a cru-
cial step in giving empirical credence to the theory of the self-interested voter.18 While a staple of
theoretical modelling of electoral behavior, credible causal empirical evidence on the so-called ”self-
interested voter hypothesis” remains scant, notably because identification issues can plague the direct
estimation of the causal effect of policy platform commitments on voter behavior. Letting Vic be the
event where voter i votes for candidate C, and PPGC be the monetary benefit that group G draws from
17 A
regression at the municipality level of log VLC on log median home value yields an R-squared of only 0.32 (0.27
when using the mean home value), suggesting substantial unexplained variance in mean VLCs across towns conditional
on current real estate market conditions, given the almost fifty years lag between the two assessments, and the market
value nature of the latter as opposed to the administrative assessment of the former.
18 See Golden and Min (2013) for a review of empirical work
12a policy promise made by C, a simplified model of voter choice is:
P(Vic = 1) = α + βPPGC × 1(i ∈ G ) + eiC (3)
Conceptually, the parameter of interest is β: the causal effect of an additional euro promised by a
candidate C to voters in group G on the probability that a voter i ∈ G votes for C. However, because
the benefit of voting for candidate C, from the point of view of voter i, is generally not randomly
assigned, a strategy of merely quantifying whether potential beneficiaries of a campaign promise are
more likely to support the corresponding candidate is subject to substantial endogeneity concerns:
eiC is likely to be correlated with PPGC × 1(i ∈ G ). These endogeneity concerns can be related to five
main sources.
Measurement error First, neither platforms nor policy preferences are uni-dimensional. The deter-
minants of each constituency’s welfare, whether economic or not, are many-fold, and identifying the
precise impact of one electoral promise (PPGC ), out of the many that constitute a politician’s platform,
is a difficult task. Conversely, because regulatory reforms, public good provision rules, and tax and
spending policies have complex consequences for individual situations, it is often hard to pinpoint
ex ante precisely who stands to gain from a given material campaign promise, and thus to link tar-
geted groups to their electoral response. This latter difficulty is especially pronounced when using
survey data, where not only information on vote choice is declarative and noisy, but only limited
demographic information on respondents (whether 1(i ∈ G )) is available to quantify their poten-
tial financial gains from a candidate’s platform. From an econometric perspective, this implies that
whether a voter is a net beneficiary from a given candidate’s overall platform is measured with sub-
stantial error, which could attenuate and blur any directional relationship between political support
and potential financial rewards.
Reverse causality Second, policy promises are not randomly assigned, but rather the outcome of a
decision by candidates and parties, which can reflect expected electoral strength. Thus, reverse causal-
ity may amplify or attenuate the correlation between the individual benefits from a policy platform,
on the one hand, and the likelihood of voting for a candidate, on the other. If campaign promises
respond endogenously to expected electoral support (because a candidate is trying to mobilize po-
tential supporters, or conversely to counter weakness in a given category of voters, by offering a
policy PPGC designed to benefit them), then the direct causation from economic benefits of electoral
13promises to electoral support will be obfuscated by reverse causality.
Confounding Third, policy platforms and voter behavior could both be partly determined by a dif-
ferent omitted variable in eiC , confounding the direct relationship. For instance, a candidate may
promise to impose international tariffs for ”identity”-related reasons (Grossman & Helpman); if
poorer individuals consume more imported goods (Fajgelbaum & Khandelwal, 2016), but are also
more likely to vote based on identity motivations (Rodrik, 2020), they could be found to support the
candidate, in spite of their purchasing power being harmed more by her policies. Empirically, this
means that alternative unobserved determinants of voting behavior, such as personal ideology, are
likely to be correlated with the targeting of policy platforms to certain groups, leading to omitted vari-
able bias. If voters tend to favor some contender for ideological or ”identity” reasons, non-economic
rationales for a specific policy may preclude a direct estimation of the impact of monetary gains from
a platform on political support.
External validity Fourth, and partly due to the aforementioned concerns, researchers wishing to
identify the causal impact of electoral promises sometimes resort to location-specific campaign is-
sues (e.g. targeted spending on local infrastructure, such as a new airport in Ahlfeldt and Maennig
(2015)). However, an external validity trade-off arises, between using well-identified local variation in
electoral promises, and drawing broader implications for the political consequences of nationwide
tax and spending policy platforms. Indeed, because locally targeted spending, by its very nature,
rarely represents a substantial share of a country’s aggregate income, generalizing its consequences
to electoral behavior in national politics is challenging.
Retrospective and prospective motives Finally, the presence of retrospective voting motives (”pun-
ishment” and ”rewards”) makes the role of incumbent candidates particularly challenging. Office-
holders may campaign differently from newcomers, and also stand different chances in electoral
contests, due to incumbency advantage or fatigue. Incumbency can therefore be a source of bias
when estimating the impact of policy promises on voting outcomes: voter motivations may include
both retrospective and prospective dimensions; and the credibility of campaign promises may vary
between incumbents with a proven track record and newcomers. Incumbency may thus hamper the
identification of the role of campaign promises in triggering prospective electoral support.
143.2 Baseline specification
Overcoming these limitations thus requires precisely measured and economically substantial varia-
tion in the benefits expected by different groups from a one-dimensional nationwide policy promise,
where such credibly exogenous variation is not confounded by correlates of ideology nor driven
by political targeting, and operates in the absence of any incumbency effect. This paper leverages
exactly such heterogeneity, in the context of the 2017 French presidential election and housing tax
repeal, providing evidence that marginal voters take into account expected individual gains from
campaign promises when making electoral decisions in national politics. Under the self-interested
voter hypothesis, voters located in towns facing an initially higher housing tax burden, motivated by
their narrow material interests, should have been expected to vote in higher numbers for Emmanuel
Macron, all else equal.
Defining j(i ) as the municipality where voter i lives, a promise by candidate c to repeal the local hous-
ing tax effectively amounts to a locally-varying policy: PPGC × 1(i ∈ G ) = THj(i) , so that equation 3
writes (adding individual observed determinants of the vote Xi ) :
P(Vic = 1) = α + βTHj(i) + γXi + eiC (4)
One can decompose the error term eiC as the sum of a city-level common residual, η jC , and an in-
dividual error term that is mean zero within each city ηiC . Variation in the TH tax burden is local
and pre-determined from the perspective of the individual. Aggregating votes at the municipal level
yields an equation relating the share of votes for candidate C (Macron) to the local TH level:
MacronShare j,2017 = α + βTHj + γ X̄ j + η j (5)
3.3 Adjusting for local ideology
The baseline approach followed above neglects the concern that unobserved determinants of local
political ideology might be correlated with the initial housing tax burden. To disentangle the specific
role of the tax cut proposal, I first adjust my electoral outcome measure (the Macron vote share in the
first round) for two alternative proxies of the predicted Macron vote share, the ”polling shift” and
the ”prediction error”:
• The polling shift approach: Under this methodology, I predict the 2017 Macron vote share based
on a shift-share design, using aggregate vote intentions shifts from 2012 to 2017 before the pol-
15icy announcements, and local electoral results in 2012. Specifically, I rely on pre-announcement
polling data from Elabe, a leading French pollster. A study released on February 21st study,19
included a decomposition of voting intentions based on the 2012 first-round vote of the respon-
dent (for the top five 2012 contestants, representing 95 percent of the vote nationally). Given
the estimated share λk of supporters of 2012 candidate k who stated in the poll they plan to
support Macron, I construct the polling shift variable as:
5
PS j = ∑ λk ω jk,2012
k =1
where ω jk,2012 is the share of 2012 registered voters who supported candidate k in municipality j.
This provides me with a predicted share, in township j, of supporters of any of the top five 2012
candidates, indexed by k, planning to support Macron before he announced the TH exemption
20 .
• The prediction error approach: In this alternative methodology, I use the full sample of munic-
ipalities, and regress the 2017 vote share of Emmanuel Macron on the vote share (as a share
of registered voters) of each of the 10 candidates (plus turnout) in the first round of the 2012
election.
k =11
ω j,Mac,2017 = ∑ β k ω jk,2012 + e j,2017
k =1
I then use only the residual of this prediction, as my dependent variable PEj for the Macron
vote share ”purged” from predictable realized shifts due to the ideological composition of the
local electorate in j:
k =11
PEj = ω j,Mac,2017 − ∑ βˆk ω jk,2012
k =1
This residualization amounts to flexibly adjusting in the main specification for the share of
each candidate in the municipality in 2012. One should note that the residualization implicitly
neutralizes the impact of the Macron platform on the average municipality, thus only leaving
room for heterogeneous effects depending on the initial tax burden.
19 Fieldwork was conducted five days to three days prior to the tax cut announcement
20 The polling intentions λk used are: 3 percent of 2012 Melenchon voters, 34 percent of Hollande voters, 42 percent of
Bayrou voters, 15 percent of Sarkozy voters, and 1 percent of Le Pen voters, intending to vote for Macron in the first round.
Since the polling shift predicted Macron vote share is only based on the top five candidates in 2012, representing 95 percent
of the vote nationwide, I re-scale the values obtained so that the aggregate nationwide number of predicted Macron votes
in 2017 matches the actual total number of Macron votes.
163.4 Instrumental variables strategy
Even conditional on 2012 presidential election results at the municipality level, and a wide array of
observable characteristics, the main identification concern comes from omitted variables driving the
correlation between the pre-election housing tax burden THj , on the one hand, and the Macron vote
share adjusted for national 2012-2017 shifts, PS j or PEj . In particular, a higher value of real estate
in the municipality may be correlated with the unpredictable component of support for Emmanuel
Macron, on the one hand, and the initial TH burden, opulations with different political ideologies
tend to sort themselves into areas with different productive or consumption amenities reflected in
housing values;21 alternatively, local voters with idiosyncratic preference shocks leading them to
prefer Emmanuel Macron may also be more prone to vote for local officials whose ideology drives
them to set high local tax rates for the TH.
For the aforementioned reasons, η j , the city-level common component of unobserved determi-
nants of the vote, can be correlated with THj , even after adjusting it for a set of observed covariates at
the municipal level X j , generating a spurious conditional correlation between the Macron vote share
and the TH burden. However, owing to the specific structure of the housing tax detailed in section
2.2, the tax base is constructed from 1970 VLC assessments that do not capture house price dynamics
or household sorting from 1970 to 2017. These 1970 VLC are also unlikely to be correlated with 2012-
2017 electoral shocks at the local level, once controlling for predictable shifts from supporting specific
2012 candidates to Emmanuel Macron. I use the average VLC in the municipality (conditional on cur-
rent house values and current TH tax rates) as an instrument for the actual tax burden. This strategy
evidently bypasses one potential confounder, the correlation between local ideology and tax rates.
Using historical assessed values, VLCj , as an instrument only requires that VLCj is a relevant predic-
tor of THj that is uncorrelated with η j , conditional on controls. The two-stage least squares approach
first predicts the TH burden at the city-level based on the historical assessed values, and a set of con-
ˆ jIV , and the same
trols; it then regresses the Macron vote share on the predicted value of the tax TH
set of controls. The first stage is:
ˆ jIV = α IV + δVLC j + λX j + νj
TH (6)
21 It should be noted, however, that other components of the Macron platform, like restricting the French wealth tax
(ISF) to the taxation of real estate, might have been expected to reduce the Macron vote share in high real estate price
municipalities.
17while the reduced form specification is the following:
ˆ jIV + γX j + eta
MacronShare j,2017 = α̃ + β̃ TH ˜ j (7)
As explained in section 2.2, the formulaic rental values established in the 1970s are correlated with
current values, since house prices exhibit persistence over time, potentially due to the permanent
nature of exogenous or endogenous production and consumption amenities. Thus, in the main IV
specification, I control for current tax rates, current housing values, and their interaction, as well as
a vector of controls including average receipts from other local taxes also based on the VLC70. I use
as my outcome variable the ”Macron excess vote share” (either PEj or PS j ), adjusted for nationwide
shifts interacted with the composition of the local electorate.
4 Empirical results
4.1 Spatial variation in expected benefits and the Macron vote share
4.1.1 Baseline specification
To evidence the relevance and quantitative magnitude of the results in raw electoral data, I start
from the simplest possible specification. I regress the vote share of candidate Emmanuel Macron
Share j,2017 , in the first round of the French presidential election, on the average initial housing tax
(TH) burden, THj , in municipality j. As described in section 2.3, I use data from all municipalities
with available vote results in mainland France and Corsica.22 The baseline results use ordinary least
squares to regress the Macron vote share in the first round of the 2017 election, on housing tax receipts
in 2016 (corresponding to the last available year of housing tax assessment known to households be-
fore the April 23rd election), as well as a number of controls at the municipality level. The main
equation of interest is a cross-sectional regression across all 35,197 available municipalities in the
sample, equation 5, where the preferred computation for the average burden in municipality j, THj
(total tax receipts divided by the number of household with a tax return) is the dependent variable,
and X j is a (potentially empty) vector of controls at the municipality level. Throughout the paper,
following Casaburi and Troiano (2016), I cluster standard errors at the departement level, given the
potential for spatial correlation in the error term. In subsection 4.3, I discuss the potential for spatial
22 Frenchcitizens living abroad are exempt from the TH; France’s overseas departments follow different rules in the
setting of the housing tax and were already mostly exempt from it as of 2017; together, these groups represent 6.6 percent
of the electorate.
18correlation and check the robustness of the resuls to using a spatial first differences design.
The results are presented graphically in figure 5a, while the estimated coefficients are reported
in table 2. They show a strong, positive, economically large, and statistically significant correlation
between the average housing tax burden in a municipality and the share of votes obtained by Em-
manuel Macron in the first round of the 2017 presidential election. The magnitude is substantial: a
one standard deviation increase in the initial TH burden (c. EUR 250 or USD 280) is associated with
a 1.7 percentage point higher Macron vote share. Going from the twenty-fifth percentile of initial
housing tax burden to the seventy-fifth23 is associated with a 2.44 percentage points higher Macron
vote share in the first round of the presidential election.
As mentioned in section 3, the vote share for Emmanuel Macron is likely to be correlated with
other features of the municipality’s electorate, which, given the spatial sorting of households across
space, could also be related to the initial housing tax burden. While the average TH was correlated
with a number of characteristics of the municipality, there remained substantial heterogeneity in the
housing tax burden even within narrowly defined strata.
To adjust for the characteristics of the municipality, I include a series of municipality-level controls
which might be correlated with the vote share for candidate Macron. Columns 2 and 3 include such
additional controls. Column 2 includes total population from the census and mean income per capita.
Column 3 includes, for a subset of larger municipalities and county seats, additional detailed controls
from the FiLoSoFi database, on the structure of the local income distribution, notably the threshold
of all income deciles, as well as the share of average local disposable income coming from capital
income, pension income, and welfare benefits. Because these additional controls are only available
for larger municipalities, they reduce the sample and shift its composition towards larger, richer
towns, which, as shown and explained in section 4.2, tend to exhibit a lower response to the promised
tax cut. Nonetheless, all specifications tell a consistent story, and quantitative estimates of the tax
burden effect remain large. Given the substantial variation in commune size, Columns 4 to 6 repeat
the specifications in Columns 1 to 3, but re-weight observations by the number of registered voters
in each municipality.
23 Throughout the article, quantiles are re-weighted by the number of registered voters in each municipality.
194.1.2 Adjusting for local ideology
To disentangle the specific role of the tax cut proposal, I then adjust my electoral outcome measure
(the Macron vote share in the first round) for two alternative proxies of the predicted Macron vote
share, using the polling shift approach and the prediction error approach explained in section 3. This
”ideology-adjusted” specification uses either PEj or PS j as the outcome variable, and regresses it,
using ordinary least squares, on the preferred measure of the average housing tax burden.
PS/PE j,2017 = α + βTHj1 + γX j + η j (8)
Table 3 summarizes the results of this specification. Column 1 displays the results for the PEj out-
come, which amounts to controlling for the vote share of everyone of the 12 candidates in the 2012
election. Columns 2 and 3 include additional controls, similar to the preceding subsection: column
2 includes widely available controls at the municipality level, while Column 3 includes additional
detailed controls on the structure of the local income distribution, available only for larger munici-
palities. Columns 4 to 6 repeat the same specifications, but for PS j , the ”polling shift” approach, as
the dependent variable. The results demonstrate that, even correcting for ideological composition,
the Macron ”excess vote share” in the first round of the 2017 election, whether one uses PEj or PS j
as the outcome, is still strongly and positively correlated with the average initial housing tax bur-
den in a municipality, even conditional on its predictable component based on past electoral results.
Coefficients in column 1 to 5 are all statistically significant at the 1 percent level, 24 and their magni-
tude is economically large, amounting to an 0.7 percent higher ”Macron excess vote share” for a one
standard deviation increase in the initial TH burden when using either PS j or PEj , for our preferred
estimates using the largest available sample with controls, in columns 2 and 5.
4.1.3 Instrumental variables specification
Next, I turn to the two-stages least squares specification based upon the exogeneity assumption un-
derlying the instrumental variables strategy outlined in section 3. Conditional on other local tax re-
ceipts for taxes based on the VLC, and on current home values interacted with current TH tax rates,
the average rental values (VLC) in a municipality only matter for the definition of the TH tax base.
Thus, in the context of the election, any observed correlation between the VLCs and the Macron
excess vote share can only be driven by the electoral impact of the promised repeal, validating the
24 The p-value for the coefficient in column 6 is 0.020, significant at the 5 percent level
20self-interested voter hypothesis.
Reduced form results from this instrumental variable strategy are displayed in figure 6, which
shows the relationship, conditional on controls including current home values and TH tax rates, be-
tween the excess Macron vote share (using the polling shift adjustment) and the average VLC in
the municipality. Detailed results from this instrumental variable strategy are reported in table 4.
Columns 1 to 3 use the raw Macron vote share Macron j , as the outcome variable. Column 1 includes
as controls other local tax receipts for taxes based on the VLC (the property tax, or taxe fonciere sur les
proprietes baties, and the land-value tax, or taxe fonciere sur les proprietes non baties), and current median
home values in the municipality, current TH tax rates, and the interaction of the latter two. Column
2 includes additional controls available for – almost – the full sample, while Column 3 includes the
set of additional controls available for larger municipalities and county seats already described in the
previous section. Columns 4 to 6 repeat the same specifications, but using PS j , the excess vote share
adjusted for baseline pre-announcement nationwide polling shifts, as the outcome variable. Across
all specifications, I find strongly positive and statistically significant effects of the housing tax burden
on the Macron vote share. According to the preferred estimates for the Macron excess vote share (us-
ing the polling shift variable in the full sample with controls, in column 5), a one standard deviation
increase in the initial TH burden (instrumented by the 1970-determined assessed rental values, and
conditional on current home values and tax rates) leads to a c. one percentage point higher excess
Macron vote share. The magnitudes of the point estimates are larger using this instrumental vari-
able strategy than the corresponding values obtained when using ordinary least squares, suggesting
that omitted variable bias might slightly attenuate the electoral effect in the baseline ordinary least
squares regressions.
4.2 Evidence on heterogeneous effects
The role of home-ownership The main effect of repealing of the housing tax, a reform fully fi-
nanced initially by higher inter-governmental transfers from the State to local towns, was the implicit
lump-sum expected redistribution from low- to high-TH burden municipalities. However, if local
taxes are partly or fully capitalized into housing prices, an additional induced effect of the housing
tax cut would be a windfall capital gain for homeowners. Such capitalization effects would imply
a stronger electoral response of the Macron vote share to the initial housing tax burden in locations
with a higher share of homeowners.
21You can also read