Policy in action A tool for measuring alcohol policy implementation - WHO ...
←
→
Page content transcription
If your browser does not render page correctly, please read the page content below
Policy in action
Policy in action

                   A tool for measuring alcohol
                      policy implementation

Policy in action
A tool for measuring alcohol policy implementation
Policy in action
ABSTRACT
Europe has the highest alcohol consumption and alcohol-attributable disease burden in the world. In 2011, all 53
Member States of the WHO European Region endorsed the European action plan to reduce the harmful use of alcohol
2012–2020 (EAPA), which provides a portfolio of evidence-based policy options for mitigating alcohol-associated
problems. To assess the extent to which Member States have adopted the recommended policy standards, the WHO
Regional Office for Europe has developed 10 composite indicators, one for each action area of the EAPA. This document
describes the construction of the EAPA composite indicators and presents an evaluation of the performance of Member
States in the European Region in implementing the 10 action areas. The composite indicators measure not only the
presence of alcohol policies but also their strictness and comprehensiveness.
Keywords
Alcohol Drinking - adverse effects
Alcohol Drinking - prevention and control
Alcohol-Related Disorders - prevention and control
Alcoholism - prevention and control
Regional Health Planning
Europe
Address requests about publications of the WHO Regional Office for Europe to:
Publications
WHO Regional Office for Europe
UN City, Marmorvej 51
DK-2100 Copenhagen Ø, Denmark
Alternatively, complete an online request form for documentation, health information, or for permission to
quote or translate, on the Regional Office web site (http://www.euro.who.int/pubrequest).
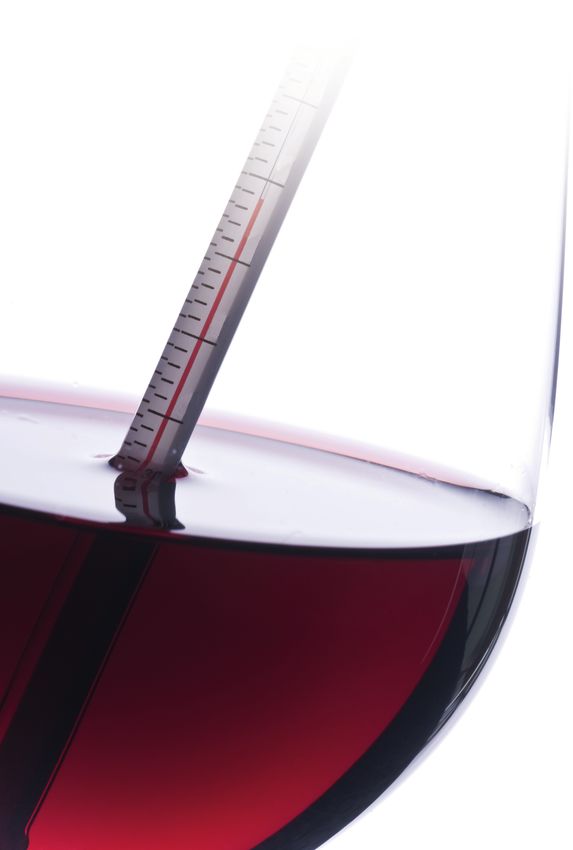
Photo: Chiyacat/Shutterstock.com
© World Health Organization 2017
All rights reserved. The Regional Office for Europe of the World Health Organization welcomes requests for permission
to reproduce or translate its publications, in part or in full.
The designations employed and the presentation of the material in this publication do not imply the expression of any
opinion whatsoever on the part of the World Health Organization concerning the legal status of any country, territory, city
or area or of its authorities, or concerning the delimitation of its frontiers or boundaries. Dotted lines on maps represent
approximate border lines for which there may not yet be full agreement.
The mention of specific companies or of certain manufacturers’ products does not imply that they are endorsed or
recommended by the World Health Organization in preference to others of a similar nature that are not mentioned. Errors
and omissions excepted, the names of proprietary products are distinguished by initial capital letters.
All reasonable precautions have been taken by the World Health Organization to verify the information contained in this
publication. However, the published material is being distributed without warranty of any kind, either express or implied.
The responsibility for the interpretation and use of the material lies with the reader. In no event shall the World Health
Organization be liable for damages arising from its use. The views expressed by authors, editors, or expert groups do not
necessarily represent the decisions or the stated policy of the World Health Organization.Contents
Acknowledgements. . . . . . . . . . . . . . . . . . . . . . . . . . . . . . . . . . . . . . . . . . . . . . . . . . . . . . . . . . . . . . . . . . . . v
Abbreviations . . . . . . . . . . . . . . . . . . . . . . . . . . . . . . . . . . . . . . . . . . . . . . . . . . . . . . . . . . . . . . . . . . . . . . . . vi
Foreword. . . . . . . . . . . . . . . . . . . . . . . . . . . . . . . . . . . . . . . . . . . . . . . . . . . . . . . . . . . . . . . . . . . . . . . . . . . . vii
Introduction. . . . . . . . . . . . . . . . . . . . . . . . . . . . . . . . . . . . . . . . . . . . . . . . . . . . . . . . . . . . . . . . . . . . . . . . . . 1
Alcohol consumption and harm . . . . . . . . . . . . . . . . . . . . . . . . . . . . . . . . . . . . . . . . . . . . . . . . . . . . . . 1
Global context of alcohol policy. . . . . . . . . . . . . . . . . . . . . . . . . . . . . . . . . . . . . . . . . . . . . . . . . . . . . . 2
Aims of the composite indicators. . . . . . . . . . . . . . . . . . . . . . . . . . . . . . . . . . . . . . . . . . . . . . . . . . . . . 3
Methods . . . . . . . . . . . . . . . . . . . . . . . . . . . . . . . . . . . . . . . . . . . . . . . . . . . . . . . . . . . . . . . . . . . . . . . . . . . . 4
Background. . . . . . . . . . . . . . . . . . . . . . . . . . . . . . . . . . . . . . . . . . . . . . . . . . . . . . . . . . . . . . . . . . . . . . 4
Data sources. . . . . . . . . . . . . . . . . . . . . . . . . . . . . . . . . . . . . . . . . . . . . . . . . . . . . . . . . . . . . . . . . . . . . 5
Construction of scoring scheme. . . . . . . . . . . . . . . . . . . . . . . . . . . . . . . . . . . . . . . . . . . . . . . . . . . . . . 5
Generation of scores. . . . . . . . . . . . . . . . . . . . . . . . . . . . . . . . . . . . . . . . . . . . . . . . . . . . . . . . . . . . . . . 8
Scoring scheme rationale. . . . . . . . . . . . . . . . . . . . . . . . . . . . . . . . . . . . . . . . . . . . . . . . . . . . . . . . . . . 9
Results . . . . . . . . . . . . . . . . . . . . . . . . . . . . . . . . . . . . . . . . . . . . . . . . . . . . . . . . . . . . . . . . . . . . . . . . . . . 12
Scoring scheme. . . . . . . . . . . . . . . . . . . . . . . . . . . . . . . . . . . . . . . . . . . . . . . . . . . . . . . . . . . . . . . . . . 12
Regional scores. . . . . . . . . . . . . . . . . . . . . . . . . . . . . . . . . . . . . . . . . . . . . . . . . . . . . . . . . . . . . . . . . . 13
Discussion. . . . . . . . . . . . . . . . . . . . . . . . . . . . . . . . . . . . . . . . . . . . . . . . . . . . . . . . . . . . . . . . . . . . . . . . . . 18
Summary of findings. . . . . . . . . . . . . . . . . . . . . . . . . . . . . . . . . . . . . . . . . . . . . . . . . . . . . . . . . . . . . . 18
Improvements from previous composite indicators. . . . . . . . . . . . . . . . . . . . . . . . . . . . . . . . . . . . . . 18
Policy interactions. . . . . . . . . . . . . . . . . . . . . . . . . . . . . . . . . . . . . . . . . . . . . . . . . . . . . . . . . . . . . . . . 19
Robustness of the EAPA composite indicators. . . . . . . . . . . . . . . . . . . . . . . . . . . . . . . . . . . . . . . . . . 19
Strengths and limitations of the EAPA composite indicators . . . . . . . . . . . . . . . . . . . . . . . . . . . . . . 20
Future work. . . . . . . . . . . . . . . . . . . . . . . . . . . . . . . . . . . . . . . . . . . . . . . . . . . . . . . . . . . . . . . . . . . . . 21
Conclusion. . . . . . . . . . . . . . . . . . . . . . . . . . . . . . . . . . . . . . . . . . . . . . . . . . . . . . . . . . . . . . . . . . . . . . . . . . 22
References . . . . . . . . . . . . . . . . . . . . . . . . . . . . . . . . . . . . . . . . . . . . . . . . . . . . . . . . . . . . . . . . . . . . . . . . . 23
Annex 1. List of survey questions used for the EAPA composite indicators arranged by SIs. . . . . . . . . . 28
Annex 2. Detailed scoring rubrics for the EAPA composite indicators . . . . . . . . . . . . . . . . . . . . . . . . . . . 41Acknowledgements
This first draft of this report was prepared by Genim Tan, Consultant, WHO Regional Office for Europe. Technical editing
was provided by: Julie Brummer, Consultant; Lisa Schölin, Consultant; Lars Møller, Programme Manager; and Gauden
Galea, Director, Division of Noncommunicable Diseases and Promoting Health through the Life-Course, WHO Regional
Office for Europe.
The project was carried out in association with Thomas Karlsson, Esa Österberg and Mikaela Lindeman of the WHO
Collaborating Centre on Alcohol Policy Implementation and Evaluation, Finland.
The project had an expert advisory group with the following members: Thomas Babor, University of Connecticut School
of Medicine, Department of Community Medicine & Health Care, United States of America; Bernt Bull, Ministry of
Health and Care Services, Department of Public Health, Norway; Vesna-Kerstin Petri, Division for Health Promotion and
Prevention of Noncommunicable Diseases, Ministry of Health, Slovenia; Emanuele Scafato, WHO Collaborating Centre
for Research and Health Promotion on Alcohol and Alcohol-Related Health Problems, National Observatory on Alcohol,
National Health Institute, Italy; Esa Österberg, National Institute for Health and Welfare, Finland; Tatiana Klimenko
and Konstantin Vyshinskiy, Federal Medical Research Centre for Psychiatry and Narcology, Ministry of Health, Russian
Federation; Vladimir Poznyak, WHO headquarters; Gauden Galea, Lars Møller and Julie Brummer, WHO Regional Office
for Europe; and Jürgen Rehm, Pan American Health Organization/WHO Collaborating Centre for Mental Health and
Addiction, Canada; Institute for Mental Health Policy Research and Campbell Family Mental Health Research Institute,
Centre for Addiction and Mental Health, Canada; Institute of Medical Science, Department of Psychiatry and Dalla Lana
School of Public Health, University of Toronto, Canada; Institute for Clinical Psychology and Psychotherapy, Technical
University, Dresden, Germany.
Imke Seifert, Intern, and Renée Bouhuijs, Consultant, WHO Regional Office for Europe, assisted with data collection
and verification.
The document benefited from input from the following peer reviewers: Charlie Foster, Associate Professor of Physical
Activity and Population Health and Deputy Director, British Heart Foundation Centre on Population Approaches for NCD
Prevention, Nuffield Department of Population Health, University of Oxford, United Kingdom; and Emma Plugge, Senior
Clinical Research Fellow, Centre for Tropical Medicine and Global Health, Nuffield Department of Clinical Medicine,
University of Oxford, United Kingdom.
The project was carried out by the WHO Regional Office for Europe in the context of the Project on the Prevention and
Control of NCDs, financed by the Ministry of Health of the Russian Federation.
vabbreviations AMPHORA Alcohol Measures for Public Health Research Alliance APC adult per capita consumption APS Alcohol Policy Scale ATLAS-SU ATLAS on Substance Use BAC blood alcohol concentration EAPA European action plan to reduce the harmful use of alcohol 2012−2020 EISAH European Information System on Alcohol and Health EU European Union GDP gross domestic product ICD-10 International Classification of Diseases, 10th revision OECD Organisation for Economic Co-operation and Development PDS pattern of drinking score PPP purchasing power parity RSUD System on Resources for the Prevention and Treatment of Substance Use Disorders SI summary indicator TEASE Toolkit for Evaluating Alcohol policy Stringency and Enforcement vi
Foreword
In September 2011, the European action plan to reduce the harmful use of alcohol 2012–2020 (EAPA) was endorsed by
all 53 Member States in the WHO European Region. The action plan lays out a range of evidence-based policy options
aimed at restricting the supply of, and reducing the demand for, alcohol. It is the latest in a series of policy instruments
developed to guide Member States in the European Region, a process which began approximately 20 years ago with
the endorsement of the first alcohol action plan.

By resolution EUR/RC61/R4 endorsing the EAPA, the WHO Regional Committee for Europe recommended that Member
States in the European Region use the action plan to formulate or, if appropriate, reformulate national alcohol policies
and action plans, and requested that the Regional Director monitor the progress, impact and implementation of the
European action plan. At the request of Member States, the Regional Office produced a list of indicators which could be
used as a tool to support them in the implementation, evaluation and monitoring of individual national alcohol policies.

This report describes the construction of 10 novel composite indicators, which provide a further resource for evaluating
the extent to which the policy measures of the action plan have been implemented by Member States. The composite
indicators are composed of 34 summary indicators and reflect the 10 action areas of the EAPA. They measure whether a
Member State has implemented a policy measure and take into account the level of empirical support for the measure’s
effectiveness as well as the level of strictness and comprehensiveness of each action. As such, the composite indicators
allow monitoring to go beyond solely tracking whether a Member State has a national alcohol policy to a more fine-
grained approach of evaluating the individual components.

The need to promote evidence-based alcohol policies in the Region is made even more apparent by data presented in
the Global status report on alcohol and health 2014, which show that the Region continues to lead all WHO regions in
alcohol per capita consumption, prevalence of heavy episodic drinking among adults and adolescents and proportion
of alcohol-attributable deaths. Given the harm that alcohol can do to individuals and societies, it is time to seek out
more refined methods of evaluating national policies to ensure that they reflect the current evidence base. The EAPA
composite indicators provide such as a tool, as they convey at a glance the extent to which Member States have
adopted the recommended best practices outlined in the action plan and can also be used to monitor trends over time
and compare policy options.

It is our hope that the scoring can be updated regularly by the WHO secretariat, using data from the European Information
System on Alcohol and Health.

Gauden Galea
Director, Division of Noncommunicable Diseases and Promoting Health through the Life-Course
WHO Regional Office for Europe

                                                                                                                          vii
Introduction
Alcohol consumption and harm
The practice of consuming alcohol transcends temporal and geographical boundaries but its symbolism differs from
culture to culture. Alcohol may be associated with celebration and revelry, ritual and religion, individuality or conformity,
or simply a quotidian component of the mealtime routine (1). However, beneath these oft-romanticized layers of
meaning lies a sobering fact: alcohol is detrimental to health. It is a teratogen, neurotoxin, intoxicant, carcinogen and
immunosuppressant (2). Alcohol use was the fifth leading risk factor for the global disease burden in 2010 (3) and it is
responsible for an estimated 3.3 million deaths every year and 5.1% of disability-adjusted life-years worldwide (4). It
was the most important risk factor among people aged 15–49 years (3).
The negative health consequences of alcohol consumption are manifold. More than 30 categories in the International
classification of diseases and related health problems, 10th revision (ICD-10) consist of conditions wholly attributable
to alcohol (5,6), including alcohol use disorders, alcoholic psychoses and alcoholic gastritis (1). In addition, alcohol
is a component cause for more than 200 ICD-10 three-digit codes covering categories of disease such as cancer,
cardiovascular disease and metabolic dysfunction (7). Although there is some evidence for the protective effects of light
sporadic drinking on coronary heart disease, ischaemic stroke and diabetes (8,9), the adverse effects of alcohol still
preponderate (10). Besides chronic diseases that manifest themselves after years of cumulative drinking, significant
morbidity and mortality also result from acute injury.
The brunt of the harm related to alcohol is not borne by drinkers alone. Many undesirable consequences spill over into the
realm of the family and wider community. Societal harms associated with drinking include the deterioration of personal and
working relationships, criminal behaviour (such as vandalism and violence), productivity losses and substantial health care
costs (10,11). Together, the alcohol-attributable disease burden and costs to society translate into approximately 1.3% of
the gross domestic product (GDP) in European Union (EU) countries (12). Importantly, alcohol also contributes to inequities
within and between countries. There is strong evidence that alcohol use and harm vary along the socioeconomic gradient
(13,14), with lower socioeconomic groups experiencing greater harm despite lower levels of consumption, known as the
alcohol harm paradox. This is particularly true among the younger age groups and among men (15).
Alcoholic beverages are available in almost all parts of the world, but the importance of alcohol as a risk factor depends
largely on the way it is consumed. The two indicators particularly relevant to health are adult per capita consumption
(APC) and pattern of drinking score (PDS) (Table 1). For populations with equivalent APC, a higher PDS is associated with
less favourable health outcomes (16). The worldwide APC was 6.4 litres in 2014. However, the global average conceals
significant variations in consumption between geographical regions. The APC in the WHO European Region was 10.7
litres; at the other end of the spectrum, an APC of 0.6 litres was reported for the Eastern Mediterranean Region (17)
where, based on 2010 data, 89.8% of the adult population are lifetime abstainers (4). In the WHO European Region, the
lowest PDS are found in only a handful of countries in southern and western Europe, while the riskiest drinking patterns
are prevalent in the Russian Federation and Ukraine (4). Heavy drinking occasions are particularly harmful to health and
are important contributors to injury and cardiovascular mortality. Since 1990, the alcohol-attributable mortality burden
in the European Region has increased, largely owing to trends in the eastern part of the Region, which saw a 22%
increase (17).
Table 1. Pathways of alcohol-related harm
Indicator Definition
APC Average volume in litres of pure alcohol consumed by people aged 15 years and older.
PDS A measure of how hazardous the drinking behaviour is in a population on a scale from 1 (least risky) to
5 (most risky). It is calculated on the basis of: (i) the usual quantity of alcohol consumed per drinking occasion; (ii) the
prevalence and frequency of festive drinking; (iii) the proportion of drinking events when drinkers become intoxicated;
(iv) the proportion of drinkers who drink daily or nearly every day; (v) the prevalence of drinking with meals; and (vi)
the prevalence of drinking in public places (4).
1Policy in action
Global context of alcohol policy
Momentum in international alcohol policy has gathered pace slowly but surely. For many years, the European Region has
had the highest level of alcohol consumption, which has led the Regional Office to take a leading role in joint political
action to tackle alcohol use and harm. Since the launch of the pioneering European alcohol action plan in 1992, alcohol has
continued to feature regularly in the activities of the Regional Office as well as on the agendas of other regional offices
and at the World Health Assembly (Table 2). These culminated, in May 2010, in the adoption of resolution WHA63.13 that
endorses the global strategy to reduce the harmful use of alcohol (18). Through a broad consultation process involving
multiple stakeholders, all 193 WHO Member States arrived at this historical consensus on ways to ameliorate alcohol-
related harm (19). The aims of the global strategy are to increase the commitment by governments, strengthen the
knowledge base, enhance the capacity of Member States, foster partnerships and coordination, and improve monitoring
and surveillance systems in order to curb the harmful use of alcohol (18). The strategy also includes a recommended
portfolio of evidence-based interventions grouped into 10 action areas (Table 3). The Regional Office subsequently drew up
the European action plan to reduce the harmful use of alcohol 2012–2020 (EAPA), which was adopted by all 53 Member
States in the European Region in September 2011 (2). The EAPA is aligned seamlessly with the WHO global strategy
and contains a mixture of policy options aimed at restricting the supply of and reducing the demand for alcohol. These
include restrictions on advertising, excise taxes, a minimum purchase age, brief interventions in health care and workplace
treatment programmes.
Table 2. History of WHO’s activity in international alcohol policy, 1992–2011
Year WHO body Action
1992 WHO Regional Committee European alcohol action plan 1992–1999 (WHO Regional Committee for Europe
for Europe resolution EUR/RC42/R8)
1995 WHO Regional Office for Europe European charter on alcohol (adopted at the European Conference on Health, Society
and Alcohol, 1995)
1999 WHO Regional Committee European alcohol action plan 2000–2005 (WHO Regional Committee for Europe
for Europe resolution EUR/RC49/R8)
2001 WHO Regional Committee Declaration on young people and alcohol (WHO Regional Committee for Europe
for Europe resolution EUR/RC51/R4)
2005 WHO headquarters Public health problems caused by harmful use of alcohol (World Health Assembly
resolution WHA58.26)
2005 WHO Regional Committee Framework for alcohol policy in the WHO European Region (WHO Regional
for Europe Committee for Europe resolution EUR/RC55/R1)
2006 WHO Regional Committee Alcohol consumption control – Policy options in the South-East Asia region (WHO
for South-East Asia Regional Committee for South-East Asia resolution SEA/RC59/15)
2006 WHO Regional Committee Regional strategy to reduce alcohol-related harm (WHO Regional Committee for the
for the Western Pacific Western Pacific resolution WPR/RC57.R5)
2006 WHO Regional Committee Public health problems of alcohol consumption in the Eastern Mediterranean Region
for the Eastern Mediterranean (WHO Regional Committee for the Eastern Mediterranean resolution EM/RC53/R.5)
2007 WHO headquarters WHO Expert Committee on Problems Related to Alcohol Consumption (WHO
Technical Report Series, No. 944, 2007)
2008 WHO headquarters Strategies to reduce the harmful use of alcohol (World Health Assembly resolution
WHA61.13)
2010 WHO headquarters Global strategy to reduce the harmful use of alcohol (World Health Assembly
resolution WHA63.13)
2010 WHO Regional Committee Reduction of the harmful use of alcohol: a strategy for the WHO African Region
for Africa (WHO Regional Committee for Africa resolution AFR/RC60/R2)
2011 WHO Regional Office Plan of action to reduce the harmful use of alcohol (WHO Regional Committee for
for the Americas the Americas resolution CD51.R14)
2011 WHO Regional Committee European action plan to reduce the harmful use of alcohol 2012–2020 (WHO
for Europe Regional Committee for Europe resolution EUR/RC61/R4)
Sources: WHO (2,4,18); Babor (11); Rekve (20).
2Introduction
Table 3. The global strategy to reduce the harmful use of alcohol: areas for policy options and interventions
Target areas Options for policies and interventions
Leadership, awareness and commitment Expressing political commitment through adequately funded, comprehensive
and intersectoral national policies that are evidence-based and tailored to local
circumstances
Health services’ response Providing preventive services and treatment to individuals and families at risk of, or
affected by, alcohol-use disorders and associated conditions
Community and workplace action Harnessing the local knowledge and expertise of communities to change collective
behaviour
Drink–driving policies and Introducing measures to deter people from driving under the influence of alcohol;
countermeasures creating a safer driving environment to minimize the likelihood and severity of
alcohol-influenced road traffic accidents
Availability of alcohol Preventing easy access to alcohol for vulnerable and high-risk groups; reducing the
social availability of alcohol so as to change social and cultural norms that promote
the harmful use of alcohol
Marketing of alcoholic beverages Protecting young people by regulating both the content of alcohol marketing and the
amount of exposure to that marketing
Pricing policies Increasing the prices of alcoholic beverages to reduce underage drinking, to halt
progression towards drinking large volumes of alcohol and/or episodes of heavy
drinking, and to influence consumers’ preferences
Reduction of the negative consequences Reducing the harm from alcohol intoxication by managing the drinking environment
of drinking and alcohol intoxication and informing consumers
Reduction of the public health impact Reducing the negative consequences of informal or illicit alcohol through good
of illicit alcohol and informally produced market knowledge, an appropriate legislative framework and active enforcement of
alcohol measures
Monitoring and surveillance Developing surveillance systems to monitor the magnitude of and trends in alcohol-
related harms, to strengthen advocacy, to formulate policies and to assess the
impact of interventions
Source: WHO (18).
Aims of the composite indicators
In spite of the policy resources made available by the Regional Office, countries in Europe continue to be affected by
alarming levels of alcohol-attributable harm. In the European Region, alcohol has a causal impact in approximately
15% of all causes of death (17). This suggests that there is a gap between what is known and what is practised. If
that is the case, how can the extent to which governments have adopted the recommended best practices reflected
in the European action plan be determined? One way of measuring multidimensional phenomena (such as countries’
performance as regards alcohol policy) is by compiling individual indicators into a composite indicator on the basis of
an underlying model (21). Such aggregated indices are found in numerous research and policy fields and are typically
used to make comparisons between organizations, institutions or countries (22). Well-known examples include the
Human Development Index (23), the Global Competitiveness Index (24), the Corruption Perceptions Index (25), the overall
health system attainment (26,27) and the Better Life Index (28). The appeal of composite indicators lies in their ability
to convey, at a glance, a large amount of information that is relevant to decision-making and priority-setting. This
report describes the construction of 10 novel composite indicators that quantify the completeness of national alcohol
strategies and plans (that is, the number of policies that are present and the degree to which each policy meets certain
prescribed standards). The extent to which actions in the policy areas of the EAPA have been implemented by Member
States in the Region is also described in this report, as well as the strengths and limitations of the composite indicators.
3Policy in action Methods Background There is no gold standard methodology for constructing composite indicators. It depends on the “craftsmanship of the modeller” and is assessed on a fitness for purpose basis. The quality of a composite indicator boils down to the quality of the conceptual framework and data sources used (21). One important consideration is the weight that each component of the indicator should be assigned. In other words, should all components matter equally, or should some components be given more weight? A further option is to leave the question open, to be answered by the individual user. The Organisation for Economic Co-operation and Development (OECD) used this last approach in creating the Better Life Index. This Index makes use of an interactive platform that allows each user to vary the weights of the 11 dimensions, including education, health and work-life balance, and to observe the effects on country rankings of well-being (28). The fluid approach employed by the Better Life Index makes it clear that there is no single way to assign weights. Traditionally, however, developers of composite indices have used a more static method for assigning weights. The Human Development Index, which is published by the United Nations Development Programme, uses an equal weighting approach. The Human Development Index includes the following three dimensions: long and healthy life (also referred to as health, as measured by the indicator life expectancy at birth), knowledge (also referred to as education, as measured by the arithmetic mean of the indicators mean years of schooling and expected years of schooling) and a decent standard of living (also referred to as income, as measured by the indicator gross national income per capita (in purchasing power parity (PPP) international dollars)). The Human Development Index for a Member State is calculated based on the geometric mean of the three dimension indices, where each dimension has equal weight (23). Another well-known example is the overall health system attainment composite measure, published by WHO in 2000, which consists of five components: health, health inequality, responsiveness, responsiveness inequality and fairness of financial contribution. In order to determine the weights assigned for each component, an internet survey was conducted among WHO staff members (from headquarters, regional and country offices) and visitors to the WHO website. These participants were assumed to have specialized knowledge of the topic based either on their employment at WHO or their interest in the WHO website (26,27). In the area of alcohol policy, a recent project to assess the effect of the United States of America’s alcohol control policy environment on drinking behaviour evaluated both the equal and differential weighting approaches (29,30). The Alcohol Policy Scale (APS) is a composite measure that was created to assess the relationship between alcohol policy measures, which vary by state, and harmful drinking behaviours. To develop the APS, a panel of 10 experts was tasked with putting forward suggestions for effective policies to be included in the composite measure and with assigning ratings of efficacy (that is, effectiveness of the policy in reducing the harmful use of alcohol) and implementation (the strictness of the policy). The methodology involved an initial individual web-based survey of the experts, a face-to- face panel discussion, and a follow-up individual expert survey to finalize the efficacy and implementation ratings. The researchers evaluated several methods for constructing the APS, including those that involved equal weighting (that is, summing the existing policies in each state, with one point given per policy) and methods that accounted for efficacy and implementation ratings. APS scores generated by all methods were significantly associated with drinking outcomes; methods that took into account efficacy and implementation ratings resulted in a better fit (29,30). Other relevant efforts to quantitatively compare the overall policy stance of national governments on alcohol have assigned differential weights based on expert opinion and reviews of the evidence base (see the Alcohol Measures for Public Health Research Alliance (AMPHORA) project scale (31), the Alcohol Policy Index (32) and the Toolkit for Evaluating Alcohol policy Stringency and Enforcement-16 (TEASE-16) (33)). The Alcohol Policy Index and TEASE-16 projects also included evaluations of different weighting structures as part of the sensitivity analysis. 4
Methods

Overview of methods used to construct the EAPA composite indicators
For the current project, the EAPA was chosen as a scaffold for a selection of policy variables to be subsumed into
the composite indicators. The EAPA contains a broad spectrum of policy instruments that are consistent with current
evidence-based recommendations. This improves the validity of the content of the composite indicators by ensuring that
all important facets of a national alcohol policy are accounted for (34). Furthermore, the Regional Office has established
procedures for collecting policy information on indicators corresponding to each action area, thereby minimizing
problems associated with missing or inconsistent data. Lastly, because the EAPA has been endorsed by all 53 Member
States in the European Region, composite indicators that mirror the action plan are more likely to gain traction among
public health leaders and policy-makers.

The EAPA composite indicators were developed and evaluated in two phases. The aim of the first phase was to construct
a scoring scheme by aggregating, scaling and weighting selected policy indicators. This phase was carried out via a
face-to-face meeting of the project’s expert advisory group and subsequent e-mail consultations. In the second phase,
relevant policy data for the Member States were collected and coded, and composite indicator scores were computed
for each country for which there were sufficient data. The project methodology was informed by technical handbooks
on the development of composite indicators (21,35) as well as previous work done in the area of alcohol control indices
(31,32). Details of each phase will be explained in the subsequent sections.

Data sources
The main data sources for this project were the European Information System on Alcohol and Health (EISAH) and the
European Regional Information System on Resources for the Prevention and Treatment of Substance Use Disorders
(RSUD). These databases for the WHO European Region contain alcohol-related indicators at the country level.

WHO’s principal tool for amassing information from all Member States on alcohol control policies, alcohol consumption,
alcohol-related health consequences as well as national monitoring and surveillance systems is the global survey
on alcohol and health. In the European Region, the Regional Office and the European Commission jointly administer
a modified version of the global survey instrument. WHO’s main tool for assessing and monitoring health system
resources worldwide related to substance use disorders is the ATLAS on Substance Use (ATLAS-SU) questionnaire.
These WHO surveys take the form of a self-completion questionnaire. Designated national experts are asked to fill out
the questionnaire in consultation with other experts from their respective countries. Survey data are then uploaded to
regional and global alcohol databases maintained by WHO, including EISAH and RSUD.

Data for this project are largely based on the global survey on alcohol and health conducted in 2012 and the substance
use ATLAS-SU questionnaire conducted in 2014. Responses from the WHO global questionnaire on progress in alcohol
policy, administered in 2015, were used to update the indicators also included in this questionnaire, and national
experts nominated as contact persons for WHO were contacted by e-mail in June 2016 to confirm or update existing
data. The most recent available data were used to generate the composite indicators.

Estimates of gross national income at PPP for 2015 were obtained from the World Bank (36).1,2

Construction of scoring scheme
The purpose of the scoring scheme was to put in place a logical and consistent process by which, for each country,
a large volume of policy information could be condensed into a score for each of the 10 action areas of the EAPA.
Important considerations during this phase were that:

• countries with stronger policies should receive more credit than those with weaker policies, but it should be possible
  in theory for all Member States in the European Region to attain the maximum score;
• all 10 EAPA action areas should be represented and, within an action area, policy options that are more actively
  promulgated by WHO should be accorded higher priority; and
• the scoring scheme should be grounded in scientific evidence and reflect current best practices.
1
    As World Bank data were unavailable for Andorra, an estimate of the 2014 gross national income per capita (at 2011 PPP international dollars) was taken from
    the Human Development Report (37).
2
    The most recent World Bank estimate for Malta is from 2013.

                                                                                                                                                               5
Policy in action
At a meeting held at the Regional Office in April 2015, an expert advisory group selected a subset of survey questions
from the WHO questionnaires that would be most illuminating in the context of policy benchmarking and evaluating the
implementation of the EAPA. The chosen questions were then grouped into thematic clusters. Because policy variables
within each cluster were conceptually related, they could be subsumed under a common summary indicator (SI). In this
sense, each SI measures a particular aspect of alcohol control and serves as a building block for the composite indicator
for each EAPA action area. Examples of SIs include restrictions on alcohol availability by time, community-based
interventions to reduce alcohol-related harm and legally binding restrictions on product placement. It was necessary to
reformulate and recode existing variables in the creation of certain SIs. This will be explained in a subsequent section.
The final 34 SIs were categorized in the 10 EAPA action areas. The complete list of survey questions used in this project
is presented in Annex 1.
Since it was desirable for information to be aggregated with minimal loss of precision, scales were introduced to
distinguish different degrees of success within each SI. Depending on the nature of the topic, the scale might reflect
a gradient in stringency (such as legal age limits) or comprehensiveness (such as the scope of the monitoring system).
A nested banding approach was employed for the indicators pertaining to marketing (indicators 6.1 to 6.4) and
affordability (indicator 7.2). With regard to the former, points are awarded for multiple items (such as various advertising
platforms) based on the level of restriction applied to different types of beverage (details of the scoring scheme are
in Annex 2). The sum of points across the items corresponds to a band, which in turn determines the final score for
the indicator. This methodology follows that of Esser & Jernigan (38). An example is shown in Table 4. In the case of
affordability, the band is ascertained according to the price indices of different types of beverage. The price index is a
modification of the affordability measure first introduced by Brand et al. (31) and is defined as follows:
Price index
=
Price (calculated based on standard containers of 50 cl beer, 75 cl wine and 70 cl spirits) (C)
= 10 000 X
Gross national income at PPP per capita (current international $)
Table 4. Example of a score for legally binding restrictions on product placement (indicator 6.2) following
the nested banding approacha
Item Beverage type Restriction Points (level of restriction)
National television Beer Ban 3
Wine Partial statutory 2
Spirits Voluntary 1
Cable television Beer None 0
Wine Ban 3
Spirits Ban 3
Films Beer Ban 3
Wine Ban 3
Spirits Ban 3
Total points 21
Band 4
Final score for indicator 12
a
See Annex 2, Rubric 6
As well as the nuances within each policy topic, the differential effectiveness between policies in an action area was
also factored into the construction of the scoring scheme. Rather than taking all potential interventions to be on an
equal footing, each SI was weighted according to the strength of the underlying evidence.
The product of the raw score and the multiplier level produces a weighted score for each SI. The total score for the
action area is a linear summation of all the SIs.
6Methods
Members of the expert advisory group provided the first round of input on the scales and weights for each SI via e-mail
consultations in June 2015. The Regional Office and the WHO Collaborating Centre on Alcohol Policy Implementation
and Evaluation developed the scoring rubric based on the experts’ feedback and the publication Alcohol: no ordinary
commodity (11). Numerous policy measures are evaluated in the book and given a rating of 0–3 on the three dimensions
of effectiveness, breadth of research support and extent of cross-national testing. These quantitative ratings were
transposed into five multiplier levels for the current project (Table 5). Other publications providing a synthesis of
available evidence were also used to guide the allocation of multiplier levels (10,39). The scoring rubric was submitted
to the expert advisory group for final review in October 2015.
Table 5. Description of a tool used for weighting SIs
Multiplier level Description Ratings by Babor et al.a
5x High level of effectiveness demonstrated • Effectiveness: 3
consistently across different populations OR • Breadth of research support/
fundamental public health infrastructure needed to initiate and cross-national testing: 2 or 3
sustain an effective response
4x High level of effectiveness demonstrated in a limited number of • Effectiveness: 3
studies and populations OR • Breadth of research support/
moderate effectiveness demonstrated consistently across different cross-national testing: 1 or 2
populations OR
• Effectiveness: 2
• Breadth of research support/
cross-national testing: 2 or 3
3x Moderate effectiveness demonstrated in a limited number of • Effectiveness: 2
studies and populations • Breadth of research support/
cross-national testing: 1 or 2
2x Limited effectiveness OR insufficient evidence to conclude degree • Effectiveness: 1
of effectiveness OR
• Effectiveness: unknown
1x Not shown on its own to be effective but may be valuable as part • Effectiveness: 0
of a package of policy measures
a
Babor et al. (11).
In sum, the composite indicators were premised on a conceptual framework (the EAPA) and a systematic evidence-based
approach was used to define the constituent indicators and their attached weights. Alternative statistical techniques
for constructing composite indicators were initially considered. For example, principal component analysis and factor
analysis may be employed to “[group] together individual indicators which are collinear to form a composite indicator
that captures as much as possible of the information common to individual indicators” (21). These methods are used
for reasons of parsimony and to prevent the double counting of overlapping variables. It was decided, however, that
a statistical approach was unsuitable given the intended application of the EAPA composite indicators as a tool for
political advocacy. It must be clear that statistical correlations “do not necessarily correspond to the real-world links and
underlying relationships between the indicators and the phenomena being measured” (35). All meaningful items in the
EAPA, regardless of their statistical contribution to the overall variance, ought to be retained in the composite indicators
as an indication of their practical importance. Moreover, a composite indicator that is solidly embedded in theory and
accompanied by a transparent scoring system is more likely to resonate with policy-makers than an abstract statistical
construct. The steps involved in constructing the scoring scheme are illustrated in Fig. 1.
7Policy in action
Fig. 1. Illustration of steps taken to construct the scoring scheme, using indicator 1.1 as an example
Is there a written national policy on alcohol specific to your country?
Step 1:
identify survey questions Is the written national policy on alcohol multisectoral?
Is there a national action plan for the implementation of the written national policy on
alcohol?
Is a written national policy on alcohol currently being developed or is an adopted one
being revised?
Step 2:
group into policy topics
Status Points
Written national policy Adopted (2) In development (1) No (0)
on alcohol
Written national policy Yes (1) N/A (0) No (0)
Step 3: on alcohol
reformulate variables and is multisectoral
establish scales
Written national policy Yes (1) N/A (0) No (0)
on alcohol policy is
accompanied by a
national action plan for
implementation
Step 4:
assign multiplier level Multiplier level 3x
Generation of scores
Responses of Member States in the European Region to the relevant survey questions were first retrieved from the
datasets compiled by WHO. As described in the section on data sources, national experts nominated as contact persons
for WHO were given the opportunity to update responses in June 2016. The most recent available data were used.
Missing values were replaced with zero points. If a substantial portion (>20%) of the data was missing in an action area,
the composite indicator was not calculated for that Member State.
Policy variables from the datasets were recoded manually to achieve compatibility with the scoring scheme. To illustrate,
the original EISAH dataset for restrictions on alcohol availability by time contains 12 binary variables for the different
permutations of on-premise service or off-premise sale,3 restriction by hours or days of operation and beverage type.
These variables were merged into a single SI (indicator 5.3) and recoded following the ordered categories (0, 1, 2, 3, 4)
delineated in the scoring scheme (Table 6).
3
On-premise service refers to alcoholic beverages sold for consumption within the setting of a bar, cafe or restaurant, while off-premise sale refers to alcoholic
beverages sold by shops (such as supermarkets and petrol kiosks) for consumption elsewhere.
8Methods
Table 6. Three possible combinations of values for alcohol availability by timea
Variables Country A Country B Country C
On-premise/hours/beer Yes Yes No
On-premise/hours/wine Yes Yes No
On-premise/hours/spirits Yes Yes No
On-premise/days/beer No No No
On-premise/days/wine No No Yes
On-premise/days/spirits No No Yes
Off-premise/hours/beer Yes No No
Off-premise/hours/wine Yes No No
Off-premise/hours/spirits Yes No No
Off-premise/days/beer No No No
Off-premise/days/wine No No Yes
Off-premise/days/spirits No No Yes
Raw score 4 3 2
Final weighted score for indicator 5.3 12 9 6
a
See Annex 2 for details of the scoring scheme.
Table 7 indicates the number of composite indicator scores generated for each action area; that is, the number of
Member States for which at least 80% of the data were available.
Table 7. Number of Member States participating in each action area
Number of Member
Action area States participating
Leadership, awareness and commitment 47
Health services’ response 34
Community and workplace action 47
Drink–driving policies and countermeasures 53
Availability of alcohol 53
Marketing of alcoholic beverages 53
Pricing policies 45
Reduction of the negative consequences of drinking and alcohol intoxication 52
Reduction of the public health impact of illicit alcohol and informally produced alcohol 53
Monitoring and surveillance 52
Scoring scheme rationale
Because it is impracticable to expound in this report the intricacies of each action area, a summary of the underlying
research and scoring assumptions for selected indicators is shown in Table 8. In this section, the principles and
assumptions behind two of the best buy interventions recommended by WHO to reduce harmful drinking and thereby
the burden of noncommunicable diseases – pricing and marketing – will be explained since they involve more complex
data manipulation in the computation of scores.
9Policy in action
Table 8. Overview of research evidence and scoring principles for selected indicators
Indicator Policy rationale and scoring assumptions
1.4 Awareness activities Most public education campaigns do not lead to sustained changes in alcohol-related behaviour
(11) apart from those targeting drink–driving (40). Awareness activities are nonetheless
important for imparting information and garnering support for alcohol policies (41).
Assumption: awareness activities on more topics lead to a better informed population.
2.1 Screening and brief Brief interventions in primary care settings produce clinically significant reductions in drinking
interventions for harmful and among non-dependent high risk drinkers (42).
hazardous alcohol use Assumption: insufficient motivation and confidence among practitioners have been cited as
important barriers to scaling up brief interventions. It is assumed that this can be ameliorated
with adequate training and standardization of guidelines (43).
3.2 Workplace-based alcohol There is limited evidence that workplace programmes, such as peer support, can reduce the
problem prevention and harm from alcohol (41).
counselling
3.3 Community-based Multicomponent community programmes can be useful for mobilizing communities, changing
interventions to reduce collective behaviour and increasing the enforcement of alcohol policies (41).
alcohol-related harm
4.1 Maximum legal blood alcohol The risk of a road traffic accident increases exponentially with BAC and is significantly
concentration (BAC) limit elevated above a BAC of 0.5 g/litre (44). Lower legal BAC limits are preferred because
when driving a vehicle impairment occurs even at very low BAC levels (45).
4.2 Enforcement using sobriety Strategies that increase drivers’ perceived risk of arrest are effective in deterring drink–
checkpoints driving (11).
4.3 Enforcement using random
breath-testing
5.1 Lowest age limit for on- A higher minimum legal drinking age is associated with lower alcohol consumption and fewer
premise alcohol service and road traffic accidents (46).
off-premise alcohol sale Assumption: on-premise alcohol service and off-premise alcohol sale are assumed to be
substitutes. Different beverage types are assumed to be substitutes.
5.2 Control of retail sales State-owned monopolies are the most effective structural arrangement for the regulation of
alcohol availability. The next best alternative is a licensing system that dictates which vendors
may sell alcohol and the exact conditions of sale (47).
5.3 Restrictions on alcohol Extending trading hours by a mere one to two hours results in a significantly higher incidence
availability by time of assaults, motor vehicle accidents and fall-related injuries (48,49).
Assumption: on-premise alcohol service and off-premise alcohol sale are assumed to be
substitutes. Different beverage types are assumed to be substitutes.
5.4 Restrictions on alcohol The greater the number of establishments that sell alcohol, the easier it is to obtain alcohol.
availability by place There is consistent evidence of a positive relationship between the density of outlets and
alcohol-associated problems (11).
Assumption: on-premise alcohol service and off-premise alcohol sale are assumed to be
substitutes. Different beverage types are assumed to be substitutes.
5.6 Alcohol-free public Drinking bans in public places potentially reduce drinking and social access to alcohol among
environments young people (11).
7.3 Other price measures Price increases on cheap alcohol have the most dramatic impact on consumption (50).
Discounting results in heavier drinking on the premises (51) and increased purchasing off
the premises (52). New products may be targeted at vulnerable segments of the population,
for example, flavoured alcoholic beverages that have led to increased drinking among
adolescents (53).
8.1 Server training Serving practices can be modified, such as refusing service to intoxicated customers and
promoting food instead of drinks (11).
8.2 Health warning labels Health warning labels do not have an impact on drinking behaviour per se but may affect
intervening variables such as the intention to change consumption and a willingness to
intervene regarding drinking by others (54).
10Methods
Pricing policies and marketing of alcoholic beverages
The basic concept behind pricing policies is to constrain consumers’ ability or willingness to purchase alcohol. It has
been demonstrated consistently that drinkers reduce their consumption in response to price increases on alcoholic
beverages (50,55). This effect is observed for beer, wine and spirits, albeit to differing degrees depending on the
characteristics of alcohol consumption in a country. The type of beverage with the dominant market share tends to be
less affected by price fluctuations (56). Overall, the results of two meta-analyses suggest that an average 5% reduction
in per capita alcohol consumption is achieved for each 10% increase in price (57,58). The converse is also shown to be
true: in Finland, decreases in excise duties coupled with the removal of travellers’ tax-free imports drove consumption
up in 2004 by approximately 10% (59). Importantly, the literature indicates that price changes have an impact on heavy
drinkers and can lead to reductions in alcohol-related harm, including from liver cirrhosis and injuries (50,60).
The EAPA composite indicators seek to capture differences in the affordability of alcohol and not alcohol prices per
se. A new measure of affordability, the price index formula, was created to compare countries on the basis of alcohol
prices in relation to income. This is an offshoot of the approach used by Brand et al. (31), although it is unclear which
GDP measure they used. Given that their project focused on a relatively homogenous group of high-income member
countries of the OECD, it might be argued that different GDP estimates would have given similar results. In contrast,
the present WHO project includes countries with divergent wealth and welfare conditions. Adjusting for disparities in
the cost of living through the use of gross national income at PPP enabled fairer cross-country comparisons. The price
index was calculated separately for beer, wine and spirits, and an overall score for the affordability indicator was
determined using the banding approach described in the section on methods. However, the drawback of this approach
is that it does not account for potential cross-beverage substitution. Substitution occurs when drinkers react to the
increased price of beverages in one category by consuming more of different alcohol products. There is evidence of
partial substitution between different types of alcohol, beverages of different quality and even between products sold in
off-premise and on-premise settings (61,62). Since the availability of low-cost alternatives encourages substitution (61),
a reasonable way forward might be to advocate that prices be high across the board. A modified scoring scheme based
on this principle would have a final score that is wholly or mostly attributable to the beverage type with the cheapest
price index rather than representing the average affordability of all beverage types. This methodological option may
be explored in the future provided that there is stronger evidence behind cross-beverage substitution and improved
capabilities among Member States for the accurate monitoring of alcohol prices.
There is a convincing body of evidence that connects alcohol marketing to undesirable drinking behaviour among young
people. Systematic reviews of longitudinal studies have established that alcohol advertising induces earlier initiation of
drinking and influences adolescents who already drink to increase the volume and intensity of their alcohol consumption
(53,63). Thus, restrictions on marketing activities are most likely to reduce alcohol-associated harm by modulating drinking
patterns among children and teenagers. One study estimated that a complete alcohol advertising ban would bring about
a 16.4% decrease in alcohol-attributable mortality in the United States through reductions in drinking prevalence among
young people (64). At the population level, aggregate and econometric analyses have found that alcohol advertising exerts
only weak positive effects on total alcohol consumption in the short term (58). Nevertheless, marketing plays a crucial
role in shaping social attitudes towards drinking. For instance, a holiday was offered as a competition reward during a
promotional campaign for beer in New Zealand, with the slogan: “the best weekend you’ll never remember!” (65). Such
messages serve tacitly to normalize and even glamorize the practice of drinking to intoxication, thereby counteracting
other health promotion efforts that discourage heavy drinking (11). Even if an immediate reduction in consumption is
not seen following the implementation of marketing restrictions, however, it is plausible that there are other long-term
benefits such as a gradual weakening of the power of the alcohol industry to alter drinking norms (66).
Marketing has emerged as one of the most challenging aspects of alcohol control because of the pervasiveness of
alcohol advertising and promotion, which continue to evolve to include new media and technologies. The present
WHO project includes marketing indicators in the four areas of advertising, product placement, event sponsorship and
sales promotion so as to reflect the rapidly expanding repertoire of marketing-oriented activities. A total of 10 different
platforms are considered under advertising restrictions (indicator 6.1). This is in line with current trends suggesting
that television commercials are increasingly being replaced by novel forms of online advertising. Indeed, the major
alcohol companies have been allocating more of their marketing budget to non-traditional projects such as social media
campaigns (53). Owing to the dearth of systematic research into the impact of various marketing strategies, it is unclear
whether certain media outlets should be regulated more stringently. In the absence of any reason to believe that some
platforms should be prioritized over others, the banding approach was adopted to reflect the general state of affairs in a
country. The scoring system also assumes that binding restrictions are preferable to industry self-regulation. It has been
shown time and again that voluntary codes are easily flouted and self-regulating bodies are ineffective in protecting
young people from irresponsible marketing practices (39,67,68).
11Results
Scoring scheme
The finalized scoring scheme comprises 34 SIs categorized in the 10 action areas of the EAPA (Table 9). Most of the SIs
encompass multiple policy variables. Detailed scoring rubrics showing the composition of each SI are presented in Annex 2.
Table 9. Overview of scoring scheme for the EAPA composite indicators
Maximum Multiplier Weighted
Indicators raw score level score
1. Leadership, awareness and commitment
1.1 National policy on alcohol 4 3 12
1.2 Definition of alcoholic beverage 1 2 2
1.3 Definition of standard drink 1 1 1
1.4 Awareness activities 4 2 8
Total possible points (after weighting) 23
2. Health services’ response
2.1 Screening and brief interventions for harmful and hazardous alcohol use 10 3 30
2.2 Special treatment programmes 4 2 8
2.3 Pharmacological treatment 4 3 12
Total possible points (after weighting) 50
3. Community and workplace action
3.1 School-based prevention and reduction of alcohol-related harm 4 2 8
3.2. Workplace-based alcohol problem prevention and counselling 6 2 12
3.3 Community-based interventions to reduce alcohol-related harm 7 2 14
Total possible points (after weighting) 34
4. Drink–driving policies and countermeasures
4.1 Maximum legal BAC limit when driving a vehicle 5 5 25
4.2 Enforcement using sobriety checkpoints 3 3 9
4.3 Enforcement using random breath-testing 4 4 16
4.4 Penalties 4 4 16
Total possible points (after weighting) 66
5. Availability of alcohol
5.1 Lowest age limit for alcohol service on the premises and sale
of alcohol for consumption off the premises 4 4 16
5.2 Control of retail sales 4 3 12
5.3 Restrictions on availability by time 4 3 12
5.4 Restrictions on availability by place 4 3 12
5.5 Restrictions on sales at specific events 3 3 9
5.6 Alcohol-free public environments 11 3 33
Total possible points (after weighting) 94
6. Marketing of alcoholic beverages
6.1 Legally binding restrictions on alcohol advertising 4 3 12
6.2 Legally binding restrictions on product placement 4 3 12
6.3 Legally binding restrictions on industry sponsorship for
sporting and youth events 4 3 12
6.4 Legally binding restrictions on sales promotions by producers,
retailers and owners of pubs and bars 4 3 12
Total possible points (after weighting) 48
12You can also read