Managing the Carbon Footprint of Australian Aviation - Australia's Action Plan developed in response to the International Civil Aviation ...
←
→
Page content transcription
If your browser does not render page correctly, please read the page content below
Managing the Carbon
                            Footprint of Australian
                                           Aviation
                                Australia’s Action Plan developed in response to the
                                International Civil Aviation Organization (ICAO) 2010
                                                         Assembly Resolution A37-19

                                                                      October 2012

aa_climatechange_a.indd 1                                                       29/10/12 12:17 PM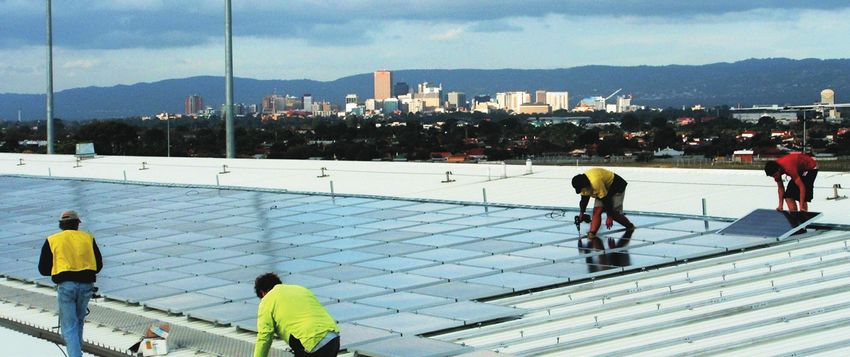
• 2 • Managing the Carbon Footprint of Australian Aviation

aa_climatechange_a.indd 2                                                   29/10/12 12:17 PM
Managing the Carbon
                            Footprint of Australian
                                           Aviation

                                Australia’s Action Plan developed in response to the
                                International Civil Aviation Organization (ICAO) 2010
                                                         Assembly Resolution A37-19

                                                                      October 2012

aa_climatechange_a.indd 1                                                               29/10/12 12:17 PM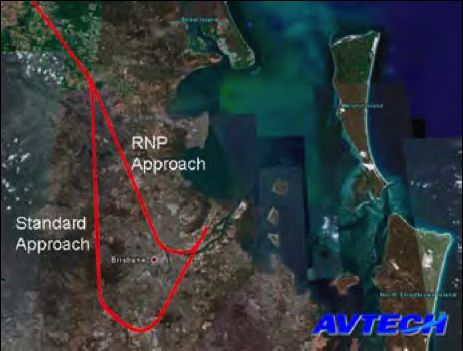
© Commonwealth of Australia 2012
                        ISBN 978-1-921769-93-1
                        October 2012 / INFRA1448

                        Ownership of intellectual property rights in this publication

                        Unless otherwise noted, copyright (and any other intellectual property rights, if any) in this
                        publication is owned by the Commonwealth of Australia (referred to below as the Commonwealth).

                        Disclaimer

                        The material contained in this publication is made available on the understanding that the
                        Commonwealth is not providing professional advice, and that users exercise their own skill and
                        care with respect to its use, and seek independent advice if necessary.

                        The Commonwealth makes no representations or warranties as to the contents or accuracy of
                        the information contained in this publication. To the extent permitted by law, the Commonwealth
                        disclaims liability to any person or organisation in respect of anything done, or omitted to be done,
                        in reliance upon information contained in this publication.

                        Creative Commons licence

                        With the exception of (a) the Coat of Arms; (b) the Department of Infrastructure’s photos and
                        graphics; and (c) [OTHER], copyright in this publication is licensed under a Creative Commons
                        Attribution 3.0 Australia Licence.

                        Creative Commons Attribution 3.0 Australia Licence is a standard form licence agreement that
                        allows you to copy, communicate and adapt this publication provided that you attribute the work
                        to the Commonwealth and abide by the other licence terms. A summary of the licence terms is
                        available from http://creativecommons.org/licenses/by/3.0/au/deed.en. The full licence terms are
                        available from http://creativecommons.org/licenses/by/3.0/au/legalcode.

                        This publication should be attributed in the following way: ©Commonwealth of Australia 2012,
                        Department of Infrastructure and Transport, Managing the Carbon Footprint of Australian Aviation

                        Use of the Coat of Arms

                        The Department of the Prime Minister and Cabinet sets the terms under which the Coat of Arms is
                        used. Please refer to the Department’s Commonwealth Coat of Arms and Government Branding
                        web page http://www.dpmc.gov.au/guidelines/index.cfm#brand and in particular, the Guidelines
                        on the use of the Commonwealth Coat of Arms publication.

                        Contact us

                        This publication is available in hard copy or PDF format. All other rights are reserved, including in
                        relation to any Departmental logos or trade marks which may exist. For enquiries regarding the
                        licence and any use of this publication, please contact:

                        Director — Publishing and Communications
                        Communications Branch
                        Department of Infrastructure and Transport
                        GPO Box 594
                        Canberra ACT 2601
                        Australia

                        Email: 		        publishing@infrastructure.gov.au
                        Website:         www.infrastructure.gov.au

aa_climatechange_a.indd 2                                                                                                       29/10/12 12:17 PM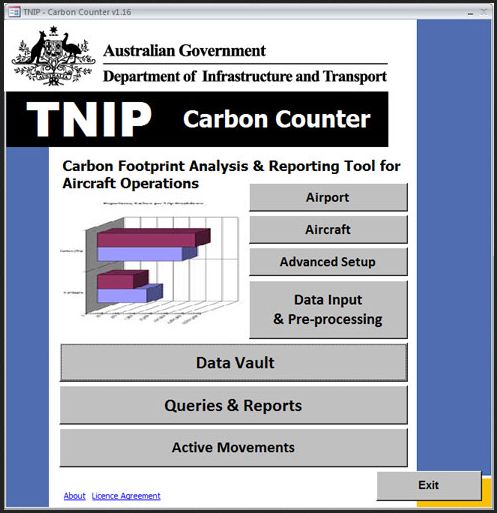
Executive
                        Summary

                        Australia is a vast island nation – aviation connects Australians with each other and with the
                        rest of the world. Worldwide there are strong incentives within the aviation industry to improve
                        fuel efficiency as fuel costs represent more than 30% of airlines’ operating costs. Australia’s
                        aviation network is one of the most efficient in the world, characterised by a modern fleet and
                        world-leading air traffic management practices. Australia’s airlines are continuing to invest in
                        modern, more fuel efficient fleets while our air navigation service provider, Airservices Australia,
                        is continuing to improve air traffic management and operational procedures.

                        However, despite these improvements in fuel efficiency, there is more to be done to manage
                        the CO2 emissions from aviation activity. Growth in demand for aviation services continues to
                        outstrip the rate of fuel efficiency improvements. The net carbon footprint continues to grow.

                        This report provides an overview of the initiatives the Australian Government and aviation
                        industry are undertaking to manage the carbon footprint of Australian aviation. It also provides
                        information on future actions that are being considered or developed to further improve the
                        management of greenhouse gas emissions from Australian aviation.

                        Australia’s aviation carbon emissions challenge
                        Against a background of continuing annual increases in demand of at least 5%, the carbon
                        footprint of Australian aviation is growing at an average of approximately 3% per year.

                        Figure 1 shows that the industry will continue to improve its efficiency and emissions
                        performance. However, based on current annual increases in demand, Australia’s international
                        aviation carbon emissions will increase to more than three times current levels by 2050, despite
                        ongoing improvements in the energy efficiency of aviation operations.

                        The ongoing improvements in fuel efficiency, brought about by measures such as airline fleet
                        renewal and improvements in air traffic management are estimated to provide savings of around
                        32 million tonnes (Mt) of CO2 by 2050. The efficiency measures that are being progressively put
                        in place in the operational environment have provided an annual reduction in carbon emissions
                        per passenger of around 2% per year over the past two decades. However, it is possible that
                        efficiency gains from existing technological measures will level out at some stage. Greater
                        savings will be required to reach more stringent environmental targets.

aa_climatechange_a.indd 3                                                                                                      29/10/12 12:17 PM
• iv • Managing the Carbon Footprint of Australian Aviation

                 Figure 1:                                               Australia’s projected international aviation carbon emissions to 2050
                                                             65

                                                             60                 Frozen fuel efficiency from 2010
                                                                                Ongoing fuel efficiency improvements
                                                             55
                                                                                50% biofuels by 2050
                                                             50
                                                                                Carbon Neutral Growth from 2020
              Australia’s international CO2 Emissions (Mt)

                                                             45

                                                             40

                                                             35

                                                             30

                                                             25

                                                             20

                                                             15

                                                             10

                                                              5

                                                              0

                                                                  1990   1995      2000     2005       2010    2015     2020     2025     2030   2035   2040   2045   2050

                                                                                                          Financial Year (Year ending June)

                 Note: An explanation of how the projections were derived is provided in Chapter 4.

                 Scenarios for Australia’s future aviation carbon footprint
                 This report considers the trajectory of two potential carbon footprint scenarios. They are:

                                                             1. projections of Australia’s future aviation carbon emissions levels based on current ongoing technological
                                                                and operational measures to reduce emissions; and

                                                             2. capping of emissions at 2020 levels – carbon neutral growth.

                 In developing the scenarios for this Action Plan, it has been important to consider international progress
                 and targets. The Australian Government is an active participant and supporter of the International Civil
                 Aviation Organization’s (ICAO) work to develop a multilateral approach to the management of emissions
                 from international aviation operations. ICAO continues to work towards gaining agreement on the emissions
                 reduction goals for the international aviation sector. Scenario 2 reflects one of the aspirational goals adopted
                 by the ICAO Assembly Resolution A37-19 in 2010 that ICAO states will work together to keep the global net
                 carbon emissions from international aviation at the same level from 2020 onwards.

                 As part of the 3 yearly review of this document, the scenarios will be reassessed and new trajectories may
                 be included. The revision of scenarios will enable Australia to consider the impact of any targets agreed at
                 future ICAO Assemblies or arising from progress of work under the United Nations Framework Convention
                 on Climate Change (UNFCCC), as well as reflect changes to national emission reduction targets.

aa_climatechange_a.indd 4                                                                                                                                                    29/10/12 12:17 PM
Executive Summary • v •
Carbon saving measures
Figure 1 indicates that savings of approximately 17 Mt CO2 will need to be found by 2050 in addition to
current ongoing efficiency improvements in order to achieve Scenario 2 (maintaining carbon emissions at
2020 levels). The Action Plan indentifies possible carbon saving measures to achieve scenario 1 or 2.
Continuing improvement
For the past two decades ongoing improvements in fuel efficiency have been achieved as part of the aviation
sector’s business improvement activities. These measures, discussed in Chapters 5 to 10, include new air
traffic management procedures, improvements in aircraft utilisation and fleet renewal. They have provided
a 100% improvement in fuel efficiency since 1990. Nevertheless, the efficiency improvements provided by
these measures will not offset the expected growth in demand.
Carbon pricing – the near term
The Australian Federal Parliament has passed legislation implementing a carbon price to fully capture
domestic aviation emissions from 1 July 2012. Discussions are continuing within ICAO on the development
of a market-based measures framework for international aviation and Australia is committed to pursuing a
global sectoral agreement through ICAO.
Alternative fuels – the medium term
Opportunities to use alternative fuels to reduce carbon emissions are discussed in Section 11.2. The technical
feasibility of using biofuels in aviation has now been demonstrated. However the extent to which sustainable
biofuels will be able to contribute towards carbon goals will be determined by feedstock and production
constraints. A study by the Australian Commonwealth Scientific and Industrial Research Organisation
(CSIRO) in 2011 concluded that the Australasian region has sufficient biomass resources to achieve a 5%
bioderived jet fuel share by 2020 and a 50% share by 2050.
Monitoring and reporting
The monitoring and reporting of Australia’s aviation carbon footprint underpin this report. The Australian
Department of Infrastructure and Transport has developed a carbon counting tool — TNIP Carbon Counter
(based on ICAO’s Carbon Calculator) — which computes and reports key metrics.
The Australian Government also compiles and reports Australia’s national emissions, including Australia’s
domestic and international aviation emissions, in its annual National Greenhouse Gas Inventory as discussed
in Section 10.6. Australian airlines such as Qantas and Virgin Australia also report their aircraft operational
emissions and carbon intensity in their annual reports.
aa_climatechange_a.indd 5 29/10/12 12:17 PM• vi • Managing the Carbon Footprint of Australian Aviation
Overview of Australia’s progress on managing aviation carbon
emissions
Progress to date:
•• Over the past two decades, Australia’s carbon emissions per passenger have decreased by 39%
and 35% respectively for international and domestic air travel. This corresponds to an annual
average decrease of 2.3% and 2.1% per annum respectively (Section 3.3).
•• Australia’s average fuel efficiency for international aircraft operations is currently around 4.20 litres
per 100 Revenue Passenger Kilometres. This is much better than the global industry average as
discussed in Section 3.4.
•• Australian airspace has the highest operating efficiency compared to any other air traffic management
airspace in the world (Section 7.2).
Changes in the CO2 /passenger for Australia’s
Fuel (litres)/100RPK
international aircraft operation
1,200
Emirates 4.12
1,000
Lufthansa
800 4.20
kilograms
Group
600
Australia
4.20
(international)
400
200 IATA 2010
5.40
global fleet average
0
1990 2000 2011 0.0 1.0 2.0 3.0 4.0 5.0 6.0
International targets:
ICAO’s aspirational goals for international aviation:
•• 2% annual fuel efficiency improvements until 2050;
•• work towards carbon neutral growth from 2020.
Industry goals for international aviation by the International Air Transport Association (IATA):
•• 1.5% annual fuel efficiency improvements until 2020;
•• carbon neutral growth from 2020;
•• 50% reduction in CO2 emissions by 2050 relative to 2005 levels.
aa_climatechange_a.indd 6 29/10/12 12:17 PMExecutive Summary • vii •
Measures to reduce the carbon footprint of Australian aviation:
Australian Government initiatives (Section 6):
•• introduction of a domestic carbon pricing regime;
•• encouraging investment in aircraft efficiency improvements and the development of sustainable
biofuels;
•• implementing a National Carbon Offset Standard;
•• monitoring and reporting Australia’s aviation carbon footprint;
•• working towards a multilateral approach through ICAO for managing the climate change impacts
of international aviation;
•• establishment of an annual forum involving relevant Government agencies and industry to facilitate
the exchange of information and ideas on mitigating actions and to discuss any obstacles to
implementation.
Airservices Australia initiatives to improve air traffic management efficiency (Section 7):
•• deployment of best practice satellite-based navigation procedures (Smart Tracking);
•• improvement of gate-to-gate sequencing of aircraft;
•• provision of daily flexible air traffic routes to optimise flights;
•• development of coordinated air traffic control procedures with other air navigation service providers
over combined airspace;
•• computation of carbon and aircraft noise emissions for air traffic procedures.
Airline initiatives (Section 8):
•• ongoing fleet renewal;
•• improvement of gate-to-gate fuel efficiency through flight path and aircraft speed optimisation;
•• management of onboard weight;
•• increased use of ground power units to replace the less efficient use of aircraft auxiliary power;
•• provision of passenger voluntary offset schemes;
•• corporate offsetting of company emissions;
•• participation in the development of sustainable aviation biofuels.
Airport initiatives (Section 9):
•• building greener commercial buildings on-site, providing ground power and pre-conditioned air
facilities for aircraft, and decreasing the fuel consumption of ground-based vehicles;
•• generating electricity through solar installations;
•• developing ground transport plans for better linkages with off-airport transport systems;
•• preparing carbon footprint reports on airport emissions.
aa_climatechange_a.indd 7 29/10/12 12:17 PM• viii • Managing the Carbon Footprint of Australian Aviation
Challenges:
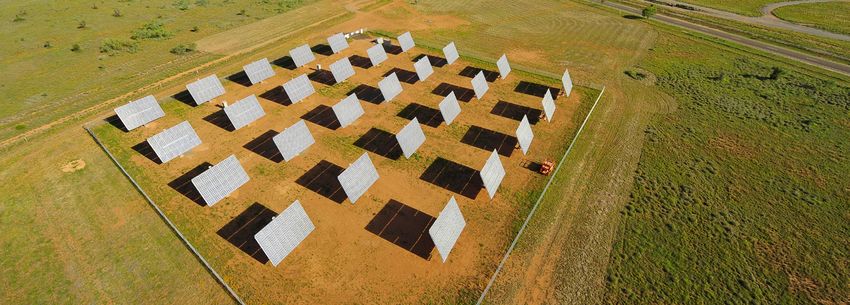
In line with global trends, the carbon emissions from all international flights departing Australia to the first
overseas port of call grew from 7.03 to 8.93 million tonnes (Mt) over the last decade, an increase of 27%,
while the domestic footprint grew from 5.3 to 8.00 Mt, an increase of 51% (see Table 1 in Section 3.3). The
footprints are expected to continue growing at an annual average rate of 1.8% and 2.9% for the domestic
and international aviation sectors respectively in the future.
In order to cap Australia’s international aviation emissions at 2020 levels, savings of approximately 17 Mt
CO2 would need to be found by 2050 with current ongoing measures and in the absence of any additional
emission reduction measures.
Australia’s projected international aviation Emissions to 2050
30
Current ongoing fuel efficiency improvements
25 50% biofuels by 2050
Carbon Neutral Growth from 2020
20
million tonnes CO2
15
10
5
0
1990 1995 2000 2005 2010 2015 2020 2025 2030 2035 2040 2045 2050
Financial Year (Year ending June)
aa_climatechange_a.indd 8 29/10/12 12:17 PMExecutive Summary • ix •
Contents
Executive Summary iii
Australia’s aviation carbon emissions challenge iii
Scenarios for Australia’s future aviation carbon footprint iv
Carbon saving measures v
Monitoring and reporting v
Overview of Australia’s progress on managing aviation carbon emissions vi
1. Introduction 1
Aviation and climate change 1
Progress in ICAO 2
Australia’s situation 2
Key features of Australia’s Strategy 2
2. Scope of Australia’s ICAO Action Plan 3
Definition of domestic and international 3
Operational coverage 3
Going beyond aircraft operational measures 3
Time horizon 4
Part 1 National Aviation Carbon Footprint 5
3. Australia’s Aviation Carbon Footprint 5
3.1 Trends in Australia’s aviation carbon emissions 5
3.2 Differentiating between domestic and international operations 7
3.3 Overview of Australia’s aviation carbon footprint 8
Changes over the past two decades 8
3.4 Fuel efficiency 9
Absolute fuel efficiency 10
aa_climatechange_a.indd 9 29/10/12 12:17 PM• x • Managing the Carbon Footprint of Australian Aviation
4. Future carbon footprints – projections and scenarios 11
4.1 Introduction 11
4.2 Establishing and using baselines 11
4.3 Carbon footprint scenarios 12
Scenario 1: Continuation of current trends 12
Scenario 2: Carbon neutral growth 14
4.4 Assessment of the scenarios 14
Scenario 1: Continuation of current trends 14
Scenario 2: Carbon neutral growth 14
Part 2 Managing Australia’s Aviation Carbon Emissions 16
5. Identifying Potential Measures 16
6. Setting the Policy and Regulatory Framework 16
6.1 Introduction 16
6.2 Economy-wide climate change settings 17
6.3 Economic measures 17
Domestic aviation implications 17
International aviation implications 18
6.4 Potential future action and initiatives 19
Encouraging investment 19
6.5 Facilitating transparency – building trust 19
National Carbon Offset Standard 19
Development of carbon footprinting tools 20
Industry forum on aviation carbon emissions 20
6.6 Working toward international agreements 20
Australian Government Initiatives 21
7. The Role of Airservices Australia 21
7.1 Introduction 21
7.2 Achievements to date 21
7.3 Examples of current measures 22
Flextracks 22
RNP approaches and departures 23
Improved gate-to-gate management of aircraft 23
International collaboration 24
7.4 Potential future action and initiatives 25
Airservices Australia Initiatives 26
aa_climatechange_a.indd 10 29/10/12 12:17 PMExecutive Summary • xi •
8. Airline Contribution 26
8.1 Introduction 26
8.2 Australian airlines 27
8.3 Measures for improving fuel efficiency 29
Fleet renewal and improvement 29
Weight reduction measures 30
Load factors 30
Fuel optimisation 31
8.4 Measures for offsetting emissions 32
Voluntary offsets by individual air passengers 32
Voluntary offsets by airlines 32
8.5 Potential future action and initiatives 32
Alternative fuels 32
Increasing passenger loads 32
Managing aircraft weight 32
Increasing the quantum of voluntary offsets 33
Australian Airline Initiatives 33
9. Airport Contribution 34
9.1 Introduction 34
9.2 Examples of emission reduction initiatives at Australian airports 34
Ground Support Equipment 34
Minimisation of the use of APUs 34
Green buildings 34
Solar energy 35
Airfield lighting 35
Australian Airport Initiatives 36
Research 36
Ground Transport Plans 36
Carbon footprint reporting 36
aa_climatechange_a.indd 11 29/10/12 12:17 PM• xii • Managing the Carbon Footprint of Australian Aviation
Part 3 Measurement, Reporting and Verification 37
10. Monitoring and Reporting Emissions 37
10.1 Introduction 37
10.2 Development of a carbon footprint tool 37
10.3 Annual carbon footprint reports 38
10.4 Fuel sales reporting to ICAO 38
10.5 Reporting gross and net footprints 38
10.6 National greenhouse gas reporting 38
National Greenhouse Accounts 39
National Greenhouse and Energy Reporting 39
10.7 Airline Annual Reports 39
Part 4 Future Directions 40
11. Future Measures 40
11.1 The near term – market-based measures 40
Domestic aviation 41
International aviation 41
11.2 The medium term — alternative fuels 41
Potential contribution by biofuels 42
12. The way ahead 43
12.1 Range of scenarios for Australia’s international aviation carbon emissions 43
12.2 Conclusion 45
aa_climatechange_a.indd 12 29/10/12 12:17 PM1. Introduction
Aviation and climate change
Aviation contributes approximately two per cent of global human-induced greenhouse gas emissions.
This contribution is expanding as growth in the aviation sector continues to exceed other industry sectors.
Australia has been an active player in driving international progress to address climate change. In 2009, the
Copenhagen Accord forged a broad agreement to hold any global temperature increase below 2 degrees
Celsius. This goal was reaffirmed at the United Nations Framework Convention on Climate Change (UNFCCC)
negotiations in December 2010 in Cancun, Mexico. Australia is among 90 countries which have set targets
and actions under the UNFCCC to reduce emissions by 2020. These targets cover 80 per cent of the world
economy.
According to the fourth Assessment Report of the Intergovernmental Panel on Climate Change (IPCC), to
have the best chance of meeting the 2 degrees temperature goal, both developed and developing countries
must act quickly to substantially reduce greenhouse gas emissions. In line with these recommendations,
Australia has set a longer term target to reduce greenhouse gas emissions by 80% below 2000 levels by
2050. Meeting these international targets will require strong and concerted action on multiple fronts. This is
why the Australian Government has introduced a plan for a Clean Energy Future that:
•• puts a price on carbon pollution from 1 July 2012 starting at A$23 per tonne and transitioning to a
flexible market price with a cap on total domestic emissions in 2015;
•• provides significant support for renewable energy to ensure that 20 per cent of Australia’s electricity
comes from renewable energy sources by 2020 and mobilising more than A$13 billion for research,
development and deployment of new renewable energy infrastructure and technologies;
•• drives improvements in energy efficiency across the economy – in homes, businesses, buildings and
industries; and
•• creates opportunities for farmers and land managers to reduce emissions or store carbon in the
landscape, preserve and restore biodiversity and improve on farm productivity.
As from 1 July 2012, the Australian carbon price applies to emissions from Australian domestic aviation
and provides incentives for low-emissions strategies in that sector. The international aviation sector is not
included in Australia’s domestic carbon pricing scheme or captured by Australia’s obligations under the
UNFCCC or the Kyoto Protocol. Australia is working with the International Civil Aviation Organization (ICAO)
towards a global sectoral agreement for international aviation.
In December 2009, the Australian Government released an Aviation White Paper which included a discussion
on aviation’s role in reducing global carbon emissions. In the White Paper the Government committed to:
•• continue to work through ICAO and other forums to ensure measures to address carbon emissions
from international aviation apply equitably to all airlines and do not create market distortions;
aa_climatechange_a.indd 1 29/10/12 12:17 PM• 2 • Managing the Carbon Footprint of Australian Aviation
•• press ahead with the application of improved air traffic management technology and enhanced
operational procedures to optimise the efficiency of aircraft operations to and from Australia and in
Australian airspace;
•• establish a regime which facilitates improvements to airport operations and infrastructure and gate-to-
gate efficiencies; and
•• ensure that a robust transparent regime for monitoring, assessing and reporting aviation carbon
footprints is implemented.
Progress in ICAO
ICAO is the United Nations agency which serves as the forum for cooperation in all fields of civil aviation
among its 190 Member States. At ICAO’s 37th Assembly in October 2010, Resolution A37-19 was adopted
which endorsed a range of measures to address international aviation’s contribution to climate change.
The Assembly Resolution requested the 190 ICAO Member States to submit Action Plans to ICAO that set
out proposed actions towards achieving the global aspirational goals for international aviation of 2% annual
fuel efficiency improvements until 2050. Member States also resolved to strive to keep global net carbon
emissions from international aviation at the same level from 2020 onwards (carbon neutral growth). These
actions are based on individual national capacities and circumstances. Australia, as a Member State, is
working to comply with this Resolution.1
Australia’s situation
Over the past two decades the efficiency of Australian aviation has improved significantly and Australia’s
aircraft operations are very fuel efficient compared to global standards (see Section 3.4). Despite this,
Australia’s domestic and international aviation carbon footprint is projected to grow at around 1.8% and
2.9% respectively per annum over the next two decades (see Section 3.1) due to growth in demand and this
will require further efficiency improvements in an already highly efficient system.
The Australian Government will continue to track fuel efficiency changes over time to monitor their continued
contribution to meeting ICAO’s aspirational goals.
Key features of Australia’s Strategy
Australia’s focus for meeting ICAO’s aspirational goals is through the implementation of active CO2
management measures, rather than through unrealistic constraints on travel. A range of measures have been
progressively introduced over the years to improve the efficiency of Australia’s aviation system, including fleet
renewal, improved air traffic management and more efficient on-ground operations.
There are a number of constraints which influence the adoption of carbon saving measures – these include
the need to maintain aviation safety as the highest priority, the need to take account of aircraft noise impacts,
and the feasibility and economic viability of adopting new technologies in the near future.
While ICAO’s focus is on emissions from the international aviation sector, many of the measures to reduce
aviation emissions apply to domestic as well as international services. Australia’s ICAO Action Plan
encompasses a suite of strategies which address emissions from both international and domestic operations.
1 ICAO Assembly Resolution A37-19, paragraph 10 (http://www.icao.int/env/A37_Res19_en.pdf).
aa_climatechange_a.indd 2 29/10/12 12:17 PMIntroduction • 3 •
2. Scope of Australia’s ICAO Action Plan
The ICAO guidance material for assisting Member States in the preparation of State Action Plans allows for
flexibility in terms of coverage, content and format. In order to avoid any ambiguity in the interpretation of
specific terms or the extent of operational coverage, the scope encompassed by Australia’s ICAO Action
Plan is discussed below.
Definition of domestic and international
This document adopts the United Nations’ Intergovernmental Panel on Climate Change’s definition of
domestic and international aviation whereby flight segments are designated as ‘domestic’ if they take off
and land in Australia, and ‘international’ if they arrive from or depart to a foreign country. This definition is
consistent with Australia’s reporting of greenhouse gas emissions agreed as part of the United Nations
Framework Convention on Climate Change (UNFCCC). This definition is applied irrespective of the nationality
of air carriers operating to and from Australia.
Approximately 55% of CO2 emissions from the Australian aviation industry are generated by international
activity (including overseas airlines servicing Australia), while about 45% of emissions are generated by
domestic activity.
Operational coverage
The ICAO Assembly Resolution A37-19 for States to submit action plans only calls for plans applying to the
international aviation sector. Greenhouse gas emissions from domestic aircraft operations are accounted for
by individual countries under the UNFCCC and Kyoto Protocol accounting methodology. However, given
that most measures to reduce aviation emissions are common to both domestic and international sectors,
Australia’s Action Plan includes policies and actions in Australia to address the carbon footprint of both these
sectors.
Furthermore, to avoid double counting, only fuel uplifted for aircraft departures is counted towards Australia’s
aviation carbon footprint. For international departures from Australia, only the fuel used up to the first overseas
port of call is accounted for.
Going beyond aircraft operational measures
The purpose of the State Action Plans requested by the ICAO Assembly is to enable ICAO to compile
information on achieving the global goals adopted at the 37th ICAO Assembly in 2010. These goals, which
relate to improving fuel efficiency and capping global net carbon emissions, apply only to CO2 emissions
from aircraft operations. However, while the overwhelming proportion of aviation’s carbon footprint arises
from aircraft operations, other sources, such as airport ground-based emissions, are also being actively
addressed.
While airport contributions to the aviation carbon footprint are relatively small compared to the contribution
from aircraft operations (see Figure 2), Australian airports are implementing a wide range of measures to
address climate change.
aa_climatechange_a.indd 3 29/10/12 12:17 PM• 4 • Managing the Carbon Footprint of Australian Aviation
Figure 2: Indicative contributions to the carbon footprint of aviation2
2% Airport company
(terminals and other buildings. ground services equipment, etc.)
8% Land transport to/from airport
(passengers,visitors greeting or sending off passengers, catering services, etc.)
10% Aircraft 3000 feet
(aircraft en route)
Some airports in other countries are including carbon emissions from ground transport associated with
moving passengers to and from the airport in their carbon footprint reporting. Studies carried out by these
airports indicate that this transport is likely to comprise around 8% of the total carbon footprint of aviation if
it is included in the airport ‘bubble’.3
Significant improvements have been made in transport links to and from Australian airports in recent years.
However there are a number of difficulties in including transport to/from airports in the emissions ‘bubble’,
especially given the limited influence and control some airport operators have in this area. It is difficult to
robustly compute the quantum of CO2 associated with off-airport transport and if emissions are included
there is a danger of double counting as emissions from off-airport transport are also likely to be captured in
land transport carbon footprint management regimes.
Time horizon
In order to align with ICAO’s goals, this document covers the time period from the present to 2050. It is
recognised that there will be uncertainty in projections decades into the future, but trend estimates are
available. It is intended that the Action Plan will be reviewed on a regular three year basis to enable the
modelling of different scenarios to reflect future national and international goals.
2 Seattle-Tacoma International Airport, Greenhouse Gas Emissions Inventory – 2006
(http://airportattorneys.com/files/greenhousegas06.pdf).
3 See ref [2].
aa_climatechange_a.indd 4 29/10/12 12:17 PMPart 1
National Aviation
Carbon Footprint
3. Australia’s Aviation Carbon Footprint
3.1 Trends in Australia’s aviation carbon emissions
Australia’s domestic and international aviation sectors have been growing significantly over the past few
decades. At the same time the industry has been making great strides in improving aircraft and operational
fuel efficiency. The demand for air travel, however, has been growing at a much higher rate than the
improvements in fuel efficiency, resulting in an overall increase in the aviation carbon footprint. This section
outlines the growth in Australia’s aviation sector and the improvements in fuel efficiency.
Australia’s domestic and international carbon emissions from civil aircraft operations have been increasing
at an average annual rate of 3.9% and 4.1% respectively over the 19 year period between financial years
1989–90 and 2008–09 as reported in Australia’s National Greenhouse Gas Inventory 2009.4
Australia’s total aviation emissions more than doubled between 1989–90 and 2008–09 with emissions from
the domestic and international sectors increasing by 105% and 116% respectively as shown in Figure 3.
By comparison, emissions from Australia’s domestic transport sector as a whole (excluding international
transport) were 34.6% higher in 2008–09 compared to 1989–90.
The aviation sector has been growing faster than other transport modes for some decades. Correspondingly,
the sector’s contribution to total transport emissions in Australia has also grown, from 10.7% in 1989–90 to
16.2% in 2008–09.
In terms of Australia’s domestic aviation industry, activity increased from 19.8 billion passenger kilometres in
1991–92 to 56.3 billion in 2008–09. Over the same period, fuel efficiency improved substantially due to more
fuel efficient aircraft, improved air traffic management procedures and better aircraft utilisation. Domestic
aviation fuel efficiency reached 4.2 litres/100 kilometres per person in 2008–09, which is comparable to
current better performing motor vehicles.
Figure 4 shows the historic trends in both aviation emissions and emissions intensity for the Australian
domestic aviation industry. It can be seen that, while there has been an increase in net emissions by 53.4%
between 1991–92 and 2008–09, there has been a 46.1% decrease in the emissions intensity or the emissions
per 100 revenue passenger kilometres (RPK).
4 National Greenhouse Gas Inventory 2009, Department of Climate Change and Energy Efficiency,
(http://www.climatechange.gov.au/publications/greenhouse-acctg/national-greenhouse-gas-inventory-2009.aspx).
aa_climatechange_a.indd 5 29/10/12 12:17 PM• 6 • Managing the Carbon Footprint of Australian Aviation
Figure 3: Australia’s aviation emissions, 1989–90 to 2008–09
16
Total International Domestic
14
12
Aviation Emissions (Mt CO2e)
10
8
6
4
2
0
1990 1995 2000 2005 2010
Financial Year
Figure 4: Australia’s annual domestic aviation emissions, 1992–2009
7 29
Domestic Aviation Emissions Domestic Aviation Emission Intensity
6 26 Aviation Emissions Intensity (kgCO2-e per 100 RPK)
5 23
Aviation Emissions (Mt CO2e)
4 20
3 17
2 14
1 11
0 8
1992 1993 1994 1995 1996 1997 1998 1999 2000 2001 2002 2003 2004 2005 2006 2007 2008 2009
Financial Year
Notes: Emissions data is from National Greenhouse Gas Inventory 2009. Domestic RPK data is sourced from BITRE.5 International RPK
data for total traffic to and from Australia is not available from BITRE, hence it is not possible to produce a similar aviation emissions
intensity chart for international operations.
5 BITRE, Monthly Airline Performance (http://www.bitre.gov.au/info.aspx?ResourceId=218&NodeId=103).
aa_climatechange_a.indd 6 29/10/12 12:17 PMPart 1 National Aviation Carbon Footprint • 7 •
Australia’s domestic aviation carbon emissions have been increasing at an annual average rate of
2.5% per annum since 1991–92. The system efficiency (expressed as CO2-e per 100 RPK) improved at an
average annual rate of 4.2% between 1991–92 and 2006–07, so that by 2006–07 it had reached 10.4kg
CO2‑e/100RPK (almost half the 1991–92 value).
Growth in Australia’s aviation industry is expected to continue with air passengers at all Australian airports
projected to increase at an average annual rate of 4.0%, leading to a near doubling of total annual passengers
by 2025–26.6
The growth in emissions from Australia’s domestic and international civil aviation sectors is projected to be
around 1.8% and 2.9% respectively per annum between 2010 and 2030.7 For comparison, total emissions
from motor vehicles in Australia are forecast to grow at approximately 1.3% per annum over the same period,
albeit from a much higher base.
3.2 Differentiating between domestic and international operations
Under the Kyoto Protocol, domestic aviation emissions are counted towards national emissions targets,
while emissions from fuel sold to aircraft engaged in international transport (also known as bunker fuels) are
excluded. In Australia, emissions from domestic aviation are captured by the Australian Government’s Clean
Energy Future legislation which established a price on carbon emissions from 1 July 2012.
The Kyoto Protocol requires that limitations or reductions of international aviation emissions should be pursued
through ICAO. ICAO is continuing to develop a multilateral approach on how emissions from international
aviation are to be treated.
Given that the CO2 emissions from domestic and international aviation are being accounted for under
different international processes, the carbon footprint of these two sectors must be disaggregated to ensure
consistent reporting and acountability.
As Australia’s National Greenhouse Gas Inventory only provides an aggregated picture of Australia’s
domestic and international aviation emissions, the Department of Infrastructure and Transport has developed
a software tool called TNIP Carbon Counter8 for computing the carbon footprint of aircraft operations and for
analysing and disaggregating carbon footprint data over system-wide operations. More detailed information
of the application is available on the Department’s website.9
TNIP Carbon Counter has been used to produce the detailed carbon footprint information in this document.
The proportion of emissions from international, interstate and intrastate aircraft departures10 contributing to
Australia’s total aviation carbon footprint for 2010–11 is shown in Figure 5. Figure 5 shows that for 2010–11
international aircraft operations were the main source of emissions (56.4%) due to the comparatively long
distances travelled, even though they comprised only 7.4% of total aircraft departures.
6 Air passenger movements through capital city airports to 2025–26, BITRE Working Paper 72, 2008
(http://www.bitre.gov.au/info.aspx?ResourceId=637&NodeId=59).
7 BITRE, Long–term Projections of Australian Transport Emissions: Base Case 2010; aviation emissions in Table 2.8 (p 133); motor vehicle
emissions in Table 1.2A (p 9).
(http://www.climatechange.gov.au/publications/projections/~/media/publications/projections/bitre-transport-modelling-pdf.pdf)).
8 TNIP Carbon Counter, ICAO Environmental Report 2010, pp 62-65
(http://www.icao.int/icao/en/env2010/pubs/environmentreport_2010.pdf).
9 TNIP Carbon Counter Software Package and User Manual
(http://infrastructure.gov.au/aviation/environmental/transparent_noise/tnip_CC.aspx).
10 Aircraft arrivals are not included to avoid double counting.
aa_climatechange_a.indd 7 29/10/12 12:17 PM• 8 • Managing the Carbon Footprint of Australian Aviation
Figure 5: Australia’s aviation carbon footprint, 2010–11
33.0% Inner Circle: Aircraft departures
Outer Circle: CO2 emissions
International
16.7 Mt CO2
56.4% 35.6% 1.1 million 57.0%
departures Domestic Interstate
Domestic Intrastate
7.4%
10.6%
The majority of aircraft departures (57.0%) were for domestic travel within a state (intrastate travel), but these
contributed the least proportion of Australia’s total aviation carbon emissions (10.6%) due to the relatively
short distances travelled.
3.3 Overview of Australia’s aviation carbon footprint
Changes over the past two decades
Table 1 shows the growth in air passenger numbers in Australia for the financial year 2010–11 compared
to the start of the last two decades (1989–90 and 1999–2000). Over the past two decades Australia’s
international passenger numbers have more than tripled, while domestic passengers have more than
quadrupled. Since 1989–90, passenger numbers have been increasing at an annual average rate of 5.9%
and 7.3% for international and domestic air travel respectively.
Australia’s aviation carbon footprint has been growing at an average rate of 3.5% and 5.1% per annum
respectively for the international and domestic sectors, resulting in an approximate doubling of the international
carbon footprint and an approximate tripling of the domestic footprint in 2010–11 compared to 1989–90.
The slower growth in Australia’s aviation carbon footprint compared to the growth in demand reflects the
underlying improvements in fuel efficiency across the system. The system efficiency, as measured by the
amount of CO2 per passenger, has been improving at an annual average rate of 2.3% and 2.1% for the
international and domestic sectors respectively since 1989–90. Table 1 shows that over the past two
decades carbon emissions per passenger have dropped by 39% and 35% respectively for international and
domestic air travel.
aa_climatechange_a.indd 8 29/10/12 12:17 PMPart 1 National Aviation Carbon Footprint • 9 •
Table 1: Growth in Australia’s aviation activity and carbon footprint over the past two decades
Financial Year % change between years
Measure 1990 2000 2011 1990 to 2011 2000 to 2011
Passengers – international (million) 4.08 7.77 13.71 236.2 76.5
Passengers – domestic (million) 12.27 30.33 54.14 341.1 78.5
Passengers – total (million) 16.35 38.09 67.85 315.0 78.1
CO2 – international (Mt) 4.33 7.03 8.93 105.9 27.0
CO2 – domestic (Mt) 2.80 5.30 8.00 185.2 51.0
CO2 – total (Mt) 7.14 12.33 16.92 137.1 37.3
CO2 /passenger – international (kg) 1,063 905 651 –38.8 –28.0
CO2 /passenger – domestic (kg) 229 175 148 –35.4 –15.4
CO2 /passenger – total (kg) 437 324 249 –42.9 –22.9
Notes: Passenger data is from BITRE’s Monthly Airline Performance Report (http://www.bitre.gov.au/info.aspx?ResourceId=218&Nod
eId=103). The totals shown for international passengers are for outbound trips only. The carbon emissions data is from BITRE’s
estimates of the ‘business as usual’ trend as referenced in Section 4.3. For the latest available financial year of 2010–11, BITRE’s
estimates of Australia’s total aviation carbon footprint (as reported in this table) is 1.1% higher than the result computed using TNIP
Carbon Counter as reported in Figure 5.
3.4 Fuel efficiency
Australia continues to operate one of the world’s most modern and efficient aviation systems. The Australian
Government and industry share a common commitment to maintaining and enhancing the operational
efficiency of Australia’s aviation network.
At ICAO’s 37th Assembly in October 2010, Member States resolved to work through ICAO to achieve a
global average fuel efficiency improvement of 2% per annum until 2050 calculated on the basis of volume of
fuel used per revenue tonne kilometres (litres/RTK). ICAO has reported that global fuel efficiency improved
at an average rate of 2.5% per year between 1991 and 2009.11 ICAO concludes that technological and
operational efficiency improvements alone are sufficient to realise the 2% global annual fuel efficiency goal
until 2020.12
Differentiating between ‘Gross’ and ‘Net’ fuel efficiency
Fuel efficiency is generally defined by the amount of fuel used per unit of activity (e.g. litres of fuel per RTK).
For the purposes of carbon accounting the term ‘Gross’ fuel efficiency refers to the actual amount of the
specified type of fuel used per unit of activity (e.g. litres of Jet-A1 per RTK). The term ‘Net’ fuel efficiency is
triggered when a proportion of the carbon contained in the fuel is either sourced from nonfossil sources (e.g.
biofuels) or has been offset through some form of market-based measure. In these circumstances the ‘net’
amount of fuel used per unit of activity is computed through:
•• in the case of a biofuel, applying life cycle analysis techniques to ascertain the proportion of CO2
emissions from an aircraft operation that is nonfossil based; and
•• for a market-based measure, quantification of the amount of CO2 that has been offset to an agreed
standard (such as the National Carbon Offset Standard).
11 ICAO presentation slides 2010, Achieving Climate Change Goals for International Aviation, slide 4 (http://www2.icao.int/en/NewsRoom/
Presentation%20Slides/Achieving%20Climate%20Change%20Goals%20for%20International%20Aviation.pdf).
12 ibid, slide 10.
aa_climatechange_a.indd 9 29/10/12 12:17 PM• 10 • Managing the Carbon Footprint of Australian Aviation
By way of example, if all the CO2 generated by an aircraft operation were fully offset, the flight would be
deemed to be carbon neutral and the net amount of fuel used for that operation would be zero (e.g. the net
fuel efficiency could be expressed as 0 litres/RTK).
A fuel efficiency metric, taking into account market-based measures and sustainable biofuels is now being
developed by ICAO through the Committee on Aviation Environmental Protection (CAEP).
Absolute fuel efficiency
As shown in Section 3.1, Australia’s aviation sector has achieved an improvement in fuel efficiency, measured
as carbon emissions per 100RPK, across its domestic aviation network of around 4.2% per year for about
the last two decades. Section 3.3 showed that the total carbon emitted per passenger has also been
decreasing at around 2% per annum for both Australia’s international and domestic sectors.
Australia’s fuel efficiency averaged over its network of international operations is better than global industry
averages and is comparable to the efficiency of modern long haul airlines. This is illustrated by several fuel/
carbon efficiency metrics as shown in Table 2 and the following discussion.
Table 2: Australia’s latest fuel efficiency for aircraft operations, 2010–11
Financial Year 2010–11
Fuel Efficiency Metric International Domestic Total
Fuel (litres)/RTK 0.35 0.42 0.37
Fuel (litres)/100RPK 4.20 4.56 4.35
Fuel (litres)/100ASK 3.16 3.50 3.30
CO2/RPK (g) 107.1 116.3 111.0
CO2/ASK (g) 80.5 89.3 84.1
Notes: ASK refers to Available Seat Kilometres, RPK to Revenue Passenger Kilometres and RTK to Revenue Tonne Kilometres. All results
were derived using TNIP Carbon Counter13 and refer to aircraft departures only to avoid double counting.
13 TNIP Carbon Counter (http://infrastructure.gov.au/aviation/environmental/transparent_noise/tnip_CC.aspx).
aa_climatechange_a.indd 10 29/10/12 12:17 PMPart 1 National Aviation Carbon Footprint • 11 •
Examples of how Australia’s average international aviation fuel efficiency compares with leading international
airlines and the global average is given below.
Australia’s passenger CO2 efficiency in terms of CO2/RPK for international departures covering all aircraft
operators for 2010–11 was 107.1g as shown in Table 2. This is 21.5% better than IATA’s projected 2010
industry average of 136.5g14 and is comparable with the efficiencies reported by airline groups such as
Emirates (101.8g), Lufthansa Group (105.8g) and British Airways (106.1g).
Emirates
Emirates 101.8
101.8 Emirates
Emirates 4.12
4.12
Lufthansa
Lufthansa 105.8
105.8
Lufthansa
Lufthansa 4.20
4.20
British Airways
British Airways 106.1
106.1
Australia
Australia
4.20
4.20
Australia
Australia (international)
(international)
107.1
107.1
(international)
(international)
IATA 2010
IATA 2010 IATA 2010
IATA 2010
136.5
136.5 5.40
5.40
Global fleet
Global average
fleet average Global fleet
Global average
fleet average
0 0 20 20 40 40 60 60 80 80100100120120
140140 0 0 1 1 2 2 3 3 4 4 5 5
COCO2
/RPK
2
/RPK
(g) (g) Fuel
Fuel
(litres)
(litres)
100RPK
100RPK
4. Future carbon footprints – projections and scenarios
4.1 Introduction
Projections of future system wide aviation carbon footprints can be obtained in a number of ways:
•• aggregation of potential CO2 gains across the system on a measure by measure basis;
•• applying broad performance assumptions (e.g. assume fuel efficiency gains across the system of
2% per year) to generate system wide projections; or
•• extrapolation of past trends.
While examination and aggregation of the CO2 gains for each individual measure on a case by case basis is
likely to be the most informative approach, this is also likely to be the most complex and many of the inputs
are uncertain.
Over time, as computational methods mature, more detailed analytical approaches may emerge. In the
mean time projections based on broad and aggregated trends are likely to be the best predictor of Australia’s
future aviation carbon footprint.
4.2 Establishing and using baselines
The broad intent of baselines is to demonstrate the extent to which identified measures have or will contribute to
overall performance improvements. Applying a baseline comparison is useful when considering the potential
of competing individual measures. For example, in Part 2 of this document, there are examples of the CO2
gains that may be made with the introduction of individual measures, such as new air traffic management
procedures, by comparing fuel consumption against a baseline. However, it can be complex to compute this
potential across an aviation network if progressive implementation leads to increasing constraints (e.g. not
14 The Emirates Group, Environmental Report 2010–2011, p50 (http://www.emirates.com/english/environment/environment.aspx).
aa_climatechange_a.indd 11 29/10/12 12:17 PM• 12 • Managing the Carbon Footprint of Australian Aviation
all aircraft operating into and out of an airport can be offered a fuel optimised route due to aircraft separation
requirements).
ICAO’s Guidance Material states that “The baseline scenario corresponds to the scenario that reasonably
represents the civil aviation CO2 emissions that would occur in the absence of action. This corresponds to the
business as usual or do-nothing additional scenario.”15 Appendix G of ICAO’s Guidance Material describes
an approach to establish a baseline by extrapolating past trend data in order to determine future levels of
fuel consumption and traffic. In order to be consistent with ICAO’s Guidance Material, this approach has
been adopted in Section 4.3 below to describe a baseline scenario for Australia’s future carbon emissions
trajectory. It should be emphasised that the ICAO baseline includes the continuation of existing efficiency
trends.
4.3 Carbon footprint scenarios
Scenario 1: Continuation of current trends
Using trends based on historical data and approximations of future activity levels, the Australian Bureau of
Infrastructure, Transport and Regional Economics (BITRE) has published forecasts of Australia’s aviation
carbon emissions out to financial year 2029–30.16 BITRE’s projections for Australia’s international aviation
carbon emissions are shown by the solid dark blue line in Figure 6. The average CO2 growth rate of BITRE’s
estimates from financial years 1990 to 2030 is 3.2% per annum. The dashed line in Figure 6 shows this
emissions curve extended to 2050 at the same average annual growth rate.
Figure 7 shows the continuation of current trends for Australia’s domestic aviation carbon emissions obtained
by extrapolating BITRE’s estimates from financial years 1990 to 2030 out to 2050 at the same annual average
domestic growth rate of 3.5% per annum as for the first four decades from 1990. Under this projection
scenario, Australia’s domestic carbon emissions would reach 21.8 Mt CO2 in 2050.
15 ICAO Guidance Material for the Development of States’ Action Plans, v4.0, p27.
16 BITRE, Long-term Projections of Australian Transport Emissions: Base Case 2010, Table 2.8, p133
(http://www.climatechange.gov.au/publications/projections/~/media/publications/projections/bitre-transport-modelling-pdf.pdf).
aa_climatechange_a.indd 12 29/10/12 12:17 PMPart 1 National Aviation Carbon Footprint • 13 •
Figure 6: Projections of Australia’s international aviation carbon emissions to 2050
65
BITRE (Published)
60
BITRE (Extrapolation)
55 Frozen' Technology from 2010 + 5% RTK growth per annum
ICAO 2% Fuel Efficiency Target + 5% RTK growth per annum
50
Australia’s international CO2 Emissions (Mt)
45
40 5% growth from 2010
35
30
Continuation of
25 current trends
20
15
10
5
0
1990 1995 2000 2005 2010 2015 2020 2025 2030 2035 2040 2045 2050
Financial Year
Figure 7: Projections of Australia’s domestic aviation carbon emissions to 2050
25
BITRE (Published) BITRE (Extrapolation)
20
Aviation Domestic CO2 Emissions (Mt)
15
10
5
0
1990 1995 2000 2005 2010 2015 2020 2025 2030 2035 2040 2045 2050
Financial Year
aa_climatechange_a.indd 13 29/10/12 12:17 PM• 14 • Managing the Carbon Footprint of Australian Aviation
Scenario 2: Carbon neutral growth
ICAO’s 37th Assembly in October 2010 resolved that “ICAO and its member States with relevant organizations
will work together to strive to achieve a collective medium term global aspirational goal of keeping the global
net carbon emissions from international aviation from 2020 at the same level...”. If Australia were to achieve
carbon neutral growth from 2020, it is estimated that net CO2 emissions from Australia’s international aviation
sector will need to be capped at around 12 Mt per annum as shown in Figure 8. This would require projected
savings of around 17 Mt CO2 in 2050 compared to the current trends case.
4.4 Assessment of the scenarios
Scenario 1: Continuation of current trends
Figure 4 indicates that for around two decades there have been significant gains in fuel efficiency. Australia’s
average network fuel efficiency is greater than global averages. There have been ongoing commercial
imperatives to minimise fuel use over this time period and technological developments have supported this.
However, gains that can be made using existing fuel saving measures may need to be complemented to
ensure greater future improvements in fuel efficiency.
Scenario 2: Carbon neutral growth
Figure 8 shows that in order to cap net CO2 emissions from Australia’s international operations at 2020
levels, around 17 Mt of CO2 would need to be offset in 2050. It should be noted that, if internationally agreed,
this goal would require an offset of only around 3% of emissions in 2021, increasing gradually as demand
growth continued.
If a contribution from biofuels, consistent with the Sustainable Aviation Fuel Road Map Study17, is factored
into the computations and assuming a zero rating for biofuels in terms of net carbon emissions,18 then an
estimated 3.1 Mt of CO2 would need to be offset in 2050 to achieve carbon neutral growth (see Figure 8).
17 Flight Path to Sustainable Aviation, CSIRO, May 2011, Figure 17, p41
(http://www.csiro.au/resources/sustainable-aviation-fuel-report.html).
18 Discussions are currently being carried out in ICAO’s Committee for Environmental Protection (CAEP) on how to account for the
contributions of biofuels in reducing the overall carbon footprint from aviation.
aa_climatechange_a.indd 14 29/10/12 12:17 PMYou can also read