NIMBLE WISDOM SA QUARTERLY - Q3 2019 - Sesfikile Capital
←
→
Page content transcription
If your browser does not render page correctly, please read the page content below
NIMBLE WISDOM
SA QUARTERLY
Q3 2019
2    Sesfikile Capital

    SECTOR PERFORMANCE

    Listed property failed to continue in the same vein as the previous two quarters, ending the third quarter of the year in
    the red, regardless of the fact that global bond yields bottomed out alongside historical lows. SA bond yields, however,
    were nowhere near all-time lows, with the long bond actually weakening around 24bps over the quarter. Local assets
    struggle to break out of the constraints of a stagnant economy, which has the marginal investor questioning the sector
    despite the attractive valuations.

    For the first time this year, the ALPI (-4.2%) squeezed out a better performance than the SAPY (-4.4%), owing in large
    parts to a rebound in Hammerson and Capital & Counties. Despite this, both property indices outperformed equities
    (-4.6%), but trailed bonds (+0.8%) and cash (+1.8%); which largely reflects the risk-off trade playing out globally.

    TABLE 01

    ASSET CLASS TOTAL RETURN TO 30 SEPTEMBER 2019

                                   Jul    Aug      Sep       Q1       Q2      Q3      YTD       1yr     3yr      5yr       10yr

     SA Listed Property Index    -1.2%   -3.6%     0.3%     1.5%    4.5%    -4.4%     1.3%    -2.7%    -3.5%    3.2%       11.2%

     All Property Index          -2.6%    -3.1%    1.5%     1.3%     1.5%   -4.2%    -1.5%    -7.7%   -5.4%      1.1%      9.9%

     Equities                   -2.4%    -2.4%     0.2%    8.0%     3.9%    -4.6%     7.1%     1.9%     5.1%    5.3%       11.5%

     Bonds                      -0.7%     1.0%     0.5%    3.8%     3.7%     0.8%     8.4%    11.5%    8.9%     8.3%       8.8%

     Cash                        0.6%     0.6%     0.5%     1.7%     1.8%    1.8%     5.5%     7.4%    7.4%      7.1%      6.5%

    Source: Bloomberg

    Early in July, the market interpreted comments by the Fed Chair as being accommodative of monetary stimulus.
    The rand and local government bonds rallied at the prospect of lower US rates, while the SARB’s rate cut provided
    further fuel for the rally. However, this was short-lived as Finance Minister, Tito Mboweni, told parliament that Eskom
    would be given a further R59bn bailout (in addition to the R69bn bailout granted five months ago!). The ratings
    agencies responded with Fitch downgrading SA’s sovereign rating outlook to negative, while Moody’s did not change
    its rating but released a report saying it was concerned that the state power utility would require even more capital
    from government. This saw significant rand and bond weakness, as well as a sharp pullback in the ALPI (giving back
    circa 7.5% over the following three weeks and lingered at those levels until around mid-September).

    Approximately 70% of our universe of stocks reported results in the third quarter, the bulk of which was in August and
    the start of September. The general theme was one of acceleration in the deterioration in property fundamentals, which
    has transpired into companies missing forecasts and guiding for lower distribution growth in the coming period. Once
    again, the CEE (Central and Eastern European) exposed stocks bucked the trend and displayed solid fundamentals.

                                                           Nimble Wisdom SA Quarterly Q3 2019 3

August was further defined by the escalations in trade war and concerns around global economic growth, which in
turn pulled global bond yields, including SA, lower.

September got off to a more positive start with Stats SA reporting that GDP growth improved sharply in Q2, to 3.1%
q/q from -3.1% q/q in Q1. The decline in Q1 was principally a function of the intense load-shedding experienced in the
period. The news pushed local bond yields lower, but once again a reversal ensued on concerns around the impact
of the attack on Saudi oilfields on inflation. The air strikes coupled with US/China trade talks stumbling also pushed a
global risk-off sentiment which held the market off its monthly high. A defining factor in September for the ALPI was
the strength in the UK counters. The UK retail stocks continued to falter on the ground but showed a significant bounce
in prices as the market has started to capitulate and switch to value bias. The flow of funds pushed several of the stocks
up in excess of 20% for the month.

CHART 01

ILLUSTRATED MONTH BY MONTH PROPERTY RETURN

                                                 Negative comments by                     Saudi strike and trade
                                                   ratings agencies                            war risk off

                 Fed comments                                           Poor company results
                                                                             on average

                                     Eskom funding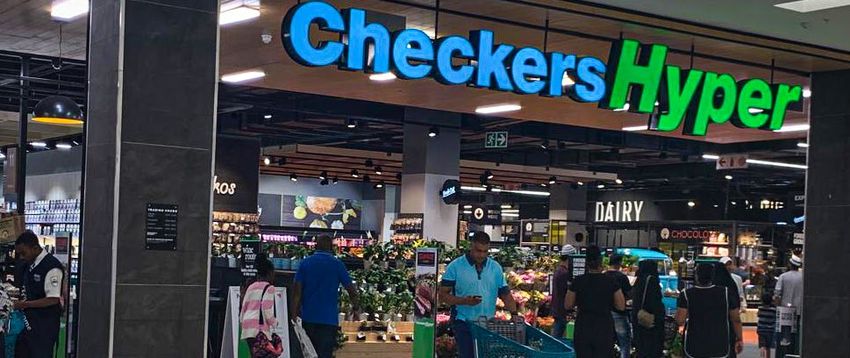
4      Sesfikile Capital

Fourways Mall opened its doors to the
new extension in August 2019

                                                             Nimble Wisdom SA Quarterly Q3 2019 5

STOCK PERFORMANCE

The SA focused stocks fell back out of favour over the quarter as the flurry of results reaffirmed the weak operations
on the ground, coupled with the ongoing ‘clean-out’ of lower quality earnings from the base of several stocks. Safari
was the only SA focused stock in the top 6 performers, and this was only as a result of potential corporate action. The
offshore counters were stronger over the period, admittedly the rand weakened around 8% to the Euro and 4% to the
pound, however the relative stock performance reflected an even great dispersion.           Aside from Intu, the UK stocks
were particularly strong, especially into September, despite not showing similar robustness in fundamentals we saw
across stocks exposed to assets in CEE, Germany and Australia.

CHART 02

Q3:2019 STOCK/SECTOR TOTAL RETURN DISTRIBUTION (%)

Capital and Regional (+46.5%), Sirius (+19.1%) and Safari (+15.4%) were the best performers for the quarter. Capital and
Regional’s performance came through from several sources: initially a bounce off an irrational sell-off the previous
quarter (where they exited several indices), a reasonable set of results in relation to the dire expectations the market
put on UK retail, and lastly the proposed majority position Growthpoint has indicated they would like to take in the
company (although no detail on pricing has been disclosed as yet). Sirius benefitted from the weakening rand mid-
quarter and had another leg up later on as they were included in the FTSE 250 index creating buying pressure on a
relatively illiquid stock. Safari, as mentioned earlier, was the focus of corporate action; firstly, from Fairvest and then at
a materially higher price from Comprop. The balance of the positive performers largely came from the offshore stocks,
however some local counters performed well as the market has started rewarding relative quality and more defensive
balance sheets.
6       Sesfikile Capital

    The worst performers included Delta (-70.0%), Rebosis (-54.0%), Dipula B (-43.8%) and Accelerate (-40.4%). Delta fell
    from already subdued levels post the announced discussions that it is in with Rebosis, believing a transaction can help
    them out of its troubles concentrated around the short lease profile and stretched balance sheet. The market however
    doubted its intentions and ability to turn the company around through corporate action. Rebosis failed to confirm
    any material disposals relative to it initial disclosed intention. The market is of the opinion that the company needs to
    dispose aggressively and at reasonable valuations in order to remain a going concern. Dipula B was on the back foot
    after a somewhat puzzling proposed (and failed) takeout of SA Corporate, but also came under significant pressure
    as a B-share (effectively a highly geared instrument) trading into a weak earnings outlook. Dipula B is also extremely
    illiquid and traded down (normalised) off artificially higher levels.

    •      Hammerson rallied on the back of press reports of third-party capital interest in peer Intu, a rotation from Quality
           into Value, and company specific press speculation of disposals.
    •      Growthpoint announced its intention to acquire a majority stake in Capital & Regional, a UK community
           shopping centre focussed REIT. Growthpoint has until 9th October to make an offer for the company.
           Growthpoint sees Capital & Regional as a platform to grow a UK business, which suggests further
           capital investment into the region. Our primary concern is whether Growthpoint adequately prices the
           risks facing the UK retail sector, in particular those around asset values and potential rental declines.
           We are also of the view that the most valuable asset in the business is the incumbent CEO, and while
           Growthpoint may look to pay a reasonably full price for the equity, the premium would be better spent
           locking in management.
    •      Capital & Counties announced that it will be splitting its business into a REIT (Covent Garden) and its
           London development arm (Earls Court), leading to a potential unlock in value when compared to similar
           businesses like Shaftesbury, (assuming Earl’s Court can trade at a reasonable discount to the more
           recent NAV).
    •      Accelerate Property shed 40% of its market price during the quarter. In addition to falling out of the SAPY,
           Accelerate released a trading statement where it revised its guidance to -10% to -15% with a further 5% potentially
           withheld to fund maintenance expenditure.
    •      Vukile acquired Mdantsane City Shopping Centre from Rebosis for R512m at a forward yield of 9.5%.
           The significance of this transaction is that the initial interest was for three assets totalling R1.8bn. Vukile
           is now less likely to raise fresh equity, while Rebosis must now find another avenue to raise capital it
           desperately needs.
    •      Redefine embarked on a roadshow effectively warning the market that it intends on reducing it
           pay-out ratio to 90% and use the withheld earnings to expense a larger portion of maintenance charges. In
           addition, the long-standing ex-CEO / Executive chairman and doyen of the SA listed property market, Marc
           Wainer, tendered his resignation. While Redefine still has considerable depth and expertise in the incumbent
           management team, it should be noted that Marc’s resignation will be a loss to both Redefine and the sector as a
           whole.

                                                         Nimble Wisdom SA Quarterly Q3 2019 7

•   In August, MAS Real Estate said that it terminated discussions with Prime Kapital without the conclusion of a
    call option to acquire the remaining stake in the investment JV. MAS’ strategy evolved into one where it now
    sought to grow its CEE business by building its own team separate from Prime Kapital, albeit in several years
    once the investment and development JV with Prime Kapital ceased. In the days that followed, MAS’s share price
    fells sharply – we understand that Martin Slabbert expressed his unhappiness with the existing structure and
    lobbied shareholders to put pressure on existing management. On the 5th of September, MAS announced that
    it had acquired the investment JV and that Martin Slabbert was being appointed as CEO. The series of events is
    concerning in that it brings into question the independence of the MAS board.

Corporate inacaction

•   The SA Corporate board rejected offers from both Emira and Dipula and decided rather to reinstate the CEO
    and CFO who had previously resigned amidst a fallout with the board. The board the potential suitors a change
    to conduct a proper due diligence. Conversely the potential acquirors also made high level offers without doing a
    detailed due diligence.
•   Community Property Company (“Comprop”) made an offer of 590c for Safari shares. This was significantly higher
    than Fairvest’s offer, resulting in Fairvest ceasing all interest in Safari. However, despite receiving firm support
    from half the shareholders, the Safari board rejected Comprop’s offer after it received a letter from shareholders
    representing 25% of the company confirming their opposition to the deal. Later, Safari obtained an independent
    fair value estimate of 580c to 667c. Safari’s board continues to engage with Comprop.
•   Delta Property and Rebosis released a joint cautionary announcement in August saying that the two boards were
    in talks around a possible merger of the companies. Delta is down 65% since the announcement while Rebosis has
    lost 45% of its value. While the terms of a possible merger have not been agreed upon, we believe that a merger
    is not in Delta’s interest given Rebosis’ balance sheet and excessive asset values. To add salt to the wound, both
    Delta and Rebosis were removed from the ALPI.

                                                                                   The new Checkers store in Sandton City
                                                                                              opened in September 2019
8    Sesfikile Capital

    PROPERTY MARKET UPDATE

    SOUTH AFRICA
    Retail

    There was a surprising rebound in trading densities as reported by SAPOA in its second quarter report on retail trends.
    Overall trading densities increased by 5.7% y/y in Q2 up from 3.1% y/y in Q1. While impressive on an aggregate level,
    annualised trading density growth has been mainly driven by smaller retail formats. The neighbourhood segment in
    particular has been showing strong growth over the past two quarters (+15.7% in Q2). Close to half of the segment’s
    growth has been driven by the Food category. Super-regional centres reported growth of 3.1%, regional and small
    regional centres were up around 2% and community centres increased sales densities by 4.9%.

    With the above in mind, we note that trading densities reported by REIT’s in the latest results season were, on average,
    about 3%. There remains a clear distinction in performance by rural and non-urban centres, and metropolitan malls
    with the latter being noticably weaker. Attacq’s trading density growth, shown below at 6.8%, was driven by Mall of
    Africa (+13.1%), excluding which growth would have been circa 2%.

    CHART 03

    TRADING DENSITY GROWTH AS RECENTLY REPORTED

    Source: Company release

    Ultimately, despite the surprisingly positive Q2 trading density print, retail remains on the back foot from the legacy
    supply still settling into the market, coupled with the strained consumer. Non-discretionary spend is still somewhat
    defensive, however the bigger format assets, most notably the super-regional malls, are struggling as they have a
    bigger exposure to discretionary spend and quite frankly have too much space in a market with very few new entrants
    and existing formats consolidating. Historically the super regionals were dominant and had the ability to command a

                                                             Nimble Wisdom SA Quarterly Q3 2019 9

premium as they drew in ‘the feet’; they were also able to provide other amenities unavailable to smaller formats as the
cost could be spread over a greater number of tenants.

These are the properties that house the flagship stores across most brands and ultimately also demanded a higher
rental per square meter. In the current environment where tenant depth has depleted, and trading density growth has
fallen far behind inflation. These assets have (at least for the time being) lost some of their shine.

CHART 04

5 BIGGEST MALLS IN SOUTH AFRICA

Source: Company release

Fourways Mall’s new section officially opened its doors in August 2019, although a number of retailers were still not
occupying their stores at the time of our visit. At 178 000sqm, Fourways Mall is the largest shopping centre in the
country. This will later grow into 200 000sqm with the development of home improvement retailer Leroy Merlin.
Aesthetically the mall is eye-catching, with grand ceilings, high shop fronts in some cases and a large centre court. All
the major retailers are represented and are committed to flagship stores. On the downside, the mall is challenging to
navigate, the older section needs a refurbishment in line with the newer section, and parts of the new centre already
looks worn with cracked tiles.

With the completion of Fourways Mall, South Africa’s total retail space is approximately 24.3m sqm, which converts
to about 0.43sqm of retail space per capita. In the chart below, we compare this ratio to global markets and note that,
relative to the level of wealth (GDP per capita), SA is significantly over-retailed.
10     Sesfikile Capital

Fourways Mall opened its doors to the
new extension in August 2019

         CHART 05

         RETAIL SPACE PER CAPITA VS GDP PER CAPITA

         * US, Australia and Canada have been removed, as it distorts the graph

         Source: Cushman & Wakefield, South African Council of Shopping Centres

         Not all retail is created equal
         While we remain mostly negative on retail, we must highlight that it would be very wrong to paint the entire sector
         with the same tainted brush. We still hold overweight positions on Resilient, Vukile and Fairvest which exhibit several
         traits, which create an attractive investment proposition, including : Discretionary bias, dominance, convenience, well-
         maintained assets and strong management.

                                                        Nimble Wisdom SA Quarterly Q3 2019 11

We visited three of Vukile’s centres in Durban in September. We were particularly impressed with Durban Workshop and
Pine Crest, where robust sales growth and strong footfall were being achieved through active asset management and
a recent refurbishment. Durban Phoenix was however struggling due to cannabilisation of sales from new competition
in the broader catchment area. Management have identified projects to improve the centres prospects.

                 DURBAN PHOENIX                                                   PINE CREST

Office

Vacancy rates in the office sector tracked broadly sideways in Q2, with the overall rate standing at 11.3%. Muted
employment growth and a lack of business confidence continues to dampen the sector’s hopes of any recovery. P-
(prime) and A-grade space, which SA REIT’s are primarily exposed to, sit currently at 7.8% and 8.9% respectively. The
level of oversupply in Sandton continued to escalate, with vacancies now at 17.8% (P- and A-grade at 10% and 20%
respectively).

Negative reversions on renewals were not as reflective of the stagnant economy as retail reversions were. Office
has been under strain for several years and has already rebased through slow/no growth rather than significant
reversions. This is not to say that the environment is strong, but rather coming off a lower base. There is still
a fight for tenants, and landlords are offering greater incentives to retain or attract tenants, resulting in the
earnings decline we are seeing rather than through rental declines.
12 Sesfikile Capital
The real estate industry has in recent years embraced WeWork and other flexible workspace providers.
WeWork has 7.7m sq ft of office space in New York City and 4.1m sqm in London making it the largest
private tenant in both cities. In the past five years, it has signed lease agreements for 344 000 sq
metres (3.7m sq ft) of office space in London– more than seven times the floorspace in the Gherkin
tower. It has three sites in South Africa, being one in Rosebank (The Link, Redefine), Sandton (West
Street, Redefine and Cape Town (Strand Street, Emira).
Its lease structures have come under the spotlight given cash flow concerns. On average, WeWork
requests 15-months’ rent free on an eight-year lease, and £100 a sq ft in tenant installation allowances.
The back-loaded nature of WeWork’s rental agreements is one reason why the company is, in the
short-term at least, able to offer customers such attractive deals. However, there is no company
guarantee as each lease was held in an SPV with no support from the group holding company.
The company’s rapid growth plan has halted. Two landlords of large WeWork sites in London already
said they would not sign new leases for the foreseeable future and were making contingency plans for
their existing WeWork offices in the event of a restructuring. However, in the event of a restructuring
that involved WeWork cancelling leases, landlords would bring in other flexible office providers to fill
vacancies or install their own brands. Approximately 40% of all WeWork space is occupied by large
corporates who would continue to need office space.
General
In an environment of stagnant or decreasing asset values and an increased focus on providing sustainable
earnings growth, two issues have emerged.
• Capitalisation of interest – While capitalisation of interest on developments is strictly allowed in terms of
IFRS, the practise increases distributable earnings relative to cash flow. If the asset value is inflated due
to potentially excessive interest capitalised, then subsequent write-down in asset value is taken through
the income statement and not distributable earnings. This was clearly evidenced in Fortress’ recent results
where it incurred a significant write-down in value at Clairwood and revised its policy to only capitalise
interest to the extent that it supports the asset valuation.
• Capitalising maintenance capital expenditure – While some maintenance costs are expensed, the bulk of
the defensive capital expenditure is capitalised to an asset and does not impact distributable earnings.
However, the cost to fund the capital expenditure is funded from debt, and if asset values do not increase,
LTV’s will consistently rise.
Nimble Wisdom SA Quarterly Q3 2019 13
In response to the issue of capitalised maintenance costs, there has been much debate around the introduction
of a pay-out ratio, which is consistent with international practices. Redefine said its recent trading update that it is
considering paying out a minimum of 90% of distributable earnings while Accelerate said that it will retain up to 5% of
distributable earnings for maintenance expenses. This combined with the establishment of the new REIT BPR (Best
Practice Recommendations) may see lower pay-out rates going forward and thus a release in sector distributions.
UK
In September, we travelled to the UK to visit a number of assets owned by Intu, Hammerson, Capital & Regional, RDI and
Capital & Counties. Key highlights of the trip were the visit to the newly extended Intu Watford, Hammerson’s popular
premium outlet mall Bicester Village, RDI’s thriving serviced offices and hotels, and Capital & Regional’s convenience
in-town mall, Ilford. Despite being impressed with the asset quality in general, the UK’s issues are clear:
• CVA’s will continue into 2020 as a no-deal Brexit is likely to see the UK slip into a recession
• E-commerce continues to bite the bargaining power in lease negotiations is firmly with tenants, there is little to
no appetite to acquire retail space
• Companies trying to sell assets will need to cut values aggressively, and
• Banks are attempting to reduce their exposure to retail space.
THE ORACLE, READING, HAMMERSON WOOD GREEN, CAP®
ILFORD, CAP® INTU WATFORD, INTU14 Sesfikile Capital
The news flow from the retail sector continues to offer no support for UK landlords. Next PLC recently said that it
achieved a 30% reduction in rentals in its current reporting period and expects a similar number next year. Clarks has
requested a 30% rental reduction prior to starting a CVA process. Jack Wills has closed 8 stores after requests for zero
rentals were rejected. River Island has asked for a 40% reduction in rentals. CVA’s by Arcadia were approved, while
Monsoon and Accessorize have entered the CVA process. To date, 31 companies have closed representing 1 184 stores
across the UK in 2019. More recently, Forever 21 officially entered business rescue in the US. The three UK stores - in
London, Liverpool and Birmingham - will be placed in the hands of administrators, under the company’s plans.
We took data from the Centre of Retail Research in the UK and noted that while the volume of stores affected by the
retail malaise is material, it isn’t significantly out of line from other weak periods in the business cycle. For closer analysis
we overlapped the affected store date with the average employees per store, which explained the relative pain we are
currently witnessing. The greater ‘employee per store closed’ figure is indicative of the nature of the underlying store.
These are generally bigger more prominent stores, which obviously have a greater impact to the amount of space that
has become unproductive. The biggest contributors to this would have been casualties of House of Fraser, Debenhams
and Arcadia; which highlights the demise of the department store and the pressure on apparel.
CHART 06
DEMISE OF THE DEPARTMENT STORE AND THE PRESSURE ON APPAREL
The environment is obviously still exceptionally negative, however the latter stages of Q3 showed us that there is
‘a price for everything’ in that market, still being one of the strongest economic hubs globally. With a conclusion to
the Brexit saga, relative certainty should be reinstated, even if it is not the outcome the market wants. This certainty
will allow for potential investors to start pricing assets with more confidence and we believe that this should result in
significant investment inflows.
Nimble Wisdom SA Quarterly Q3 2019 15
CEE
Property companies in CEE continue to deliver robust performance with organic rental growth becoming an increasingly
larger driver of performance as opposed to acquisitions and developments. As the majority of our exposure into the
region is in the form of retail, it is encouraging to see that positive economic indicators have translated into favourable
retail trade. In its recent results, NEPI Rockcastle and EPP said like-for-like tenant sales had grown by 8.2% and 6.0%
respectively.
The fundamentals across the region have remained steadfast despite slower global growth, which includes further
concerns around Western Europe’s economic recovery. Nonetheless, further stimulus through lower negative interest
rates and a resumption in quantitative easing by the ECB should boost economic growth for the entire region. Looking
forward, labour costs are still dwarfed by their western counterparts resulting in job migration into the region as a
result of enhanced productivity. This should result in further GDP support as well as upward salary pressure further
supporting our retail thesis in the region. The growth of e-commerce, new generation consumers with entirely new
habits and expectations and the increasing competition will be a test for the retail sector going forward.
CHART 07
REAL RETAIL SALES GROWTH (YEAR-ON-YEAR)
Source: Bloomberg
Recent years has shown CEE retail outperforming lacklustre UK and SA retail, and we expect this to continue in the
foreseable future.16 Sesfikile Capital
ECONOMICS
• GDP growth improved sharply in Q2, to 3.1% q/q from -3.1% q/q in Q1. The decline in Q1 was principally a function
of the intense load-shedding experienced in the period. As a result, the economy avoided falling into a technical
recession in the first half of the year (a recession is defined as two consecutive quarters of negative q/q GDP growth).
• The South African Reserve bank saw it fit to lower the Prime Overdraft Rate in July by 25 basis points to 10% as
inflation continued to be contained. September, however, saw a unanimous decision to keep rates flat (despite
the global trend of lowering) as the currency remained volatile and coupled with a rising fuel price on the back
of the Saudi oil field attacks. Although the shorter end of the yield curve came lower the long bond was slightly
weaker at 8.924% from 8.684% at the start of the quarter.
CHART 08
LONG AND SHORT TERM TREND IN BOND YIELDS
Nimble Wisdom SA Quarterly Q3 2019 17
• South Africa’s current account deficit widened to -4.0% of GDP in Q2, from - -2.9% in Q1 2019. The widening of
the current account deficit was greater than consensus forecasts.
• The Absa Purchasing Managers Index (PMI) declined sharply for a second consecutive month in September, to
easily its lowest point since the global financial recession of 2008/09. The index fell to 41.6 in September, from
45.7 in August and 52.1 in July.
• The PPI inflation rate for final manufactured goods fell for a fourth consecutive month in August, to 4.5%, from
4.9% in July and a recent peak of 6.5% in April. This augurs well for CPI inflation to remain relatively subdued
over the rest of this year.
• The headline CPI inflation rate rose by 0.3% in August, to 4.3%, from 4.0% in July, which had been the lowest
level for inflation since January. Consensus forecasts had been for a slightly lower pace of increase in inflation,
to 4.2. Nonetheless, the 0.3% m-o-m increase in the CPI was very much in line with similar increases in the
previous three months.
• After having declined for two consecutive months, the Reserve Bank’s composite leading business cycle
indicator increased by 0.7% m/m in July, to 103.9 from 103.2 in June.
• Growth in insolvencies rose dramatically once again in July, to 79.7% y/y from 23.4% y/y in June and an average
of 4.2% in Q2 2019. Such an outcome ties in with other real economic indicators indicating that households are
coming under increasing financial pressure.
• Following a temporary improvement in June, the demand for accommodation declined once again in July in line
with the downward trend which has been in place for around two years now. The total tourist accommodation
occupancy rate declined to 45.5% in July 2019, from 46.3% in July 2018.
• Growth in retail sales softened from 2.4% y/y in June, to 2.0% y/y in July. This outcome was slightly below
consensus forecasts of 2.6% y/y.
• South Africa’s ranking in the latest Economic Freedom of the World publication of the Fraser Institute declined
yet again, with the country falling to 101st position for 2017, down from 95th in 2015, 78th in 2010 and a best
ranking of 47th in 2000. It is not so much a case of the country’s economic freedom deteriorating dramatically,
as of other countries improving their economic freedom.
• Year-on-year growth in overall vehicle sales rose significantly, from -5.2% in August, to -0.9% in September.
The most important contributor to vehicle sales was the sharp rise in growth of new passenger vehicle sales.
Although growth in light commercial vehicle sales was weak, falling from 0.6% in August, to -6.2% in February
and a year-to-date growth rate of -1.4%, all the heavier commercial vehicle segments encouragingly posted
some improvement in September.
• President Ramaphosa embarked upon a new initiative in September, inaugurating a new newsletter which he
intends to put out on a weekly basis. Undoubtedly, this innovation is likely to be welcomed since one of the
criticisms of the president in recent times has been that he has been too quiet about implementation of policies
and structural reforms.18 Sesfikile Capital
RECENT RESULTS
Code Counter Latest Applicable DPS growth Applicable Direction of
reported DPS period guidance for period growth
growth the next FY
ALP Atlantic Leaf 2.2% FY19 7.50% FY20
Properties
DLT Delta -43.0% FY19 -9%-13% FY20
Property Fund
FFB Fortress -12.3% FY19 -2%-5% FY20
Income Fund
B-share
RES Resilient -6.0% FY19 5.0% FY20
SAC SA Corporate -6.1% 1H19 -2% to -4% FY19
STP Stenprop Ltd -18.5% FY19 -15.60% FY20
APF Accelerate -12.9% FY19 -10% to -15% FY20
Property Fund
DIA Dipula Income 4.1% 1H19 Lower of CPI FY19
Fund A-share and 5%
EPP EPP 0.0% 1H19 Flat to positive FY19
growth
FFA Fortress 4.5% FY19 Lower of CPI FY20
Income Fund and 5%
A-share
GPA Gemgrow 4.5% 1H19 Lower of CPI FY19
Properties and 5%
A-shares
ILU Indluplace -22.8% 1H19 -20.00% FY19
Properties
IPF Investec 2.7% FY19 3%-5% FY20
Property Fund
L2D Liberty Two 0.0% 1H19 0%-2% FY19
Degrees
RDF Redefine 4.0% 1H19 4.00% FY19
Properties
TEX Texton -20.0% FY19 -20% FY20
Property Fund
Nimble Wisdom SA Quarterly Q3 2019 19
ATT Attacq 10.1% FY19 8.0%-10.0% FY20
Limited
DIB Dipula Income -3.6% 1H19 -14.50% FY19
Fund B-share
EMI Emira 3.1% FY19 Positive FY20
growth
EQU Equites 11.80% FY19 8%-10% FY20
Property Fund
GPB Gemgrow -8.0% 1H19 -10.00% FY19
Properties
B-shares
GRT Growthpoint 4.6% FY19 Growth, if FY20
Properties any, will be
nominal
HYP Hyprop -1.5% FY19 -10% - 13% FY20
Investments
MSP MAS Real 15% FY19 30% over a FY20-FY22
Estate three-year
period
NRP NEPI 9.6% 1H19 6.0% FY19
Rockcastle
OCT Octodec 0.00% 1H19 -2.00% FY19
Investments
REA Rebosis Dividend 1H19 5.00% FY19
Property Fund postponed
A-share20 Sesfikile Capital
REB Rebosis Dividend 1H19 -74% to -76% FY19
Property Fund postponed
B-share
SEA Spear REIT 10.1% FY19 6%-8% FY20
Limited
SSS Stor-age 9.10% FY19 7%-9% FY20
Property REIT
VKE Vukile 7.5% FY19 3%-5% FY20
Property Fund
EXP Exemplar n/a n/a n/a n/a
REITail
HPB Hospitality -6.9% FY19 Not provided FY20
Property Fund
IAP Investec 2.0% FY19 n/a due to FY20
Australia listing
Property Fund
ING Ingenuity 10.0% 1H19 Not provided FY19
Property
Investments
SRE Sirius Real 6.3% FY19 Not provided FY20
Estate
TWR Tower -8.4% FY19 Not provided FY20
Nimble Wisdom SA Quarterly Q3 2019 21
Hammerson • Hammerson’s interim DPS was flat year-on-year at 11.1p.
H1 ‘19
• EPRA Net asset value declined by 7.2% to 685p per share.
• Asset values declined 4.4% during the 6-month period with UK flagship assets falling 9.1%.
Premium outlets performed well with 4.5% growth in capital values.
• Like-for-like growth in net rental income was -0.1% with UK flagships down 6.8%. Ten retailers
undertook a CVA went into administration during the period, affecting 45 units and GBP 8m of
passing rent, resulting in a GBP1.1m reduction in passing rent.
• Occupancy levels at 30 June 2019 were 80bps lower at 96.4%.
• The average lease term was nine years with incentives of just three months, four months less
than in the 2018 financial year.
• The occupational cost ratio decreased slightly from 22.6% to 22.2%, whilst the rent-to-sales ratio
reduced from 13.3% to 12.9%.
• The loan-to-value ratio increased from 38% to 46%. On a proportionate consolidation basis, the
ratio increased from 42% to 46%. Net debt-to-EBITDA increased from 9.5 times to 10.2 times.
• The sale of a 75% share in Italie Deux, which exchanged in July, will see a reduction in headline
loan-to-value ratio to 37%. The company has reached its disposal targets for 2019 and plans to
exit the retail parks business in the near term.
Capital & • Capital & Counties reported an unchanged dividend per share of 0.5p in its interim results.
Counties
• EPRA Net asset value declined by 3.3% to 315p per share.
H1 ‘19
• Total property value decreased by 2.0% on a like-for-like basis driven by a revaluation loss of
GBP 77.9m on Earls Court partially offset by a revaluation gain of GBP12.6mn on Covent Garden.
• The loan-to-value ratio remains conservative despite the increase from 17.9% to 18.8%.
• Capital & Counties intends to launch Covent Garden as a central London focused REIT through
demerger from Capco. Completion of the demerger is subject to shareholder approval and
anticipated before the end of 2019.22 Sesfkile Capital
Sesfikile Capital
Liberty 2 • Liberty 2 Degrees delivered an interim dividend of 29.31c per share, which represents flat growth
Degrees on the comparable period.
H1 ‘19
• The net asset value increased by 1.5% year-on-year to 959c.
• The overall portfolio vacancy rates increased to 4.6% (from 3.4%). Retail vacancies increased
to 2.4% (from 1.2%) as a result of space taken back on standalone Edcon stores and office
vacancies increased to 9.8% (from 8.0%), due to a tenant vacating the CCI building in Umhlanga.
• Rentals reverted down by 13.4%. The Standard Bank lease was renewed -22% lower.
• There was a decrease in the fair value of investment property of R9.1mn relating solely to the
impairment on the office portfolio – no write-down was made to the retail assets.
• The Eastgate municipal rates objection has been resolved resulting in the reduction of operating
costs. Operating costs excluding property rates decreased by 9.5%.
• Net property income growth on a like-for-like basis is still resilient at 6.1% supported by strong
trading density growth within the retail portfolio of 2.9% (driven by the 6.8% trading density
growth in Sandton City).
• The balance sheet is amongst the strongest in the sector. The loan-to-value ratio is 16%.
• Management have indicated that they are still on track for dividend growth of between 0%-2%
for the full year.
Intu • In line with previous communications, Intu has not declared an interim dividend to shareholders.
H1 ‘19
• EPRA Net asset value decreased by 23% to 210p at 30 June 2019. Property valuations decreased
by 9.6% on a like-for-like basis.
• Like for like net rental income was down 7.7% driven by impact of administrations and CVA.
Underlying EPS of 4.9p is down 33% on the comparable period. CVA’s accounted for 4.3% of the
7.7% decline while vacancy accounted for 2.7%.
• Intu’s portfolio occupancy decreased marginally from 96.7% to 95.1%.
• The balance sheet is under significant staring with the loan-to-value ratio increasing from 53%
to 58%, driven by reduced property values (GPB 872.1m revaluation deficit) and capex, partially
offset by part disposal of Derby (GBP 108.7m).
• The company is looking to sell its Spanish assets which is progressing well. The impact on Group
LTV will however be minimal (estimated 200 to 300bps in the loan-to-value ratio).
• Looking into the 2020 financial year, management expect like-for-like net rental income to
be moderately down due to the full year impact of the 2019 CVAs, with the overall run rate
improving against 2019.
EPP’s landmark development in Warsaw
Source: Artist’s impression
Nimble
Nimble Wisdom
Wisdom SA
SA Quarterly
Quarterly Q3
Q1 2019 23
Emira • Emira’s dividend for the year ended 30 June 2019 rose by 3.1% year-on-year to 151.34c.
FY ‘19
• Its net asset value increased by 1.8% to 1 791c at 30 June 2019. The increase was predominantly
due to the bargain purchase gain of R129m recognised on the investment in Transcend as well
as an increase in the value of its investment in Growthpoint Australia.
• Comparable net property income growth was a reasonable 3.1%, with expense growth (+10%)
outstripping top-line revenue growth (+5.7%). As a result, the gross cost-to-income ratio has
risen from 36.8% to 37.6%.
• Emira’s portfolio vacancies rose marginally from 3.4% to 3.6%, due to increased vacancies in the
urban retail and industrial sectors.
• The loan-to-value ratio declined from 37.9% to 36.1% as a result of a portion of the proceeds
realised on the office portfolio disposal being utilised to reduce debt.
• In June 2019, the arbitrator on the Worley Parson’s case found that, because the practical
completion certificate had not been signed by the architect and could never be signed due to
the cancellation of the lease, the rand value of Emira’s rights amounted to zero. Emira has filed
a notice of appeal. Emira has raised an impairment of R41m in respect of the amounts due by
Worley Parsons carried on the balance sheet, together with the associated legal costs to date.
Despite paying out a portion of the expected claim to shareholders in the past, this impairment
has been disregarded for distribution purposes.
• Emira is guiding towards “positive growth” in dividends for the 12 months to 30 June 2020.
NEPI • NEPI Rockcastle increased its dividend by 9.6% to 29.02c, owing largely to the timing of
Rockcastle acquisitions and developments completed in the second half of 2018.
H1 ‘19
• EPRA Net asset value increased by 2.4% over the 6-month period to EUR 726c.
• Tenant sales growth was impressive at +8.2% on a comparable asset level (excluding
hypermarkets).
• Like-for-like growth in net property income was 6.2%, driven by a slightly decrease in vacancy
rates by 20bps to 2.6% and positive lease reversion of 9%.
• The weighted average portfolio yield decreased by 4bps to 6.7%.
• The fund reported a development pipeline of €1.3bn which includes 6 developments under
construction totalling EUR 295m & 7 developments under permitting and pre-leasing totalling
EUR 574m. Further opportunities of EUR 377m make up the remainder of the pipeline.
• The LTV ratio remained relatively flat over the period at 32.5%.
• According to management, like-for-like growth in net property income is expected to be 6% for
the full 12 months to 31 December 2019. Management’s guidance of 6% for 2019 is unchanged.24 Sesfkile Capital
Sesfikile Capital
Resilient • Resilient’s dividend of 531.06c for the year ended 30 June 2019, was 6% lower on the prior year.
FY ‘19 This was in line with guidance provided.
• However, the dividend growth rate is not comparable as a result of the distribution of Fortress
B shares to Resilient shareholders in May 2018. The 2019 increased by 3.3% year-on-year if the
2018 Fortress B dividend is excluded.
• No interest earned from the Siyakha Trust was included in the current year’s distributable
earnings. Instead, Resilient effectively only recognised dividends declared for the same period
in respect of the shares held by the Siyakha Trust.
• The net asset value increased by 7.3% over the six-month period to R69.39.
• Resilient’s retail centres achieved impressive sales growth of 5.0% year-on-year. All but four of
Resilient’s retail centres continued to achieve positive sales growth.
• On average, expiring leases with tenants that remained in occupation were renewed at a 2.2%
increase on expiring rentals. The rentals of new tenant leases were 4.9% higher than the rentals
of outgoing tenants.
• The portfolio vacancy remained stable at 1.8% of GLA.
• JLL valued the SA property portfolio in June 2019. Resilient’s share of the SA portfolio was
revalued upwards by 2.0%.
• The average annualised property yield was 8.0% as at FY19 and 32.5% of the total direct and
indirect property assets were offshore assets.
• Resilient’s balance sheet is robust with the loan-to-value ratio decreasing from 30.1% to 26.8%
on the back of Lighthouse’s (Greenbay’s) return of capital.
• Management expects to increase Resilient’s dividend next year by approximately 5%.
Tower • Tower’s 2019 dividend decreased by 8.4% year-on-year to 74.2c.
FY ‘19
• Net asset value increased by 1.1% to R9.79 per share year-on-year.
• The total vacancy across the portfolio increased 60bps to 5.6% mostly driven by the South
African portfolio (6.6%) while the Croatian portfolio had no vacancy.
• Rental reversions were negative across all sectors with retail at -0.2%, offices at -0.3% and
industrial at -2.8%.
• During the year, Tower established TPF International and Tower International Treasury. Tower
sold its equity and shareholder loans in the Croatian subsidiaries to TPF International. All Tower’s
Euro debt was transferred to Tower International Treasury, who owns 74% of the equity in TPF
International. Oryx Properties Ltd, a Namibian listed property loan stock company, invested
R300mn in TPF International in return for a 26% stake.
• Tower’s loan-to-value ratio decreased from 38.6% to 34.1% (FY19) due to the above transaction.
• At year end, debt is split between South African based Euro denominated (42%), Rand
denominated (31%) and Croatian Euro denominated debt (27%).
• Management expects net property income to grow by 3.5% in South Africa and between 1%
and 2% in Croatia on a comparable asset basis. Some distribution growth is expected as a result.
EPP’s landmark development in Warsaw
Black Friday at Middestad Mall, Fairvest’s 19 840sqm shopping centre
Situated
Source: Artist’s
in the Bloemfontein
impression CBD.
Nimble
Nimble Wisdom
Wisdom SA
SA Quarterly
Quarterly Q3
Q1 2019 25
Attacq • Dividend per share increased by 10.1% year-on-year to 81.5c, exceeding management guidance
FY ‘19 of between 7.5% and 9.5%.
• Attacq’s net asset value decreased by 8.6% year-on-year to 2 216c, mainly due to impairments in
its Rest of Africa retail investment segment and a slight devaluation in the SA portfolio.
• Like-for-like rental growth of 5.0% year-on-year was driven primarily by growth in the retail
portfolio (+5.3%)
• The average growth in trading densities in its retail portfolio was impressive at 6.8% year-on-year.
Mall of Africa’s trading density grew to 13.1%, with an improved rent-to-sales ratio decreasing
50bps to 9.1%.
• The overall vacancy rate was down from 7.7% to 6.2%. The portfolio achieved a positive rental
reversion rate of 0.7% and new leases were signed with a weighted average lease escalation rate
of 5.0%.
• The loan-to-value ratio increased from 33.5% to 37.7%, due to facilities utilised for Waterfall
Corporate Campus, The Ingress and Deloitte head-office developments, lower investment
property values and impairments on the Rest of Africa retail investment. The interest cover ratio
improved from 1.78x to 1.85x but remains higher than sector average.
• For the 2020 financial year, the Board expects dividends to increase by between 8.0% and
10.0%.
Capital & • The decision regarding the level of interim dividend to be declared has been deferred until the
Regional conclusion of discussions with Growthpoint.
H1 ‘19
• EPRA Net asset value declined by 11.8% to 52p, mainly driven by a decrease in property valuations
(-6.8%). The London portfolio saw a 3% decline in valuations, while the South East and Regional
portfolio was down 9.8% and 14.5 respectively.
• The Board has announced that it is in discussions with Growthpoint about acquiring a majority
stake in Capital & Regional through the combination of a partial offer in cash for shares and an
injection of capital to support the Capital & Regional’s strategy through a subscription for new
Capital & Regional shares.
• 44 new lettings and renewals were concluded in the period at a combined average premium of
31.2% to previous passing rent.
• Net rental income declined 3.1% year-on-year as a result of CVAs and retailer restructurings.
• Capital & Regional’s loan-to-value ratio increased to 52%.
• No guidance was provided by management.26 Sesfikile Capital
EPP • EPP’s distributable income rose 9% year-on-year but the dividend remained flat at EUR 5.80c
H1 ‘19 due to the impact of office disposals.
• The net asset value per share decreased by 1.5% EUR 133c as a result of the equity raised during
April 2019 at below EPP’s net asset value.
• Net operating income grew by 9% year-on-year (non-comparable). Vacancies were unchanged
at 0.9%. Sales growth was strong at +6% year-on-year.
• During June 2019, EPP finalised Tranche II of the M1 portfolio. The third and final tranche of the
M1 portfolio will consist of a further four properties to be concluded in June or July 2020.
• Galeria Młociny (85 000sqm development) opened during May 2019 in Warsaw. The centre will
be home to the first Primark store in Poland (opening in the first quarter to 202). It currently has
a c. 3% vacancy.
• In line with its retail-focussed strategy, EPP disposed of a 70% share in three office assets. As a
result, the LTV ratio decreased marginally from 51.9% to 49.8%. Management is targeting an LTV
ratio of 45%. The weighted average cost of debt remained flat at 2.4%.
• Management guidance for flat or better DPS growth for the 2019 financial year remains intact.
Fairvest • For the 12 months ended 30 June 2019, Fairvest increased its dividend per share by 8.1% year-
FY ‘19 on-year to 21.77c. This was at the lower end of management guidance.
• Net asset value increased by 0.7% year-one-year to R2.29.
• The value of the property portfolio increased by 5.8% year-on-year (non-comparable). This
increase is as a result of the Bokleni Plaza acquisition.
• Vacancies increased by 50bps to 4.0% mainly as a result of new vacancies at Richmond
Shopping Centre, Middestad Mall and Omni Place. These were partly offset by the letting of
vacancies at The Palms and Paddagat.
• Fairvest achieved a positive reversion of 0.2%. Tenant retention was 79.8%.
• Debt, as a percentage of asset value, increased by 150bps to 27.9% but remains well below
averages.
• Fairvest has four large long-term leases, with above market rentals, that expire during the next
financial year. The expectation is that the rentals on these four leases will be reduced on renewal
or be re-let to ensure sustainable rentals over the new lease periods.
• The Board expects dividends to increase by between 4% and 6% in 2020.
Nimble Wisdom SA Quarterly Q3 2019 27
Fortress • Dividends for Fortress A-shares rose by 4.32% year-on-year to 73.62c and for Fortress B-shares
FY ‘19 declined by 12.3% year-on-year to 78.01c.
• The combined net asset value was down 3.75% to 3 157c. As a result, the net asset value for
Fortress A-shares rose 21.59% while Fortress B-shares fell by 28.66% year-on-year.
• The portfolio vacancy decreased by 20bps to 7.2% (FY19). Logistics vacancies decreased by
120bps to 4.0%. and retail vacancies retreated by 120bps, also to 4%.
• Net property income growth for the portfolio was 1.4% on a comparable asset level.
• The Siyakha Education Trust disposed of its entire shareholding in Fortress to four BEE entities
owned by YW Investments and Jade Capital. The Siyakha Education Trust was released and
discharged from any liability to pay any amounts in respect of its loans, which were fully impaired
during the financial period under review.
• The company’s loan-to-value ratio increased marginally to 32%.
• Management’s guidance for 2020 distribution growth is c. 1% year-on-year on a combined basis.
This was below previous guidance given the dividend methodology of capitalising interest on
developments at the lower of cost or fair value for distribution purposes.
• This translates into 155.8c for the A-shares and between 148c and 153c for the B-shares.
Growthpoint • Growthpoint’s dividend per share increased by 4.6% year-one-year to 218.1c, in line with
FY ‘19 management’s previous guidance.
• The net asset value per share decreased by 0.7% to 2 539c.
• The revaluation of properties in SA and Growthpoint Properties Australia (GOZ) resulted in an
overall increase of 1.5% in the portfolio value, driven mainly by the positive property fundamentals
in Australia and with a decrease in SA valuations due to the current low-growth environment.
• Net property income increased by 1.3% year-on-year on a like-for-like basis. Overall, SA
vacancies increased by 30bps to 6.8%. Amongst the three sectors, retail vacancies rose the
most, up 60bps to 3.9%.
• SA renewal growth rates deteriorated from -2.8% last year to -5.3% in 2019.
• Growthpoint disposed of properties worth R2.9bn during the period, the largest being the
Investec building which was valued at R2.2bn.
• The decrease in withholding taxes and the additional investment made (via a rights issue
completed during November 2018) had a positive impact on the distribution received from GOZ.
• Growthpoint has a 29.8% stake in Globalworth Real Estate Investments (GWI) through which it is
exposed to Globalworth Poland Real Estate (GPRE), which is wholly owned by GWI. Growthpoint
previously owned shares in GPRE, however, during April 2019, the Group swapped its 21.6%
shareholding in GPRE for shares in GWI.
• Growthpoint Healthcare Property Holdings (GHPH) is currently developing a Head and Neck
Hospital in Pretoria which due for completion in April 2020. Growthpoint generated asset
management fees from its health care business in 2019 and will earn fees on Africa assets in
2020.28 Sesfikile Capital
• Growthpoint also confirmed that it is currently in discussions regarding the potential acquisition of
a majority stake in UK-REIT, Capital & Regional. The acquisition would be through a combination
of a partial offer in cash for Capital & Regional shares and an injection of capital to support the
company’s strategy through a subscription for new Capital & Regional shares. Growthpoint has
until 9 October 2019 to make a firm offer.
• The Group loan-to-value ratio increased by 120bps to 36.4% but reduces to 35.1% post the GOZ
equity raise.
• Growthpoint’s dividend growth, if any, is expected to be “nominal” in its 2020 financial year.
Hyprop • Hyprop’s 2019 financial year dividend declined 1.5% year-on-year to 744.9c. Excluding
FY ‘19 Sub-Saharan Africa (SSA), dividend growth would have been 5.9%. The result was below
management’s guidance.
• The net asset value per share fell 7% to R95.78 due to impairments in the Sub-Saharan Africa
(SSA) portfolio.
• Hyprop’s retail vacancy decreased 80bps to 0.8%. Trading densities increased by a meagre
0.6%, resulting in a 30bps increase in the rent-to-sales ratio to 9.4%. Average monthly footfall
was down across all properties.
• Distributable earnings from Edcon have reduced by 41%, effective from 1 April 2019. Edcon will
retain 50 198sqm with 11,004sqm taken back and the remaining GLA standing at 5 579sqm.
• The SSA portfolio was further impaired, taking the cumulative impairment to R1.5bn.
• The Eastern European portfolio performance was favourable with trading density growth of
3.7% and rental renewals of 2.8%.
• Rental arrears increased by 67% year-on-year to R31.5m.
• The loan-to-value ratio (according to Moody’s calculation) increased by 200bps to 44%. The
interest coverage ratio declined from 4.36x to 3.98x.
• Dividend growth is expected to between negative 10% and 13% for the next financial period.
MAS Real • MAS’ dividend increased by 15% year-on-year from EUR 7.61c to EUR 8.75c.
Estate
• EPRA net asset value per share advanced by 2% year-on-year to EUR 137.6c.
FY ‘19
• Net operating income in the CEE portfolio grew 8.2% year-on-year and the occupancy rate
increased to 95.3%.
• In line with its strategy to recycle capital from its Western European portfolio, MAS sold
Whitbread, an 8 300sqm hotel at a 4.1% yield) and PA4 South Residential, a 62 unit residential
block.
• A building permit has been granted and work is commencing on the 106 300sqm Mall of Moldova
(redevelopment), the largest retail and leisure development in Romania outside of Bucharest.
MAS also acquired Flensburg, a 24 500sqm mall for EUR 62.6m.
• The Group has decreased its exposure to the listed portfolio from EUR 183m to EUR 147m.
• MAS’s debt to assets ratio increased from 10.0% to 33.9% but this level remains relatively
conservative.
Nimble Wisdom SA Quarterly Q3 2019 29
• MAS announced the acquisition of the PK Investment JV platform as well as its 20% effective
interest in the JV. The company is also in the process of appointing Martin Slabbert and Victor
Semionov as the new CEO and COO of MAS, respectively.
• MAS’ guidance of a DPS growth rate target of 30% over the next three-year period (cumulative)
is unchanged.
SA • SA Corporate’s interim dividend decreased by 6.1% year-on-year to 20.83c, predominantly due
Corporate to the lagged effect of significant negative reversions on new leases signed during the second
half of 2018.
• Net asset value dropped 13.38% to 501.4c.
• Comparable net property income growth decreased by 0.8% driven a slight deterioration in
vacancies and downward rental reversions. The retail vacancy rate increased marginally by
30bps to 4.4% and rental reversions were -4.3%. The industrial vacancy rate also improved,
down 40bps to 0.2% and rental reversions improved to 1.7%.
• In the residential portfolio, the residential vacancy rate declined from 13.4% to 5.1%. Together
with rental reversions, like-for-like net property income increased by a respectable 4.1%
• The is some vacancy and reversionary risk associated with 70 000sqm let to Imperial CPG, who
have said that they will be shutting down the business.
• SA Corporate’s balance sheet strength eroded during the period with the loan-to-value
increasing to 36.6%.
• Guidance for the full year is for negative growth of between 2% and 4%.
Texton • Texton’s year-end dividend amounted to 71.37c, down 20% year-on-year.
• Net asset value fell by 7.2% year-on-year to 608c.
• The SA portfolio was devalued by 18.5% on a like-for-like basis as a result of the economic
erosion and the impact of negative rental reversions.
• The UK property portfolio’s value decreased by 2.8% on a like-for-like basis. The industrial and
office assets in the UK remained relatively stable, with downward revisions being concentrated
in the retail sector.
• The loan-to-value ratio increased to 47.7%. The devaluation of the SA portfolio resulted in the
breach, (since rectified of LTV covenants with Standard Bank and Investec.
• Texton’s distribution is forecast to decrease by c. 20% in its next financial period.30 Sesfikile Capital
MARKET OUTLOOK
The market continues to balance the attractive valuations with the weak operating environment. A key positive is
subdued global bond yields, which should spark a global search for yield. While local yields have not shown the same
compression, they are remaining somewhat in check as the local economic indicators are doing little to justify a yield in
the long bond below 10%. Another positive is that as results are reported, we continue to see several stocks re-basing
and guiding a more realistic earnings trajectory. While this seems somewhat counter-intuitive to be getting excited
about lower growth prospects, we believe that distribution growth should begin to bottom out and start to regain
some upward momentum around 18 months out assuming no significant deterioration in the economy. This would
also have a positive impact on ratings. With that said, the market is still bracing for what seems to be an inevitable
Moody’s downgrade to a sub-investment status and the resultant sell-off of bonds as they exit key indices. Even more
prevalent is our President’s ability to implement any reasonable economic reform and in a reasonable time frame. The
local economic data continues to subside, and all eyes remain on Eskom’s sustainability and the burden they (along
with several other key state-owned entities) have on the fiscus.
The UK still awaits a Brexit of any kind; however, we are seeing opportunistic interest in assets that have fallen
significantly and believe that once certainty over the Brexit crystalizes, we are likely to see some stabilization in asset
prices. A negative or hard Brexit would obviously adversely impact stock values, as well as currency, however we
believe that the price of certainty may be underestimated as well as the potential fiscal stimulus that may follow. CEE
continues to defy the current global woes, with robust like-for-like earnings growth, which is further supported by
accommodative monetary policy. We believe that structurally this can persist into the medium term as wage levels are
lagging their western counterparts despite a comparably skilled and educated populous.
We expect high single digit total returns in the short term, which should edge slightly higher into the medium to long
term, however this is very much at the mercy of the economic reforms proposed and implemented. The focus should
be on Eskom, its impact on the budget and ultimately where the long bond yield settles.
Nimble Wisdom SA Quarterly Q3 2019 31
OUR TEAM
Evan Jankelowitz, CFA® Mohamed Kalla, CFA® Kundayi Munzara, CFA®
Portfolio Manager and Analyst Portfolio Manager and Analyst Portfolio Manager and Analyst
BCom (Hons). Investment BCom. Investment Management Bsc. (Hons) Property Studies (UCT),
Management (UJ), Chartered (UP) Chartered Financial Analyst UK FSA, Chartered Financial Analyst
Financial Analyst 13 years experience 12 years experience
14 years experience
Naeen Tilly, CFA® Anil Ramjee
Head of Research Global REIT Analyst
BAcc (WITS), CA(SA), Masters Property Studies (UCT),
Chartered Financial Analyst BEconSci, MCom EconSci (Wits)
11 years experience 7 years experience
Nalika Pema Tinswalo Hlebela Nolwazi Maphalala
Operations Manager Performance Analyst Team PA | Office Manager
BCom. Finance and BSc. Mathematical Dip. Public Relations
Economics (UKZN) Sciences (Wits) Management (TUT)
12 years experience 11 years experience 3 years experienceYou can also read