2021 HUB REPORT Sustainable Coffee Challenge
←
→
Page content transcription
If your browser does not render page correctly, please read the page content below
© Trond Larsen

                                                20 21 H U B R E P O RT

2021
                 2021
                 HUB REPORT
                 Sustainable Coffee Challenge
20 2 1 H UB REP ORT

      In August 2021, when the IPCC released                conserve 10M hectares of forest, and avoid at
      their report sharing a dire message about             least 1.5GT of carbon emissions. To realize this
      the future trajectory of planet Earth, the CEO        potential by 2050, in 2020, we established goals
      of Conservation International responded. We           & incremental targets, and this year, we are final-
      are running out of time. The time is now. “The        izing the metrics to measure our individual and
      time is now” was the theme of the Sustainable         collective progress. Subsequent Hub reports will
      Coffee Challenge’s 2019 annual all-partner con-       track our joint progress as we advance, scale,
      ference. And in 2021, this urgent message has         and improve.
      not changed. Every year, our impact, whether
      positive or negative, becomes compounded.             If coffee as an industry is going to ensure pros-
                                                            perity into 2050, it must commit, now. Now is the
      This 3rd annual Hub Report presents an over-          time to state a new commitment that contributes
      view of sector commitments as we work together        to one of our ambitious goals. We look forward
      to define coffee’s destiny. This year, COVID-19       to seeing you again soon in the Hub, and to
      continued to disrupt the world and the coffee         creating our vision to make coffee the world’s
      sector was not spared, yet we strive forward.         first sustainable agricultural product.
      In 2021, 8 new partners joined the Challenge,
      bringing our partner base to 164. Many new and
      existing stakeholders utilized the Hub in 2021.
      Stakeholders publicly stated 43 new public com-
      mitments to coffee sustainability this year, an       Yours in sustainable coffee,
      87% increase in new commitments compared
      with 2020’s report. Commitments targeting
      improved well-being & prosperity grew by 26%
      alone.

      The coffee sector is shaping the fate of the planet
      with every cent that we invest in the resiliency
      of nature, resiliency of people and the resiliency
      of coffee itself. The Challenge’s ambitious 2050
      goals and 2025 targets are steering us towards
      our collective vision of a sustainable future; if
      the sector can double production on the exist-
      ing 10 million hectares of coffee lands over the      Raina Lang
      next 25 years, we can improve the livelihoods         Senior Director, Sustainable Coffee
      and economic viability of farmers and workers,        Conservation International

                                                                                                                  1
20 21 H U B R E P O RT

             Key Findings

As of July 2021, 99 stakeholders have       33 stakeholders made 43 new commitments
stated 147 sustainability commitments       in 2021. 88% of those stakeholders are
in the Hub, 29% of commitments are          partners in the Challenge, yet 64% of total
new to this year’s analysis.                stakeholders were brand new Hub users.

Most Hub commitments are made               Commitments expanded to 8 additional
by roasters (29% of commitments) or         countries in 2021, impacting 42 countries
retailers (20%), followed closely by non-   worldwide, with the majority of commitments
profits or institutions (19%).              in Latin America, a trend that continues from
                                            previous years.

Commitments targeting improved well-        Most of the 147 commitments are focused
being and prosperity increased 26%          on forest conservation and restoration
compared to the 2020 Hub Report.            (51 commitments), climate change (42),
                                            education and health (41) and sourcing
                                            policies (38).

67 stakeholders have pledged $794M          29 unique stakeholders reported on their
towards achieving 91 commitments            commitments in 2021 for progress made
between 2019-2030.                          during 2020. More than a quarter of
                                            commitments (27%) target 2025 for their
                                            completion.

The year 2020 was the target for 37         Like in the 2020 report, less than half of
commitments in the Hub, and 41% of          commitments (47%) were made in partner-
those commitments were reported             ship with others, but a ‘matchmaking’ forum
on. Only a quarter (10 commitments)         launched by the Challenge in 2021 may fa-
were met, signaling that COVID halted       cilitate new collaborations that address the
sustainability progress for some. The       2025 targets.
Challenge will continue to track progress
against these commitments in 2022 with
hopes that all have been achieved.

                                                                                                    2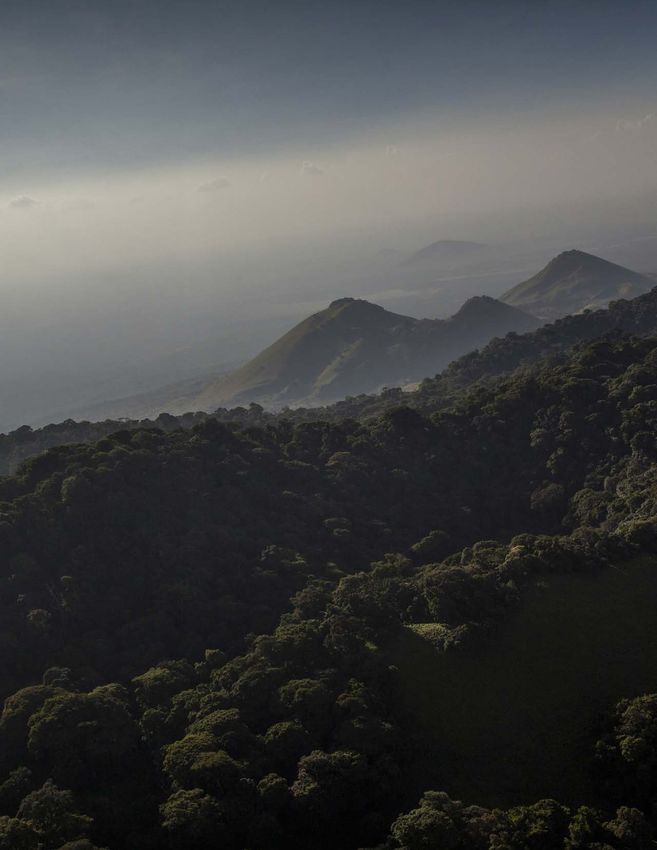
20 2 1 H UB REP ORT

         Table of Contents

                 01   Introduction

                 02   Commitments, Stakeholders, and Our
                      Collective Investment

                 03   What are Stakeholders Committing To?

                 04   Future of Hub Metrics

                 05   Commitments to Inspire

                 06   Commitments as Aligned with the United
                      Nations Sustainable Development Goals

                 07   Moving from Projects to Multi-Stakeholder
                      Collaboration

                 08   Reporting on Commitments

                 09   Conclusion

                 10   Appendix

                                                                  3
20 21 H U B R E P O RT

01              Introduction

The Sustainable Coffee Challenge is a col-           In 2017, reporting opened on the Hub, and in
laborative movement of the private sector,           2019 the first Hub Report was published.
governments, NGOs, research institutions and
others, committed to make coffee the world’s         Whereas the 2019 and 2020 Hub Reports
first sustainable agricultural product. Challenge    covered major trends in sustainability commit-
partners are urgently working together to drive      ments and changes observed year-over-year,
transparency, align around a common vision for       this report moves beyond that standard analysis.
sustainability and collaborate to address some       The 2021 report showcases a novel section on
of the most critical challenges facing the sector.   the future metrics plan for the Hub, and a series
Conceived by Conservation International and          of case studies, “Commitments to Inspire,” which
Starbucks and launched during the 2015 Paris         shed light on how commitments underpin our
climate meetings with 18 founding partners, the      new metrics. As we continue to capture individ-
Challenge aims to stimulate greater demand for       ual commitments in the Hub, but also seek to
coffee sustainability. The movement has since        capture our sector-wide progress against our
grown to 164 international partners.                 2050 goals and interim 2025 targets, the Hub
                                                     will stretch to meet coffee’s data needs.
When did the Commitments Hub form? In
response to the sector’s need for a platform
to house sustainability commitments and to           Please explore this year’s report website by
track overall progress of our industry, in 2016      visiting www.sustaincoffee.org/hub-report.
the Sustainable Coffee Challenge launched the
Commitments Hub. The goal is to enable the
sector to better track commitments, its progress
in achieving them and to better identify opportu-
nities for enhanced collaboration on key issues.

                                                                                            © Charlie Shoemaker
                                                                                                                  4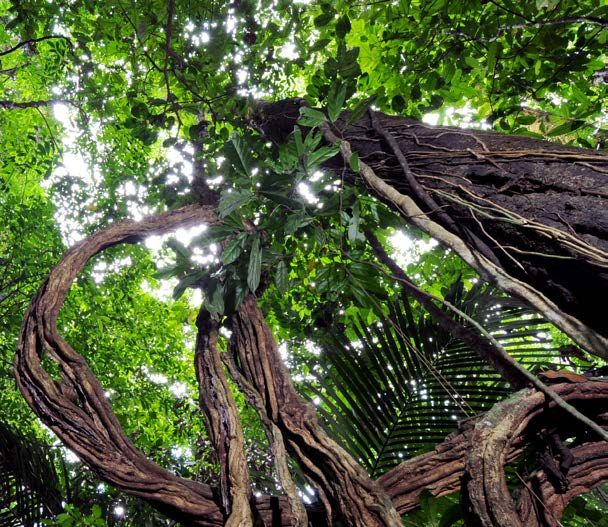
20 2 1 H UB REP ORT

   02                commitments, stakeholders and
                     our collective investment

      2021 marked new Hub engagement, with an                    were retired, and removed from our analysis.
      87% increase in novel commitments stated.                  Of the 99 stakeholders, 87 are partners in the
                                                                 Challenge. Compared to the 2020 Hub Report,
                                                                 the share of Sustainable Coffee Challenge part-
                                                                 ners stating commitments grew from 72 to 87,
                                                                 a 21% increase. There are 43 commitments that
                                                                 are new to this year’s Hub Report analysis, rep-
                                                                 resenting 29% of commitments overall, and an
                                                                 87% increase compared to 2020’s report. More
                                                                 than half of these novel commitments (63%) were
                                                                 made in 2021, 28% of commitments were made
                                                                 in 2020 but added to the Hub in 2021, and the
                                                                 remaining 9% of commitments were made during
                                                                 previous years but had not yet been added to
                                                                 the Hub. New commitments shifted the shares of
          © Conservation International/photo by Ana Lopez        many of the main target areas that commitments
                                                                 focused on when compared to last year’s report.

      The 2021 Hub Report provides insights into com-            Those making commitments via the Hub encom-
      mitments and reports captured by the platform              pass the entire coffee value chain. Retailers and
      as of August 2021. This year’s analysis reviewed           roasters represented most actors and most com-
      147 commitments stated by 99 different stake-              mitments in the Hub, with their commitments
      holders. Commitments set to mature prior to                representing 50% of all commitments. Identical
      the year 2019, from an organization that is no             to last year’s report, five of the top 10 roasters
      longer in business, or with no year identified,            identified in the 2018 Coffee Barometer have

                                                                                          Multi-stakeholder
                       3% Producers/
                            Co-Ops   29% Roasters 19% Institutions
                                                      Nonprofits/
                                                                   3% Initiatives or
                                                                                          Associations

                      14% Traders           12% Other          20% Retailers 2%             Government
                                                                                            Agencies
                        Private sector stakeholders were most likely to enter commitments in the Hub.
                           Note: Stakeholders may multi-select the actor type that they affiliate with.

                                                                                                                      5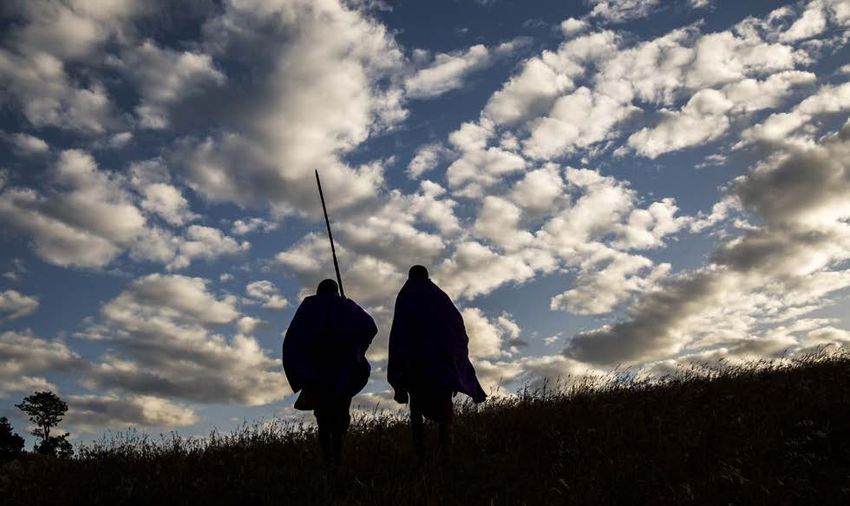
20 21 H U B R E P O RT

                                    Commitments in the   Commitments in the 2021
           Stakeholder Type                                                             Percent Change
                                     2020 Hub Report          Hub Report
 Multi-Stakeholder Initiatives or
                                            1                      5                         400%
 Associations
 Traders                                    6                      20                        233%
 Other                                      10                     18                        80%
 Nonprofits or Institutions                 17                     28                        65%
 Roasters                                  28                      43                        54%
 Retailers                                  21                     30                        43%
 Government Agencies                        3                      3                          0%
 Producers/Co-Ops                           5                      5                          0%

publicly stated commitments in the Hub. Civil              $794M is calculated from stakeholders who
society was responsible for 22% of commit-                 included mention of investment value. 68% of
ments and producer country governments and                 stakeholders provided information on the amount
producer organizations made up another 5%.                 invested to meet their goals (67 stakeholders),
                                                           and 32% of stakeholders (32) did not answer.
It is notable that the number of commitments               Roasters (27% of stakeholders investing capital),
made by multi-stakeholders or associations                 followed by retailers (21%), and then nonprofits
grew by 400% year over year. The number of                 or institutions (19%), made the most investments.
commitments made by traders increased 233%                 Investments targeted improving well-being and
compared to the 2020 report. As with the 2020              prosperity (51% of commitments), resilient supply
report, the Challenge will continue to strive for          (34% of commitments), conserving nature (30%
greater outreach and engagement with govern-               of commitments), and strengthening market
ments and producers to state their commitments             demand (18% of commitments), which mirrors
in the Hub.                                                the order of foci of the Hub’s total commitments.

The sector is investing $794M towards 91 sus-              The commitments support 42 producing coun-
tainability commitments between 2019-2030.                 tries, most in Latin America. Commitments
                                                           increasingly focus on Europe.
To-date, 67 unique stakeholders have committed
to invest $794M towards achieving 91 commit-
ments. $794M spans all the commitments in the
Hub, with newly stated commitments contribut-
ing $30M to the total. $139M is directed towards
specific countries, while the remaining $655M
is earmarked for broad geographies (e.g., South
America) without mentioning a specified country.
$794M represents the total amount that stake-
holders have allocated to fund the life of their
commitments. As stated in the 2020 Hub Report,
                                                                              © Conservation International/photo by Tory Read
this figure does not represent an increase in total
annual investment since the publication of the
Sustainability Catalogue, which estimated a total
annual investment of $350M in sustainability               Commitments with a specific country & regional
programs in 2016. Investment figures are aggre-            scope
gated, and individual figures are not shared in
Hub Reports or on the Challenge website.                   Altogether, the commitments are supporting
                                                           sustainable coffee programs in 42 different
                                                           countries, up from 34 countries in 2020’s report
                                                           (24% increase). 63 of the 147 commitments, or

                                                                                                                           6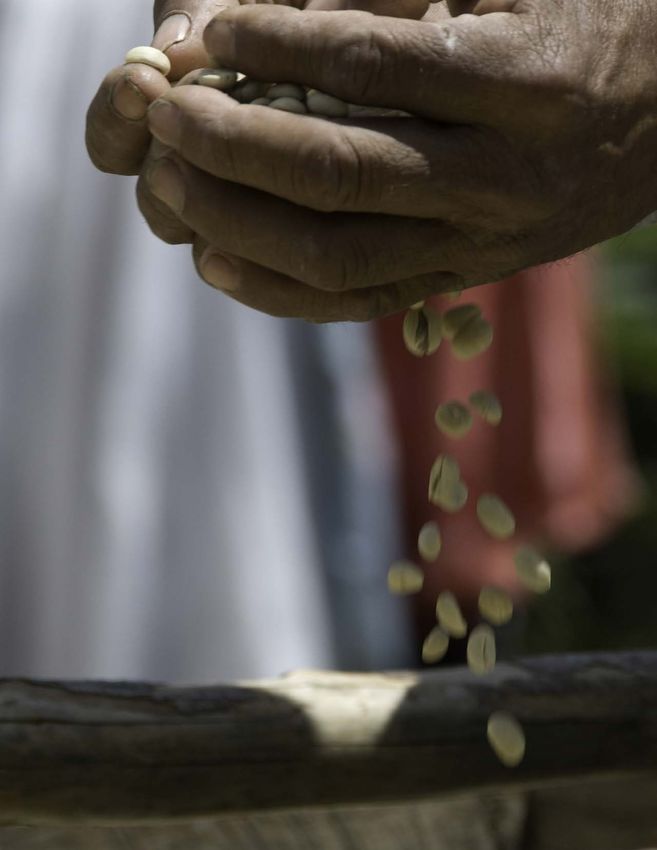
20 2 1 H UB REP ORT

                                                      Commitments by Geography

                     United States: 4                 Guatemala: 15
                                                      Honduras: 20
                                                      Nicaragua: 15
       Number of
       commitments             Mexico: 9                                                                          Vietnam: 4

                                    Colombia: 15
                                                                                             Ethiopia: 5
                                                                                             Uganda: 9
                                           Peru: 14
                                                                Brazil: 10                   Kenya: 4

      The top 12 countries in terms of number of commitments (countries with 4 or more) include: Honduras (20), Colombia (15),
      Guatemala (15), Nicaragua (15), Peru (14), Brazil (10), Mexico (9), Uganda (9), Ethiopia (5), Vietnam (4), Kenya (4), United
      States (4).

      almost 43%, targeted a specific country, and in                        and awareness. Also notable is a 60% increase
      some cases more than one. 56 commitments                               year over year in commitments focusing on South
      were tagged as focusing on global efforts. 36                          America.
      commitments did not select a geography but
      perhaps selected a focal country. When answer-                         Commitments with a global scope
      ing by region, actors stating commitments were
      most likely to target their sustainability programs                    More than a third of the commitments in the Hub
      in Latin America, followed by Africa.                                  (38%) noted a global scope. Global commitments
                                                                             mostly targeted actions related to resilient supply
      As with the 2020 report, stakeholders were least                       (46% of commitments), followed by improved
      likely to note programs in the Europe region.                          livelihoods and wellbeing (38%), strengthened
      However, commitments were also analyzed man-                           market demand (32%) and conserving nature
      ually by countries listed (and not just the disclosed                  (20%). In terms of intervention pathways, 43% of
      regions). Analysis revealed that this year’s report                    global commitments committed to sustainable
      included more commitments targeting European                           sourcing, with 34% specifically to standards/cer-
      countries. The 2020 analysis featured 2 commit-                        tifications. Another 34% of global commitments
      ments listing countries in the continent, but this                     tagged forest conservation and restoration, and
      year, countries in Europe were tagged by 6 com-                        29% focused on climate change, and another
      mitments. This means there was a 200% increase                         29% on education and health. The remainder of
      in commitments focused on Europe between the                           the intervention pathways were targeted by 25%
      2020 and 2021 reports. These commitments in                            or less of the 56 global commitments.
      Europe tended to target climate change, with
      project efforts including renewable energy, sus-
      tainable packaging, and consumer education

                                                                                                                                     7
20 21 H U B R E P O RT

                                  Commitments in the 2020          Commitments in the 2021
          Geography                                                                                       Percent Change
                                       Hub Report                       Hub Report
 Europe                                         2                                6                              200%
 South America                                 15                               24                              60%
 Global                                        38                               56                              47%
 Africa                                        13                               19                              46%
 Central America                               24                               31                              29%
 Asia                                           7                                8                               14%
 North America                                 12                               13                               8%

In terms of the top countries in terms of number of commitments versus the top countries in terms
of amount of funding invested1, just as in the 2020 Hub Report, Colombia had the highest dollar
value of investments ($30M), followed by Peru ($26M), and Mozambique ($25M). The remaining
two countries in the top five countries with the highest dollar investments via their commitments
included Mexico ($11M) and Guatemala ($9M). As aforementioned, more than a third of commit-
ments noted a global scope and therefore did not identify countries for investment, meaning that
this analysis does not provide an accurate representation of the sector’s total commitment to coffee
sustainability in any given origin. Additional countries receiving between $3 and $5M investment
include, Honduras ($5M), El Salvador ($5M), Uganda ($5M), Indonesia ($4M), Papua New Guinea
($3M), Vietnam ($3M), Ethiopia ($3M), and Kenya ($3M). Though commitments in Europe increased
by 200% year over year, the level of investment declared through commitments targeting European
countries amounted to less than $2,000 USD.

One quarter of the commitments set to mature in 2020 were reported as completed, perhaps due
                                                                                                            2             1
to disruption from COVID-19. The year 2025 is the next most popular year that commitments target
(27% of commitments in the Hub).

                                             Commitments by Target Date

Commitments reach maturity in different years. Six commitments in the Hub are on-going commit-
ments. 37 commitments (25%) were scheduled to mature in 2020, of which 10 of those commitments
(27%) were met. Given the COVID-19 pandemic, we expect that many of these commitments will
continue. The Challenge will encourage those stakeholders with commitments involving the 2020
deadline to report progress made against these commitments in 2022, with the hopes that all will
have been achieved.

2025 signifies the deadline for 27% of commitments. As with the 2020 Hub Report, we expect the
number of commitments targeting 2025 to increase over time as the sector sets new targets post-
2020 and uses the Hub as the central space to document the 2050 goals and 2025 targets and
their associated metrics that were agreed upon this past year.

1 To assess country funding, the total funding per commitment was divided equally by the number of countries selected by each actor.

                                                                                                                                         8
20 2 1 H UB REP ORT

  03                    What are stakeholders
                        committing to?
      43% of commitments focus on well-being and                         targeted strengthen market demand, at 24%2.
      prosperity.                                                        Negative percent change can be attributed to
                                                                         the retirement of 2019 and earlier commitments
        Commitments by Focus Area/Compass Point                          that reduced the total pool of commitments in
                                                                         the various focal areas.

                                                                          Sustainable
                                                                            Coffee       Commitments       Commitments
                                                                                                                             Percent
                                                                           Challenge      in the 2020       in the 2021
                                                                                                                             Change
                                                                           Compass        Hub Report        Hub Report
                                                                             Point
                                                                         Improve
                                                                         Well-Being            50                63            26%
                                                                         & Prosperity
                                                                         Resilient
                                                                                               63                59            -6%
                                                                         Supply
                                                                         Conserve
                                                                                                47               43            -9%
                                                                         Nature
                                                                         Strengthen
                                                                         Market                42                35            -17%
                                                                         Demand

                                                                          Commitments tagging improve wellbeing and prosperity
                                                                          increased by 26% between 2020 and 2021 Hub Reports

      The Challenge’s Sustainability Framework has                       New commitments: 84% of the commitments
      at its core a guiding compass that drives action                   new to this year’s analysis selected one compass
      in four impact areas: people, planet, coffee, and                  point, and 16% selected two. The most tagged
      markets. Most commitments in the 2021 Hub                          compass points for the 43 new commitments
      Report (71%) contributed to one impact area,                       were improve well-being and prosperity (44%
      with 24% of commitments contributing to two,                       of commitments new to this year’s report), con-
      and 2% contributing to three and four impact                       serve nature (35%), resilient supply (23%) and
      areas, respectively. Close to half of commit-                      strengthen market demand (14%).
      ments (43%) focus on improve wellbeing and
      prosperity, which is a 26% increase compared                       Most commitments focus on forest conserva-
      to the 2020 Hub Report. Perhaps this is due                        tion and restoration, climate change, education
      to an increased focus on social metrics amid                       and health, and sourcing policies.
      COVID-19. Resilient supply represented 40% of
      commitments, which is a change from last year’s                    Fortifying the four compass areas of the
      report, where more than half of commitments                        Sustainability Framework are 15 different inter-
      (59%) focused on that impact area. Commitments                     vention pathways that stakeholders invest in to
      were more evenly focused across the remaining                      tackle threats to the coffee value chain. In most
      two compass points, although the lowest focus                      cases, commitments encompassed multiple

      2 Note that the four percentages within the Sustainability Framework do not add up to 100 because the commitments ladder up to
      multiple impact areas.

                                                                                                                                       9
20 21 H U B R E P O RT
interventions. Analysis for this report revealed that most of the commitments in the Hub focused
on four: forest conservation and restoration (35% of commitments), climate change (29% of commit-
ments), education and healthy (28% of commitments), and sourcing policies (26% of commitments).
As identical to last year’s report, interestingly, results show that few stakeholders stated commitments
that focused on helping farmers access inputs and finance.
Commitments by Intervention Pathway
Most commitments focused on forest conservation and restoration, climate change,
education and health, and sourcing policies. Government policies for consuming and
producing countries had the least, the same as in the 2019 and 2020 Commitments
Hub Reports. Note that the percentages here do not total 100; many commitments
The 2019 and 2020 Commitments
selected Hub Reports took a deep dive into metrics by compass
more than one intervention. point
Sustainable Coffee
Commitments in the 2020 Commitments in the 2021
Challenge Intervention Percent Change
Hub Report Hub Report
Pathways
Producer Country Policy 3 6 100%
Forest Conservation and
32 51 59%
Restoration
Access to Finance 9 13 44%
Access to Inputs 7 10 43%
Consumer Country Policy 5 7 40%
Gender, Youth &
19 26 37%
Indigenous Peoples
1020 2 1 H UB REP ORT
Education & Health 30 41 37%
Water Conservation 18 24 33%
Renovation 16 21 31%
Sourcing Policies 29 38 31%
Climate Change 33 42 27%
Standards/Certification 27 34 26%
Consumer Education &
22 27 23%
Awareness
Labor Conditions 26 31 19%
Technical Assistance 33 12 -64%
The biggest percent changes between last year’s report and 2021 include a doubling in commitments focusing on producer
country policy, a 59% increase in commitments focused on forest conservation and restoration, and a 64% decrease in
commitments tagging technical assistance.
New commitments: Almost a quarter (21% of commitments) selected one intervention pathway
associated with their commitment, 21% selected two pathways, 16% selected four pathways, 14%
selected three pathways, and the remainder of commitments tagged either zero or up to nine. The
most tagged pathways for commitments new to the analysis were forest conservation and resto-
ration (49% of commitments), climate change (37%), education and health (30%), labor conditions
(30%) and gender, youth and indigenous peoples (26%). The Challenge will watch this climate and
livelihoods trend closely in future reports.
© Charlie Shoemaker
1120 21 H U B R E P O RT
04 future of hub metrics
The 2019 and 2020 Commitments Hub Reports The Challenge’s 2025 targets are as follows :
took a deep dive into metrics by compass point
and pathway to identify natural commonalities.
Taking a bottom-up approach, we looked at each
compass point, determining the frequency of PEOPLE/IMPROVE WELL-BEING AND
overlap of metrics that were self-selected by part- PROSPERITY: Fully protect the rights
ners who had stated commitments. The metrics and well-being of coffee workers and
analysis process from those two reports helped establish living income/wage bench-
to inform the Challenge’s larger journey towards marks in at least 80% of ICO member
‘our collective commitment’. One observation producing countries and initiate pub-
lic-private interventions to close and
was that there was little natural alignment across
surpass living income/wage gaps.3
reporting metrics, and as part of the process to
set common goals and targets, Challenge part-
ners also encouraged the Sustainable Coffee
Challenge leadership to think about common
ways to report progress. PLANET/CONSERVE NATURE:
Restore 1.5M hectares of tree cover +
As you likely read in our 2020 report, after an conserve 500,000 hectares of forest
almost year-long iterative process, in December and secure 100 million tonnes of
2020, partners in the Sustainable Coffee carbon.
Challenge rallied around sector wide 2050 goals
and interim 2025 targets to unlock unprece-
dented commitments and actions – individual
and collective – towards a joint vision.
COFFEE/RESILIENT SUPPLY: Increase
smallholder production by 11.9 million
Once we had collectively established clear goals bags, through renovation, rehabilitation,
and targets, the Challenge turned its focus on and technical investments on existing
how to track individual efforts in a manner that areas, to adequately meet long-term
could be communicated against collective demand from a diversity of origins.
targets. In the latter half of 2020 and the first half
of 2021, members of the Challenge’s Collective
Action Networks agreed upon core and proxy
metrics to measure progress made against the
MARKETS/STRENGTHEN MARKET
2025 targets. This process included consultation
DEMAND: Ensure at least 50% of
and feedback via the Networks, plus 1-1 calls global coffee purchased by roasters
with stakeholders. The Challenge also held two and retailers is sourced according to
all-partner webinars to share the draft metrics sustainable practices.
in June.
3 In support of alignment with the ambitious goals of the ICO's Coffee Public Private Task Force
© Charlie Shoemaker
1220 2 1 H UB REP ORT
The Challenge distinguishes three types of metrics to track progress – core, proxy and additional:
• Core metrics: Key metrics that help us quantify and aggregate progress against 2025 targets
• Proxy metrics4 : Alternative options in case partners don’t have access to data for core metrics
• Additional metrics: Options that provide broader narrative and help to indicate trends and innovation.
Metrics to Track Progress Towards the 2050 Goals
CORE PROXY ADDITIONAL
• Names of countries and/ • # of coffee farm workers
or regions in which SCC impacted from investments at
members participate in the the farm level
development of new living • # of coffee farm workers who
income/living wage studies are provided training on topics
• # SCC commitments that related to worker right and
support new and verifiable wellbeing
steps to close the gap on • # of farmers or farm workers
• # of trees (i.e., non-coffee) dis-
living income and living wage who benefit directly from
tributed to increase tree cover
• $ funding facilitated toward efforts to close the gap on
on farms (proxy for hectares
programs, projects, or living wage / income
restored)
facilities— beyond certifica- • Participation in PPPs to close
• # Voluntary Carbon Units
tions— at the farm level income gaps
(VCUs) purchased from certi-
fied carbon credit programs
• # of hectares restored
• # of hectares of forest area
conserved • # of new commitments focus-
• tCO2 removed (i.e., ing on biodiversity
sequestration) • # of new commitments focus-
• tCO2 emissions avoided ing on freshwater (quality +
• tCO2e emissions reduced on • # of hectares with improved quantity)
farm management
• # of trees distributed or
sold
• # of people trained
• $ funding facilitated
• Total additional production
in metric tons Green Bean
Equivalent (MT GBE) • # of new commitments
• Names of countries where made to sustainable
technical and/or financial sourcing
support was provided • # of new commitments
focused on increasing %
of total value across the
supply chain returned to
origin
• # of new commitments
focused on the increase of
• # of metric tons (MT) of volume of coffee or % of a
Green Bean Equivalent company’s supply chains
(GBE) coffee sourced via fully traceable to farm
recognized voluntary sus-
tainability standards (VSS)
4 Proxy metrics only apply to the resilent supply and conserve nature categories
1320 21 H U B R E P O RT
As stated in the 2020 Hub Report, the home for reporting against these new metrics will be the
Commitments Hub. The Challenge team is working to add these new metrics to the platform in the
coming months, with the goal to have the metrics capture fully operational before the 2022 Hub
reporting deadlines. This will ensure that all partners with relevant commitments will be able to report
on these metrics next year, which will be aggregated into target trackers on the Challenge’s online
dashboards, and on an annual basis, progress will be presented in these Hub reports.
05 Commitments to inspire
Case Studies Use these case studies as inspiration for your
organization’s contribution to collective action by
New to the Hub Report this year: Commitments reading about the “why” behind other organiza-
to Inspire case studies. Here, and again starting tions’ commitments, the business cases for their
on page 40 (Appendix C - Case Studies), you commitments, and valuable lessons others have
will find short case studies that tell the stories to share from their experiences implementing
behind the data in this report. The aim of these their commitments.
case studies is three-pronged:
For future commitments, we offer the following
I. To give space to highlight impactful commit- guidance:
ments that have been reported against
II. To give examples of commitments that have Commitments generally take the form of invest-
been stated following SMART principles. ments and actions taken to achieve specific
Meaning, they are specific, measurable, targets or outcomes. Within the Sustainable
attainable, relevant, and time-bound, helping Coffee Challenge, partners have agreed that the
them to be more effectively carried out and following principles should guide commitments:
accurately tracked
III. To demonstrate how existing commitments • New or active commitment: Every commit-
may be mapped to the aforementioned ment that is stated via the Sustainable Coffee
2025 sector targets and metrics to track our Challenge Commitments Hub should be either
collective progress more effectively a new commitment or an existing commitment
that has yet to be achieved.
It is important to note that the following case
studies do not represent all the Challenge com- • Incorporates SMART objectives: Commitments
mitments that meet the above criteria. We will should be specific in what they set out to
continue to highlight other Commitments to achieve, incorporate measurable targets, be
Inspire throughout the year in our newsletters ambitious in nature, relevant for the industry,
and in the 2022 Hub Report. Please also keep organization or supply chain being targeted,
in mind that while we have mapped the case and time bound.
study commitments to the new sector targets • Aims for impact: Commitments should con-
and metrics with the featured partners’ permis- sider contribution to one or more of the
sion, they were not originally stated with these new 2025 sector targets and make use of
targets and metrics in mind. In some cases, there
the common metrics. However, if you have a
may not be a perfect match in language, but we
hope these case studies demonstrate how the commitment that lies outside of the collective
coffee sector can continue to pursue a common targets, we still want to hear about it!
language to generate comparable data, giving • Can be reported at set intervals: Organizations
us a better understanding of progress, what still should enter commitments that can be reported
needs to be done, and where investment can on in the system on an annual or semi-annual
drive the greatest impact. basis with 1st, 2nd or 3rd party data.
1420 2 1 H UB REP ORT
Strengthen Market Demand
Commitments to Inspire—Markets case study
2025 Challenge Target: Ensure at least 50% of global coffee purchased by roasters and retailers
is sourced according to sustainable practices.
2025 Challenge Metrics: # of metric tons (MT) of green coffee sourced via recognized voluntary
sustainability standards (VSS)
Keurig Dr Pepper
Commitment: Responsibly source 100% of our coffee.
What challenge is Keurig Dr Pepper attempting to address through this commitment?
At Keurig Dr Pepper (KDP), responsibly sourced means that we work with our supply chain to
address some of the coffee industry’s most pressing challenges. Not only are we ensuring that
fundamental human rights and environmental protections are in place across the entirety of KDP’s
coffee purchases, but we are also providing assurance to KDP’s customers and consumers for
traceability and transparency.
By the end of 2020, we achieved 100% responsible sourcing by purchasing inputs that were certi-
fied or verified by third-party sustainable sourcing programs, aligned with KDP’s Supplier Code of
Conduct. We continue to maintain this commitment with an expanded group of partner programs,
including Fairtrade International, Fair Trade USA, Rainforest Alliance, 4C, OLAM AtSource Entry
Verified and Great Lakes Coffee MaxTRACE, and continue to work with each program to improve
impact measures and reporting.
KDP’s 100% responsibly sourced commitment sits within a broader strategy to achieve positive
impact in our supply chain. We advance this goal through additional and complementary tools
such as impact investments and industry collaborations. Importantly, KDP continues to identify and
to drive deeper progress on specific issues that we are uniquely suited to address, (e.g. farmer
livelihoods, climate resiliency and regenerative agriculture).
What does this commitment mean for Keurig Dr Pepper as a business?
This commitment means that we use our buying power for good – pursuing responsible sourcing
across our global supply, whether those purchases are for our owned brands or for our partner or
private label customer brands. Building internal and external partnerships is critical to successfully
delivering the 100% commitment.
One key internal partnership is between our Coffee Procurement and Sustainable Supply Chain
teams to ensure that our strategy balances the flexibility, availability, and quality required to keep
1520 21 H U B R E P O RT
KDP’s supply chain moving with the credibility, transparency and robustness needed within each
responsible sourcing partner program.
KDP also partners directly with our approved certification and verification programs, like Fairtrade
International, Fair Trade USA, Rainforest Alliance, 4C, OLAM AtSource Entry Verified and Great
Lakes Coffee MaxTRACE, to ensure continuous program improvements that provide more value
to the coffee farmers and coffee buyers. For example, we are currently working with each of our
partner programs to improve the data they gather on the economic profitability for growers.
We also look beyond KDP and are working with the industry to align on and advance a unified
definition of responsibly or sustainably sourced coffee. By partnering with the Sustainable Coffee
Challenge and the Global Coffee Platform, we are supporting harmonization and alignment on the
definition because competing definitions and metrics can result in duplication and loss of efficiency.
What insights does Keurig Dr. Pepper have for others who may want to state a similar
commitment?
Unsurprisingly, there is no silver bullet to solving the complex challenges facing the coffee industry.
A variety of solutions will be required as well as participation from all value chain players.
KDP considers its responsible sourcing commitment as one tool in the toolbox. To be effective, it
has required serious effort and resources, as well as an understanding across the business that
responsible sourcing can provide shared value for everyone in the supply chain.
A few recommendations:
• View third-party sustainable sourcing programs as key partners on a journey, with a focus on
continuous improvement for both impact and data;
• Enlist the company’s brands to better connect the consumer to the farmer through storytelling;
• Drive for alignment of definitions and metrics across the industry to add efficiency and scale to
the effort.
It is also important to seek out complementary tools that can result in different types of impact.
For example, alongside maintaining our commitment to 100% responsibly sourced coffee, KDP
recently achieved a 2020 target to significantly improve the lives of 1 million people in our supply
chain through social impact investments made in partnership with implementers such as NGO’s and
suppliers. These investments, plus our purchasing practices, have had significant impact together.
So much so, that we are now launching an innovative three-year pilot program designed to signifi-
cantly improve smallholder coffee farmer income, testing variables such as volume commitments,
preferred pricing and targeted social impact investments.
Strengthen Market Demand
1620 2 1 H UB REP ORT
Conserve Nature
Commitments to Inspire—planet case study
2025 Challenge Target: Restore 1.5M hectares of tree cover + conserve 500,000 hectares of
forest and secure 100 million tonnes of carbon.
2025 Challenge Metrics: # of hectares of forest area conserved
Mesoamerican Development Institute
Commitment: Conserve and/or restore 170 hectares of forest habitat working with
producer farms.
What challenge is the Mesoamerican Development Institute attempting to address through
this commitment?
Expansion of coffee production is replacing high-elevation forest, which serves as the headwaters
for watersheds that provide water for the coffee communities and the towns and cities downstream.
The challenge for us is to create value in forest habitat for farmers sufficient to motivate them to
set aside an area forest habitat (existing and/or regenerating). There is a growing market value
for the carbon sequestered in this forest area. With sufficient training and support, local youth can
measure and map coffee farms and estimate the amount of carbon sequestered in these forest
buffers habitat. Another challenge is to create sufficient market demand for carbon offsets from
coffee farms to warrant investment in the creation of local accredited companies to validate and
verify carbon on farms.
What does this commitment mean for the Mesoamerican Development
Institute?
This commitment and the associated sale of carbon offsets validates the potential
for long-term conservation of forest habitat on private lands (coffee farms). The
commitment underscores the need to scale up our Integrated Open Canopy™
agroecosystem model linked to carbon-neutral coffee processing for high-qual-
ity carbon offsets. For our institute that means transitioning to verified carbon
and introducing efficiencies for monitoring and measuring farms at a landscape
© Mesoamerican
scale. For our market partners, this means attracting more investment to scale
Development Institute carbon-neutral processing capacity.
What insights does the Mesoamerican Development Institute have for others who may want
to state a similar commitment?
There are still many barriers to carbon-neutral production. While funds exist to support renewables,
banks in the coffee growing regions do not have much experience funding innovation. Also, funds
specifically for this purpose, such as the Green Climate Fund, available for private investment
projects are sometimes blocked by the host country without explanation.
1720 21 H U B R E P O RT
Improve Well-Being & Prosperity
Commitments to Inspire—people case study
2025 Challenge Target: Establish living income /living wage benchmarks in 80% of ICO member
producing countries; contribute to public and private and other partnerships to close living
income and living wage gaps; and fully protect the rights and well-being of coffee farmer
households and coffee farm workers.
2025 Challenge Metrics: # SCC commitments that support new and verifiable steps to close
the gap on living income and living wage # of coffee farm workers impacted from investments
at the farm level.
Mountain Harvest
Commitment: We strive for the best sustainable practices and an ever-growing
impact on the local producers and communities. We are endeavouring to be the
showcase example in the development and future growth of Ugandan high-al-
titude coffee. Mountain Harvest commits to provide farmers it sources coffee
from with superior terms of trade with respect to price, liquidity and transparency
and to steadily build trusting and productive relationships with both farmers and
roasters.
a. Ensure that by 2021 100% of the farmers supplying Mountain Harvest are organic certified
b. Ensure that by 2022 80% of the farmers working with Mountain Harvest practice good
agricultural practices including application of organic fertilizers in their coffee farms
c. Ensure that by 2023 80% of the farmers working with Mountain Harvest have diversified
income to meet the cost of a decent standard of living.
What challenge is Mountain Harvest attempting to address through this commitment?
Mountain Harvest conducted cost of a decent standard of living (CDSL) gap analysis in 20191 and
established that coffee farm gate prices had to double for farmers to afford a CDSL. Although
Ugandan farmers receive a high share of coffee export prices2 (60%), it is a high share of low
export prices because Uganda is overlooked by both consumers due to being a relatively
under-appreciated origin in the specialty market3.
The key barrier to achieving a CDSL is poor quality coffee with most of the coffee being
farm-processed, where quality control is weak and inconsistent.
Another critical issue is yield shocks resulting from adverse weather, poor crop management and
the burdens of pests and disease which have substantial impact on the incomes of smallholder
1 https://www.idhsustainabletrade.com/publication/sdm-case-study-mountain-harvest-uganda/
2 Hill, R. V. (2010). Liberalisation and Producer Price Risk: Examining Subjective Expectations in the Ugandan Coffee Market.
3 IBID
1820 2 1 H UB REP ORT
farmers4 and this gets worse for women farmers because of gender dynamics in access to
finance, inputs and advanced techniques.
Although there are opportunities for alternative income from other crops/animal products that
have ready markets, farmers are not commercializing these products because of low volumes
and poor-quality products.
What does this commitment mean for Mountain Harvest as a business?
Mountain Harvest’s service delivery model focuses on improving the quality of life for
smallholder farmers and supporting healthy and thriving natural ecosystems. The business
emphasizes the need to boost productivity and improve profitability at the farm level and at
the enterprise level by delivering both business and environmental oriented services to the
farmers.
The environmental services emphasize organic farming and focus on soil regeneration and
enrichment, and biodiversity to keep agricultural assets at their full productive potential. The
business services involve three major interventions: (a) elevating the quality of smallholder
grown coffee into the specialty coffee market, (b) disconnecting pricing from commodity
markets through relationship-based trade with specialty roaster-retailers who pay higher
prices for quality, and (c) using additional margin generated from higher prices to pay higher
farm gate prices and invest at the farm level through the delivery of blended services.
Our theory of change works on the premise that a combination of higher farm gate prices and
blended services increases the farming households’ chances to afford a living income, and
this gives them the necessary resources to further invest in the improvement of their coffee
volumes and quality.
What insights does Mountain Harvest have for others who may want to state a similar
commitment?
Whereas doubling household revenues is a very ambitious goal,
achieving it does not only build local economies and their capac-
ity to serve farming households, but it also feeds directly into
Mountain Harvest sustainability.
When companies link the household level impact to the business’
own success and growth, it becomes easier to provide the nec-
essary resources for such bold commitments.
© Mountain Harvest
4 IBID
Improve Well-Being & Prosperity
1920 21 H U B R E P O RT
Resilient Supply
Commitments to Inspire—resilient supply case Study
2025 Challenge Target: Increase smallholder production by 11.9 million bags, through renova-
tion, rehabilitation, and technical investments on existing areas, to adequately meet long-term
demand from a diversity of origins.
2025 Challenge Metrics:
• # of people trained: Training leads to increased knowledge that when put in practice can
generate farm improvements that impact farm yield.
• $ funding facilitated: Money invested in renovation, rehabilitation and technical assistance
can increase performance of a farm, generating additional yield.
Rainforest Alliance
Commitment: As part of our mission to make sustainable farming the norm,
we launch our Sector Partnerships program in Central America to strengthen
the capacity of farmers (especially smallholders and female farmers) and
local civil society organizations to lobby and advocate for sector change in
coffee in their countries. We will support them to work with governments
and companies to engage in issues that require a sector wide approach.
Goals:
• At least 4 projects total on topics of climate change, productivity for farmers, living wage for
workers and gender equity for coffee farming communities implemented by 2020 in Central
America
• Results from projects will be shared by farmers, workers and local civil society organizations
directly with the broader coffee community on international forums. Including the 60,000
coffee farmers and workers part of the UTZ program in Honduras, Nicaragua and Guatemala
• At least 1 million dollars invested on these projects.
What challenge is Rainforest Alliance attempting to address through this commitment?
Policies that govern the coffee industry and services provided to
producers to enhance productivity – such as distribution of fer-
tilizer or of coffee varieties that are more resistant to the effects
of climate change - are often not in line with the needs of pro-
ducers. Also, they often do not reach marginalized groups like
smallholders or women.
Through our Sector Partnerships Program, we aimed to push
for policy changes by governments, companies and multi-stake-
© Rainforest Alliance holder platforms with the goal of improved and more inclusive
service delivery for coffee producers. Of course, for policies and
2020 2 1 H UB REP ORT
Resilient Supply
services to be in line with the needs of producers, it is crucial that producers, including
smallholders and women, have a say on the design of such policies and services.
Through the SP Program we supported several advocacy initiatives that focused
on policy change and on initiatives that pushed for the voices of women, youth and
smallholders to be heard in the coffee sector. Here, we elaborate on two examples
of projects we supported is in the realm of climate change and gender.
What does this commitment mean for Rainforest Alliance?
Climate change is having a profound impact on the productivity of coffee producers.
Smallholders can no longer rely on “normal” weather patterns and pests and dis-
eases become more widespread. Working with Anacafé in Guatemala and Cafenica
in Nicaragua we piloted digital tools (online and offline): the Coffee Cloud mobile
app which provides farmers with climatological data and helps them decide the best
moment for farming practices such has application of fertilizer or pruning (now used
by 3000 smallholders) and Clima y Café, a mobile and web application that farmers
can use to get ahead of climate impacts. The long-term goal of the project is to pro-
ducer organizations, governments and technical advisors these systems are needed,
possible to develop, and to motivate them to scale them.
Female farmers are often unable to join farmers’ organizations and cooperatives
as ownership of assets is usually a condition for membership. As such, they are not
represented by these organizations, and they lack access to information, innovation,
and inputs. We collaborated with a local chapter of the International Women’s Coffee
Alliance in Honduras, AMUCAFE to help grow their membership and increase their
legitimacy, and support them to push for gender as a priority topic for sector initia-
tives. The AMUCAFE chapter membership
increased by 25% with 365 members in
six subchapters. More than 200 of these
women received training on different
topics. AMUCAFE’s lead representative
is now also part of the Honduras Coffee
Platform and AHPROCAFE’s coffee school.
AMUCAFE also successfully pushed
for a gender policy for the Honduran
coffee producers’ umbrella organization
- AHPROCAFE. This is the first national
gender policy in the coffee sector globally
© Rainforest Alliance and it will guide new initiatives, projects,
and programs around the world.
2120 21 H U B R E P O RT
What insights does Rainforest Alliance have for
others who may want to state a similar commitment?
Advocacy is a powerful tool to drive change and
address the root causes of low productivity in the
coffee sector. Advocacy initiatives that work with just
one organization have the potential to impact whole
sectors: AMUCAFE, just one organization we sup-
ported, managed to push for the adoption of the first
gender policy in coffee – which will affect coffee stake-
holders in whole Honduras and potentially beyond.
What we learned from organizations like AMUCAFE, is © Rainforest Alliance
that they did not only appreciate our financial and tech-
nical support, but also the fact that we shared our network. This way, we opened doors for
them to other stakeholders and helped increase their legitimacy in the sector. The members
of AMUCAFE are more visible now in the sector and have grown their networks with other
regional and international stakeholders.
As policy influencing is not a linear pathway, traditional M&E approaches and metrics that focus
on delivered activities are less meaningful however. We used approaches such as Outcome
Harvesting to measure progress – focusing changes in the policy landscape, agendas of
decision makers and behaviors of key actors. These type of processes require a long-term
commitment: it takes time for organizations to build their knowledge and skills, build the right
connections and convince others to change their policies and practices.
© Creagh Cross
Resilient Supply
2220 2 1 H UB REP ORT
COMMITMENTS AS ALIGNED WITH
06 THE UNITED NATIONS
SUSTAINABLE DEVELOPMENT GOALS
Half of the commitments in the Hub contribute to Responsible Consumption and Production
(SDG 12), followed by Decent Work and Economic Growth (SDG 8) and Climate Action (SDG 13).
As stated in the 2020 Hub Report, the Challenge aligned the goals and interventions within the
Sustainability Framework with the UN Sustainable Development Goals (SDGs) to demonstrate the
contribution the coffee sector is making towards the SDGs. Responsible Consumption and Production
(SDG 12), was the most tagged of all SDGs, representing 50% of all commitments, a percentage
almost identical to the 2020 Commitments Hub Report (53%). The next highest tagged SDGs were
Decent Work and Economic Growth (SDG 8) at 39% (like the 2020 report, at 37%). While in 2020,
Zero Hunger (SDG 2) represented 35% of tags, this year, it decreased to 31%. Instead, SDG 13, Climate
Action, represented 35% of commitments, marking increased global attention to extreme weather.
Commitments by United Nations Sustainable Development Goal
Compared to last year’s report, the biggest changes in number of tagged commitments were seen
Sustainable Cities and Communities (SDG 11), increasing by 175%, or from 4 to 11 commitments year
over year. The commitments tagging SDG 11 were stated by various actors and more than half tagged
improve livelihoods (64% of commitments tagging SDG 11) and conserve nature (45%), followed by
sustain supply (18%). Notably, 91% of commitments tagging SDG 11 tagged forest conservation and
restoration. In previous Hub Reports, we did not observe that SDG 11 was so closely paired with
forest conservation and restoration. While 45% of commitments tagging SDG 11 also tagged educa-
tion and health, the text of these commitments centered upon ‘forests’ and/or ‘deforestation free’
supply chains. In addition to the year over year change observed with commitments tagging SDG
11, the share of commitments targeting Affordable and Clean Energy (SDG 7) increased by 150%,
and commitments focused on Life Below Water (SDG 14) grew by 100%.
2320 21 H U B R E P O RT
New commitments: As no surprise, new commitments tagged the following top three SDGs, all
of which have been topics with increased scrutiny and growing interest in the prior year: SDG 13,
Climate Action (47% of new commitments), SDG 12, Responsible Consumption and Production (42%
of commitments), and SDG 8, Decent Work and Economic Growth (42% of commitments).
United Nations
Commitments in the 2020 Commitments in the 2021
Sustainable Development Percent Change
Hub Report Hub Report
Goal
SDG 11 4 11 175%
SDG 7 2 5 150%
SDG 14 1 2 100%
SDG 13 29 51 76%
SDG 16 3 5 67%
SDG 17 27 43 59%
SDG 5 13 20 54%
SDG 6 14 21 50%
SDG 10 15 22 47%
SDG 3 13 19 46%
SDG 8 39 57 46%
SDG 1 35 47 34%
SDG 15 35 47 34%
SDG 12 56 73 30%
SDG 9 11 14 27%
SDG 2 37 45 22%
SDG 4 13 15 15%
Upon stating commitments, stakeholders are asked if their commitment is made in partnership with
others. This data helps identify existing and potential relationships in coffee lands on critical issues.
As in the 2020 Hub Report, most stakeholders continued to work individually in their supply chains
or in specific landscapes with a few partners. While 9 commitments did not disclose whether they
were made in partnership with others or not, the remainder of commitments were split almost 50/50:
47% of the 147 commitments were made in partnership with others, and 47% listed no partners. The
Challenge will continue to encourage sector collaboration as we all march towards are 2050 goals;
the best way – and the fastest way – for us to get there, is together.
In addition to partnership information yielded from the Hub, the Challenge recently created another
partnership mechanism. In 2021, the Challenge launched an online forum entitled “Matchmaking,”
where partners can upload projects that address the 2025 targets and are seeking partnerships in
the field. Projects are uploaded on a semi-annual basis, where Challenge partners can search the
website for projects that pique interest, reach out to the contact person of the project, and then part-
ners connect and may form a new partnership. The project partner reports
© Conservation back to the
International/photo Challenge
by Jake Brunneron
the project’s impact over time. Visit sustaincoffee.org/matchmaking-mechanism to partner-up today.
2420 2 1 H UB REP ORT
07 MOVING FROM PROJECTS TO
MULTI-STAKEHOLDER COLLABORATION
Upon stating commitments, stakeholders are In addition to partnership information yielded
asked if their commitment is made in partnership from the Hub, the Challenge recently created
with others. This data helps identify existing and another partnership mechanism. In 2021, the
potential relationships in coffee lands on critical Challenge launched an online forum entitled
issues. As in the 2020 Hub Report, most stake- “Matchmaking,” where partners can upload
holders continued to work individually in their projects that address the 2025 targets and
supply chains or in specific landscapes with a are seeking partnerships in the field. Projects
few partners. While 9 commitments did not dis- are uploaded on a semi-annual basis, where
close whether they were made in partnership Challenge partners can search the website for
with others or not, the remainder of commitments projects that pique interest, reach out to the
were split almost 50/50: 47% of the 147 commit- contact person of the project, and then partners
ments were made in partnership with others, connect and may form a new partnership. The
and 47% listed no partners. The Challenge will project partner reports back to the Challenge on
continue to encourage sector collaboration as the project’s impact over time. Visit sustaincof-
we all march towards our 2050 goals; the best fee.org/matchmaking-mechanism to partner-up
way – and the fastest way – for us to get there, today.
is together.
08 REPORTING ON COMMITMENTS
29 unique stakeholders reported on their com- respondents answered that email reminders for
mitments in 2021 for progress made during reporting deadlines would most help. To meet
2020. this request, in June of 2021, we sent out an
e-campaign to Challenge partners and Hub
29 stakeholders reported against 40 com- stakeholders to remind them of the impending
mitments in the Hub, or 33% of total Hub data deadlines. This is likely why we witnessed
stakeholders are reporting progress and 27% a surge in Hub use for this report.
of commitments in the Hub are tracking move-
ment over time. While 29 actors reporting is like When compared to the 2020 report, almost half
2020’s report, where 27 stakeholders reported, of the stakeholders reporting progress were
this type of Hub engagement is still desired. new (14 out of 29 stakeholders). Yet in terms
of Challenge partners, many of them are trans-
This year, we were encouraged that the number parency laggards. Only half, or 87 of the 164
of commitments stated in the Hub increased by Challenge partners (53%), have stated commit-
87% compared to 2020. This increase could be ments in the Hub.
due to a targeted email campaign. In the 2020
Hub Report, we shared results from a stake-
holder survey on Hub engagement. When asked
what would support more Hub use, 61% of survey
© Conservation International/photo by Miguel Ángel de la Cueva 2520 21 H U B R E P O RT
Bon Appétit
4C Services Management Company Café Najjar
% Progress Made: 100% % Progress Made: 60% % Progress Made: 87% % Progress Made: 10%
Commitment Maturity Date: 2021 Commitment Maturity Date: 2021 Commitment Maturity Date: 2021 Commitment Maturity Date: 2023
Website: https://bit.ly/3yqEVTH Website: https://bit.ly/3mK22Gy Website: https://bit.ly/2WwLIxY Website: https://bit.ly/3kyj0Vx
Dunkin'
% Progress Made: 70% % Progress Made: 90% % Progress Made: 55% % Progress Made: 65%
Commitment Maturity Date: 2025 Commitment Maturity Date: 2021 Commitment Maturity Date: 2021 Commitment Maturity Date: 2022
Website: https://bit.ly/3mHq05f Website: https://bit.ly/2XXUFAU Website: https://bit.ly/3Dsw1c1 Website: https://bit.ly/3yxH6Fa
Jacobs Douwe
Ecotierra Farmer Brothers Egberts
% Progress Made: 85% % Progress Made: 100% % Progress Made: 35% % Progress Made: 30%
Commitment Maturity Date: 2020 Commitment Maturity Date: 2020 Commitment Maturity Date: 2025 Commitment Maturity Date: 2025
Website: hhttps://bit.ly/2Y2pDYF Website: https://bit.ly/2Y2pLHD Website: https://bit.ly/3kzPfDV Website: https://bit.ly/3BpNdwL
Jacobs Douwe
Egberts
Keurig Dr Pepper Keurig Dr Pepper McDonald’s
% Progress Made: 80% % Progress Made: 100% % Progress Made: 100% % Progress Made: 98%
Commitment Maturity Date: 2025 Commitment Maturity Date: 2020 Commitment Maturity Date: 2020 Commitment Maturity Date: 2020
Website: https://bit.ly/3BpNdwL Website: https://bit.ly/3mJdGBm Website: https://bit.ly/3mJdGBm Website: https://bit.ly/3BnrsOh
Mesoamerican
Mercon Mercon Development Institute
% Progress Made: 65% % Progress Made: 50% % Progress Made: 100% % Progress Made: 80%
Commitment Maturity Date: 2025 Commitment Maturity Date: 2025 Commitment Maturity Date: 2019 Commitment Maturity Date: 2022
Website: https://bit.ly/3zyFwnO Website: https://bit.ly/3zyFwnO Website: https://bit.ly/3zs2KvN Website: https://bit.ly/2Y9bWr1
26You can also read