Reconstituting past flood events: the contribution of citizen science - HESS
←
→
Page content transcription
If your browser does not render page correctly, please read the page content below
Hydrol. Earth Syst. Sci., 24, 61–74, 2020
https://doi.org/10.5194/hess-24-61-2020
© Author(s) 2020. This work is distributed under
the Creative Commons Attribution 4.0 License.

Reconstituting past flood events: the contribution of citizen science
Bocar Sy1 , Corine Frischknecht1 , Hy Dao2,3 , David Consuegra1,4 , and Gregory Giuliani3
1 Department    of Earth Sciences, Faculty of Science, University of Geneva, Rue des Maraîchers 13, Geneva, 1205, Switzerland
2 Department    of Geography and Environment, Geneva School of Social Sciences, University of Geneva, 66 Boulevard
Carl-Vogt, Geneva, 1205, Switzerland
3 Institute for Environmental Sciences, University of Geneva, Boulevard Carl-Vogt 66, Geneva, 1205, Switzerland
4 Institute of Territorial Engineering, School of Management and Engineering Vaud, University of Applied Sciences

of Western Switzerland, Route de Cheseaux 1, Yverdon-les-Bains, 1401, Switzerland

Correspondence: Bocar Sy (bocar.sy@unige.ch)

Received: 24 April 2019 – Discussion started: 20 May 2019
Revised: 4 November 2019 – Accepted: 15 November 2019 – Published: 8 January 2020

Abstract. Information gathered on past flood events is es-        tries, such as Burkina Faso or Senegal, appear to be experi-
sential for understanding and assessing flood hazards. In this    encing an increase in flood disasters due to population growth
study, we present how citizen science can help to retrieve this   and the urbanisation of flood-prone areas (Di Baldassarre et
information, particularly in areas with scarce or no authori-     al., 2010). Between 1990 and 2014, floods were responsi-
tative measurements of past events. The case study is located     ble for 86 % of the economic loss from natural disasters in
in Yeumbeul North (YN), Senegal, where flood impacts rep-         Senegal alone (Preventionweb, 2018). During that period, the
resent a growing concern for the local community. This area       years 2005, 2009 and 2012 were marked by severe urban
lacks authoritative records on flood extent and water depth       floods, particularly affecting the capital of Senegal, Dakar,
as well as information on the chain of causative factors. We      causing human casualties and impairing socioeconomic con-
developed a framework using two techniques to retrieve in-        ditions (GFDRR, 2014). The country is facing enormous
formation on past flood events by involving two groups of         challenges in flood risk management, exacerbated by climate
citizens who were present during the floods. The first tech-      change (Douglas et al., 2008; Urama and Ozor, 2010), rapid
nique targeted the part of the citizens’ memory that records      and uncontrolled urbanisation, a lack of drainage infrastruc-
information on events, recalled through narratives, whereas       ture, and rapid changes in land use that worsen drainage pat-
the second technique focused on scaling past flood event in-      terns (Chen et al., 2015; Ahiablame and Shakya, 2016).
tensities using different parts of the witnesses’ bodies. These       The government and local authorities of Senegal have tried
techniques were used for three events that occurred in 2005,      several strategies to mitigate urban floods, such as develop-
2009 and 2012. They proved complementary by providing             ing emergency plans, relocating inhabitants and building wa-
quantitative information on flood extents and water depths        ter retention basins. However, two key aspects, required for
and by revealing factors that may have contributed to all three   these measures to work, have not yet been considered. First,
flood events.                                                     it is necessary to understand the causes and characteristics of
                                                                  floods, and, secondly, the local population must be involved
                                                                  in the process of risk management. Information on the mag-
                                                                  nitude and intensity of flood events, as well as on processes
1   Introduction                                                  controlling the flood, is at the core of flood hazard assess-
                                                                  ment and zoning (EXCIMAP, 2007). This fundamental in-
Together with Asia, Africa is the continent most affected by      formation is scarcely available in the region (GFDRR, 2014;
floods (UNISDR-CRED, 2015). Between 2000 and 2018,                Sy et al., 2016). The absence of an organised data acquisition
there were 698 flood disasters in Africa, killing more than       system during floods has led to the absence of a comprehen-
14 250, affecting 45 million people and causing USD 6.8 mil-
lion of economic loss (EM-DAT, 2018). West African coun-

Published by Copernicus Publications on behalf of the European Geosciences Union.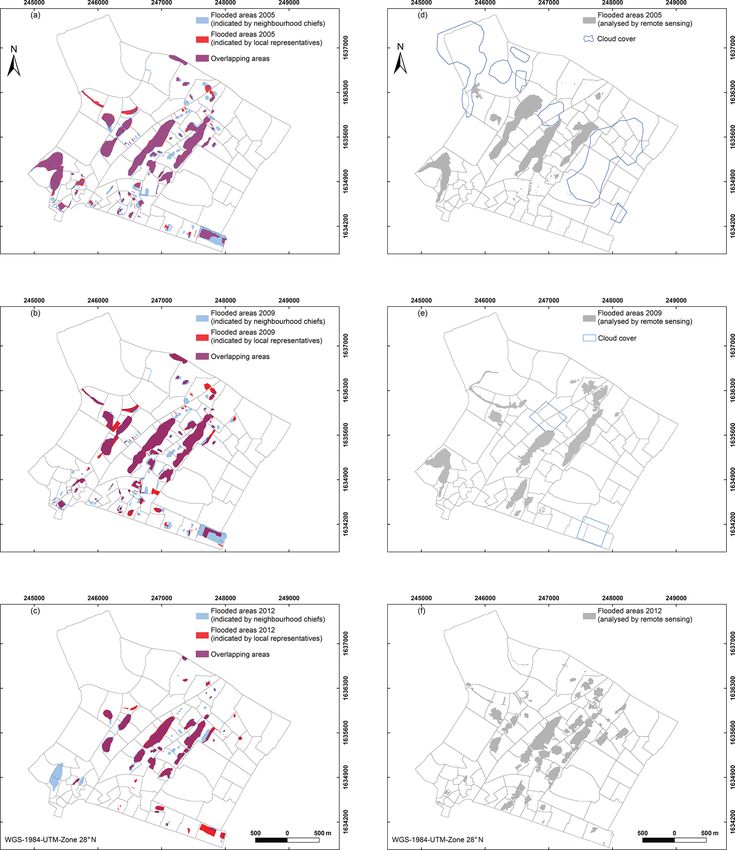
62 B. Sy et al.: Reconstituting past flood events
sive catalogue on past flood events and consequently on flood 2 Characteristics of the study area
hazard maps.
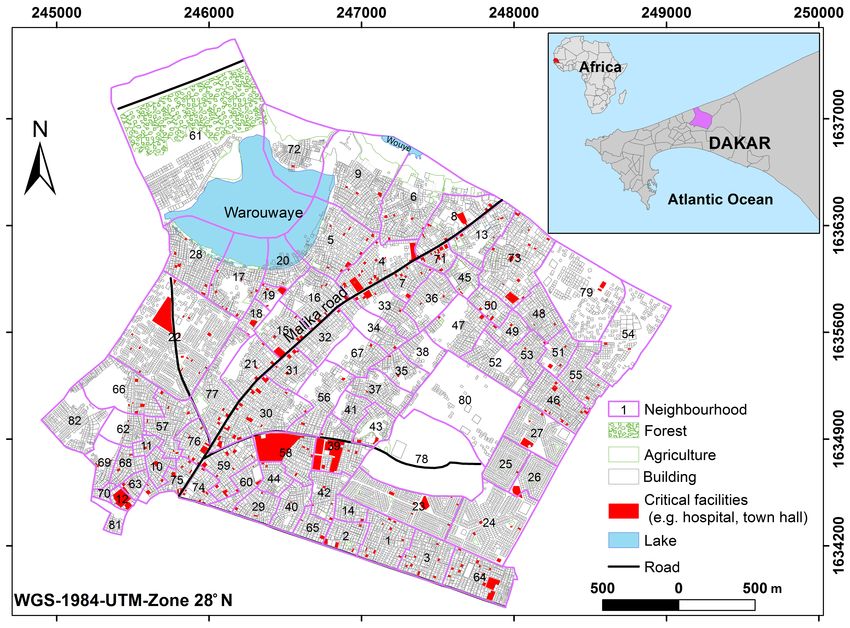
Without records of past events and without the possibil- Our citizen science approach was applied to the suburbs
ity of capturing the temporal dimension in terms of the fre- of Yeumbeul North (YN), one of the municipal districts of
quency of occurrence, accurate flood hazard assessment is Pikine in Dakar, Senegal, western Africa (Fig. 1). YN cov-
impossible to achieve. Moreover, floods are not only trig- ers an area of about 9 km2 . It is one of the most populated
gered by natural factors, but they are frequently influenced by districts of Senegal, with 168 379 inhabitants (ANDS, 2015)
man-made processes (WMO, 2012; DAEC, 2016), which are and a population density of approximately 18 700 inhabi-
not easily recorded by ground-based instruments (Townsend tants km−2 . YN is characterised by lowlands with elevation
and Walsh, 1998) or remote sensing (RS; Sanyal and Lu, less than 20 m above sea level and is highly urbanised with
2004). Consequently, new alternatives must be explored. Cit- more than 80 % of its territory covered with buildings, criti-
izen science is a form of collaborative research involving cit- cal facilities and roads (Sy et al., 2016). It is one of the sub-
izens in scientific projects (Wiggins and Crowston, 2011). urbs most affected by flooding. Figure 1 displays the state
Citizen science has attracted much attention from scientists of the permanent water bodies (Lake Warouwaye and Lake
in many fields such as ecology (Dickinson et al., 2010; Sil- Wouye), which existed before retention basins were imple-
vertown, 2009), astronomy (Raddick et al., 2007) and more mented as a mitigation measure after the 2012 floods (GF-
recently hydrology (Buytaert et al., 2014; Paul et al., 2018). DRR, 2014; Sy et al., 2016).
Rapid advancements in various modern technologies – the Administratively, YN is divided into 82 major neighbour-
internet, web 2.0, virtual globe, location-based services, so- hoods. In each of these, a delegate, chosen among the inhabi-
cial media, mobile devices, interactive geo-visualisation in- tants of the neighbourhoods, represents the municipal admin-
terfaces such as OpenStreetMap, Google Earth and Geo- istration (decree no. 86-761, Republic of Senegal, Republic
Wiki (Fritz et al., 2009; Mooney and Minghini, 2017; Yu and of Senegal) (GDS, 1986). The delegate should be from the
Gong, 2012) – as well as the rise of participatory research neighbourhood and at least 35 years old. One of the dele-
characterised by greater user interactivity and collaboration, gate’s tasks is to inform the neighbourhood inhabitants about
have increased the number of studies and subjects investi- how to face disasters. In this paper, we refer to the delegate
gated by citizen science projects. The use of citizen science as a neighbourhood chief (NC; Tall, 1998), an appellation
has also emerged in flood analysis in recent years. The exist- employed by the local population.
ing works can be classified according to which phase of flood Flooding in this area is mainly due to runoff and rainwa-
risk management they are dealing with, i.e. before, during or ter, which are not absorbed by impermeable surfaces, made
after the flood event. For example, Sy et al. (2019a) reviewed worse by rapid urbanisation and the ineffective drainage net-
the use of citizen science in flood hazard assessments, dis- work and combined with the rise of groundwater at some
cussing its potential to gather information needed to develop locations. Therefore, our area is characterised by multiple
realistic scenarios and provide flood hazard parameters, such types of floods. Flooding occurs during the rainy season,
as extent and water depth, that could help understanding the which usually starts in July and ends in October. The three
hazard level at a site. Assumpção et al. (2018) focused on events considered here occurred in 2005, 2009 and 2012.
the role citizen science could play in flood modelling and Their timeframe and the peak rainfall intensity are provided
demonstrated its value to provide data for informing, cali- in Table 1. The timeframe was retrieved from the Emergency
brating and validating flood models, particularly where data Events Database (EM-DAT, 2018), whereas the rainfall in-
are scare. It is notable that most of the existing studies have tensity values were registered at the station of Dakar-Yoff,
dealt with fluvial flooding; fewer studies have considered located 20 km away from the study area.
pluvial or groundwater flooding (See, 2019). Moreover, none
of those citizen science projects have studied the reconstruc-
tion of past events using citizen memory, unlike the field 3 Methods
of wildlife conservation where Zhang et al. (2018) demon-
strated the value of citizen data for mapping past phenomena 3.1 Investigation of past flood events
that were not otherwise recorded.
The objective of this work is twofold: (1) retrieve flood Since there is currently no catalogue of past flood events
extents and water depths for different past events and (2) de- available for the Dakar region, we decided to investigate the
termine whether citizens can clarify the causal chain of flood potential of citizen science in the retrieval of this information.
events. We also assessed the reliability of these data by com- We developed a framework combining different participatory
paring them against independent methods, such as remote approaches together in the field of citizen science (Fig. 2).
sensing. The field campaign was carried out from July to Au-
gust 2017. Our approach involved two different groups of
citizens. Participants were selected based on three criteria:
they (1) witnessed the three flood events, (2) have a good
Hydrol. Earth Syst. Sci., 24, 61–74, 2020 www.hydrol-earth-syst-sci.net/24/61/2020/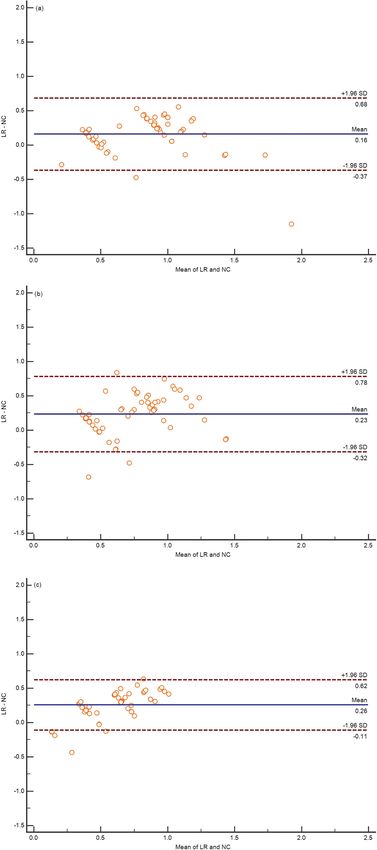
B. Sy et al.: Reconstituting past flood events                                                                                           63

Figure 1. Location of the study area. The insert on the right corner locates our study area in the city of Dakar in Senegal. The central map
represents our study area Yeumbeul North without the retention basins that were constructed after the 2012 flood. The 82 neighbourhoods
are designated by a number from 1 to 82. The corresponding names are provided in the Supplement Table S1.

Table 1. The beginning and the end of the three flood events according to the Emergency Events Database (EM-DAT), as well as the rainfall
intensity peak of each event at the Dakar-Yoff station from the National Agency for Civil Aviation and Meteorology (ANACIM) database in
Senegal.

                       Flood events                            2005                  2009                      2012
                       Start                                 20.08                 09.08                     15.08
                       End                                   10.09                 20.09                     31.08
                       Peak rainfall intensity   50 mm h−1 (04.09)     40 mm h−1 (24.08)      145.5 mm h−1 (26.08)

spatial knowledge of both the study and flooded areas and               3.1.1    Neighbourhood chiefs: from episodic memory to
(3) have a specific social standing. Therefore, the first group                  flood information
consisted of the chiefs of the 82 neighbourhoods in the mu-
nicipal district of YN. A chief is the qualification given to
an official delegate (Tall, 1986) representing the municipal            For this group of citizens, we used a two-stage approach to
administration (GDS, 1986) and is therefore the focal point             optimise the validity, reliability and utility of the data col-
for the inhabitants, also in case of disasters. The majority of         lected and to transform memories of past floods into temporal
this group was male (98 %) and their ages varied from 40                and spatial information. The first stage is based on the use of
to 90 years old, with an average of 66 years old. The sec-              episodic memory through in-person interviews conducted in
ond group was composed of 182 people, two or three per                  the chief’s house. Episodic memory is the process by which
neighbourhood. Of these, 72 % were men, with ages varying               humans remember events in context: date, place and emo-
between 35 and 60. The average was 38 years old. The un-                tional state (Tulving, 1972, 1993, 2002) and is part of long-
derrepresentation of women in the study was not by choice,              term memory (Zacks et al., 2000). The second stage involves
but it is instead due to the sociocultural context of the country       participatory mapping (IFAD, 2009) and on-site visits.
(Creevey, 1996).                                                           Face-to-face interviews were conducted with each chief
                                                                        of the 82 neighbourhoods. These persons are nominated by
                                                                        the local population because of their reputation, as they are
                                                                        considered senior and among the oldest inhabitants of the
                                                                        neighbourhood. Each interview was expected to last between

www.hydrol-earth-syst-sci.net/24/61/2020/                                                   Hydrol. Earth Syst. Sci., 24, 61–74, 2020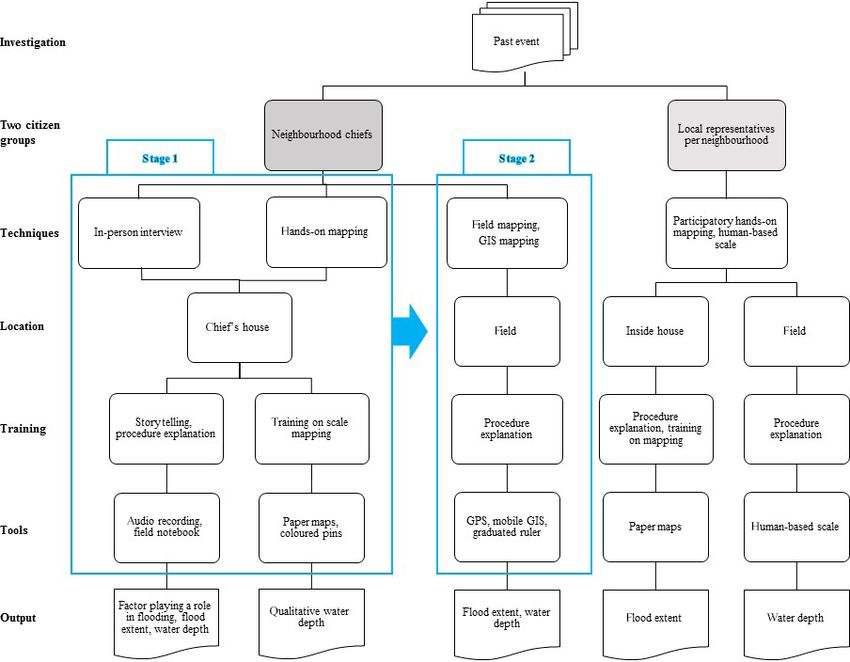
64                                                                                      B. Sy et al.: Reconstituting past flood events

Figure 2. Framework for retrieving past flood information by citizen-based methodology. The data regarding this article are available online
at: https://doi.org/10.26037/yareta:excgdpysdfadtcyffr4dclt3mm (Sy, 2019b).

45 and 60 min, but it varied according to the narrative told,           Stage 1: Investigation of past flood information in the
and no time limit was imposed. Ultimately, interviews lasted            neighbourhood chief’s house
from 30 to 60 min. In some cases it was possible to record
the narrative digitally using a smartphone. The information             The methodology of this stage was derived from techniques
obtained from the narrative allowed the neighbourhoods that             used in police investigations (Fisher, 2010; Perfect et al.,
were flooded to be identified. Then the chiefs of flooded               2008). Compared to other forms of interviews, it allows the
neighbourhoods were involved in participatory mapping in                witness (here the neighbourhood chief) to play a more active
the house and in the field, together with manual/GIS map-               role, by expressing freely their own narrative without being
ping for the latter case. The purpose of this second step was           interrupted or influenced by questions, which could distort
to formalise and express the chiefs’ memories of the floods             the memory (Loftus and Palmer, 1974). First, neighbourhood
(as witnesses or victims) in an explicit form in order to obtain        chiefs were put into a relaxed state, allowing them to focus
past information useable for flood hazard assessment, such              their thoughts and cognitive and emotional states by closing
as flood extent and water depth. Tools such as paper land-use           their eyes (Perfect, 2008) and avoiding physical and psycho-
maps of the area with footprints of houses and different land-          logical distraction (e.g. telephone calls) during this phase, as
use categories (see Fig. 1), handheld GPS and mobile GIS,               it requires intense concentration (Fisher, 2010). Some neigh-
pins on the map were used.                                              bourhood chiefs felt uncomfortable when closing their eyes.
                                                                        In such cases, they were told to focus on a blank surface,
                                                                        like a table or the floor. Once ready, they expressed their

Hydrol. Earth Syst. Sci., 24, 61–74, 2020                                                 www.hydrol-earth-syst-sci.net/24/61/2020/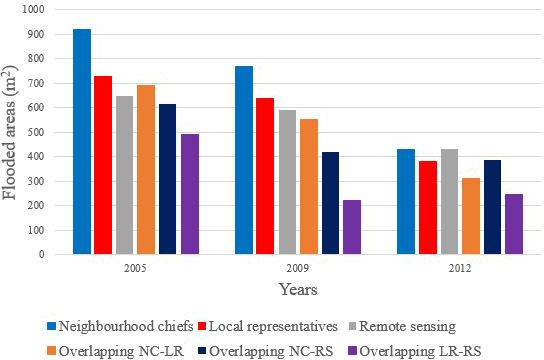
B. Sy et al.: Reconstituting past flood events                                                                                  65

memories of the event in the form of descriptive stories, as         stage 1 (red pin) corresponded to a high water level measured
they came to their mind, using their own words and language          in the field. Since we assume that memory retrieval is facil-
(Wolof) in order to avoid misunderstandings. They were in-           itated when one is present at the site, we consider the field
structed to describe in detail anything that may be related to       value to be more reliable.
the event, such as (a) processes that accompanied the flood
(e.g. the rupture of a water drainage pipe, man-made obsta-          3.1.2   Local representatives: participatory mapping on
cles); (b) important political or public events that could act               flood extent and water level of past flood events
as time indicators (e.g. proximity to a presidential election,
football game); (c) notable flood-related measures taken by          The second group involved in investigating past flood events
the authorities enabling the event to be dated; (d) spatial indi-    was composed of 182 people, selected by local associations
cators such as place and street names allowing reconstruction        (e.g. “Réseau d’Information d’Education de Communica-
of the flooded areas; and (e) the event itself, including infor-     tion”, “Association des Relais Communautaires de Yeum-
mation allowing for the deduction of the water depth (e.g.           beul”) that deal with the development of the neighbourhood
“the water reached our knees”).                                      and awareness of health issues. The selection was based on
   Following the narrative, only chiefs who indicated having         the previously mentioned criteria. As these associations oper-
been confronted with floods went through participatory map-          ate locally, they personally know residents and the choice of
ping using maps at the scale of the neighbourhood (62 out of         the inhabitants to be the representatives of the neighbourhood
82 chiefs, see Table S2). This phase required training on how        was based on a consensus among the associations. From
to read and use a map. Therefore, the concerned neighbour-           here on, we use the term “local representatives” to refer to
hood chiefs were first familiarised with a land-use map of           these selected people. The aim of involving local represen-
their neighbourhood locating their house and other features          tatives is to integrate their information with that provided
in their area including main and secondary roads as well as          from the neighbourhood chiefs in order to check the consis-
houses. After this introductory explanation, the neighbour-          tency between the two sources. Two or three local represen-
hood chiefs used the map to describe their spatial perception        tatives were selected per flooded neighbourhood, accounting
of the different flood events, using a distinctive colour pencil     for 130 out of 182 representatives, in order for them to re-
to draw the flood contours of each year. Coloured pins were          call their memories and reach a common agreement (Swan-
used for indicating the water depth at different locations on        son et al., 2016) before providing information on flood ex-
the map; red for a high level of water, green for medium and         tent and water depths for the different flood events. Data on
yellow for low. This method allowed a qualitative indication         flood extent were retrieved by participatory mapping using
of the water depth as well as its spatial distribution to be ob-     hands-on techniques. For this, representatives were trained
tained.                                                              the same way as the chiefs. These maps were then digi-
                                                                     tised. Regarding water level, local representatives went to
Stage 2: Investigation of past flood information with                the same 64 sites as indicated by the chiefs; they did not
neighbourhood chiefs in the field                                    have any prior knowledge of the depths given by the chiefs,
                                                                     and depth information was given using the different parts of
The objective of stage 2 was to corroborate the chiefs’ re-          the human body, e.g. ankle, knee or shoulder. This strategy
sponses from stage 1 by cross-checking the information lead-         was proposed to provide local representatives with a visual
ing to the map from stage 1 with the on-site mapping. To             resource to describe the water level more easily. Then, the
do this, neighbourhood chiefs brought us to the places they          pre-defined tags were converted into quantitative data by us-
previously described. This is important because memory re-           ing average body segment lengths expressed as a fraction of
trieval is facilitated when the context of the event is recreated,   body height, as defined in the field of physical anthropom-
and neighbourhood chiefs can also use their other senses             etry (Drillis and Contini, 1966; Winter, 2009). The bottom-
(sight, hearing, smell) to better remember the event (Rubin,         up dimensionless coefficients applied for each anthropomet-
2005). We drew the polygon of the spatial extent using a mo-         ric segment (Table S6) are (Winter, 2009; Contini, 1972)
bile GIS, with a GPS receiver automatically recording the            ankle (0.039), knee (0. 285), wrist (0.485), elbow (0.63),
site location. Furthermore, we measured the water level as           chest (0.72), shoulder (0.818) and chin (0.870). Finally, the
indicated by 49 neighbourhood chiefs with a graduated ruler          water depth was obtained by multiplying the value of the ap-
(Tables S3, S4 and S5) at 64 sites and recorded the GPS              propriate coefficient by the contributor’s (local representa-
coordinates. Post-processing treatments include merging the          tive; LR) height, as measured on site with a tape measure
contours of flooded areas obtained on the paper map with             (Tables S3, S4, S5 and S6). As we used two different ap-
the ones obtained in the field as well as checking the corre-        proaches to obtain the same information, we needed to as-
spondence between qualitative water levels obtained with the         sess the level of agreement instead of the correlation between
coloured pins to the quantitative water level measurements.          the two datasets. We used the Bland–Altman method (1986),
The objective of the latter was to verify if the sites indicated     which determines the level of agreement between data ac-
as having had very high water levels on the paper map from           quired with two different techniques, even if there is no in-

www.hydrol-earth-syst-sci.net/24/61/2020/                                              Hydrol. Earth Syst. Sci., 24, 61–74, 2020
66 B. Sy et al.: Reconstituting past flood events
formation about the “true” values (Bland and Altman, 1986).
In our case, we assessed depth values that could not be mea-
sured authoritatively during the flood events under study. The
Bland–Altman method calculates the differences between the
results obtained with two different approaches and plots them
against the average of the two approaches.
3.1.3 Remote sensing analysis
We used data from a remote sensing analysis to assess the
reliability of the extents of flooded areas provided by the
two citizens groups. Our requirements were (1) availability
of images for the years considered, (2) free access to the
data, (3) sufficient resolution for the size of our study area
(9 km2 ) and (4) minimum cloud cover. Radar images such as
TerraSAR-X, Radarsat-2 or COSMO-SkyMed can provide
information with high resolution (Schubert et al., 2012) and
can capture flooded areas in cloudy conditions at day and at
night (Mason et al., 2014; Schumann and Moller, 2015), but
they are not free of charge, and, most importantly for our
case, no images were available for the periods of interest.
Consequently, we only used available optical satellite im-
ages from different sensors and from different sources. In-
deed, optical images were not available on Google Earth for
the 2005 flood event. The main characteristics of these prod-
ucts we used are given in Table 2. Flooded areal extents were
obtained following the process chain described in Fig. 3.
For the 2005 event, we used two SPOT images (23 Oc-
tober) and (7 September) provided by the applied Remote
Sensing Laboratory (LTA) of the Institute of Earth Sciences
(IST) of the Université Cheikh Anta Diop (UCAD) (Table 2).
It should be noted that we did not find an image from be-
fore the flooding and hence we used an image obtained dur-
ing a dry period. These two multispectral SPOT 5 images of
10 m resolution were merged with a SPOT 5 panchromatic
image with a spatial resolution of 2.5 m to increase the spa- Figure 3. Framework for retrieving flooded areas by remote sensing
tial accuracy. We then applied the normalised difference wa- analysis.
ter index (NDWI; Khajuria et al., 2017) to the water signature
from other land-use types. The NDWI is calculated follow-
ing the method of McFeeters (1996), using the green and the For the 2009 and 2012 events, we used images available
near-infrared (NIR) bands. from Google Earth. Google launched Google Earth in 2005
(Cha and Pak, 2007), and it provides free online aerial and
Green − NIR satellite images covering many parts of the world, with var-
NDWI = (1)
Green + NIR ious resolutions and sensors. The highest resolution, about
0.5 m, is provided by Worldwide and QuickBird satellite im-
An unsupervised classification was then performed to clus- agery operated by Digital Globe. For each flood event, we
ter pixels having similar NDWI values, using the ISODATA examined the historical true colour composite imagery from
(Iterative Self-Organizing Data Analysis Technique) cluster- Google Earth using the time slider bar of Google to find one
ing algorithm provided through the software ERDAS IMAG- image as close as possible to the flood event and another one
INE© 2014. The classes were then coded to highlight only in a dry period after the event. These images were then photo-
the water areas. These areas were then digitised on both im- interpreted to identify areas of water. These areas were digi-
ages. Finally, both layers were compared and only areas cor- tised and then compared to extract only areas considered as
responding to flooded areas were kept. An area is considered flooded.
as flooded if water can be detected only on the image after
the flood.
Hydrol. Earth Syst. Sci., 24, 61–74, 2020 www.hydrol-earth-syst-sci.net/24/61/2020/B. Sy et al.: Reconstituting past flood events 67
Table 2. Remote sensing data. Dates are given the dd/mm/yyyy format. SPOT: Satellite pour l’Observation de la Terre (https://earth.esa.int/
web/guest/glossary#s); HRV: high-resolution visible.
Data/images Date Satellite/sensor Resolution Source
Multispectral colour 07/09/2005 SPOT-5/HRV 10 m UCAD
Multispectral colour 23/10/2006 SPOT-5/HRV 10 m UCAD
Panchromatic 23/10/2006 SPOT-5/HRV 2.5 m UCAD
© Digital Globe 11/03/2009 Worldview/QuickBird 0.5 m © Google Earth
© Digital Globe 14/10/2009 Worldview/QuickBird 0.5 m © Google Earth
© Digital Globe 08/03/2012 Worldview/QuickBird 0.5 m © Google Earth
© Digital Globe 31/08/2012 Worldview/QuickBird 0.5 m © Google Earth
4 Results the 2012 event was the smallest (Table 3). Flooded areas pro-
vided by local representatives are slightly smaller than those
4.1 Identifying the chain of events indicated by neighbourhood chiefs (Table 3), showing varia-
tions from 1.8 % in to 2005 to 0.6 % in 2012 (Table 3).
The chain of events which triggered floods in YN was re- In terms of mapping, slight differences appear between the
trieved from the narrative obtained from 82 neighbourhood extents identified by the two citizen groups (Fig. 4), but the
chiefs. For the 2005, 2009 and 2012 events, all the 82 neigh- areas overlap reasonably well (Fig. 5).
bourhood chiefs identified rainfall as the primary factor. Of The remote sensing analysis confirms that the main
the 29 chiefs (neighbourhood numbers 1, 2, 3, 7, 9, 17, 19, flooded areas were in the central part of the study area
20, 28, 29, 31, 32, 33, 34, 35, 36, 39, 40, 41, 44, 49, 50, 56, (Fig. 4), but some discrepancies occur at the edges. The total
57, 62, 67, 70, 72, 76; see Fig. 1) also pointed out the rise of surface area is smaller than that provided by citizen science
the water table, substantiated by the wet ground, greening of for all years (Table 3), but it shows the same tendency of de-
walls due to the water infiltration and removal of paint from creasing surfaces from 2005 to 2012. We also find that flood
walls. extents provided by neighbourhood chiefs agreed better with
The neighbourhood chiefs identified different processes the remote sensing than those provided by local representa-
that worsened the flood, by either increasing the quantity of tives for all events.
water or obstructing the typical flow, for both different loca-
tions and events. For example, for the 2005 event, four neigh-
bourhood chiefs (13, 36, 46, 67) mentioned the failure of the 4.3 Water depth information
pipeline in the road of Malika, used for water drainage, as
increasing the intensity of the flood event. Eight neighbour- Water depth is one of the key parameters considered in de-
hood chiefs (7, 17, 18, 20, 21, 28, 45, 77) mentioned the scribing flood intensity and mapping hazard (Van Alphen et
overflow of Lake Warouwaye. Additionally, 15 neighbour- al., 2007), but it is difficult to record during flood events.
hood chiefs (7, 13, 17, 18, 19, 20, 21, 28, 36, 45, 46, 67, 72, Therefore, retrieving flood depths from past events is of
76, 77) mentioned actions performed by the local population, prime interest. Figure 6 displays scatter diagrams of depth
such as the emptying of household septic tanks, which aggra- values obtained from the two different groups of citizens
vated this event and also had direct consequences on health using the techniques described in the methods (see Fig. 2)
(e.g. cholera epidemics) (Wade et al., 2009). Pipeline fail- at 64 sites, sampled over 49 neighbourhoods. We have two
ure and the emptying of septic tanks also occurred during the measurements from each site. The maximum retrieved flood
2009 event, but at different locations, e.g. near the municipal depth is 2.5 m for the 2005 event, 1.5 m for the 2009 event
hospital of YN for the pipeline failure. For the 2012 event, and 1.2 m for the 2012 event.
the 82 chiefs did not recall any processes that worsened the Figure 7 shows the data obtained by applying the Bland–
floods. Altman method for the 2005, 2009 and 2012 events for the
64 measurement sites. The value of the mean differences
4.2 Flood extent mapping in water depth, indicated by the blue line, is 0.16 m for the
2005 event, 0.23 m for 2009 and 0.26 m for 2012. The lim-
Flood extents for the 2005, 2009 and 2012 events were ob- its of agreement, also displayed, are set at 95 % confidence
tained from the two citizen groups using the methodologies intervals. Assuming the differences are normally distributed,
described in Fig. 2 and then compared to the results derived these limits are defined by the mean difference ±1.96 mul-
from the remote sensing analysis (Fig. 4). tiplied by the standard deviation σ of the differences. For
Data obtained through the citizen science approach re- the 2005 event, this range is from 0.68 to −0.37 m, with two
vealed that the 2005 event was the most widespread, whereas values falling outside these limits. For 2009 and 2012, three
www.hydrol-earth-syst-sci.net/24/61/2020/ Hydrol. Earth Syst. Sci., 24, 61–74, 202068 B. Sy et al.: Reconstituting past flood events
Figure 4. Spatial distribution of flooded areas based on citizen science techniques in (a) 2005, (b) 2009 and (c) 2012. Flooded areas based
on remote sensing data in (d) 2005, (e) 2009 and (f) 2012.
values are outside the 95 % confidence interval which is from Our methodology consisted of a set of techniques designed
0.78 to −0.32 m for 2009 and 0.62 to −0.11 m for 2012. to gather the most complete spectrum of information. These
techniques are unusual in the field of flood hazard assess-
ment, and we had to resolve some challenges associated
5 Discussion and conclusion with the time that has elapsed since the events and partic-
ipants’ understanding of maps. One technique is based on
In this study, we have used citizen science to retrieve infor-
people’s episodic memory; we used face-to-face interviews
mation on three past flood events that impacted the region of
with neighbourhood chiefs, applying specific tools in order
Dakar during the past 10 years. Our approach provides quan-
to limit external influence and memory distortion. The pro-
titative information on water depth, helps retrieve the flood
cedure was then completed by a site visit with each neigh-
extents and provides insights into factors that aggravate the
bourhood chief involved in order to consolidate the verbally
intensity of floods.
Hydrol. Earth Syst. Sci., 24, 61–74, 2020 www.hydrol-earth-syst-sci.net/24/61/2020/B. Sy et al.: Reconstituting past flood events 69
Table 3. Comparison of flooding areas from citizen science techniques deployed in Yeumbeul North (neighbourhood chiefs and local repre-
sentatives) and remote sensing analyses.
Citizen science Remote sensing Overlapping
Neighbourhood chiefs Local representatives NC/ NC/remote LR/remote
(NC) (LR) LR sensing sensing
Years Flooded Percentage of Flooded Percentage of Flooded Percentage of Area Area Area
areas study area areas study area areas study area (km2 ) (km2 ) (km2 )
(km2 ) (km2 ) (km2 )
2005 0.92 10 0.73 8.2 0.65 7.3 0.69 0.62 (95 %) 0.49 (75 %)
2009 0.77 8.6 0.64 7.2 0.59 6.6 0.55 0.42 (71 %) 0.22 (37 %)
2012 0.43 4.8 0.38 4.3 0.43 4.8 0.31 0.39 (91 %) 0.25 (58 %)
Figure 5. Flooded areas obtained by the two citizen groups and
remote sensing with the surface of overlapping areas between the
two results of the citizen groups (orange), neighbourhood chiefs and
remote sensing (dark blue), and local representatives and remote
sensing (purple).
provided information. The site visit is very important because
the time elapsed between the oldest event and the date of this
study is about 12 years. As time goes by, memories can be-
come vague (Lacy and Stark, 2013). However, people who
have experienced traumatic and stressful events, like floods,
tend to retain a more accurate, detailed and time-persistent
memory of the event (Sotgiu and Galati, 2007).
Another technique involved participatory hands-on map-
ping. Mapping can represent a challenging task for laypeo-
ple (Handmer, 1985; Żyszkowska, 2015, 2017), as they may
have difficulties understanding and locating themselves on
a map. Moreover, maps are usually constructed by apply- Figure 6. Scatter diagram of water depth information provided by
ing standard rules of graphic semiology (Thomas, 2001) that techniques used with neighbourhood chiefs and local representa-
does not necessary take into account the cultural background tives for three different flooding events in (a) 2005, (b) 2009 and
or knowledge of the citizen (Fuchs et al., 2009). Therefore, if (c) 2012.
a citizen has no experience in reading or producing maps,
information can be incorrectly reported. To overcome this
problem, we trained people on how to read a map and lo-
www.hydrol-earth-syst-sci.net/24/61/2020/ Hydrol. Earth Syst. Sci., 24, 61–74, 202070 B. Sy et al.: Reconstituting past flood events
cate themselves to ensure they understood the map, and we
explained what they should be doing and how to do it.
Developing the quality and reliability of citizen science
data is a growing research field (Crall et al., 2011; Flanagin
and Metzger, 2008; Silvertown et al., 2015). In our study,
we developed different strategies in order to improve these
two aspects. We decided to work with two different target
groups according to the context and the purpose of the study.
The objective was to check the consistency of information
obtained from the two groups. If the same area is described
as flooded by both groups, there is a good chance that the
area was indeed flooded. Due to the social organisation of the
Dakar region, we limited issues regarding source credibility
(Flanagin and Metzger, 2008) by involving neighbourhood
chiefs. Indeed, these chiefs are appointed by local citizens,
according to the trust placed in them and on their long-lasting
presence in the area. Usually, they have a good memory and
good verbal abilities. Moreover, as a witness or sometimes
as a victim, they were at the forefront of the flood scene,
therefore representing a valuable source of information on
the chain of events. The second group was composed of local
representatives, selected with the support of local and well-
implemented associations.
Identifying the chain of processes generating flooding is
very important for flood hazard assessment (DAEC, 2016)
as it enables analysis of more realistic flood scenarios. Citi-
zens living in flood affected areas are not frequently included
in post-event or flood hazard assessments, even though they
could provide useful insights as they have a good understand-
ing of their surroundings (Tran et al., 2009) and in-depth lo-
cal knowledge. Our study demonstrates this as the neighbour-
hood chiefs identified both natural and man-made factors that
contributed to flooding, such as the rise of ground water, the
Lake Warouwaye overflow and the emptying of septic tanks.
In terms of flooded areas, the results obtained from the two
groups of citizens are similar for each event, although some
spatial differences can be observed regarding the extent. Rea-
sons for the differences could be related to (a) a more in-
depth knowledge of the neighbourhood and their surround-
ings by the chiefs, as they have the confidence (Tall, 1998)
of the inhabitants and therefore have access to more detailed
information and (b) the techniques used in mapping the ar-
eas. With neighbourhood chiefs, we used a two-stage proce-
dure to retrieve the flood extent, involving hands-on mapping
and GIS mapping in the field, whilst the local representatives
only produced hands-on maps that were then digitised.
A good spatial agreement exists between flood extents
determined from remote sensing and citizen science, with
Figure 7. Bland–Altman plots for different flooding events in
(a) 2005, (b) 2009 and (c) 2012. These graphs show differences
better agreement from the data provided by the neighbour-
between water depth provided by neighbourhood chiefs (NC) and hood chiefs. However, areas provided by remote sensing are
local representatives (LR) in metres against averaged values of NC smaller. This discrepancy can be explained by various fac-
and LR. Blue line is the mean difference value, and the red dotted tors. One could be the different spatial resolutions of the
lines show the ±1.96 standard deviation (SD) water depth differ- selected images, which varied from 0.5 to 2.5 m; the larger
ences for all observations. were probably not being small enough to capture all flooded
areas (Grimaldi et al., 2016) at the scale at which we worked.
Hydrol. Earth Syst. Sci., 24, 61–74, 2020 www.hydrol-earth-syst-sci.net/24/61/2020/B. Sy et al.: Reconstituting past flood events 71
A second factor concerns the different time lapses between the society subject to floods is well understood, such an ap-
images. Post-event images from Google Earth were captured proach can be replicated in other parts of the world. More-
at intervals from 1 to 15 d, and therefore they may not have over, the citizens that have been involved in the various steps
captured the maximum extent. Furthermore, for the 2005 of this project have developed skills in flood data acquisition
event, one image was obtained during the flooding, with the and an understanding of flood processes. They can thus bet-
second image taken one year after with the assumption it was ter integrate into a decision-making process regarding flood
captured during a dry period. A third factor is related to tech- risk.
nical limitations of the capability of optical satellites to de-
tect flooded areas, which is reduced when clouds are present
(Malinowski et al., 2017; Mallinis et al., 2013). A fourth fac- Data availability. Raw Google images are accessible
tor could be linked with the heterogeneity of sensors used in from the Google Earth portal. SPOT images are acces-
this study. A way to remove this source of discrepancy would sible on request to the owning institution, i.e. Institute
be to use satellite images obtained with the same sensor. Fi- of Science of Earth (IST) of the Université Cheikh Anta
Diop in Dakar. All other related data are available at
nally, the efficiency of the NDWI index used to detect water
https://doi.org/10.26037/yareta:excgdpysdfadtcyffr4dclt3mm
areas could be altered by noise (Xu, 2006).
(Sy, 2019b).
One of the techniques used to retrieve water depths was
inspired from studies expressing flood hazard levels on maps
using a body scale (e.g. EXCIMAP, 2007; Luke et al., 2018). Supplement. The supplement related to this article is available on-
Therefore, quantitative data on water depth were retrieved line at: https://doi.org/10.5194/hess-24-61-2020-supplement.
using a proportion of the size of the human body borrowed
from the field of physiology (Winter, 2009). These values
represent an average (Drillis and Contini, 1966), since the Author contributions. BS conceived the study and carried out cit-
length of human body segments depends on body structure izen science project in the field. BS analysed the results and com-
(Contini, 1972), gender and racial groups, and therefore it piled the figures with input from CF. The outline of the paper was
could be a source of uncertainties. However, when compar- drafted by BS, HD, DC, GG and CF. BS and CF prepared the paper
ing the two approaches used for water depth investigation, with contributions from all co-authors. All the authors reviewed the
we find a fairly good agreement, with average differences paper.
less than 0.3 m, which is within the range of other compar-
isons between observed and simulated methods (Kutija et al.,
2014). Competing interests. The authors declare that they have no conflict
of interest.
Both involvement and motivation from citizens are neces-
sary for the success of citizen science projects (Rotman et al.,
2012). As Facebook was one of the most used social media
Acknowledgements. The authors are grateful to Prof. Souleye Wade
in YN at the time of the study (Sy, 2019a), we first created a from the Applied Remote Sensing Laboratory (LTA) of the Insti-
page to interact with local citizens and motivate them to be tute of Earth Sciences (IST) of the Université Cheikh Anta Diop in
part of the project. Secondly, we designed and presented the Dakar (UCAD) for providing them with the SPOT satellite images.
project in a way to convince contributors that their contribu-
tion will be beneficial for them and their neighbours. Thirdly,
we worked with community leaders (Bénit-Gbaffou and Kat- Financial support. This field campaigns were supported by the Au-
saura, 2014) and local associations to ensure a better accep- gustin Lombard grant from the Société de physique et d’histoire na-
tance of the project. turelle de Genève and Plantamour-Prévost grant from the Faculty of
Citizen science requires involvement and time, compared Science of the University of Geneva.
to a remote sensing analysis which can now also take advan-
tage of the free availability of radar images such as Sentinel
(Malenovský et al., 2012). However, at the scale at which we Review statement. This paper was edited by Elena Toth and re-
worked, these images offer neither the required spatial reso- viewed by Linda See and one anonymous referee.
lution (Twele et al., 2016) nor information on the depth of the
flood, which is a critical datum for flood hazard assessment
that we were able to obtain with citizen science.
In conclusion, our study shows the potential of citizen sci- References
ence in retrieving quantitative and reliable information on
past flood events, especially in areas where no or few records Ahiablame, L. and Shakya, R.: Modeling flood reduc-
of past events are available. Our investigation strategy, in- tion effects of low impact development at a wa-
volving two different groups of citizens, increases the relia- tershed scale, J. Environ. Manage., 171, 81–91,
bility of the obtained data. Provided that the functioning of https://doi.org/10.1016/j.jenvman.2016.01.036, 2016.
www.hydrol-earth-syst-sci.net/24/61/2020/ Hydrol. Earth Syst. Sci., 24, 61–74, 202072 B. Sy et al.: Reconstituting past flood events
ANDS: Situation économique et sociale régionale 2013: Agence EM-DAT: The OFDA/CRED International Disaster Database, avail-
Nationale de la Statistique et de la Démographie, 1–129, 2015. able at: http://www.emdat.be/disaster_trends/index.html, last ac-
Assumpção, T. H., Popescu, I., Jonoski, A., and Solomatine, D. P.: cess: 14 August 2018.
Citizen observations contributing to flood modelling: opportu- EXCIMAP: Handbook on good practices for flood mapping in
nities and challenges, Hydrol. Earth Syst. Sci., 22, 1473–1489, Europe. (European exchange circle on flood mapping), 1–60,
https://doi.org/10.5194/hess-22-1473-2018, 2018. available at: https://ec.europa.eu/environment/water/flood_risk/
Bénit-Gbaffou, C. and Katsaura, O.: Community Leadership and flood_atlas/pdf/handbook_goodpractice.pdf (last access: 14 Au-
the Construction of Political Legitimacy: Unpacking Bour- gust 2018), 2007.
dieu’s “Political Capital” in Post-Apartheid Johannesburg, Int. Fisher, R. P.: Interviewing cooperative witnesses, Legal Criminol.
J. Urban Regional, 38, 1807–1832, https://doi.org/10.1111/1468- Psych., 15, 25–38, https://doi.org/10.1348/135532509X441891,
2427.12166, 2014. 2010.
Bland, J. M. and Altman, D.: Statistical methods for assessing Flanagin, A. J. and Metzger, M. J.: The credibility of vol-
agreement between two methods of clinical measurement, The unteered geographic information, GeoJournal, 72, 137–148,
Lancet, 327, 307–310, 1986. https://doi.org/10.1007/s10708-008-9188-y, 2008.
Buytaert, W., Zulkafli, Z., Grainger, S., Acosta, L., Alemie, T. C., Fritz, S., McCallum, I., Schill, C., Perger, C., Grillmayer, R.,
Bastiaensen, J., De Bièvre, B., Bhusal, J., Clark, J., Dewulf, Achard, F., Kraxner, F., and Obersteiner, M.: Geo-Wiki. Org:
A. Foggin, M., Hannah, D. M., Hergarten, C., Isaeva, A., Kar- The use of crowdsourcing to improve global land cover, Remote
pouzoglou, T., Pandeya, B., Paudel, D., Sharma, K., Steen- Sensing, 1, 345–354, 2009.
huis, T., Tilahun, S., Van Hecken, G., and Zhumanova, M: Fuchs, S., Spachinger, K., Dorner, W., Rochman, J., and Serrhini,
Citizen science in hydrology and water resources: opportu- K.: Evaluating cartographic design in flood risk mapping, Envi-
nities for knowledge generation, ecosystem service manage- ronmental Hazards, 8, 52–70, 2009.
ment, and sustainable development, Front. Earth Sci., 2, 1–21, GDS: Decret N 86-761 du 30 juin 1986, Gouvernement du Séné-
https://doi.org/10.3389/feart.2014.00026, 2014. gal, available at: http://www.servicepublic.gouv.sn/assets/textes/
Cha, S.-Y. and Park, C.-H.: The utilization of Google Earth images deleg-quartier.pdf (last access: 24 September 2018), 1986.
as reference data for the multitemporal land cover classification GFDRR: Senegal: urban floods: recovery and reconstruction since
with MODIS data of North Korea, Korean Journal of Remote 2009, World Bank’s Global facility for Disaster Reduction and
Sensing, 23, 483–491, 2007. Recovery, 1–48, 2014.
Chen, Y., Zhou, H., Zhang, H., Du, G., and Zhou, J.: Urban flood Grimaldi, S., Li, Y., Pauwels, V. R., and Walker, J. P.: Remote
risk warning under rapid urbanization, Environ. Res., 139, 3–10, sensing-derived water extent and level to constrain hydraulic
https://doi.org/10.1016/j.envres.2015.02.028, 2015. flood forecasting models: opportunities and challenges, Surv.
Contini, R.: Body segment parameters, Part II, Artificial Limbs, 16, Geophys., 37, 977–1034, https://doi.org/10.1007/s10712-016-
1–19, 1972. 9378-y, 2016.
Crall, A. W., Newman, G. J., Stohlgren, T. J., Holfelder, K. A., Gra- Handmer, J.: Floodplain maps: uses and limitations as public infor-
ham, J., and Waller, D. M.: Assessing citizen science data qual- mation, in: proceedings of the 13th New Zealand Geographical
ity: an invasive species case study, Conserv. Lett., 4, 433–442, Society Conference, Hamilton, New Zealand, 1985.
https://doi.org/10.1111/j.1755-263X.2011.00196.x, 2011. IFAD: Good practices in participatory mapping: a review pre-
Creevey, L.: Islam, Women and the Role of the State in Senegal, pared for the International Fund for Agricultural Development,
J. Relig. Afr., 327, 268–307, https://doi.org/10.2307/1581646, 1–59, available at: https://www.ifad.org/documents/38714170/
1996. 39144386/PM_web.pdf (last access: 18 December 2019), 2009.
DAEC: Cartographie intégrale des dangers naturels liés aux crues Khajuria, A., Farooq, M., and Prashar, P: Flood inundation mapping
sur le plateau fribourgeois, Direction de l’aménagement, de of Srinagar city using geospatial techniques, in: Proceedings of
l’environnement et des constructions, 1–25, 2016. the National Conference on Advances in Water Ressource and
Di Baldassarre, G., Montanari, A., Lins, H., Koutsoyiannis, D., Environment Research, Tamilnadu, India 29–30 June 2017, 1–
Brandimarte, L., and Blöschl, G.: Flood fatalities in Africa: 236, 2017.
from diagnosis to mitigation, Geophys. Res. Lett., 37, L22402, Kutija, V., Bertsch, R., Glenis, V., Alderson, D., Parkin, G., Walsh,
https://doi.org/10.1029/2010GL045467, 2010. C., Robinson, J., and Kilsby, C.: Model validation using crowd-
Dickinson, J. L., Zuckerberg, B., and Bonter, D. N.: Citizen science sourced data from a large pluvial flood, in: Proceedings of the
as an ecological research tool: challenges and benefits, Annu. 11th International conference on hydroinformatics, New York
Rev. Ecol. Syst., 41, 149–172, 2010. City, USA, 17–21 August 2014, 2014.
Douglas, I., Alam, K., Maghenda, M., Mcdonnell, Y., McLean, Lacy, J. W. and Stark, C. E.: The neuroscience of memory: im-
L., and Campbell, J.: Unjust waters: climate change, flooding plications for the courtroom, Nat. Rev. Neurosci., 14, 649–658,
and the urban poor in Africa, Environ. Urban., 20, 187–205, https://doi.org/10.1038/nrn3563, 2013.
https://doi.org/10.1177/0956247808089156, 2008. Loftus, E. F. and Palmer, J. C.: Reconstruction of automobile de-
Drillis, R. and Contini, R.: Body segment parameters. Office of struction: An example of the interaction between language and
Vocational Rehabilitation, Department of Health, Education and memory, J. Verb. Learn. Verb. Be., 13, 585–589, 1974.
Welfare: New York, Scholl of Engineering and Science, New Luke, A., Sanders, B. F., Goodrich, K. A., Feldman, D. L.,
York University, Report No. 1166-03, 1966. Boudreau, D., Eguiarte, A., Serrano, K., Reyes, A., Schubert, J.
E., AghaKouchak, A., Basolo, V., and Matthew, R. A.: Going
beyond the flood insurance rate map: insights from flood haz-
Hydrol. Earth Syst. Sci., 24, 61–74, 2020 www.hydrol-earth-syst-sci.net/24/61/2020/B. Sy et al.: Reconstituting past flood events 73
ard map co-production, Nat. Hazards Earth Syst. Sci., 18, 1097– Sanyal, J. and Lu, X.: Application of remote sensing in flood man-
1120, https://doi.org/10.5194/nhess-18-1097-2018, 2018. agement with special reference to monsoon Asia: a review, Nat.
Malenovský, Z., Rott, H., Cihlar, J., Schaepman, M. E., García- Hazards, 33, 283–301, 2004.
Santos, G., Fernandes, R., and Berger, M.: Sentinels for science: Schubert, A., Small, D., Jehle, M., and Meier, E.: COSMO-
Potential of Sentinel-1, -2, and -3 missions for scientific obser- SkyMed, TerraSAR-X, and RADARSAT-2 geolocation accuracy
vations of ocean, cryosphere, and land, Remote Sens. Environ., after compensation for earth-system effects, in: 2012 IEEE In-
120, 91–101, https://doi.org/10.1016/j.rse.2011.09.026, 2012. ternational Geoscience and Remote Sensing Symposium, 3301–
Malinowski, R., Groom, G. B., Heckrath, G., and Schwanghart, 3304, 2012.
W.: Do Remote Sensing Mapping Practices Adequately Address Schumann, G. J.-P. and Moller, D. K.: Microwave remote sensing
Localized Flooding? A Critical Overview: Springer Science of flood inundation: Physics and Chemistry of the Earth, Parts
Reviews, 5, 1–17, https://doi.org/10.1007/s40362-017-0043-8, A/B/C, 83–84, 84–95, 2015
2017. See, L. M.: A Review of Citizen Science and Crowdsourcing in
Mallinis, G., Gitas, I. Z., Giannakopoulos, V., Maris, F., and Applications of Pluvial Flooding, Front. Earth Sci., 7, p. 44,
Tsakiri-Strati, M.: An object-based approach for flood area https://doi.org/10.3389/feart.2019.00044, 2019.
delineation in a transboundary area using ENVISAT ASAR Silvertown, J.: A new dawn for citizen science, Trends Ecol. Evol.,
and LANDSAT TM data, Int. J. Digit. Earth, 6, 124–136, 24, 467–471, 2009.
https://doi.org/10.1080/17538947.2011.641601, 2013. Silvertown, J., Harvey, M., Greenwood, R., Dodd, M., Rosewell,
Mason, D. C., Giustarini, L., Garcia-Pintado, J., and Cloke, J., Rebelo, T., Ansine, J., and McConway, K.: Crowdsourcing
H. L.: Detection of flooded urban areas in high resolu- the identification of organisms: A case-study of iSpot, ZooKeys,
tion Synthetic Aperture Radar images using double scat- 480, 125–146, https://doi.org/10.3897/zookeys.480.8803, 2015.
tering, Int. Journée d’animation Earth Obs., 28, 150–159, Sotgiu, I. and Galati, D.: Long-term memory for traumatic events:
https://doi.org/10.1016/j.jag.2013.12.002, 2014. experiences and emotional reactions during the 2000 flood in
McFeeters, S. K.: The use of the Normalized Differ- Italy, J. Psychol., 141, 91–108, 2007.
ence Water Index (NDWI) in the delineation of open Swanson, A., Kosmala, M., Lintott, C., and Packer, C.: A general-
water features, Int. J. Remote S., 17, 1425–1432, ized approach for producing, quantifying, and validating citizen
https://doi.org/10.1080/01431169608948714, 1996. science data from wildlife images, Conserv. Biol., 30, 520–531,
Mooney, P. and Minghini, M.: A review of OpenStreetMap data, https://doi.org/10.1111/cobi.12695, 2016.
in: Mapping and the Citizen Sensor, edited by: Foody, G., Sy, B.: Approche multidisciplinaire de l’évaluation de l’aléa
See, L., Fritz, S., Mooney, P., Olteanu-Raimond, A.-M., Fonte, d’inondation à Yeumbeul Nord, Dakar, Sénégal : la contri-
C. C., and Antoniou, V., 37–59, Ubiquity Press, London, bution de la science citoyenne. Université de Genève, Thèse,
https://doi.org/10.5334/bbf.c, 2017. https://doi.org/10.13097/archive-ouverte/unige:126388, 2019a.
Paul, J. D., Buytaert, W., Allen, S., Ballesteros-Cánovas, J. A., Sy, B.: data_BSy_etal_HESS, https://doi.org/10.26037/yareta:exc,
Bhusal, J., Cieslik, K., Clark, J., Dugar, S., Hannah, D. M., and 2019b.
Stoffel, M.: Citizen science for hydrological risk reduction and Sy, B., Frischknecht, C., Dao, H., Giuliani, G., Consuegra,
resilience building, Wiley Interdisciplinary Reviews: Water, 5, D., Wade, S., and Kêdowidé, C.: Participatory approach
e1262, https://https://doi.org/10.1002/wat2.1262, 2018. for flood risk assessment: the case of Yeumbeul Nord
Perfect, T. J., Wagstaff, G. F., Moore, D., Andrews, B., Cleveland, (YN), Dakar, Senegal, WIT Trans. Built Env., 165, 331–342,
V., Newcombe, S., Brisbane, K.-A., and Brown, L.: How can we https://doi.org/10.2495/UW160291, 2016.
help witnesses to remember more? It’s an (eyes) open and shut Sy, B., Frischknecht, C., Dao, H., Consuegra, D., and Giuliani, G.:
case, Law Human Behav., 32, 314–324, 2008. Flood hazard assessment and the role of citizen science, J. Flood
Preventionweb; Disaster and Risk Profile, Africa, Senegal, Na- Risk Manag., e12519, https://doi.org/10.1111/jfr3.12519, 2019.
tionally Reported Losses 1990–2014, available at: http:// Tall, S. M.: La Décentralisation et le Destin des Délégués de
www.preventionweb.net/countries/sen/data/, last access: 14 Au- Quartier à Dakar (Sénégal). Plaidoyer pour les délégués de
gust 2018. quartier de Dakar après la loi de décentralisation de 1996,
Raddick, J., Lintott, C., Schawinski, K., Thomas, D., Nichol, R., Bulletin de l’APAD, 15, 1–13, available at: http://journals.
Andreescu, D., Bamford, S., Land, K., Murray, P., and Slosar, openedition.org/apad/567 (last access: 28 November 2018),
A.: Galaxy Zoo: an experiment in public science participation, 1998.
Bulletin of the American Astronomical Society, 39, p. 892, 2007. Thomas, I.: Cartographie d’aujourd’hui et de demain: rappels et
Rotman, D., Preece, J., Hammock, J., Procita, K., Hansen, D., Parr, perspectives: Cybergeo: Revue européenne de géographie, docu-
C., Lewis, D., and Jacobs, D.: Dynamic changes in motivation ment 189, https://doi.org/10.4000/cybergeo.3812, 2001.
in collaborative citizen-science projects, in: Proceedings of the Townsend, P. A. and Walsh, S. J.: Modeling floodplain inundation
ACM 2012 conference on computer supported cooperative work, using an integrated GIS with radar and optical remote sensing,
Washington, USA, 11–15 February 2012, 217–226, available at: Geomorphology, 21, 295–312, 1998.
https://dl.acm.org/citation.cfm?id=2145238 (last access: 25 Jan- Tran, P., Shaw, R., Chantry, G., and Norton, J.: GIS and local knowl-
uary 2019), 2012. edge in disaster management: a case study of flood risk mapping
Rubin, D. C.: A basic-systems approach to autobiographical mem- in Viet Nam, Disasters, 33, 152–169, 2009.
ory, Curr. Dir. Psychol. Sci., 14, 79–83, 2005. Tulving, E.: Episodic and semantic memory, Organization of mem-
ory, 1, 381–403, 1972.
www.hydrol-earth-syst-sci.net/24/61/2020/ Hydrol. Earth Syst. Sci., 24, 61–74, 2020You can also read