2020 MACHINE LEARNING IN CREDIT RISK: MEASURING THE DILEMMA BETWEEN PREDICTION AND SUPERVISORY COST
←
→
Page content transcription
If your browser does not render page correctly, please read the page content below
MACHINE LEARNING IN CREDIT RISK:
MEASURING THE DILEMMA BETWEEN
                                      2020
PREDICTION AND SUPERVISORY COST

Documentos de Trabajo
N.º 2032

Andrés Alonso and José Manuel Carbó
MACHINE LEARNING IN CREDIT RISK: MEASURING THE DILEMMA BETWEEN PREDICTION AND SUPERVISORY COST
MACHINE LEARNING IN CREDIT RISK: MEASURING THE DILEMMA BETWEEN PREDICTION AND SUPERVISORY COST (*) Andrés Alonso and José Manuel Carbó BANCO DE ESPAÑA (*) The authors appreciate the comments received from Ana Fernández, Sergio Gorjón, José Manuel Marqués, Carlos Conesa, Juan Ayuso, Carolina Toloba and Arancha Gutiérrez, as well as the information shared by the Department of Supervision IV from the Central Bank and the suggestions and feedback received from colleagues attending at two internal webinars done to present this work. The opinions and analyses on this paper are responsibility exclusively of the authors and, therefore, do not necessarily coincide with those from Banco de España or the Eurosystem. Documentos de Trabajo. N.º 2032 2020
The Working Paper Series seeks to disseminate original research in economics and finance. All papers
have been anonymously refereed. By publishing these papers, the Banco de España aims to contribute
to economic analysis and, in particular, to knowledge of the Spanish economy and its international
environment.

The opinions and analyses in the Working Paper Series are the responsibility of the authors and, therefore,
do not necessarily coincide with those of the Banco de España or the Eurosystem.

The Banco de España disseminates its main reports and most of its publications via the Internet at the
following website: http://www.bde.es.

Reproduction for educational and non-commercial purposes is permitted provided that the source is
acknowledged.

© BANCO DE ESPAÑA, Madrid, 2020

ISSN: 1579-8666 (on line)
Abstract

New reports show that the financial sector is increasingly adopting machine learning (ML)
tools to manage credit risk. In this environment, supervisors face the challenge of allowing
credit institutions to benefit from technological progress and financial innovation, while at the
same ensuring compatibility with regulatory requirements and that technological neutrality is
observed. We propose a new framework for supervisors to measure the costs and benefits
of evaluating ML models, aiming to shed more light on this technology’s alignment with the
regulation. We follow three steps. First, we identify the benefits by reviewing the literature.
We observe that ML delivers predictive gains of up to 20 % in default classification compared
with traditional statistical models. Second, we use the process for validating internal
ratings-based (IRB) systems for regulatory capital to detect ML’s limitations in credit risk
mangement. We identify up to 13 factors that might constitute a supervisory cost. Finally, we
propose a methodology for evaluating these costs. For illustrative purposes, we compute
the benefits by estimating the predictive gains of six ML models using a public database on
credit default. We then calculate a supervisory cost function through a scorecard in which
we assign weights to each factor for each ML model, based on how the model is used by
the financial institution and the supervisor’s risk tolerance. From a supervisory standpoint,
having a structured methodology for assessing ML models could increase transparency and
remove an obstacle to innovation in the financial industry.

Keywords: artificial intelligence, machine learning, credit risk, interpretability, bias, IRB
models.

JEL classification: C53, D81, G17.
Resumen

Informes recientes muestran la creciente adopción en el sector financiero de técnicas
de aprendizaje automático o machine learning (ML) en la gestión del riesgo de crédito.
En este entorno, los supervisores se encuentran ante el reto de permitir que se maximicen
las oportunidades derivadas del progreso tecnológico y la innovación financiera, a la
vez que se respeta la neutralidad tecnológica y la compatibilidad con la regulación.
Proponemos un marco para medir los beneficios y los costes de usar ML en riesgo de
crédito, siguiendo tres pasos. Primero, identificamos los beneficios a través de una revisión
de la literatura económica, donde se observa que el ML proporciona mejoras de hasta el
20 % en la capacidad de discriminación de impagos con respecto a modelos estadísticos
tradicionales. Segundo, utilizamos el proceso de validación de sistemas de rating (IRB)
para capital regulatorio a fin de detectar las limitaciones del ML en riesgo de crédito.
Identificamos hasta trece factores que pueden suponer un coste supervisor. Finalmente,
proponemos una metodología para evaluar estos costes. A modo ilustrativo, cuantificamos
las mejoras en predicción mediante la estimación de seis modelos de ML usando una base
de datos pública. Posteriormente construimos una función de coste supervisor asignando
valores a través de un scorecard que pondera, para cada modelo, cada factor en función de
la tolerancia al riesgo del supervisor y el uso que se le dé por parte de la entidad financiera.
De esta manera se podría aumentar la transparencia, eliminando una barrera a la innovación
en la industria financiera.

Palabras clave: inteligencia artificial, aprendizaje automático, riesgo de crédito,
interpretabilidad, sesgos, modelos IRB.

Códigos JEL: C53, D81, G17.
                  /ŶĚĞdž

                  ϭ͘/ŶƚƌŽĚƵĐƚŝŽŶ͙͙͙͙͙͙͙͙͙͙͙͙͙͙͙͙͙͙͙͙͙͙͙͙͙͙͙͙͙͙͙͙͙͙͙͙͙͙͙͙͙͙͙͙͙͘͘ϴ

                  Ϯ͘dŚĞƵƐĞŽĨD>ŝŶƚŚĞĨŝŶĂŶĐŝĂůŝŶĚƵƐƚƌLJƚŽŵĞĂƐƵƌĞĐƌĞĚŝƚƌŝƐŬ͙͙͙͙͙͙͙͙͙͙͙͙͙͙͙͙͙ϭϬ

                  ϯ͘,ŽǁƚŽŵĞĂƐƵƌĞƚŚĞďĞŶĞĨŝƚƐŽĨƵƐŝŶŐD>ŵŽĚĞůƐ͙͙͙͙͙͙͙͙͙͙͙͙͙͙͙͙͙͙͙͙͙͙͙͘͘ϭϭ

                  ϰ͘,ŽǁƚŽŵĞĂƐƵƌĞƚŚĞƐƵƉĞƌǀŝƐŽƌLJĐŽƐƚŽĨĞǀĂůƵĂƚŝŶŐD>ŵŽĚĞůƐ͙͙͙͙͙͙͙͙͙͙͙͙͙͙͙͙ϭϯ

                  ϰ͘ϭ͘/ŶƚĞƌŶĂůƌĂƚŝŶŐƐͲďĂƐĞĚ;/ZͿƐLJƐƚĞŵ͙͙͙͙͙͙͙͙͙͙͙͙͙͙͙͙͙͙͙͙͙͙͙͙͙͙͙͙͙͘͘ϭϰ

                  ϰ͘Ϯ͘ŽŵƉĂƚŝďŝůŝƚLJŽĨD>ǁŝƚŚƚŚĞ/ZƐLJƐƚĞŵǀĂůŝĚĂƚŝŽŶƉƌŽĐĞƐƐ͙͙͙͙͙͙͙͙͙͙͙͙͙͙͙͘͘ϭϰ

                  ϱ͘DĞĂƐƵƌŝŶŐƚŚĞĚŝůĞŵŵĂƉƌĞĚŝĐƚŝŽŶǀƐƐƵƉĞƌǀŝƐŽƌLJĐŽƐƚ͙͙͙͙͙͙͙͙͙͙͙͙͙͙͙͙͙͙͙͙͘͘Ϯϭ

                  ϱ͘ϭ͘ŽŵƉƵƚŝŶŐƚŚĞďĞŶĞĨŝƚƐ͙͙͙͙͙͙͙͙͙͙͙͙͙͙͙͙͙͙͙͙͙͙͙͙͙͙͙͙͙͙͙͙͙͙͙͙͘Ϯϭ

                  ϱ͘Ϯ͘dŚĞƐƵƉĞƌǀŝƐŽƌLJĐŽƐƚĨƵŶĐƚŝŽŶ͙͙͙͙͙͙͙͙͙͙͙͙͙͙͙͙͙͙͙͙͙͙͙͙͙͙͙͙͙͙͙͙͘͘ϮϮ

                  ϱ͘ϯ͘YƵĂŶƚŝĨLJŝŶŐƚŚĞĚŝůĞŵŵĂ͙͙͙͙͙͙͙͙͙͙͙͙͙͙͙͙͙͙͙͙͙͙͙͙͙͙͙͙͙͙͙͙͙͙͙͘Ϯϰ

                  ϲ͘ŽŶĐůƵƐŝŽŶ͙͙͙͙͙͙͙͙͙͙͙͙͙͙͙͙͙͙͙͙͙͙͙͙͙͙͙͙͙͙͙͙͙͙͙͙͙͙͙͙͙͙͙͙͙͙Ϯϱ

                  ŶŶĞdž͙͙͙͙͙͙͙͙͙͙͙͙͙͙͙͙͙͙͙͙͙͙͙͙͙͙͙͙͙͙͙͙͙͙͙͙͙͙͙͙͙͙͙͙͙͙͙͙͙͘͘͘Ϯϳ


BANCO DE ESPAÑA       7   DOCUMENTO DE TRABAJO N.º 2032
ϭ͘/ŶƚƌŽĚƵĐƚŝŽŶ
The mathematical foundations for the development of artificial intelligence (AI) have been
present since the 1950s, but its mainstream application has only been feasible recently
thanks to the advances in computing power and data storage capacity, also known as the
Big Data era. 1 It is only since the 1980s that machine learning (ML) tools have become
popular as a sub-category of AI focused on using statistical techniques that allow
computers to learn and improve in a task relying solely on experience. Athens and Imbens
(2018) define ML as a discipline devoted to the creation of algorithms to make predictions
based on other variables, or to classify variables based on a subset of limited input data. It
is clear how ML prioritises the pursuit of predictive power. It could be argued that this
contrasts with the emphasis on structural modelling and the search for causal relationships
that is predominant in the use of more traditional econometric tools (see Breiman 2001).2
ML tools used both for prediction and classification purposes have multiple applications in
the financial industry. Recent surveys show that credit institutions are gradually adopting
more ML techniques in different areas of credit risk management, such as regulatory capital,
provisions, credit scoring and monitoring (see IIF 2019, Bank of England 2019). While ML
models seem to outperform traditional quantitative models on predictive capabilities (see
Albanessi et al 2019, Petropoulos et al 2019)3 from the supervisors’ perspective, they also
pose new challenges, such as higher algorithmic complexity, as an inherent consequence
of being a solution for more complex problems (e.g. non-linear relationships). Yet it is not
just the algorithmic complexity that matters to the supervisors, more factors are interlinked.
These are not always statistical in nature or involve quantitative modelling, but they do affect
the supervisors’ role of ensuring the comparability, reliability and robustness of the results.
Some of them, cited in the supervisory and regulatory literature (see European Banking
Authority 2017, European Banking Authority 2020 and Dupont et al 2020) are
interpretability, biases or discrimination, prediction stability, governance or changes in the
technological risk profile due to exposure to cyber-risk, and dependence on external
providers of technological infrastructure. Therefore, supervised credit institutions need to
balance the advantages and disadvantages of ML tools applied to real business problems.
How can we strike a balance? The existence of all these factors points to a dilemma which
might be preventing these tools from further penetrating the financial industry in the field of
credit risk, as suggested by the Institute of International Finance (IIF) (2019a). Supervisors
face the challenge of allowing financial institutions and clients to maximize the opportunities
stemming from technological progress and financial innovation, while observing the
principles of technological neutrality, regulatory compliance and consumer protection.
To help with this challenge, in this paper we suggest a framework that supervisors may use
to evaluate the dilemma between the costs and benefits of using ML in credit risk
management,4 facilitating an informed decision about the models’ adequacy, so that more
transparency can be given to this process vis-à-vis credit institutions, aiming to remove
1
The Big Data era is characterised first by the data being generated and processed at unprecedented speeds;
second by the volume of data, the amount of data stored is huge, as it is estimated that 90% of all stored data
has been created in just the last 5 years (see Marr 2018); and third, by the diversity of data formats, both
structured (e.g. numerical tables) and unstructured (e.g. texts, images, videos, audio).
Ϯ
However, ML is also starting to be used to study causal inference; see Athey (2018).
3
For a complete review of the literature please see Section 3.
4
In this paper we consider advanced ML models to be those non-parametric models that most commonly
appear in the respective academic literature, in particular: random forest, XGBoost, and deep neural
networks.
BANCO DE ESPAÑA 8 DOCUMENTO DE TRABAJO N.º 2032obstacles to innovation. This framework will consist of, first, computing the benefits (i.e.
predictive power) and, second, building a cost function, which will be subject to the
idiosyncrasies of each ML technique, the supervisor’s risk tolerance and how the institution
is using the model.
We will follow three steps to set up this framework. First, we will document the benefits of
predictive power comparing the performance of ML to a more traditional logistic regression
(Logit) as a benchmark, by systematically reviewing the academic literature. We observe
that using more advanced ML models may offer gains in classification power of up to 20%
compared to Logit. However, the analysis suggests that as the algorithmic complexity
increases, the gains in predictive performance are non-monotonic and very uneven,
depending on the dataset and model used in each study.
Second, we identify the costs for the supervisor in its task of assessing the adequacy of ML
models used in credit risk management. To this end, we propose to capitalise on studying
the compatibility of ML techniques with the validation process of internal ratings-based (IRB)
models, as per the Basel general framework, for calculating the minimum regulatory capital
requirements. Since the IRB approach requires that the risk factors estimated for regulatory
capital purposes are aligned with any other internal use, we are able to suggest extending
its use for evaluating ML models to more areas of credit risk management. Indeed, we find
it an effective and transparent mechanism for explaining the concerns arising from the
supervisors’ perspective. As it incorporates statistical requirements, technological aspects
and market conduct issues, the IRB approach becomes a powerful tool, setting up an ideal
environment to identify the key limitations of using ML in credit risk. In particular, we find 13
factors that may be included as inputs in the supervisory cost function.
Third, we propose a methodology to evaluate the dilemma between benefits gained and
costs incurred by the supervisor when evaluating ML models. We will consider the most
common ML models mentioned in the academic literature focusing on credit risk and
default prediction. These include the lasso penalized logistic regression, decision tree,
random forest, XGBoost and deep neural network. To account for the benefits, we will
strictly measure at micro or institution level the gains in classification power, expressed in
relative terms to a standard Logit model, while excluding from this study how to integrate
potential spillovers at macroprudential level, for instance, into financial inclusion and/or
discrimination. We estimate all six ML models using the same dataset on loan defaults,
specifically one publicly available at Kaggle.com. The output of our cost function will consist
of an index value that will serve to rank the supervisory costs of each ML model based on
the weights given to 13 different factors identified previously alongside the IRB approach.
This index will be a weighted average calculated using a scorecard that each supervisor will
need to adjust based on its risk tolerance and how each credit institution may be using the
ML model.
The paper is composed as follows: in Section 2 we document the use of ML in credit risk
in the financial industry. In Section 3 we present the meta-analysis of the literature and we
document the advantages observed in the use of ML. In Section 4 we review the IRB
system under the Basel framework and we identify the potential limitations of using ML in
credit risk management by using a traffic light system. In Section 5 we estimate each
model’s costs and benefits, based on its idiosyncrasies, subject to the risk tolerance of the
supervisor and the different uses of the ML model. Section 6 contains our conclusion.
BANCO DE ESPAÑA 9 DOCUMENTO DE TRABAJO N.º 2032Ϯ͘dŚĞƵƐĞŽĨD>ŝŶƚŚĞĨŝŶĂŶĐŝĂůŝŶĚƵƐƚƌLJƚŽŵĞĂƐƵƌĞĐƌĞĚŝƚƌŝƐŬ
According to the IIF (2019a), the most common use of ML in the financial industry is in the
field of credit scoring. In this regard, credit institutions seem to have shifted their preferred
use from regulatory purposes, such as capital calculation, stress testing and even
provisions, to business-related solutions such as decisions on granting new credit,
monitoring outstanding loans and refinancing non-performing exposures, and early-warning
systems. In fact, this survey reveals that 37%5 of the 60 international institutions consulted
have fully operational ML models dedicated to automating credit scoring processes. It is
interesting that one of the reasons mentioned by institutions to abandon the use of this
technology for regulatory capital is that “regulatory requirements do not always align with
the direct application of ML models, due to the fact that regulatory models have to be
simple, while ML models might be more complex (although not impossible) to interpret and
explain”. The scale of the challenge of aligning these techniques with the prudential
regulation becomes clear with the reported reduction in the use of ML for calculating
regulatory capital, which fell from 20% in 2018 to 10% in 2019. A recent study (see
European Banking Authority, 2020) reports a similar figure, with close to 10% of European
institutions currently using ML models for capital purposes. This last report points to the
need to have more historical evidence available on the behaviour of these models in different
economic environments, such as a recession, in order to check whether or not pro-cyclical
effects exist. It shall be ensured that the default probabilities used to estimate ratings have
a long time horizon,6 in addition to guaranteeing the consistency, transparency and
comparability across different credit institutions’ estimations.
In any case, an increase is observed in the overall number of institutions with ML models in
production or in pilot projects, including this type of technology in their innovation agenda
and business strategy (see IIF 2019a). The rise in adoption is also evident across a broad
range of geographies.
It is reported that those institutions that use this kind of model for several purposes usually
achieve high-technology standards in general, while those making limited use of these
models have a more uneven level of technological development at firm level. Although ML
is used in the modelling of different underlying credit exposures, the truth is that the majority
of institutions report using them for retail credit. Usually this might happen because this is
the segment where better quality data are more abundant. In fact, the biggest growth in
annual terms has been in the SME sector (see IIF 2019a).
It might be highlighted that the use of this technology in the financial industry is not restricted
to banking institutions. Other types of institution, such as insurance companies or asset
managers have started to implement this type of model, as reported in a joint survey by the
UK financial authorities (Bank of England 2019a). Here again, most of the banking
institutions who responded to this survey answered that they already use ML, mainly for
lending (i.e. credit scoring and pricing). Similarly, at European level the use of ML and big
data is gaining traction in the Fintech industry based on studies conducted by the European
Banking Authority (EBA) (2017c and 2018) and Eccles et al (2020).
It definitely seems as though we are in an early adoption phase of AI/ML technology in the
provision of financial services, and especially in credit risk management. However, at
present the use of simpler models is predominant in the market because institutions
ϱ
These results are in line with the survey conducted at European level by the EBA (2020).
6
See the Basel framework, Article 36.29 on the horizon of ratings.
BANCO DE ESPAÑA 10 DOCUMENTO DE TRABAJO N.º 2032prioritise the ease of interpretability and explainability of results over the potential gains on
predictive power (see EBA 2020). Finally, the growth rates observed in the number of
institutions studying their feasibility in the market show their clear interest in this innovation.
Yet the question remains, how do we define the suitability of ML models in order to satisfy
supervisors’ needs?
ϯ͘,ŽǁƚŽŵĞĂƐƵƌĞƚŚĞďĞŶĞĨŝƚƐŽĨƵƐŝŶŐD>ŵŽĚĞůƐ
The availability of high quality granular databases with long time series poses a challenge
to the research on credit risk management, but it is necessary to conclude on the costs
and benefits of using ML tools. Bearing this in mind, we have reviewed updated academic
literature on credit default prediction comparing the predictive power of ML models with
traditional quantitative ones. In particular, we chose papers that use as a benchmark a
logistic regression or Logit. This will help us understand the performance of the ML models
in predictive power terms as their algorithmic complexity increases.
In all the papers analysed the target variable to predict is the probability of default (PD) of
loans (mortgages, retail exposures, corporate loans, or a mixture thereof). In order to assess
robustly the results obtained from different models and samples, we have compared
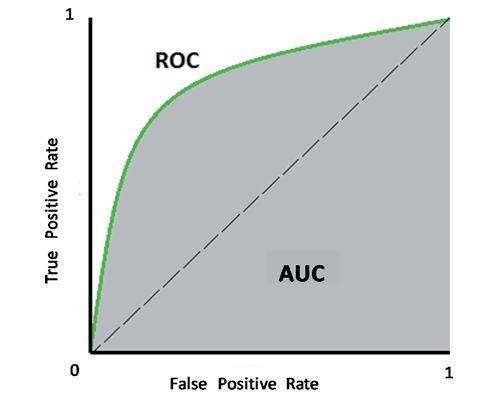
classification power using the Area Under the Curve – Receiver Operating Characteristic
(AUC-ROC) metric, out-of-sample.7 The ROC curves show the relationship between the
true positive rate (TPR) and the false positive rate (FPR) for all possible thresholds of
classification. The area that stays below the ROC curve measures the predictive power of
the classifier, as shown in Graph 1.8
Graph 1.ROC Curve and AUC
7
In Butaru et al (2016) predictive power is measured with the Recall, which represents the percentage of
defaulted loans correctly predicted as such. In the case of Cheng and Xiang (2017), predictive power is
measured by means of the Kolmogorov-Smirnov statistic, a metric similar to AUC-ROC that measures the
degree of separation between the distributions of positives (default) and negatives (non-default).
ϴ
For an optimal selection of a credit scoring model that maximizes the expected profit of the credit institution
in the new lending business, more emphasis should be placed on the vertical axis of the ROC curve, as the
opportunity cost of a false positive (not granting a loan to a performing counterparty) will presumably have a
smaller impact on the profit than the importance of getting a true positive right (not granting a loan to a non-
performing counterparty). Therefore, different techniques could be used rather than just focusing on AUC-ROC.
Nonetheless, in this paper we aim to compare models applied to different fields of credit risk management, not
only credit scoring, therefore we decided to use AUC-ROC as the most complete metric.
BANCO DE ESPAÑA 11 DOCUMENTO DE TRABAJO N.º 2032The following Figure 1 presents in an orderly manner all the papers included in our literature
review. On the horizontal axis we divide the papers based on the ML technique used and
the a priori algorithmic complexity.9 On the vertical axis we measure the gain in predictive
power relative to the discriminatory power obtained using a Logit model on the same
sample. While as mentioned above the sample sizes and the nature of the underlying
exposures and model designs differ between studies, they all highlight that the more
advanced ML techniques (e.g. random forest and deep neural networks) predict better than
traditional statistical models. The predictive gains are very heterogeneous, reaching up to
20% and not behaving monotonically as we advance towards more algorithmically complex
models.
Figure 1. The dilemma between prediction and algorithmic complexity
20%
Sirigniano et al (2019a)
18% Sigrist & Hirnschall (2019)
16%
Gains in Prediction (AUC-ROC vs Logit)
14%
12% Petropoulos et al (2018a)
10%
Cheng & Xiang (2017c) Jones et al (2015c)
8% Cheng & Xiang … Petropoulos et al (2018b)
Jones et al (2015a)
Butaru et al (2016) Kvamme et…
6% Sirigniano et al (2019b)
Babaev et al (2019)
4% Cheng & Xiang (2017a)
Albanesi y Vamossy (2019)
Moscatelli et al (2019)
2% Jones et al (2015d) Jones et al (2015b)
Guegan Hassani (2018b) Guegan Hassani (2018a)
Logit
0% Turiel (2019)
Di mensionality reduction (PCA) and Trees, Ra ndom Deep Neural Rei nforcement Learning,
regul a rization (LASSO, Ri dge, etc) Forest a nd XGBoost Networks Convolutional Neural Networks,
a nd Ensemble Methods
- +
Al gorithmic Complexity
SOURCE: Devised by the authors.
From a business perspective, the ability to better classify debtors might result directly in
profit gains, as well as savings, but as importantly it will be a key component of a sound
credit risk management strategy. At micro level, it will influence the institution’s risk appetite,
aiming to maximise its market share. Yet there are also potential impacts at macro level,
e.g. increasing financial inclusion of underserved population segments thanks to, for
instance, the possibility of using ML models together with massive amounts of information,
such as alternative data like the digital footprint of prospective clients, affording new
individuals with little to no financial history the possibility of accessing new credit (Barlett
ϵ
We rank the models by the perceived complexity of the algorithms involved in a standard configuration of
each model. First, we distinguish between parametric and non-parametric models. Among the non-parametric
models, we consider that deep learning models are more complex than tree-based ones, since the number of
parameters to estimate is higher and their interpretability is more complex, requiring the use of additional
techniques. Finally, we consider reinforcement learning and convolutional nets as the most complex models,
since the former needs a complicated state/action/reward architecture, while the latter entails a time dimension
and thus an extra layer of complexity with respect to deep neural networks. Metrics like the VC dimension (see
Vapnik-Chervonenkis 1971) could be used to account for the capacity of the algorithms, when a particular
architecture is taken into account. However, for comparison reasons we solely aimed to illustrate the changes
in the “structural” algorithmic complexity, in terms of ability to adapt to non-linear, highly dimensional problems.
Therefore, changes to this rank could be considered depending on the set of parameters and hyper-parameters
considered in each model.
BANCO DE ESPAÑA 12 DOCUMENTO DE TRABAJO N.º 20322019, Barruetabeña 2020, Dobbie et al 2019, Huang et al 2020).10 On the other hand,
negative spillovers have also been reported in several studies if the credit scoring models
are over-reliant on digital data which could discriminate against other individuals that lack
or decide not to share this sort of personal data (Bazarbash 2019, Jagtiani and Lemieux
2019). Another example is the case of using ML for an optimal segmentation of clients
based on behavioural data that could result in a person being categorised into a group for
reasons other than their repayment capacity, such as their observed loyalty to the institution
or their price elasticity to cross-selling strategies (European Supervisory Authorities 2016).
In our study we will focus on the benefits and costs at microprudential level, aiming to
account only for the institution’s potential predictive gains and the supervisory costs, while
leaving for further research how to integrate the net effect of potential financial stability
spillovers on the computation of the benefits of using ML in credit risk management.
Ultimately, from the literature review we conclude that there are potential significant
predictive gains for institutions, leading us to further investigate, in the following section, the
definition of the costs associated with the use of ML techniques from a supervisor’s
perspective.
ϰ͘,ŽǁƚŽŵĞĂƐƵƌĞƚŚĞƐƵƉĞƌǀŝƐŽƌLJĐŽƐƚŽĨĞǀĂůƵĂƚŝŶŐD>ŵŽĚĞůƐ
As mentioned above, the use of statistical models in financial services is very widespread
(Fernández 2019), from regulatory capital to credit scoring, monitoring of outstanding loans
and the calculation of optimal provisions for non-performing exposures. Also, from a
prudential standpoint, there are different angles or areas involved in the microsupervision
of predictive models used by credit institutions, mainly referring to the models’ statistical
requirements, assessment of the technological risk profile and market conduct issues.
While regulatory fragmentation in this regard adds value and allows for fully fledged
coverage of the potential risks derived from using predictive models, it is also an obstacle
to isolating the factors that determine whether or not a new quantitative tool is compatible
with the regulatory and supervisory framework. There are papers in the literature that try to
explain which factors matter to the supervisors when evaluating ML models or AI (see for
instance Dupont et al 2020 for a comprehensive summary). However, we are yet to address
the challenge of how to rank and weight each of these factors, assessing the overall impact
for the supervisor, which at the moment suffers from being considered an obstacle to
further innovation (IIF 2019b, Bank of England 2019, European Banking Authority 2020). In
this paper we establish a methodology that will allow supervisors to understand how to
weight each factor depending on the model used. In order to do this, we harness on the
validation of IRB systems to identify and classify all the factors that might constitute a cost
for the supervisors. Although the IRB approach is restricted to the calculation of minimum
capital requirements, it has an impact beyond this use, as the risk factors estimated using
IRB models must be aligned with those used internally for any other purpose.11
In Section 4.1 we explain what the IRB system is. In Section 4.2 we show how these rating
systems are validated and the compatibility with the use of ML, identifying the factors (we
10
In Section 4.3. we review the current academic debate on ML and financial inclusion, linked to the discussion
on biases.
11
Article CRE36.60 of the Basel general framework requires that models under the IRB approach be used in
the management of the institution’s business, requiring alignment between IRB systems and the risk factors
used internally in any other field, such as credit scoring, internal risk management or corporate governance.
BANCO DE ESPAÑA 13 DOCUMENTO DE TRABAJO N.º 2032discover 13) that could represent a cost for the supervisor. We then classify them into three
different categories: statistics, technology and market conduct.
ϰ͘ϭ͘/ŶƚĞƌŶĂůƌĂƚŝŶŐƐͲďĂƐĞĚ;/ZͿƐLJƐƚĞŵ
Banking regulation requires credit institutions to keep a minimum balance of own funds to
absorb unexpected losses. In order to determine this amount, institutions may use either a
set of standardised formulas or statistical models to assess internally its risk profile
(European Central Bank 2019b), also known as internal ratings-based (IRB) systems. These
systems must satisfy a series of prudential requirements, which must be approved by the
competent financial supervisor.
The IRB system is not the only way that institutions can calculate the regulatory capital
requirements, but it is indeed one of the most used approaches, in particular, in its basic
form, where in general only PD is an input to be estimated by the institution (Trucharte et al
2015). To put the wide use of the IRB approach into context, we can check the survey
conducted by the EBA (2017b) on IRB modelling practices. From the total of 102
responding institutions, there were 1,493 models reported for the purpose of estimating the
PD in their internal systems. Nonetheless, it shall be noted that among the reported
institutions, some mentioned using the quantitative models in a very wide range of fields,
while others mentioned using the model for only one purpose. Similarly, some reported
having only one model, while others submitted up to a hundred of them to the study.
Credit institutions have historically used statistical tools like multivariate analysis or logistic
regressions, such as Logit or Probit, to perform the quantitative estimations under the IRB
system (Bank for International Settlements 2001). Indeed, the notable success of these
techniques in terms of efficiency and predictive performance has been documented (Banco
de España 2016). However, as seen in Section 3, new ML techniques could offer benefits
in terms of predictive gains with respect to Logit (even lasso penalized, as we will see later)
at the cost of being more complex. This innovation might have a significant impact on the
financial industry, even at macro level, as its market-level adoption would determine the
calculation of risk-weighted assets (RWA) and their variability.12
ϰ͘Ϯ͘ŽŵƉĂƚŝďŝůŝƚLJŽĨD>ǁŝƚŚƚŚĞ/ZƐLJƐƚĞŵǀĂůŝĚĂƚŝŽŶƉƌŽĐĞƐƐ
Credit institutions are responsible for evaluating the performance of IRB systems. However,
there are explicit requirements in the Basel framework, and its transposed regulation, about
how this process should be undertaken (Bank for International Settlements 2005). In this
regard, the supervisor’s tasks include ensuring that models are correctly validated.
When using the foundation IRB approach, as a general rule institutions will only have to
estimate PD, while the remaining risk components, such as loss given default (LGD), will be
ϭϮ
This a major concern for the regulators and supervisors. Ensuring consistency at international level (see Arroyo
et al 2012), was one of the objectives of the Targeted Review of Internal Models (TRIM) performed by the
European Central Bank (ECB). In spite of the limitations observed, the conclusion reached is that these models
play an important role in the efficient management of capital by institutions. The review of this approach, through
the IRB roadmap, is expected to be concluded by 2020 (see European Banking Authority, 2019a).
BANCO DE ESPAÑA 14 DOCUMENTO DE TRABAJO N.º 2032pre-determined by the regulation.13 Once the statistical model’s design has been approved,
and the estimation is aligned with the supervisor’s requirements, the result will be entered
into an economic model for computing regulatory capital.14 This part of the validation is
primarily quantitative. In tandem, IRB systems also involve issues like data privacy and
quality, internal reporting, governance and how to solve problems while operating normally.
The importance of these issues will depend on the purpose of the model (e.g. credit scoring
or pricing, apart from the main use, .i.e. regulatory capital calculation). This part of the
validation is mostly qualitative, and is more dependent on the supervisor’s expertise and
skills.
In this section we study the compatibility of the use of ML models with the IRB validation
scheme. This way we can identify the potential benefits and costs for the supervisor
stemming from use of ML in credit risk. In Figure 2 we use a traffic light system to
understand the degree of compatibility. Green denotes those aspects for which the use of
ML is a good fit or even an improvement with respect to traditional statistical techniques.
Amber indicates the aspects where there is still uncertainty, and red marks the aspects for
which there may be a limitation in the use of ML, and therefore the need for further
adaptation. These assessments are explained below. We finish by listing the factors that
we consider would make up the standard cost function for a supervisor evaluating ML
models, discovering a total of 13 factors.
Figure 2. Components of the validation of IRB systems and their compatibility
with ML
Internal Validation by the Supervisory
Credit Institution Review
Rating Rating
system process
Data Technological Monitoring & Internal
Risk factors Estimates Quality Infrastructure Governance Uses
Biases (13) Feature Third-party Auditability Credit scoring
engineering (5) dependencies (11)
Interpretability (12) (8) Pricing
PD LGD Other
Privacy (10) Transparency
Cyber- (6) Provisioning
attacks (9)
Regulatory
capital
1º Classification Stability(1) Carbon
footprint (7)
Discriminatory power
2º Calibration Backtesting Benchmarking
Accuracy Dynamic Supervisory
Hiper-parameters (3) Calibration (4) Model
Over-fitting (2)
Economic Model
SOURCE: Elaborated by the authors, using information from BIS and ECB.
ϭϯ
All the remaining risk factors (i.e. LGD, maturity adjustments and credit conversion factors) are defined in the
regulation, depending on the type of underlying credit exposure.
ϭϰ
See the annex for further details, Figure 3 in the Annex.
BANCO DE ESPAÑA 15 DOCUMENTO DE TRABAJO N.º 2032The benefits: first classify, then calibrate
From the IRB validation process we learn the two inputs that must be satisfied so that any
statistical model passes the supervisory test from a model design perspective (left-hand
side in Figure 2). First, it needs to classify debtors correctly as per their estimated credit
risk; it will then be well-calibrated, i.e. represent realistically the observed default rate in
each risk group. As we mentioned at the beginning of the paper, from the literature review
we observed that the use of ML models can result in gains in discriminatory power of up to
20% in terms of AUC-ROC with respect to traditional statistical techniques, although these
improvements are very heterogeneous across the different articles reviewed, and the
improvements differ as the algorithmic complexity dimension changes (see Figure 1). In any
case, it is a significant improvement, so it is awarded a green light in the traffic light
assessment.
On the other hand, the calibration of a model in credit risk management is a more complex
task than discrimination from a statistical point of view. This is because institutions’ credit
portfolios do not usually have a large number of defaults, so the frequency of the prediction
variable is usually low. This leads us to assess this input with an amber light in Figure 2.
While some ML models can offer gains over traditional methods in terms of calibration and
accuracy of probabilities of default, these gains will depend on the probability threshold
chosen to determine the realisation of the event to be predicted (from what probability of
default is a client deemed likely to fail?). The selection of one threshold or another results in
the classic dilemma between false positives (Type 1 error) and false negatives (Type 2 error).
A common solution is to select the optimal threshold that balances both error types, but
this could introduce imprecise predictions (Butaru et al, 2016). Indeed, as we mentioned
above, in credit scoring in particular more weight is usually given to true positives in order
to maximise the expected benefit. Calibration could also have implications, for example, if
we want to use these models in pricing policies, where accurately predicting the absolute
value of the probability of default is necessary to correctly quantify the interest rate spread
charged to clients.
The costs: a tale of statistics, technology and market conduct
Statistics
Next, we identify a series of factors that could affect the model’s estimation and are
commonly associated with the use of ML,15 such as the presence of hyper-parameters (3),
the need to process the input data (feature engineering) (5) or the complexity of performing
backtesting when dynamic calibration is required, for instance, (4) in reinforced learning
models, since it would not be feasible to “freeze” the model and evaluate its performance
outside the sample, as proposed in Basel.16 Likewise, the concern about over-fitting (2) is
always present in the use of ML as it offers high flexibility.
Regarding stability (1), we consider that the use of ML is still uncertain, thus the amber light.
A pending task is to better evaluate the stability of these classifications (European Banking
ϭϱ
See McKinsey (2019).
ϭϲ
In the calculation of capital add-on for market risk, errors are counted on a daily basis, and depending on
whether they amount to one threshold or another, they are counted as green, yellow, or red. This data is
abundant and can be used to improve the models. Furthermore, in credit risk, the scarcity of defaults means
that a time series usually contains only up to ten annual data points, such that the confidence in the credit risk
estimates is significantly lower than in the market risk estimates. To correct this weakness, there is the possibility
of counting the errors based on the rating migrations observed for the debtors, since there will be a higher
frequency of observed data. In any case, if a bias is identified in the quantification of risk, it must always be
adjusted, beyond the estimation's own margin of error, by establishing a margin of conservatism.
BANCO DE ESPAÑA 16 DOCUMENTO DE TRABAJO N.º 2032Authority 2017a), avoiding the pro-cyclicality of the estimates and following the possible
migrations observed between ratings, so that the robustness of the model throughout an
economic cycle can be demonstrated.
Technology
One of the areas associated with algorithmic complexity is the technological requirements
necessary for its implementation and maintenance in production while operating normally.
A variable that can approximate this cost is the time that the ML model needs to be
computed and its consequent environmental impact, i.e. carbon footprint (7) derived from
its electricity consumption (see Alonso and Marqués 2019). Another factor that should be
considered is the increasing dependence on services provided by third-party providers
such as cloud computing or those related to fast data processing through the use of GPUs
or TPUs (Financial Stability Board 2019)17 (8) and the potential change in exposure to cyber-
risk (9). The integration of these services with legacy technology is one of the main
challenges for institutions and is presented as one of the most important obstacles when
putting ML models into production (see IIF 2019a). In fact, some institutions are exploring
the use of cloud computing providers to avoid such challenges and make use of new data
sources, which is in turn of particular relevance to financial authorities, due to its potential
further impact on data privacy.18
Market conduct: be transparent, behave well, and explain yourself
Likewise, data quality and in particular all privacy-related matters (10) are additional aspects
to be taken into account by institutions when applying ML. According to the EBA (2020),
one of ML’s main limitations concerns data quality. It is mentioned that institutions use their
own structured data as the main source of information in predictive models, prioritising
compliance with privacy regulations and the availability of highly reliable data. It follows that
in the context of lending there is no widespread use of alternative data sources (e.g.
information from social networks), while advanced data analytics are used to some extent.
To consider all these issues, the system of governance and monitoring of ML models
acquires particular relevance, including aspects such as transparency in the programming
of algorithms (6), as well as the auditability (11) of models and their use by different users
within the institutions, from the management team to the analysts (see McKinsey 2019).
Finally, there are two areas, interpretability (12) and control of biases (13) whose importance
transcends statistical or technological evaluation, influencing legal and ethical
considerations with repercussions for client and consumer protection. Therefore, from a
supervisory point of view, these aspects belong mostly to the field of market conduct.
Perhaps these two additional factors represent ML’s most important new developments
with respect to traditional statistical models.
Interpretability
In accordance with Article 22 of the General Data Protection Regulation (GDPR), “the data
subject shall have the right not to be subject to a decision based solely on automated
17
The graphics processing unit (GPU) has an advantage over the central processing unit (CPU) when training
complex ML models because of its distinct architecture. While the CPU is made up of a small number of
complex cores that work sequentially, the GPU is made up of many simple, small cores that are designed to
work on multiple tasks simultaneously. The ability to perform multiple calculations in tandem makes the GPU a
very efficient tool for using ML. Likewise, the Tensor Processing Unit (TPU) is an application-specific integrated
circuit, AI accelerator, developed by Google specifically for machine learning.
ϭϴ
See European Banking Authority (2017c).
BANCO DE ESPAÑA 17 DOCUMENTO DE TRABAJO N.º 2032processing, including profiling, which produces legal effects concerning him or her or
similarly significantly affects him or her”. Several observations arise from this legal provision.
First, the intervention of a human being is necessary in every phase of the lending process.19
This is in line with the validation of IRB systems, which indicates that these ratings cannot
be based exclusively on a statistical model, and there must always be human judgement in
the estimation of risk factors (see Bank for International Settlements 2005, European
Banking Authority 2017). Additionally, as stated by the European Commission (2019), the
results of an ML model need to be interpretable for all the people participating in the
process, including clients, since the decision that entails the extension, rejection or
refinancing of a loan can have a significant economic impact on people's lives, which implies
a series of ethical and moral assumptions whose fulfilment is desirable. For this reason, the
European Commission's Ethics Guidelines for Trustworthy AI (2019) cites the principle of
explicability of algorithms as one of the critical elements: “[…] This means that processes
need to be transparent, the capabilities and purpose of AI systems openly communicated,
and decisions – to the extent possible – explainable to those directly and indirectly affected
[…]”.
In the field of credit risk management, this means that a financial institution should be able
to communicate to clients in an understandable way those elements of their profiles that
determine the decision to grant or refinance credit.20 Otherwise, consumers would not be
able to properly challenge a decision on their loan application.21 Again, following the
European Commission (2019): “[…] the degree to which explicability is needed is highly
dependent on the context and the severity of the consequences if that output is erroneous
or otherwise inaccurate […]”. Therefore, when speaking of interpretability we must think
about the impact of the explicability of the results.22 This is a central issue in the field of
credit compared to other uses for which AI and ML can be implemented when providing
financial services. For instance, according to the European Commission (2019): “[…] little
ethical concern may flow from inaccurate shopping recommendations generated by an AI
system, in contrast to AI systems that evaluate whether an individual convicted of a criminal
offence should be released on parole”.23 That explains the red light assessment in Figure 2.
However, this remains a promising field for further work, also known as Interpretable ML,
in which academics are making significant headway, especially with global and local
19
In European Commission (2019) various alternatives are cited, such as the so-called human-in-the-loop
mechanism. Indeed, there have already been unsuccessful experiences of full automation in different sectors of
the economy that highlight the importance of having expert judgement at some point in the decision-making
process. Reese (2016) explains the case of the automated assistant "Tay" and its failure to interact via Twitter;
(The Guardian 2018) highlights the example of Tesla and the delays derived from the full automation of the
assembly chain. Another example was the closure by Adidas of its “speedfactories” in Germany and the USA
in 2019, two completely robotic footwear manufacturing plants, which failed to improve the efficiency of the
production chain, highly dependent on the location of the suppliers (CNN 2019).
ϮϬ
dŚĞ
(2017c) cites an example in which an online credit provider claims that it uses up to 20,000
explanatory variables per individual in its credit granting algorithm. This makes it more difficult for the institution
to explain to customers the reasons why they are denied credit.
21
In 2019, Goldman Sachs was accused of gender discrimination in the automated establishment of limits on
credit cards marketed by Apple, allegedly due to differences in the limit granted to each of the members of a
marriage whose tax return is filed jointly.
ϮϮ
In EBA (2020) explicability is defined as a general concept, which encompasses interpretability. In this regard,
a model is explainable when it allows humans to understand how the result has been obtained or what factors
have determined such result. In this sense, the model is explainable when the mechanisms that drive its results
are intrinsically interpretable, or when there are additional techniques that facilitate such interpretation of the
results.
Ϯϯ
See MIT (2019).
BANCO DE ESPAÑA 18 DOCUMENTO DE TRABAJO N.º 2032interpretable techniques such as Shapley Additive Values (for a richer insight into the
developments of these techniques see Dickerson et al, 2020).
Biases
To understand the importance of bias control in the use of ML models, we can refer again
to the European Commission (2019), which defines the principle of equality as: “a
commitment to ensuring equal and just distribution of both benefits and costs, and ensuring
that individuals and groups are free from unfair bias, discrimination and stigmatisation”.
There are several potential sources of biases (see IIF 2019c). One example is the sample
bias, which occurs if ML algorithms are trained with historical data that bear or hide existing
biases. In that case the impact of automating decisions based on that data could amplify
those biases.24 Another possibility is bias by association. Under Article 22.4 of the GDPR:
“Decisions […] shall not be based on special categories of personal data referred to in
Article 9 [...] as race or ethnicity, restricting its use to situations exceptional, such as express
consent […]”. Thus, the use of information on sensitive categories in classification
algorithms shall be limited in order not to incur in possible discrimination. Furthermore, if we
leave in our model other features that are correlated to these sensitive categories, it is
possible that the ML model would continue to discriminate. For example, imagine a case in
which postcodes are used to predict probabilities of default, and there are postcodes with
a strong racial mark-up. Then it is possible that the combination of postcode together with
other variables allows the algorithm to discriminate equally according to race, even if it does
not appear as an explanatory variable. The third type of bias is algorithmic bias. This occurs
when models rely more on certain variables when making a prediction or classification. For
example, decision trees or random forests might be biased in favour of categorical variables
with more values. McKinsey (2019) cites the case of an entity that developed a decision
tree model for the prevention of money laundering, and found that the model favoured the
variable "occupation" due to the large number of admissible categories, while it did not
attach as much weight to variables with greater explanatory power such as "country".
Something similar happens in the credit field if the models attach greater weight to variables
with long time series. This can put borrowers without a long credit history but with an equally
adequate financial profile at a disadvantage (see Deng et al 2011 and Bazarbash 2019).
In sum, we have used the IRB system to list the factors that allow us to understand the
benefits of using ML models, as well as the factors that define the supervisory cost function.
In Table 1 we group these factors into three categories: (i) statistics, (ii) technology, and (iii)
market conduct.
It all depends on the purpose of the model
Finally, we must reinforce the fact that the cost-benefit assessment will be depend on the
model’s use. For instance, accuracy may be a very important input to pass the supervisory
test on regulatory capital, yet classification power will be a priority for creating a credit
scoring rule. Similarly, the control of biases will be less important in the computation of
regulatory capital, but a very sensitive issue in credit scoring.
We also assign traffic lights depending on the perceived improvement that ML may entail
as per the literature review in each of these uses. We group them in four possible categories:
credit scoring, computation of prices for credit operations (pricing), calculation of provisions,
24
This bias occurs when the sample data does not represent the population well. This can be due to many
reasons, such as historical inertia, prejudices in the people who collect the data, etc. For a summary of the
causes of data bias in ML problems, see Mehrabi (2019).
BANCO DE ESPAÑA 19 DOCUMENTO DE TRABAJO N.º 2032Table 1. Summary of factors that determine the benefits and supervisory cost
functions, based on each possible use of the ML model
%HQHILWV)XQF WLRQ 6XSHUYLVRU\&RVWV)XQF WLRQ 0RGHO8VHV
'LVF ULPLQDWRU\SRZHU 6WDELOLW\ 2YHU ILWWLQJ &UHGLWVFRULQJ
Sta ti stics
$F FXUDF \ +\SHU SDUDPHWHUV '\QDPLF&DOLEUDWLRQ 3ULFLQJ
)HDWXUH(QJLQHHULQJ 3URYLVLRQLQJ
7UDQVSDUHQF\ 5HJXODWRU\&DSLWDO
Technol ogy
&DUERQ)RRWSULQW 6XSHUYLVRU\0RGHO
7KLUG SDUW\SURYLGHUV
&\EHU5LVN
3ULYDF\
Conduct
$XGLWDELOLW\
,QWHUSUHWDELOLW\
%LDVHV
and calculation of minimum capital requirements (regulatory capital).25 In this regard, one of
the uses where ML models could have a greater impact is calculating the optimal level of
provisions (see IIF 2019a), which includes setting up early-warning systems in refinancing
operations. In this field, financial institutions enjoy greater flexibility when using statistical
models than in other fields like regulatory capital, although they must still comply with the
regulations and principles of prudence and fair presentation. In fact, provisions could be
contemplated as an accounting concept governed by the International Accounting
Standard Board (IASB).26 Specifically, IFRS 9.B5.5.42 requires “the estimate of expected
credit losses from credit exposures to reflect an unbiased and probability-weighted amount
that is determined by evaluating a range of possible outcomes […] this may not need to be
a complex analysis”. Similarly, it is established that the information used to compute
provisions can only be qualitative, although occasionally the use of statistical models or
rating systems will be required to incorporate quantitative information (B5.5.18). Moreover,
granting new credit or credit scoring is a field in which the use of ML could have a great
impact, due to the availability of massive amounts of data that could enrich the value
provided by more flexible and scalable models (see IIF 2019b). But precisely because of its
importance, credit scoring is a field that is subject to special regulation,27 including a set of
market conduct rules. This is also the case with the field of regulatory capital (see IIF 2019a),
since it too could benefit from the use of big data and ML, but it is subject to strict regulation
Ϯϱ
To this end, we disregard the potential use of ML techniques to build a master model by the supervisor to
assist with the benchmarking task.
Ϯϲ
See Annex 9 from Circular 04/2017, November 27th, Banco de España.
Ϯϳ
The EBA (2019b) guidelines on loan origination and monitoring determines that when technological innovation
is used to grant credit, institutions must, inter alia, (1) manage the risks derived from the use of this technology;
(2) evaluate the potential bias that can be introduced into the decision-making process; (3) be able to explain
the result ensuring their robustness, traceability, auditability and resilience; (4) document the correct use of the
tool; and (5) ensure that the entire management team and analysts understand how it works. Based on the
principle of proportionality, the national competent authorities will require documentation on the credit scoring
models, and their level of understanding within the entity, both by managers and employees, as well as the
technical capacity for their maintenance. Likewise, given the relevance of the use of this technology in the
Fintech sector, the ECB (2018) incorporates the evaluation of structural aspects of the governance of the credit
granting process, as well as the credit evaluation methodologies and the management of the data. In fact, the
use of AI (including ML) for credit scoring is one of the practical cases recently discussed by the Single
Supervisory Mechanism (SSM) with the Fintech industry in one of its latest dialogues (May 2019).
BANCO DE ESPAÑA 20 DOCUMENTO DE TRABAJO N.º 2032You can also read