From examination of natural events to a proposal for risk mitigation of lahars by a cellular-automata methodology: a case study for Vascún valley ...
←
→
Page content transcription
If your browser does not render page correctly, please read the page content below
Nat. Hazards Earth Syst. Sci., 20, 1–20, 2020
https://doi.org/10.5194/nhess-20-1-2020
© Author(s) 2020. This work is distributed under
the Creative Commons Attribution 4.0 License.

From examination of natural events to a proposal for risk mitigation
of lahars by a cellular-automata methodology: a case study for
Vascún valley, Ecuador
Valeria Lupiano1,2 , Francesco Chidichimo3 , Guillermo Machado4 , Paolo Catelan3,5 , Lorena Molina4 ,
Claudia R. Calidonna6 , Salvatore Straface3 , Gino M. Crisci2 , and Salvatore Di Gregorio6,7
1 IRPI – CNR, Via Cavour 6, 87030 Rende, CS, Italy
2 Department  of Biology, Ecology and Earth Sciences, University of Calabria, Arcavacata, 87036 Rende, CS, Italy
3 Department of Chemical and Environmental Engineering, University of Calabria, Arcavacata, 87036 Rende, CS, Italy
4 Faculty of Engineering, National University of Chimborazo, Riobamba, Ecuador
5 CEAA – Centro de Investigación de Energías Alternativas y Ambiente, Escuela Superior Politécnica del Chimborazo,

Riobamba, Ecuador
6 ISAC – CNR, Zona Industriale, 88046 Lamezia Terme, CZ, Italy
7 Department of Mathematics and Computer Science, University of Calabria, Arcavacata, 87036 Rende, CS, Italy

Correspondence: Francesco Chidichimo (francesco.chidichimo@unical.it)

Received: 30 December 2018 – Discussion started: 28 January 2019
Revised: 24 October 2019 – Accepted: 12 November 2019 – Published: 2 January 2020

Abstract. Lahars are erosive floods, mixtures of water and       more rainfall, the anticipation of lahar detachment, avoiding
pyroclastic detritus, known for being the biggest environ-       simultaneous and dangerous confluence with other lahars.
mental disaster and causing a large number of fatalities in
volcanic areas. Safety measures have been recently adopted
in the threatened territories by constructing retaining dams
and embankments in key positions. More disastrous events         1     Introduction
could be generated by the difficulty of maintaining these
works in efficiency and for the changed risk conditions orig-    1.1    The problem of the lahars
inating from their presence and the effects of their function-
ing. LLUNPIY/3r, a version of the cellular-automaton model       Lahars are one of the most devastating phenomena in terms
LLUNPIY for lahar simulations, is presented. The growing         of the number of fatalities they cause in volcanic areas (Neall,
frequency of lahars in the Vascún valley of Tungurahua vol-      1976; Waythomas, 2014). They are flows other than the com-
cano (Ecuador), probably due to the effects of the climatic      mon stream flow and consist of pyroclastic deposits mixed
change, has recently produced smaller and less dangerous         with water. Their physical properties (density, viscosity, and
events, sometimes favored by the collapse of ponds gener-        consistency) are very similar to wet concrete that has not yet
ated by small landslides. An investigation is performed here     hardened (Vallance, 2000). This fluid, under steep-slope con-
in order to reproduce such situations in a controlled way by     ditions, is capable of reaching speeds up to 100 km h−1 and
the use of LLUNPIY/3r simulations. Using precise field data,     distances up to 300 km, and it becomes solid when water is
points are individuated where dams by backfill, which are        gradually released in flat areas (Manville et al., 2013).
easy to collapse, can produce the formation of ponds; LLUN-         Lahars may be of a primary type (or syneruptive) if di-
PIY/3r simulations permit projecting the triggering of small     rectly related to volcanic eruptions; usually when glaciers
lahars by minor rainfall events or projecting, in the case of    and/or snow are melted by pyroclastic or lava flows, they
                                                                 develop from mixing pyroclastic material with water, as in
                                                                 the tremendous 1985 Colombian event of Nevado del Ruiz

Published by Copernicus Publications on behalf of the European Geosciences Union.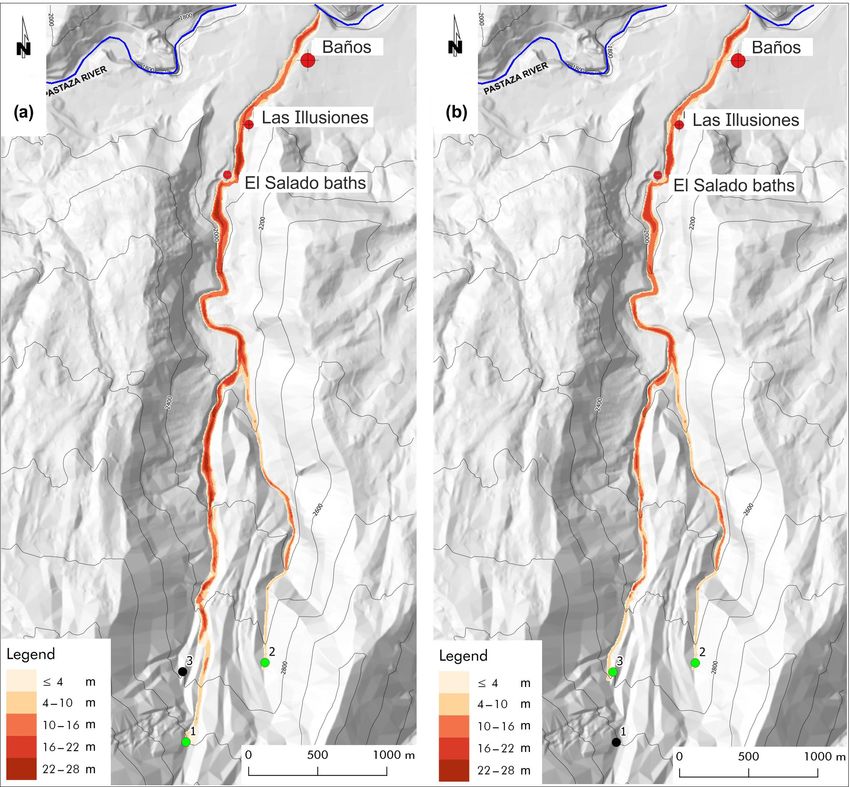
2                            V. Lupiano et al.: Risk mitigation of lahars by a cellular-automata methodology: a case study

(Pierson et al., 1990). Another case could occur when a large       a time- and space-invariant pattern. At the time t = 0, cells
quantity of water is available from the breakout of a natural       are in arbitrary states (initial conditions) and the CA evolves
lake because of eruption (Manville, 2010).                          by changing them simultaneously at discrete times (CA step),
   Secondary lahars are produced when a large water quantity        according to the transition function σ : S m → S, where S is
is available directly by extreme meteorological events or in-       the finite set of the states and m is the number of the neigh-
directly by the overflow of superficial water bodies. Pyroclas-     boring cells (Di Gregorio and Serra, 1999).
tic deposits of previous eruptive activities are mobilized, e.g.,      A short exemplification is given by the CA majority: a
the pyroclastic flows of Mt. Pinatubo in 1991 in the Philip-        two-dimensional space is divided into square cells so that the
pines (Rodolfo et al., 1996).                                       neighborhood of one square is given by the single element
   Soil erosion with water inclusion along streams increases        itself together with the eight surrounding it. Their states are
the volume of both primary and secondary lahars.                    blue (0) and red (1) and are added together within the neigh-
   Two main triggering mechanisms are possible.                     borhood by the transition function. If the sum is more than
                                                                    4 (the majority of neighbors are red), the next state of the
    a. The mobilization process is related to pyroclastic sed-      cell will be red; otherwise it will be blue. Sometimes the sys-
       iments sometimes mixed with some exotic material             tem evolves from an initial distribution of reds and blues in
       (tephra): if the superficial water amount exceeds a wa-      a complex way, causing expansions of red and blue colors
       ter height threshold, related to features of pyroclastic     from some areas (Toffoli, 1984).
       stratum and soil slope, then the percolation can cause a        When complex macroscopic dynamical systems, like “sur-
       detachment in the unconsolidated stratum.                    face flow” phenomena (lahars, debris flows, snow avalanche,
                                                                    lava flows, and pyroclastic flows), are modeled, the previous
    b. The erosion process mainly depends on the redistribu-
                                                                    definitions are insufficient, and the following extensions were
       tion of volcanic sediment along the slopes (Leavesley
                                                                    adopted for the multicomponent or macroscopic CA (MCA).
       et al., 1989; Major et al., 2000): unconsolidated tephra,
                                                                       The abstract CA must be related univocally to the real phe-
       swept away by flows, mixes with water and gradually
                                                                    nomenon in its dynamics, and each cell has to correspond to
       enlarges its volume because of the contribution of both
                                                                    a portion of the space or surface (of the territory T ) where the
       sediments and water (Barclay et al., 2007).
                                                                    phenomenon evolves; thus the time corresponding to a step
Different approaches were considered in literature for lahar        of the transition function has to be set, and the size of the cell
modeling: empirical models (e.g., Schilling, 1998; Muñoz-           has to be specified, e.g., by the length of its edge. These con-
Salinas et al., 2009) were developed, accounting mainly for         stant values in time and space are called global parameters.
some macro-observable phenomena, simplified hydrological            P is the set of global parameters, and it includes both phys-
and rheological models were developed that reduce the la-           ical and empirical parameters. The choice of some parame-
har behavior to a Newton-like behavior (e.g., O’brien, 1993;        ters is imposed, where possible, by the precision that must
Costa, 1997), numerical methods were developed for ap-              be achieved in the simulation, e.g., cell dimension. The value
proximating partial differential equations (PDEs; e.g., Pit-        of some other parameters is deduced instead by the physi-
man et al., 2003), and the cellular-automata (CA) alternative       cal features of the phenomenon, e.g., the parameter related
methodology was developed for lahar modeling, which will            to energy dissipation by turbulence. In these cases, the ini-
be shown later.                                                     tial physically sounding value considered at the beginning of
  In many issues regarding complex systems, research was            validation is corrected by attempts in the phase of model vali-
able to progress thanks to computer simulations, which al-          dation on the base of the simulation quality, depending on the
lowed for developing multidisciplinary and transdisciplinary        comparison between the real event and simulation results. A
approaches, linked in part to the emergence of alternative          methodology based on genetic algorithms was usually used
computing paradigms, such as CA (Toffoli, 1984; Chopard             for calibrating the parameters of our CA models of surface
and Droz, 1998; Iovine et al., 2007).                               flows (Iovine et al., 2005).
                                                                       Each characteristic, relevant to the evolution of the sys-
1.2    Multicomponent or macroscopic cellular automata              tem and relative to the spatial portion corresponding to the
                                                                    cell, is individuated as a substate. The finite set Q of the
CA is both a parallel computational paradigm and an                 states is given by the Cartesian product of the substates:
archetype for modeling “complex dynamical systems”,                 Q = Q1 ×Q2 ×. . .×Qn . Examples of a lahar model substates
which are extended into space and can be described on the           related to the part of territory corresponding to a cell are the
basis of local interactions of their constituent parts. A ho-       average altitude (substate altitude), the thickness of the lahar
mogeneous CA can be seen as a d-dimensional space, parti-           (substate lahar thickness), and the depth of the erodible (un-
tioned in cells of uniform size, each one embedding an identi-      consolidated) pyroclastic stratum (substate pyroclastic stra-
cal input–output computing device (a finite-state automaton).       tum depth). The dynamics of the phenomenon is expressed
Input for each cell is given by the states of the neighboring       by the variation in the substate values in the successive steps
cells, where the neighborhood conditions are determined by          of simulations for each cell. Considering that the features re-

Nat. Hazards Earth Syst. Sci., 20, 1–20, 2020                                   www.nat-hazards-earth-syst-sci.net/20/1/2020/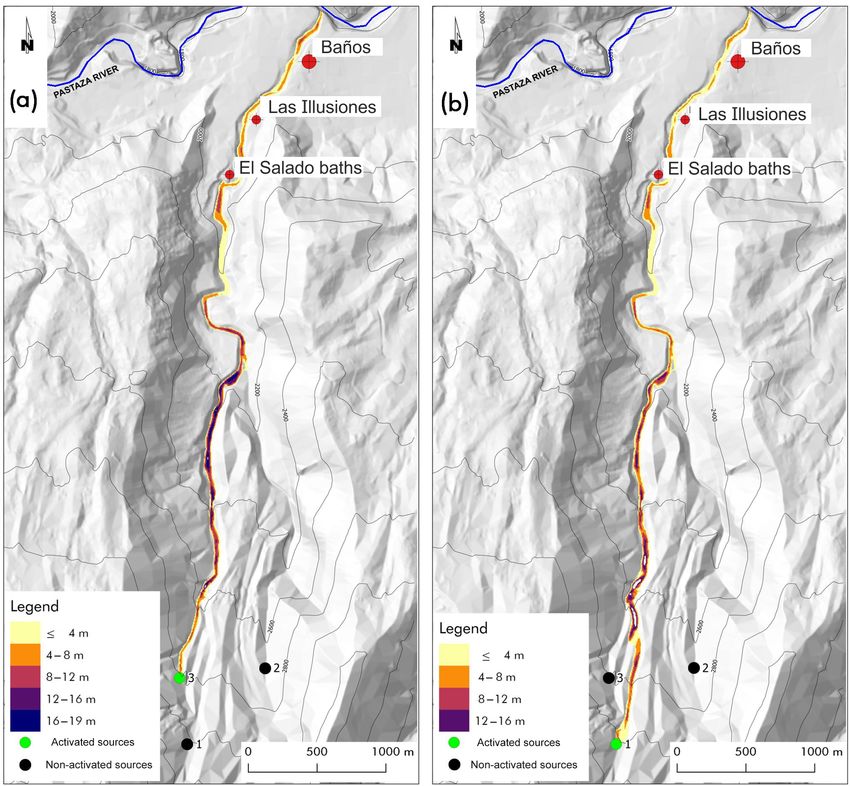
V. Lupiano et al.: Risk mitigation of lahars by a cellular-automata methodology: a case study                                   3

lated to the third dimension may be expressed in terms of          nomic destitution, security measures have been adopted in
substates, it is possible to develop two-dimensional models        volcanic territory by constructing retaining dams, embank-
operating three-dimensionally in reality (Avolio et al., 2012).    ments, walls, dykes, levees, and reservoirs in key positions
   MCA has to account for phenomena whose dynamics in-             for containing and deviating possible lahars (Scott, 1989;
volves more interacting processes, sometimes of different na-      Verstappen, 1992; Aguilera et al., 2004; Künzler et al., 2012;
ture, e.g., loss of lahar energy because of erosion of the un-     Carey et al., 2012). This solution could involve a strong envi-
consolidated pyroclastic stratum of the “cell” and loss of en-     ronmental impact: it is difficult to guarantee the constant ef-
ergy of the lahar in the cell caused by its turbulence. These      ficiency of these works, and their presence, together with the
interacting processes compose the transition function and are      effects of their functioning, could severely change the risk
called “elementary” processes of the CA. They are computed         conditions (Janda et al., 1981, 1996; Scott, 1989; Procter et
sequentially, involving the update of the MCA substates.           al., 2010; Shreve and Kelman, 2014; Wisner et al., 2012). A
   The last extension of MCA is the “external influences”,         short paper of Kelman (2007) underlines the following:
which account for input from the “external world” that does
                                                                        Despite decades of evidence from research and
not depend on local interactions (that cannot be reduced to
                                                                        practice demonstrating that reliance on structural
local interactions) occurring at some cells of the CA; e.g., the
                                                                        approaches increases disaster risk over the long-
external influence “lava alimentation at the vents” is applied,
                                                                        term, structural approaches are frequently pre-
at each step, only to those cells corresponding to the locations
                                                                        ferred without properly considering complemen-
where the vents actually are. The value of the substate “lava
                                                                        tary or alternative measures. Examples of struc-
quantity” is updated by adding the amount that is considered
                                                                        tural approaches are walls, dams, dykes, levees,
to be discharged (in the case of simulation of a real event) or
                                                                        and reservoirs. While they do provide some bene-
that is supposed to be discharged (in the case of simulation
                                                                        fits, decisions to implement them and nothing else
of a conjectured event) in the cell during the time step (Di
                                                                        are usually made by emphasizing the short-term
Gregorio and Serra, 1999).
                                                                        benefits and discounting the long-term costs.
   Simulations of flow-like landslides have been performed
by several versions of the MCA model SCIDDICA since                   The growing frequency of lahars in the area of the Vascún
1987 for both subaerial and subaqueous debris, granular,           valley of the Tungurahua volcano, Ecuador, has recently pro-
and mudflows (e.g., Barca et al., 1987; Avolio et al., 2008,       duced smaller (shorter accumulation periods) and therefore
2013; Mazzanti et al., 2010; Lupiano et al., 2014, 2015a, b,       less dangerous events (Mothes and Vallance, 2015). More-
c, 2017). Simulations of primary and secondary lahars were         over, small landslides, forming natural dams with temporary
performed by the MCA model LLUNPIY (Machado et al.,                ponds, could easily trigger lahars by collapsing because of
2014, 2015a, b; Chidichimo et al., 2016).                          rainfall. This sometimes happens; e.g., the IGEPN (Instituto
   LLUNPIY, SCIDDICA-SS3, and SCIDDICA-SS2 are our                 Geofísico Escuela Politécnica Nacional, Quito, Ecuador) re-
most advanced models (in the sense that they include the fea-      ported such a case on 23 August 2008 (IGEPN, 2008a, b).
tures of the previous models plus other new ones) for sim-         These extraordinary combinations of events resulted in the
ulating flow-like landslides and lahars. Unlike other mod-         idea of using the overabundant pyroclastic material, available
els, which were used in lahar simulations (LAHARZ – e.g.,          on-site, to create easy-to-collapse artificial dams. The dam
Schilling, 1998; Muñoz-Salinas et al., 2009; TITAN2D –             breakdown is obtained through the appropriate sizing of the
e.g., Sheridan et al., 2005; Williams et al., 2008; Córdoba        cross section of the structure which is designed to fail at the
et al., 2015), they allow the implementation of the erosion        achievement of a specified water level. This goal is reached
process.                                                           through the implementation of an ad hoc numerical model,
                                                                   based on the finite element method (FEM), for the stability
1.3   Strategies of risk mitigation for lahars                     analysis of the dam slopes.
                                                                      For such points, minor rainfall events can produce small
Reliable simulation tools are very important in order to de-       lahars, and major events will anticipate the lahar detach-
velop risk mitigation strategies and to test them in differ-       ment, avoiding simultaneous confluence with other lahars.
ent conditions. Such instruments have to be used with ex-          The control of the dams collapse could permit, in various
treme caution because the complex problem of the lahar haz-        situations, many combinations for a controlled triggering of
ard must be studied with an interdisciplinary approach (Lane       lahars in order to mitigate the risk.
et al., 2003; Leung et al., 2003); e.g., mitigation measures          The next chapter is devoted to the geological description
which involve engineered protection structures could modify        of the Vascún valley, and the third chapter introduces LLUN-
hazard conditions in time and could increase the disaster risk,    PIY/3r, the MCA model for simulating primary and sec-
as better specified below.                                         ondary lahars, together with its validation in simulating some
   Besides tools of early warning, which could work only           significant lahars of Vascún valley. In the fourth chapter, if
partially, and aside from temporary or definitive land evac-       the building of dams that are easy to collapse is considered,
uation, which could involve a strong social impact and eco-        then their favorable locations are hypothesized for a con-

www.nat-hazards-earth-syst-sci.net/20/1/2020/                                   Nat. Hazards Earth Syst. Sci., 20, 1–20, 2020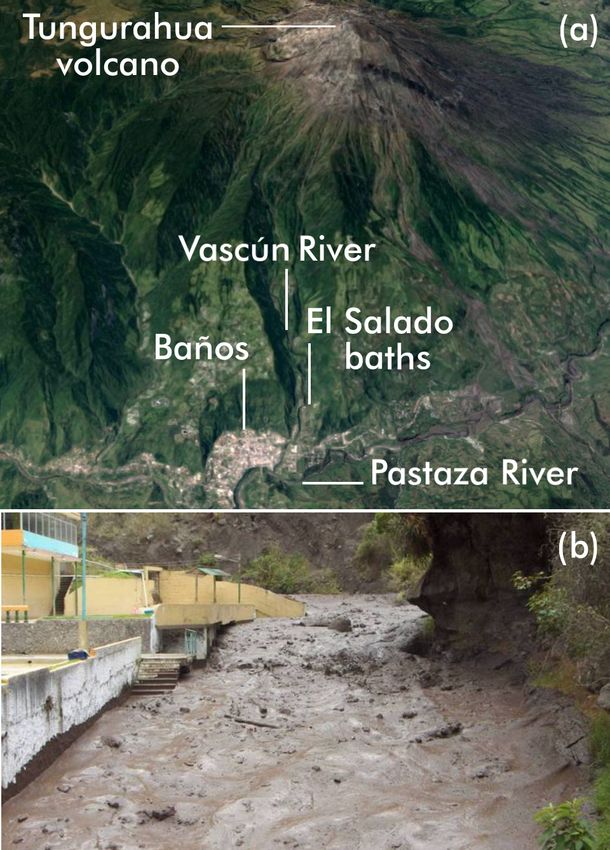
4                            V. Lupiano et al.: Risk mitigation of lahars by a cellular-automata methodology: a case study

trolled triggering of lahars, the effects of which are simulated    IGEPN, Quito, Ecuador, and its survey stations around the
for possible events. At the end of the paper are conclusions        country (https://www.igepn.edu.ec/, last access: 2 December
and comments.                                                       2019); it is the ultimate authority for various volcanic haz-
                                                                    ards and earthquakes. IGEPN and its Acoustic Flow Moni-
                                                                    tor (AFM) station detect the passage of the majority of sec-
2   Geological setting of Vascún valley                             ondary lahars (e.g.: IGEPN, 2005, 2008a, b), while many
                                                                    others are traced by the Observatory of the Volcano Tungu-
Tungurahua is one of the most active and dangerous volca-           rahua (OVT), which is situated 13 km to the north–northwest
noes in the Ecuadorian Andes (Cordillera Oriental) on the           of the crater, also with the observation contribution of local
inside of Sangay National Park; its summit, at 5023 m a.s.l.,       volunteers (vigias).
is positioned at 01◦ 280 S latitude and 78◦ 270 W longitude. It
is a stratovolcano, whose evolution has involved the succes-        The 2005 and 2008 secondary lahars of Vascún valley
sion of three major volcanic edifices (Tungurahua I, Tungu-
rahua II, and Tungurahua III) since the Middle Pleistocene          Vascún River gave its name to the valley on the NE flank of
over a basement of metamorphic rocks. Historical eruptions          Tungurahua volcano; it flows into the Pastaza River (Fig. 1).
have all originated from the summit crater. The main events         The valley slopes exceed 35–40◦ in the first (steepest) 3 km,
of eruptive activity occurred during the following years:           while they range from 20 to 6◦ in the last (less steep) 2–3 km.
1640–1641, 1773–1777, 1886–1888, 1916–1918, and from                Furthermore, the path of Vascún River is extremely sinuous
1999 to the present (Hall et al., 1999; Mothes et al., 2015;        in the upper 1–2 km, where the river is characterized by a
Biggs et al., 2010). The average frequency of eruptions in the      succession of tight 90◦ bends.
last 2000 years is once per century, according to the detailed         The Vascún valley is highly susceptible to lahar flows that
studies of Le Pennec et al. (2008). They have been accom-           threaten the nearby populated areas which were inundated
panied by strong explosions and sometimes by pyroclastic            several times in the past years: the town of Baños, which ex-
flows and lava flows that reached populated areas at the vol-       tends into part of the depositional area, was affected several
cano’s base. The formation of rain-induced lahars is also a         times; the thermal structure “El Salado”, which is located
cause of danger. Approximately 32 000 people live within the        along the river banks, had been repeatedly damaged by pas-
higher-risk areas, mainly in rural villages and in the touristic    sage of lahars (Fig. 2b).
(thermal springs) town of Baños de Agua Santa (Mothes and              For LLUNPIY/3r calibration and validation, two events
Vallance, 2015). Baños de Agua Santa (1800 m a.s.l.) is only        were taken into consideration, which took place, respectively,
8 km from the summit; 30 km to the NW, 30 km to the SW              in 2005 and 2008. The dynamic of the events is briefly de-
and 140 km to the N are the distances to the summit, respec-        scribed below.
tively, from the towns of Ambato and Riobamba and from                 On 12 February 2005, heavy rainfall caused the remobi-
the capital Quito.                                                  lization of ash fall deposits, generating lahars in the Vascún
   The small glacier of Tungurahua volcano is reduced both          River valley. The mean velocity, estimated on the base of data
by the global warming phenomenon and by the intensifi-              recorded by the alert instrumentation, varied between 3 and
cation of the volcanic activity after 1999; therefore today’s       7 m s−1 (Williams et al., 2008) according to the morpholog-
snow cover is completely negligible in terms of primary lahar       ical characteristics of valley that crossed the sector. The la-
generation. Lahar triggering, with significant frequency and        har volume, measured by the staff of the AFM station, was
magnitude, is hence subordinate to both to the intensity and        estimated at approximately 70 000 m3 , while a subsequent
duration of the rainfall and the available quantity of fresh ma-    investigation, carried out by IGEPN (2005), estimated it to
terial (cumulated unconsolidated pyroclastic material from          be 55 000 m3 . The lahar crossed the valley for about 10 km,
volcanic eruption) along the slopes and within the principal        flooding the El Salado baths during the passage, and then
canyons (Quebradas of the Vascún River, Juive Grade – La            reached the Pastaza River. The chronicle of the event is taken
Pampa valley, and Achupashal Quebrada) and, to a lesser ex-         from the work of Williams et al. (2008), and we refer to their
tent, to other factors. Almost all the lahars are confined to the   data and simulations for comparison with our simulation.
canyons and converge into the Pastaza River (Mothes and                The 2008 lahar had a different dynamic. On August 13, a
Vallance, 2015).                                                    small landslide produced a natural dam along Vascún River at
   The eruptive activity of Tungurahua volcano, during the          an elevation of about 2200 m a.s.l. The dam originated a pond
last years, has generated a greater availability of pyroclastic     with a length of 100 m, a depth of 3 m, and a width of 20 m.
debris that is periodically remobilized from atmospheric phe-       After heavy rains on 22 August, the dam collapsed and gen-
nomena, often not particularly violent but prolonged for sev-       erated a lahar. The flow velocity was estimated in 15 m s−1 ,
eral days. Between 2000 and 2011, around 900 rain-induced           with a flow rate of 1120 m3 s−1 and an average height of 4 m
lahars were triggered (Mothes and Vallance, 2015).                  (IGEPN, 2008a, b); this flow rate is 10 times greater than
   Generally, lahar magnitude is small and, consequently,           that recorded in the 2005 event (IGEPN, 2005; Williams et
causes limited damage. Precious data were supplied by the           al., 2008). The lahar reached El Salado in 5 min and devas-

Nat. Hazards Earth Syst. Sci., 20, 1–20, 2020                                  www.nat-hazards-earth-syst-sci.net/20/1/2020/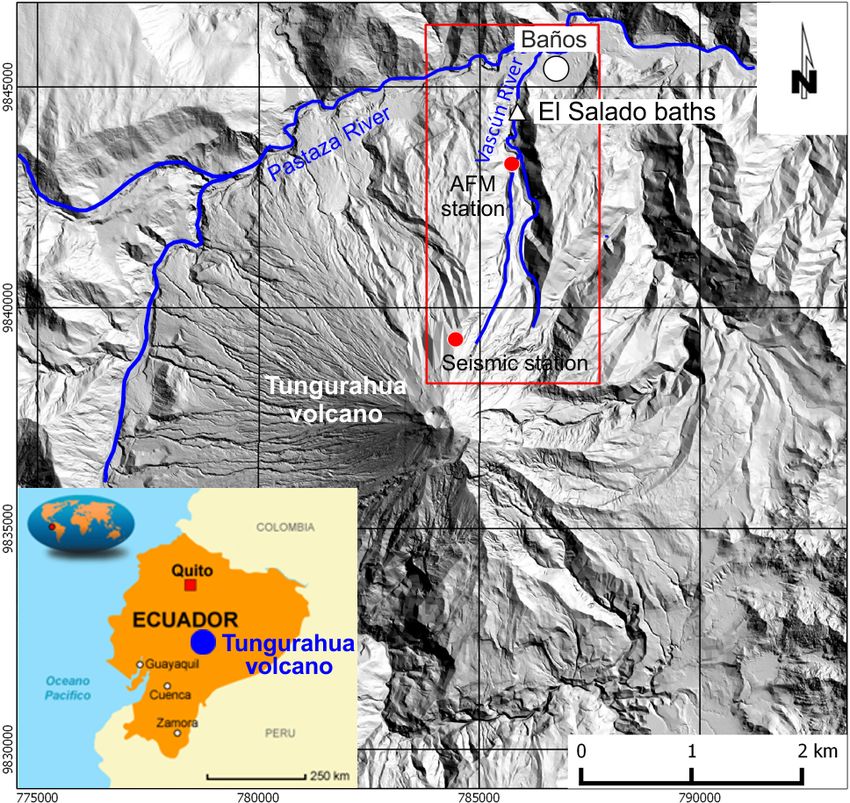
V. Lupiano et al.: Risk mitigation of lahars by a cellular-automata methodology: a case study                                            5

Figure 1. Tungurahua volcano. The Vascún valley is inside the red box.

tated the pools of the thermal spa; afterwards it destroyed              the “thickness of the lahar” substate; see Sect. 1.2) for each
some houses in Las Ilusiones (a village in the Baños district)           cell.
further downstream.                                                         A reliable reconstruction of the first phase of a real event of
                                                                         a lahar permits setting an “initial” moment, where it is possi-
                                                                         ble to deduce the thickness of lahar in the territory; these data
3   LLUNPIY/3r model for lahar simulation                                constitute the values of the substate thickness of the lahar in
                                                                         the first step of the simulation. In the case of the simulation
LLUNPIY (Lahar modelling by Local rules based on an UN-                  of a lahar produced by the collapse of a dam holding a given
derlying PIck of Yoked processes; llunp’iy means flood in the            water volume, the thickness of lahar is deduced by the mixing
Quechua language) is a model for simulating secondary and                of pond water with the dam material and part of the uncon-
primary lahars according to MCA methodology applied to a                 solidated pyroclastic stratum below. Note that the simulated
complex system, whose evolution may be mainly specified                  lahar events, which occurred in the Vascún valley, do not in-
in terms of local interaction. MCA features of SCIDDICA-                 volve the very first phase of water percolation and detach-
SS3 (Avolio et al., 2013) and SCIDDICA-SS2 (Avolio et al.,               ment subsequent to water inclusion (Machado, 2015), since
2008; Lupiano et al., 2016, 2017) are inherited by LLUN-                 the collapse of the temporary pond is abrupt. In the cases
PIY; LLUNPIY for secondary lahars is extensively defined                 of past events, data permitted simulation of the phenomenon
in Machado et al. (2015b). Here only the features of the                 just in the phase of lahar. Furthermore, in the simulation of
model, which were applied in the study cases, are reported               real and hypothesized events, all the lahars end in the Pastaza
(reduced version LLUNPIY/3r from SCIDDICA-SS2). No                       River, so the last phase of lahar deposition is omitted and the
external influences were considered. The LLUNPIY/3r sim-                 viscosity of the lahar may be considered constant for these
ulation starts considering data related to the altitude (value           particular cases.
of the “altitude” substate; see Sect. 1.2), to the depth of the
erodible pyroclastic stratum (value of the “soil of the cell”
substate; see Sect. 1.2), and to the lahar thickness (value of

www.nat-hazards-earth-syst-sci.net/20/1/2020/                                          Nat. Hazards Earth Syst. Sci., 20, 1–20, 2020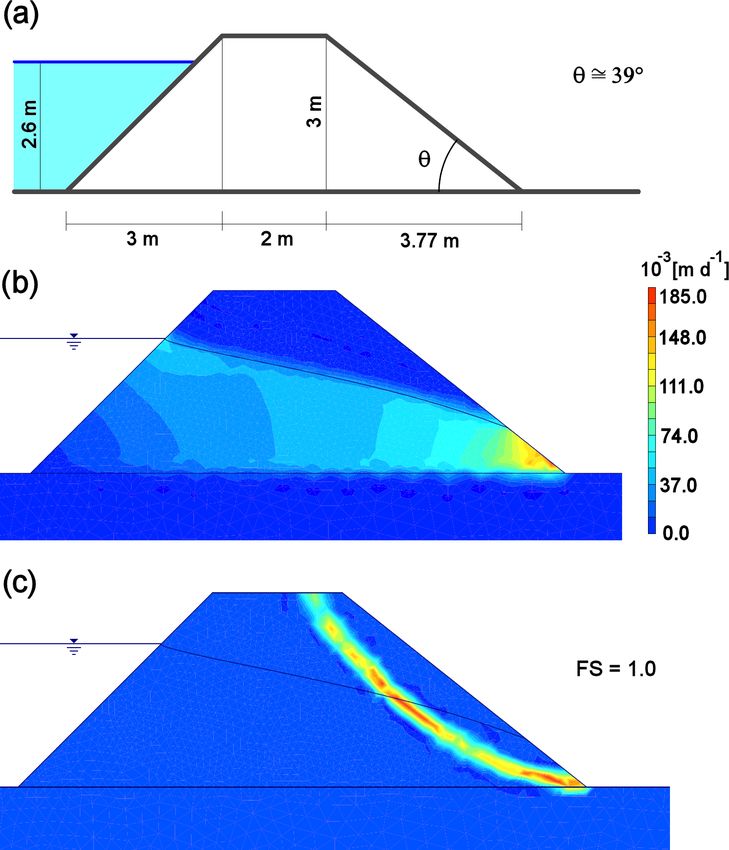
6                             V. Lupiano et al.: Risk mitigation of lahars by a cellular-automata methodology: a case study

                                                                      Figure 3. (a) The neighborhood of cell (5, 6); (b) neighborhood
                                                                      indices.

                                                                      Table 1. Physical and empirical parameters.

                                                                         Denotation        Description
                                                                         pr                Cell radius (m) (half the distance between
                                                                                           the center of the central cell and the center
                                                                                           of one of its adjacent neighbors)
                                                                         pt                Time corresponding to a MCA step (s)
                                                                         pcf               Coefficient of friction (–)
                                                                         pdt ,             Energy dissipation due to turbulence (–)
                                                                         ppe , pde , ptm   Progressive erosion (–),
                                                                                           energy dissipation due to erosion (–),
                                                                                           threshold of mobilization (m)
                                                                         pMadh , pmadh     Max and min adherence (m)
Figure 2. (a) © Google Earth view of Tungurahua volcano with
                                                                         pkhl              Loss of kinetic head (m)
indication of main localities of the study area; (b) 2005 lahar at
thermal structure “El Salado”.

                                                                         σ : Q#N → Q is the deterministic transition function for
3.1   Introduction to the LLUNPIY/3r version                          each cell in T . The following elementary processes compose
                                                                      σ , and they account for the overall dynamics of the phe-
The following quintuple defines the two-dimensional (with             nomenon:
hexagonal cells) MCA model LLUNPIY/3r:
                                                                        – τmob – effects of mobilization,
< T , P , N, Q, σ >,
                                                                        – τlo – lahar outflows,
where T = {(x, y)|x, y ∈ N, 0 ≤ x ≤ lx , 0 ≤ y ≤ ly } is the set
of hexagonal cells which tessellate the territory where the             – τte – effect of turbulence,
phenomenon evolves; the cells are individuated by the points            – τfc – composition of flows.
with integer coordinates (Fig. 3, left) of their centers. N is the
set of the natural numbers.                                           Physical parameters concern physical quantities that are used
   P is the set of both the empirical and physical global pa-         in equations of the transition function and correspond to val-
rameters. They are related to the global common features of           ues adopted in the implementation of the model (e.g., cell
the phenomenon (Table 1):                                             apothem pa that depends on several factors, data precision,
   N =< (1, −1), (0, −1), (−1, 0), (−1, 1), (0, 1), (1, 0),           and insuperable approximation limits related to specific fea-
(0, 0) >, the neighborhood, identifies the geometrical pattern        tures of the phenomenon) or values as the temporal corre-
of cells (Fig. 3a), which influences the state change of the          spondence of a CA step pt , which must account for the fact
“central” cell. Index 0 is assigned to the central cell, and in-      that pa /pt > vmx , where vmx is the maximum possible veloc-
dices 1, . . ., 6 are assigned to the six adjacent cells (Fig. 3b).   ity of flows during the development of the phenomenon. In
N = 7; the sum of indices of opposite directions is always 7.         other words the shift of a flow in a CA step may not exceed
   Q is the finite set of states of the finite-state automaton        the neighborhood value. All the parameters, except pa and
incorporated into the cell; it is specified, in terms of substates,   pt , are empirically set in the phase of model validation by
as their Cartesian product (Table 2).                                 the simulation quality, and initial values of parameters were

Nat. Hazards Earth Syst. Sci., 20, 1–20, 2020                                      www.nat-hazards-earth-syst-sci.net/20/1/2020/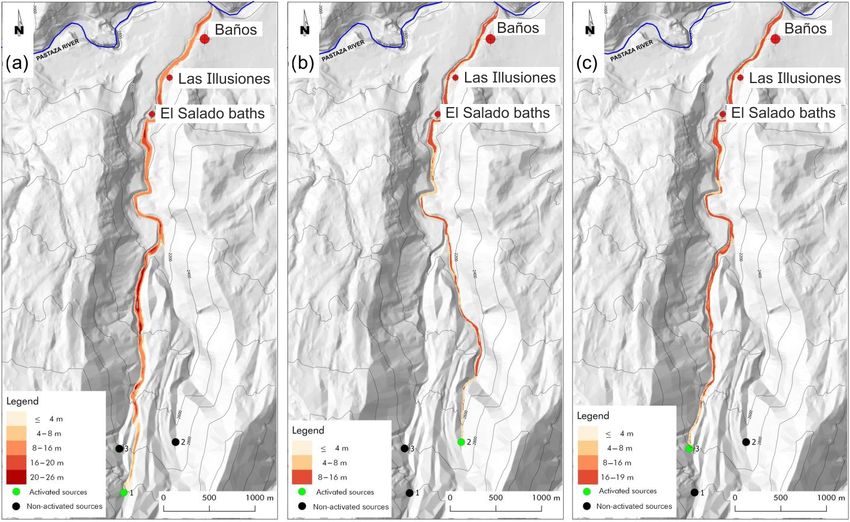
V. Lupiano et al.: Risk mitigation of lahars by a cellular-automata methodology: a case study                                        7

Table 2. Substates.                                                 in kinetic head QKH according to the following formula:

  Substates            Description                                  −1QKH = (QKH − ptm ) · pde .                                    (2)
  QA , QD,             Altitude, pyroclastic stratum depth          3.2.2    Effect of turbulence
  QLT , QKH            Lahar thickness, lahar kinetic head
                                                                    A loss of kinetic head occurs by turbulence at each LLUN-
  QX , QY              The coordinates X and Y of the lahar         PIY/3r step according to the following equation:
                       center of mass inside the cell
  QE , QEX , QEY ,     External flow normalized to a thickness,     −1QKH = pdt QKH ,                                               (3)
  QKHE                 external flow coordinates X and Y of
  (six components)     mass center, kinetic head of external        where pdt is an empirical parameter that accounts for the tur-
                       flow                                         bulence kinetic energy (Launder and Spalding, 1983). Such a
                                                                    parameter is referred to in LLUNPIY/3r as the substate QKH ,
  QI , QIX , QIY ,     Internal flow normalized to a thickness,     which is directly related to the kinetic energy.
  QKHI                 internal flow coordinates X and Y of
  (six components)     mass center, kinetic head of internal        3.2.3    Lahar outflows
                       flow
                                                                    The variables f [i], 1 ≤ i ≤ 6, specify the outflows from the
                                                                    central cell toward the adjacent cell i; f [0] is the part remain-
deduced by the physical features of the phenomenon; e.g., a         ing in the central cell. They are computed in two steps: ap-
very slow lahar would emerge unbelievably in a simulation           plication of the algorithm for the minimization of differences
by the largest values of pcf , the coefficient of friction, and     (AMD; Avolio et al., 2012; Di Gregorio and Serra, 1999) to
pdt , the energy dissipation due to turbulence.                     the “heights” in the neighborhood of the central cell and cal-
                                                                    culation of the shift of f [i], 1 ≤ i ≤ 6 (Avolio et al., 2013).
3.2     The elementary processes of LLUNPIY/3r                         AMD application computes the outflows f [i], 1 ≤ i ≤ 6,
                                                                    which minimize the height differences in the neighborhood
In the following, an outline of the transition function, with
                                                                    (Eq. 7). An alteration of height values is introduced in the
a description of the elementary processes updating the sub-
                                                                    central cell for taking into account the outflow run-up; fur-
states, will be provided. The complete execution of all the
                                                                    thermore the viscosity is modeled by an adherence “adh”
elementary processes accomplishes a step of the LLUN-
                                                                    term, the lahar quantity, which cannot leave the central cell. It
PIY/3r. The neighborhood index in square brackets, follow-
                                                                    varies between the two extreme values adh1 and adh2, which
ing substate specification, indicates the corresponding cell
                                                                    depend on the composition of the pyroclastic debris at the
of the neighborhood. 1QS indicates variation in the sub-
                                                                    maximum and minimum water content (Machado, 2015).
state QS . Q0S indicates the new value of the substate QS ,
                                                                       This adherence method was initially used for modeling
Q0S = QS + 1QS . In the case of external and internal flows,
                                                                    lava flows by CA in order to manage the continuous variation
the cell to which the flow is directed is specified in the sub-
                                                                    in viscosity by cooling of lava (e.g., Avolio et al., 2006). The
state, inserting a subscript which precedes it, e.g., 2 QE [1],
                                                                    approximation to account for viscosity in a CA context can
or the external flow of the neighbor with index 1 toward its
                                                                    be intuitively explained as follows. Without bringing a sys-
neighbor with index 2.
                                                                    tem into play in which innumerable fluid layers flow over one
3.2.1    Pyroclastic cover mobilization                             another, at most two layers are considered. The first layer,
                                                                    whose maximum thickness (adh) is determined by the co-
Soil features together with the quantity of water content de-       efficient of viscosity, cannot move if the thickness of fluid
termine a value ptm of the mobilization threshold to be com-        th exceeds adh, and a second layer with thickness th-adh is
pared with the kinetic head QKH associated to lahar debris          considered to slide onto the first one with a friction coeffi-
QLT ; when QKH > ptm , the pyroclastic cover QD is eroded,          cient related to viscosity:
and the lahar thickness QLT augments and altitude QA di-
minishes according to the following empirical formula that          h[0] = QA [0] + QKH [0] + adh,                                  (4)
turned out to be valid in different models of debris flow           h[i] = QA [i] + QLT [i], (1 ≤ i ≤ 6),                           (5)
(e.g., Avolio et al., 2008), snow avalanches (Avolio et al.,                              X
                                                                    q = QLT [0] − adh =       f [i]                                 (6)
2017), and primary and secondary lahars (e.g., Machado,                                         0≤i≤6
2015):                                                                      X
                                                                                        (| (h[i] + f [i]) − (h[j ] + f [j ]) |) .   (7)
−1QD = 1QLT = −1QA = (QKH − ptm ) · ppe .                     (1)   {(i,j )/0≤i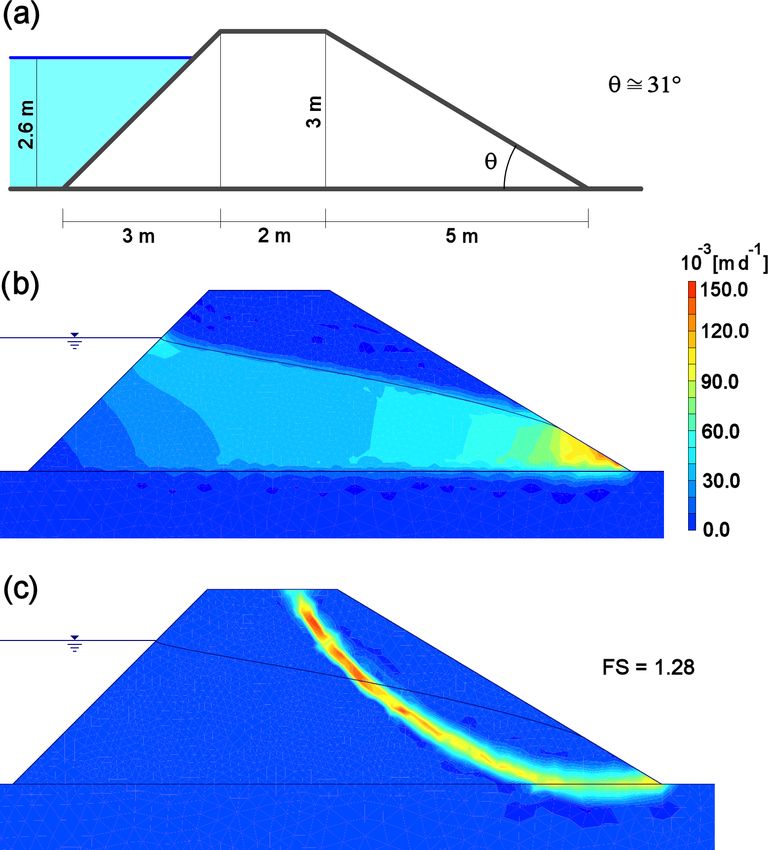
8 V. Lupiano et al.: Risk mitigation of lahars by a cellular-automata methodology: a case study
the neighbors:
6
X
Q0LT [0] = QLT [0] + (7−i QE [i] −i QE [0]) .
i=1
The other substates change correspondingly, considering a
weighted average
Figure 4. Outflow direction from central cell to the center of an Q0KH [0] =
adjacent cell in three dimensions. 6
P
QKH [0] · QLT [0] + (7−i QKHE [i] ·7−i QE [i] −i QKHE [0] ·i QE [0])
i=1
.
6
P
entirely inside the cell, having a center of mass with coor- QLT [0] + (7−i QE [i] −i QE [0])
i=1
dinates QX [0] and QY [0] and with the maximum possible
radius. The shifts, both of the external flows and internal flows, have
The shift “sh[i]” of f [i] is calculated according to the fol- to be considered for the new values of coordinate substates:
lowing formulae, where the movement of the mass center is
Q0X [0] =
specified as the mass movement on a constant slope with a !
constant coefficient of friction pcf . The movement of f [i] is QX [0] · QLT [0] −
6
P
(i QI [0]) +
6
P
(7−i QEX [i] ·7−i QE [i] +i QIX [0] ·i QI [0] −i QEX [0] ·i QE [0])
i=1 i=1
directed towards the center of cell i with coordinates QX [i] 6
P
,
QLT [0] + (7−i QE [i] −i QE [0])
and QY [i], considering the slope angle θ [i] (Fig. 4): i=1
Q0Y [0] =
sh [i] = v · pt + g (sin θ [i] − pcf cos θ [i]) pt2 /2
!
6
P 6
P
QY [0] · QLT [0] − (i QI [0]) + (7−i QEY [i] ·7−i QE [i] +i QIY [0] ·i QI [0] −i QEY [0] ·i QE [0])
i=1 i=1
.
(1 ≤ i ≤ 6), (8) QLT [0] +
6
P
(7−i QE [i] −i QE [0])
i=1
with “g” being the acceleration of gravity and “v” being the 3.3 LLUNPIY calibration and validation
initial velocity,
p We selected the 2005 and 2008 lahars of Vascún valley
v= (2g · QKH [0]). (9) for LLUNPIY/3r version calibration and validation, respec-
tively. Available data, although incomplete, of the flood
There are three possible outcomes: if the shifted cylinder phase (Machado et al., 2015b) seemed promising in obtain-
is completely inside (outside) the central cell, there is only ing reliable simulations. In fact, data of different sources
an internal (external) outflow. Otherwise two cylinders form, were carefully compared and analyzed (Williams et al., 2008;
with the mass center corresponding to the mass center of the IGEPN, 2008a, b) in order to reconstruct the two events as
internal outflow and that of the external outflow. The new po- accurately as possible (Machado et al., 2015a, b).
sitions (i QEX [0] and i QEY [0] and i QIX [0] and i QIY [0]) of The use of simulation tools (from the cellular-automata
external and internal outflow i QE [0] and i QI [0] account also model LLUNPIY) requires detailed field data: the digital el-
for the variations in kinetic head i QKHE [0] and i QKHI [0]. evation model (DEM) and depth of erodible pyroclastic stra-
tum. This implies accurate geological investigations, includ-
3.2.4 Flow composition ing subsoil tomography. Geophysical surveys allow individ-
uating points where dams by backfill, which are easy to col-
Execution of the elementary process “lahar outflows” in- lapse, can enable the formation of ponds, whose breakdown
volves an updating of substates QLT , QKH , QX , and QY by can trigger a lahar (Machado, 2015; Chidichimo et al., 2016).
the elementary process “flow composition”. It accounts for The simulation of the 2005 event is based on a DEM with
the variation in the lahar content of the cell, i.e., variation in a 1 m cell size (supplied to us by Gustavo Cordoba), while
QLT and corresponding variation in QKH , QX , and QY that the 2008 lahar was performed with a DEM with a 5 m cell
is determined by the external outflows QE ; these represent size (supplied by IGEPN). In both cases a uniform thickness
inflows for the cells to which they are directed. Internal out- of 5 m was imposed for detrital cover because detailed sur-
flows QI determine just a shift inside the cell, with variations veys were not available. This introduces a series of approx-
in the substates QKH , QX , and QY (Machado et al., 2015a, imations that negatively influence the results of simulations.
b). Such approximations can be reduced by an opportune survey
The value of the substate QLT at the next step is given by of field data, e.g., by soil tomography, multichannel analysis
its previous value minus the losses determined by the out- of surface waves (MASW), coring, etc.
flows i QE [0] from the cell (normalized to a thickness) plus The same set of LLUNPIY/3r parameters was used in the
the contributions determined by the inflows 7−i QE [i] from two cases except for the parameter of progressive erosion
Nat. Hazards Earth Syst. Sci., 20, 1–20, 2020 www.nat-hazards-earth-syst-sci.net/20/1/2020/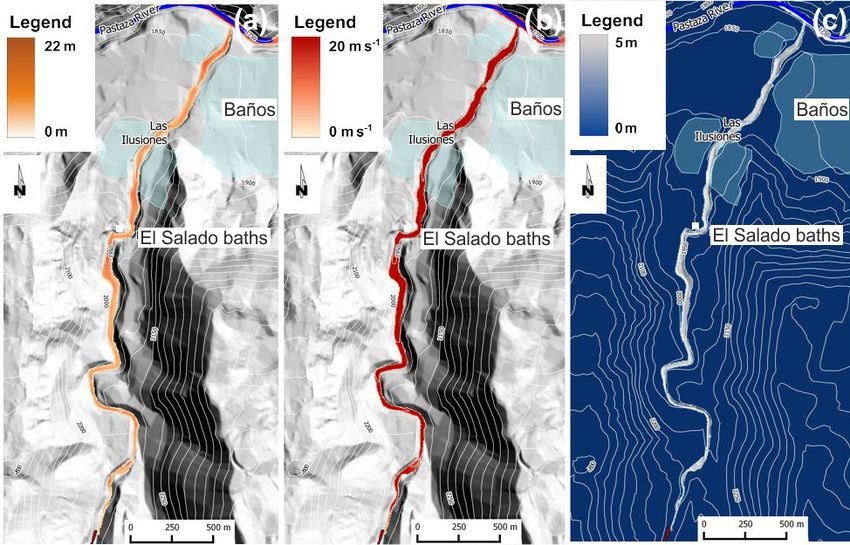
V. Lupiano et al.: Risk mitigation of lahars by a cellular-automata methodology: a case study                                    9

(ppe ) because of different percentages of water in the soil.          The simulation of the 2008 lahar is shown in Fig. 6: the
The 2005 event was triggered in a higher and very steep zone        flow speed reached values up to 20 m s−1 in many areas of
of Vascún River, when the water concentration in the soil           the valley, and the eroded material resulted in a volume of
reached critical values due to rainfall. The 2008 event was         about 970 000 m3 . The maximum height obtained in the sim-
dissimilar because the breaking of a temporary pond sud-            ulated flow (Fig. 6a), in some sectors where the valley is par-
denly released a larger water quantity (in comparison with          ticularly narrow, is 22 m, while the estimated average value
2005 case) with strong turbulence, whose effects correspond         by IGEPN (2008a, b) is 4 m.
to a higher value of the parameter of progressive erosion              Table 4 compares some data of the simulation by LLUN-
(Machado et al., 2015b).                                            PIY with corresponding field data of IGEPN (2008a, b). It is
   The results of the simulations of the 2008 event (Machado        possible to note that the data derived from the simulations are
et al., 2015b) are extensively reported in this study, since this   not very different from the known measured ones. The flow
event, as previously mentioned, was caused by the same type         velocity of 15 m s−1 represents an estimated value and not a
of phenomenon whose development we want to forecast. The            measured one. These results demonstrate that LLUNPIY/3r
reliability of the simulation results, in comparison with the       is a reliable model given that the simulations are based on
real event, led us to confide in the goodness of the method.        incomplete and sometime very approximate data concerning
The new simulations were performed with the same data pre-          the pre-event and post-event. Furthermore the inevitable er-
cision and the same values of parameters.                           rors, in the records related to this event, have to be consid-
   Simulations of the 2005 event were limited by the par-           ered. Therefore an extension of LLUNPIY/3r is promising
tial data field and digital terrain model (DTM) information:        in order to introduce secondary features of the phenomenon
a stretch of about 2.3 km, from an elevation of 2150 m a.s.l.       to be tested. Simulations reproduce satisfactorily the over-
(about 850 m upstream of El Salado baths) to an elevation of        all dynamics of the events: there is good matching between
1900 m a.s.l. (in correspondence of Pastaza River), was con-        the real and simulated lahar path and the velocity and height
sidered. The area where the simulation starts does not con-         of detrital flow. Note that different approaches always obtain
cern the detachment phase that occurs 8 km upriver. A kind of       excellent results about the path because the lahar is canalized
detachment where an initial velocity of 7 m s−1 was imposed         by steep faces.
to lahar was considered in order to express the first arrival
of lahar flows. An equivalent fluid approach was adopted be-
cause precise data about water flows are not available. There-      4     Lahar triggering and effects
fore, bulking must account not only for the erodible layer but
                                                                    4.1    Building rudimental dams that are easy to collapse
also for water inclusion. The total mass is inclusive of the
water mass. This generates a discrepancy between the lahar
                                                                    Ponds form along watercourses in volcanic areas, when land-
volume, measured on the deposit, and the “fluid” lahar vol-
                                                                    slides of volcanic deposits, which are originated by pyroclas-
ume including water to be lost in the last part of the event.
                                                                    tic flows and lahars, act as a dam by obstructing the stream
   Figure 5 shows the simulation developed with LLUNPIY
                                                                    bed. The most frequent cause of a breakout of such natural
in the considered sector. In particular, the maximum debris
                                                                    ponds is the overflow of water across the newly formed dam
thickness values, which were reached by the lahar in simu-
                                                                    during violent rainfall and subsequent erosion and rapid cut-
lation, are reported in Fig. 5a. Maximum velocities, reached
                                                                    ting down into the loose rock debris. The classification of
by simulated flows (Fig. 5b), are high in steeper areas (the
                                                                    the Glossary of Meteorology of the American Meteorolog-
expected result) and gradually decrease at the downstream
                                                                    ical Society for rainfall intensity (Glickman, 2000) is here
outlet. A velocity increase occurs south of Baños, probably
                                                                    adopted according to the rate of precipitation Rp (measured
because of the higher gradient of the river bed. Erosion has
                                                                    in mm h−1 ):
a trend similar to that of velocity (Fig. 5c). Table 3 synthe-
sizes values of Fig. 5 and compares such data with IGEPN                – light rain – Rp < 2.5 mm h−1 ,
field data, reported in IGEPN 2005, and with simulation per-
formed by TITAN2D (Williams et al., 2008). Such field data              – moderate rain – 2.5 mm h−1 ≤ Rp < 10 mm h−1 ,
are obviously a part of the complete development of catas-
                                                                        – heavy rain – 10 mm h−1 ≤ Rp ≤ 50 mm h−1 ,
trophic phenomenon but extremely precious for the compar-
ison with our simulations. Observation data are not sufficient          – violent rain – Rp > 50 mm h−1 .
for a precise comparison with the simulation paths. Further-
more, the lahar starts with null velocity in the simulation of      Dam collapse occurs when instable conditions arise on the
(Williams et al., 2008), while LLUNPIY simulations start            downstream slope. By eroding the obstruction and flowing
with 7 m s−1 velocities. The difference for total eroded mass       downstream along the river bed, the initial surge of water
rises from the lost water volume that was not possible to be        will incorporate a dangerous volume of sediments. This can
considered in measurements.                                         easily produce lahars, with possible devastating effects for
                                                                    settlements in their path (Leung et al., 2003).

www.nat-hazards-earth-syst-sci.net/20/1/2020/                                     Nat. Hazards Earth Syst. Sci., 20, 1–20, 2020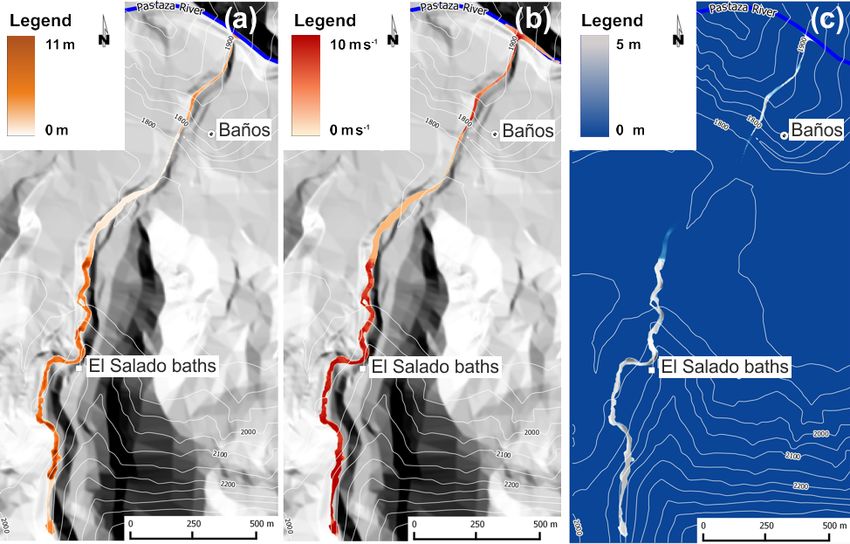
10                           V. Lupiano et al.: Risk mitigation of lahars by a cellular-automata methodology: a case study

Figure 5. (a) Maximum thickness, (b) maximum velocity, and (c) erosion depth, in 2005 simulated event.

Table 3. Comparison among field data and TITAN2D and LLUNPIY simulation data.

                                                                    Field data         Simulations output   Simulation output
                                                                                       TITAN2D              LLUNPIY/r3
         Mean velocity between seismic station and AFM              7 m s−1            –                    –
         Mean velocity between AFM and El Salado                    3.10 m s−1         –                    –
         Velocity at El Salado                                      3.1 m s−1          5.8–8.9 m s−1        3.1 m s−1
         Velocity at final point (Las Ilusiones)                    –                  1.1–2.6 m s−1        3 m s−1
         Time between AFM station and El Salado                     160                –                    –
         Time between start point and El Salado                     –                  –                    6–70
         Time between El Salado and Las Ilusiones                   –                  –                    140
         Total time between start point and Las Ilusiones           –                  ∼ 8–140              200
         Eroded debris between start point and El Salado            –                  –                    38 000 m3
         Eroded debris between El Salado and Las Ilusiones          –                  –                    71 000 m3
         Total lahar volume between start point and Las Ilusiones   55 000/70 000 m3   50 000/70 000 m3     109 000 m3

                                                                           Temporary dams with a similar (but controlled) behav-
Table 4. Comparison between field and LLUNPIY simulation data.         ior can be designed and built at low cost by local backfill
                                                                       in order to allow the outflow of streams produced by reg-
                                       Field data    LLUNPIY           ular rainfall events. This result is achieved by properly di-
                                                     output            mensioning the embankment according to a stability analy-
 Maximum velocity                      15 m s−1      20 m s−1          sis. This is made by comparing the forces tending to cause
 Velocity at El Salado                 4.7 m s−1     6 m s−1           movement of the mass of pyroclastic material (force of wa-
 Time between start point and El       50            40 5000           ter) with those tending to resist the movement (soil strength;
 Salado bath                                                           Lambe and Whitman, 1979). The aforementioned approach
 Maximum flow between start point      640 m3 s−1    633 m3 s−1        is traditionally adopted to prevent dams failure, but it will be
 and El Salado                                                         used, in this case, to ensure their collapse at a specific water
 Total time between start point and    –             90                level. During rainfall events, in fact, the barred canal section
 Pastaza River
                                                                       fills up rather quickly, so the hypothesis behind the simula-
 Total eroded debris                   –             970 000 m3
                                                                       tions is that the dam reaches the instability conditions for the
                                                                       achievement of a given hydraulic head rather than for other

Nat. Hazards Earth Syst. Sci., 20, 1–20, 2020                                      www.nat-hazards-earth-syst-sci.net/20/1/2020/
V. Lupiano et al.: Risk mitigation of lahars by a cellular-automata methodology: a case study 11
Figure 6. The 2008 simulated event. (a) Maximum thickness, (b) maximum velocity, and (c) erosion depth.
processes (e.g., erosion), since the first destabilizing condi- the problem is solved again. The lowest FSn producing non-
tion is reached faster than the others which require longer convergence is reported as the “factor of safety” of the prob-
times to be effective. lem. If the resulting FS is greater than 1, for a given water
The FEM was applied to perform the downstream slope level stressing the upstream slope of the dam, the structure
stability analysis. The shear strength reduction (SSR) ap- is stable. If the iterative procedure gives back a unitary FS
proach, which is one of the most popular techniques to per- value, the limit equilibrium conditions have been reached.
form FEM slope analysis, was adopted (Griffiths and Lane, This means that the coupling of both the dam geometrical
1999). The SSR is simple in theory: it systematically reduces configuration and the water level situation are going to pro-
the shear strength envelope of material by a factor of safety duce the collapse of the structure. This last condition is the
(FS) and computes FEM models of the slope until deforma- one that must be reached for the study purposes. The pore
tions are unacceptably large or solutions do not converge. In pressure distribution inside the dam body is fundamental in-
classical soil mechanics, the factor of safety is the ratio of put for the strength reduction analysis. Such distribution is
the shear strength at the plane of potential failure τf and the obtained as a function of the hydraulic head stressing the
shear stress acting in the same plane τ , namely upstream slope of the embankment. The filtration process,
implemented in the finite element model, is based on the so-
FS = τf /τ. (10) lution of the Laplace equation (Straface et al., 2010, 2011;
Molinari et al., 2014; Chidichimo et al., 2015, 2018):
For the Mohr–Coulomb criterion, the previous equation reads
∇ 2 h = 0, (14)
FS = (c + (sn − u) · tan φ) /τ, (11)
where h(x, y) represents the hydraulic head distribution
where c is the cohesion and φ is the friction angle of the within the dam body, which is a function of the hydraulic
material; sn denotes the total normal stress and u the pore conductivity of the dam material. Such dependence is defined
pressure. For the Mohr–Coulomb model, a “reduced” set of by Darcy’s law:
material parameters c∗ and φ ∗ is computed:
d u
c∗ = c/FSn , (12) q = −K∇h = −K +z , (15)
dl ρg
∗
tan φ = tan φ/FSn . (13)
where q is Darcy’s velocity, K is the hydraulic conductiv-
The problem is then solved using this set of reduced material ity, ρ is the water density, u is the pore pressure, and z is
parameters while keeping all other parameters unchanged. the elevation above sea level. Several simulations were per-
If convergence is obtained, the FSn value is increased and formed by taking the parameters for the numerical model
www.nat-hazards-earth-syst-sci.net/20/1/2020/ Nat. Hazards Earth Syst. Sci., 20, 1–20, 202012 V. Lupiano et al.: Risk mitigation of lahars by a cellular-automata methodology: a case study
from the literature. Studies performed on the geotechnical
properties of the volcaniclastic formation that is found in the
Andes of Ecuador and Colombia, known as Cangahua, re-
ported that the dry unit weight of the material was found to
range around 14 kN m−3 (Bommer et al., 2002). The strength
parameters of volcanic sediments produced by recent erup-
tions were investigated by Orense et al. (2006), who found
a value for the friction angle (φ) of these materials of about
40◦ , while the cohesion (c) is close to zero. The hydraulic
conductivity (K) of pyroclastic beds was discovered to range
between 10−4 and 10−5 m s−1 (Burgisser, 2012). A middle-
range value was adopted to implement the numerical mod-
els. The relatively high permeability of the pyroclastic ma-
terial ensures the water outflow during the regular rainfall
regimen. In case of extreme rainfall events (violent rains, ty-
phoons, etc.), the volcanic material is no longer able to drain
the water inflow, producing the water level rise which will
undermine the structural stability. The dams were thought to
reach a height of 3 m and to hold up to a maximum water
level of 2.6 m. Assuming the aforementioned features, the
first step started from the design of a stable dam configura-
tion (Fig. 7a). This outcome was obtained by trying different
dimensioning solutions in order to avoid the early collapse of
the structure due, for example, to its own weight. Figure 7b Figure 7. (a) Cross-sectional sketch of a stable dam with the main
shows the water velocity field in the dam cross section, while elements dimension, (b) water velocity field moving in the dam
Fig. 7c shows the breaking surface causing the failure of the body and associated phreatic surface, and (c) breaking surface gen-
downstream slope, which is generated by a factor of safety erated by a factor of safety of 1.28.
of 1.28.
Once a stable dam was obtained for the chosen working
conditions, the second step was to repeat the strength reduc- particular, the 2008 event is very important in order to con-
tion analysis several times by slowly increasing the inclina- firm the value of the model parameters, tuned in the simu-
tion of the downstream slope until a unitary FS was reached. lation even where the cause of the lahar was the breakdown
The inclination was increased using the corner between the of a temporary pond, generated by a small landslide. Those
downstream slope and the dam crest as a pivot point. This successful simulations permitted having confidence in the
resulted in a gradual increase in the θ angle and a consequent scenarios which could be realized by new simulations. Of
reduction of the dam base. Figure 8 shows the analysis final course, a very accurate update of geological data (DEM or
result, with the sizing specifications for an easy-to-collapse DTM, detrital cover depth, etc.) and sufficient geophysical
dam built in volcaniclastic material. To ensure a greater con- surveys are indispensable for applications aimed at lahar risk
trol over the natural dam collapse timing, a discharge channel mitigation.
can be arranged at the dam base. The degree of openness of An initial study on the potentiality of applying mitigation
this channel can be adjusted according to the flow rate val- measures in the Vascún valley was performed by triggering
ues observed during the extreme rainfall events recorded over lahars of a planned size (the lahar level is here considered
time in the area in order to delay the achievement of the trig- to be the relevant datum) through the controlled collapse of
gering hydraulic head. This ploy may be necessary to avoid rudimentary ponds.
the undesired simultaneous collapse of different dams; the A preliminary analysis of the principal canyons of the
hazard could increase when different lahars are triggered at Vascún valley was carried out in order to individuate fa-
short time intervals and reach the confluence points almost at vorable points for positioning embankments as dams. Three
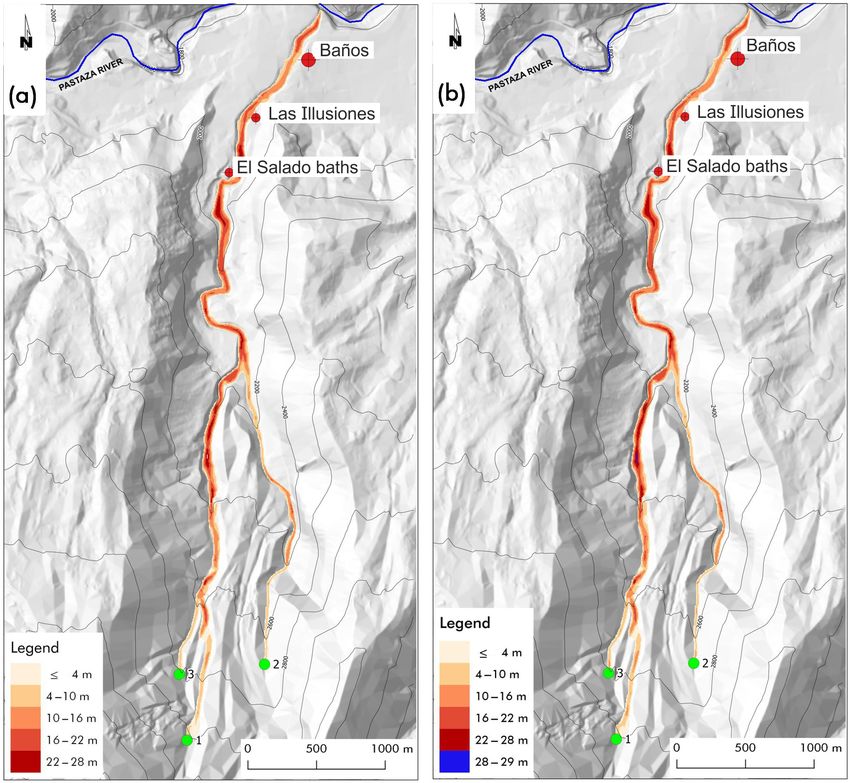
the same time. points were chosen for building temporary dams: one located
in Vascún River (point 1 in Figs. 9, 10, 11, and 12), the sec-
4.2 Preliminary hypotheses and results of simulations ond located in one of its tributary to the right (point 2 in
Figs. 9, 10, 11, and 12), and the third located in a tributary to
LLUNPIY was calibrated and validated for secondary lahars the left (point 3 in Figs. 9, 10, 11, and 12). Vascún River in
by simulating the two events of 12 February 2005 and 22 Au- turn is a tributary of the much broader Pastaza River, where
gust 2008, which occurred in the Vascún valley of Tungu- lahars of Vascún valley disperse. Simulations concern the la-
rahua volcano in Ecuador (Machado et al., 2014, 2015b). In hars generated in the points 1, 2, and 3 (Figs. 9, 10, 11, and
Nat. Hazards Earth Syst. Sci., 20, 1–20, 2020 www.nat-hazards-earth-syst-sci.net/20/1/2020/V. Lupiano et al.: Risk mitigation of lahars by a cellular-automata methodology: a case study 13
coincide at the confluence point, but the maximum thickness
of the lahar in the former scenario is 27 m, while the smaller
value of 21 m is detected in the latter scenario. The analysis
of the two simulations showed that a much larger mass was
eroded in the first part of the path from the point 1 in the for-
mer case. This unexpected result permits planning an oppor-
tune strategy according to the degree of control for triggering
lahars 1, 2, and 3 from the three respective points. If trigger-
ing can be well controlled with moderate or heavy rainfall,
then the best choice is to trigger lahar 3 (smaller erosion)
before lahar 1 so that lahar 3 anticipates part of the erosion
process in the common path of both the lahars (1 and 3) as far
as the confluence point and reduces, consequently, the thick-
ness of lahar 1. When the peak of lahar 3 goes beyond the
confluence point, then lahar 2 can be triggered before lahar
1, which has to be generated as late as possible. Anyway, the
last lahar to be triggered has to be surely lahar 1, but a further
investigation is necessary to better understand the priority be-
tween lahar 2 and 3; the study of single lahars generated in
points 1, 2, and 3 could solve the question, as it may be de-
duced by the following simulations.
Lahar 1 causes the maximum erosion, with a maximum
thickness of 26 m because it follows the path of Vascún River,
Figure 8. (a) Cross-sectional sketch of an instable dam with the which is the main river in the valley (with a larger volume
main elements dimension, (b) water velocity field moving in the of pyroclastic cover to be eroded); lahar 3 shares a relevant
dam body and associated phreatic surface, and (c) breaking surface part of the previous path and reaches a maximum thickness
generated by a unitary factor of safety. of 19 m, while lahar 2, whose path is shorter before its late
confluence into Vascún River, involves the smallest erosion
(maximum thickness of 16 m). Such results solve the doubt
12), in short, lahar 1, 2, and 3. The same initial volume of that we put forward with the first simulations.
the 2008 event was selected for all the simulations except An “cleaning” operation of pyroclastic cover could be pro-
the last one. Three initial points permit the analysis of an jected by initially triggering lahar 2, with a first mobilization
almost-exhaustive set of possible conditions; we performed a of the detrital cover also for the area related to the last part
sequence of simulations by LLUNPIY/3r, of course, with the of Vascún River from the confluence point of lahar 2 (maxi-
same parameters values of the successful simulation of the mum thickness 16 m; Fig. 10b). When lahar 2 dissolves into
29 August 2008 event. We present here some selected simu- Pastaza River, lahar 3 could be triggered with a first erosion
lations that appear to be interesting for many considerations, of the detrital cover between the confluence points of lahars
which may be deduced by their analysis. 2 and 3 into Vascún River so that the maximum thickness
Initially, we considered two scenarios in order to investi- does not exceed 16 m (Fig. 10c). The most dangerous lahar
gate the effects of simultaneous and time-varying confluence 1 of Vascún River could then start at the exhaustion of lahar
of two lahars, the results of such simulations caused us to 3, minimizing the hazard; the maximum thickness before the
consider a larger set of cases. The former is generated by confluence of lahar 3 into Vascún River does not exceed 22 m
the simultaneous triggering from the points 1 with a detach- (Figs. 9a and 10a).
ment volume of 4875 m3 and 2 with a detachment volume We tested successfully the outcomes of this strategy by
of 4500 m3 (Fig. 9a), and the latter is generated by the si- simulating the triggering of the three lahars in successive
multaneous triggering from the points 2 with the same previ- times, each one immediately after the exhaustion of the pre-
ous detachment volume and 3 with a detachment volume of vious one; the first phase concerns lahar 2 (Fig. 10b). The
4250 m3 (Fig. 9b). The confluence of the lahars in the Vascún maximum thickness does not exceed 14 m in the last part of
River (for the following the confluence point) is almost si- the path, from north of El Salado baths to south of Baños.
multaneous in the latter scenario because of the similar dis- The erosion depth of pyroclastic cover, after lahar 2 ex-
tance between the triggering points and the confluence point. haustion, prevents the maximum thickness of the successive
The situation is diverse for the former scenario because the lahar 3 to exceed 10–12 m after the confluence point with
distances of the triggering points from the confluence point lahar 2 (Fig. 11a) because of the reduced pyroclastic cover,
are very different. Intuitively the former case would be less while 19 m are reached by triggering only lahar 3 (Fig. 10c).
dangerous because the flood peaks of the two lahars cannot
www.nat-hazards-earth-syst-sci.net/20/1/2020/ Nat. Hazards Earth Syst. Sci., 20, 1–20, 2020You can also read