Journal of Dredging - Western ...
←
→
Page content transcription
If your browser does not render page correctly, please read the page content below
Journal of Dredging
                         Volume 19, No. 1, January 2021 (ISSN 2150-9409)
                        Official Journal of the Western Dredging Association
                                   (A Non-Profit Professional Organization)

Discharge of navigation dredged material from the Dodge Island for beneficial use on Egmont Key, Florida. Photo courtesy of
Coraggio Maglio, US Army Corps of Engineers.

                       Produced and printed by the Western Dredging Association (WEDA)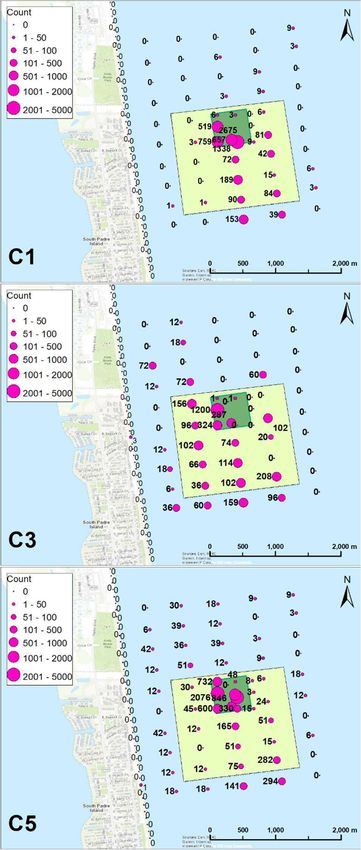
CONTENTS
Journal of Dredging Editorial Board ........................................................................................... ii

Western Dredging Association Board of Directors ..................................................................... ii

Editor’s Note .............................................................................................................................. iii

Environmental Benefits Realized during Navigation Maintenance Dredging: A Case
Study in the Indian River Lagoon, Florida
by C. Maglio, R. Weaver, J. Trefry, C. Bostater Jr., J. Shenker, K. Johnson, S. Trulock, J.
Ousley, P. Cotter, P. DeMarco, R. Trocine, A. Fox, and S. Fox ................................................. 1

Particle Tracer Analysis for Submerged Berm Placement of Dredged Material Near
South Padre Island, Texas
by J. Figlus, Y. Song, C. Maglio, P. Friend, J. Poleykett, F. Engel, D. Schnoeblen, and K.
Boburka ..................................................................................................................................... 14

Aims and Scope of the Journal ................................................................................................... 31

Notes for Contributors................................................................................................................ 31

                                                                       i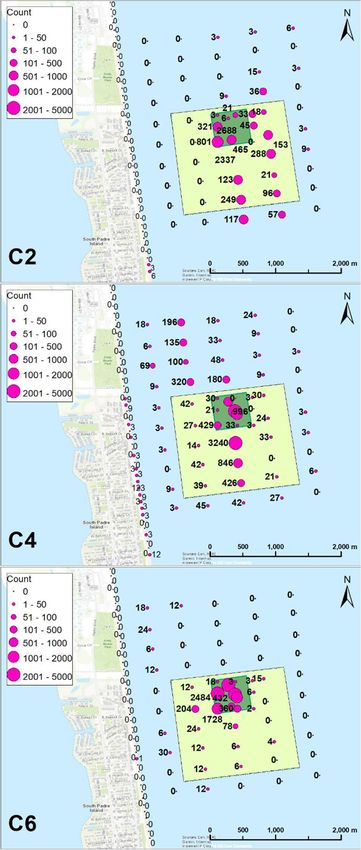
© 2021 Western Dredging Association                                  WEDA Journal of Dredging, Vol. 19, No. 1

                      JOURNAL OF DREDGING EDITORIAL BOARD
 Dr. Donald Hayes (Editor), Engineering Research and Development Center, Vicksburg, MS
 Dr. Todd Bridges (Associate Editor), Engineering Research and Development Center, Vicksburg, MS
 Dr. Michael Palermo (Associate Editor), Consultant, Durham, NC
 Dr. Robert Randall (Associate Editor), Texas A&M University, College Station, TX
 Mr. Alan Alcorn, Moffatt & Nichol, San Diego, CA
 Mr. Matt Binsfeld, JF Brennan, La Crosse, WI
 Mr. Steve Garbaciak, Foth Infrastructure & Environment, Glen Ellyn, IL
 Ms. Rebecca Gardner, Anchor QEA, LLC, Seattle, WA
 Mr. William Hanson, Great Lakes Dredge & Dock Company, Chicago, IL
 Dr. Ram Mohan, Anchor QEA, LLC, Horsham, PA
 Mr. Roger Santiago, Environment Canada, Toronto, ON
 Mr. Tim Welp, Engineering Research and Development Center, Vicksburg, MS
 Mr. Steven Wolfe, U.S. Army Corps of Engineers, Concord, MA

                              WESTERN DREDGING ASSOCIATION
                                      BOARD OF DIRECTORS
 Mr. Alan Alcorn (President/Chair), Moffatt & Nichol, San Diego, CA
 Mr. Matt Binsfeld (Vice President), JF Brennan Company, La Crosse, WI
 Mr. Walter Dinicola (Treasurer), Anchor QEA, LLC, Baltimore, MD
 Ms. Carol Shobrook (Secretary), J.T. Cleary, Inc., Chestnut Ridge, NY
 Dr. Shelly Anghera (Director), Moffatt & Nichol, Carlsbad, CA
 Dr. Todd Bridges (Director), Engineering Research and Development Center, Vicksburg, MS
 Mr. Chuck Broussard (Director), Weeks Marine, Inc., Covington, LA
 Ms. Lori Brownell (Director), Port of Houston, Houston, TX
 Mr. Steve Cappellino (Director), Anchor QEA, LLC, Mission Viejo, CA
 Mr. Jos Clement (Director), CEDA Dredging & Fluid Management, Edmonton, Canada
 Mr. Paul Fuglevand (Director), Dalton, Olmstead & Fuglevand, Inc., Kirkland, WA
 Dr. Donald Hayes (Director), Engineering Research and Development Center, Vicksburg, MS
 Ms. Julie Hile (Director), Hile Group, Normal, IL
 Ms. Janet Kirkton, (Director) Caterpillar, Peoria, IL
 Mr. Robert Ramsdell (Director), Dredging Resources, Downers Grove, IL
 Mr. Steve Shaw, (Director), Sevenson Environmental, Baltimore, MD
 Mr. Dana Trierweiler (Director), Infrastructure Alternatives, Rockford, MI
 Mr. Craig Vogt (Director), Consultant, Hacks Neck, VA
 Mr. Michael Warwick (Director), Manson Construction Co., Jacksonville, FL
 Mr. Marcel Hermans* (Ex-Officio Board Member), Port of Portland, Portland, OR
 Mr. John Vannoy* (Ex-Officio Board Member), Orion Marine, Houston, TX
 Mr. Raul Figueroa* (Ex-Officio Board Member), Panama Canal Authority, Panama
 Mr. Zach Kimmel* (Ex-Officio Board Member), USACE, Onalaska, WI
 Mr. Andrew Timmis* (Ex-Officio Board Member), JF Brennan Company, Braintree, MA
 Mr. Ricardo Hernandez Perez* (Ex-Officio Board Member), Grupo MH, Mexico
 Mr. Jan Van Den Driessche* (Ex-Officio Board Member), Jan De Nul, Buenos Aires, Argentina
 * Non-Voting Board Members

                                                ii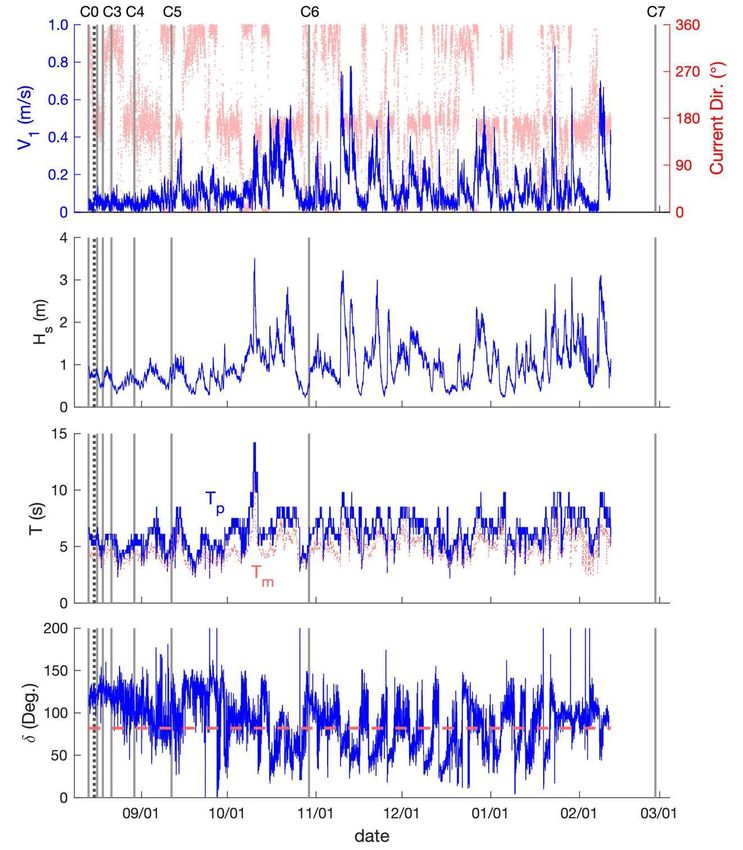
© 2021 Western Dredging Association                                    WEDA Journal of Dredging, Vol. 19, No. 1

                                      EDITOR’S NOTE
 There seems to be a sea change on its way regarding beneficially using dredged sediment,
 especially from navigation channels. The Federal Standard has often been cited as a significant
 barrier to beneficial use in the U.S. It has been interpreted as requiring comparison of only direct
 costs when comparing sediment management options. Section 125 of Water Resources
 Development Act (WRDA) 2020 allows more inclusive considerations of costs and values that
 should be considered as part of the Federal Standard. This expansion could significantly change
 the way sediment management alternatives and potentially increase beneficial use in the U.S.

 This issue of WEDA’s Journal of Dredging starts with a paper that highlights water quality
 benefits that can result from dredging nutrient rich sediments from channels and waterways.
 Nutrient-rich sediments are problematic for many waterbodies. The second paper continues our
 focus on beneficial use of dredged sediments. This manuscript describes the results of a particle
 tracing study conducted during the construction of an underwater feeder berm near South Padre
 Island, Texas.

 Documenting examples of beneficial use projects in the Journal of Dredging could not be timelier
 whether successful or not. Two additional papers on beneficial use are under review for the next
 issue of the Journal.

 Familiar with other beneficial use projects that deserve documentation? The Journal of Dredging
 welcomes manuscripts on beneficial use and all aspects of dredging and dredged material
 management, including those related to cost, environmental compliance, and other important
 issues. If you have questions, please inquire. I gladly help authors determine the best way to
 document their projects.

 I am wishing us all of us a prosperous 2021!

 Don Hayes
 Editor, WEDA Journal of Dredging
 January 2021

                                                 iii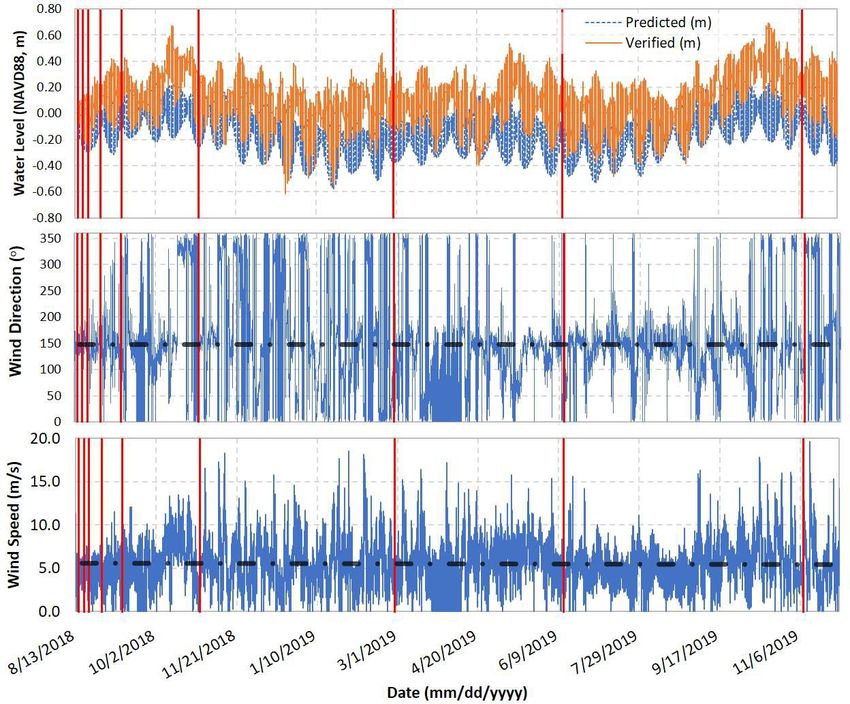
© 2021 Western Dredging Association                                          WEDA Journal of Dredging, Vol. 19, No. 1

          ENVIRONMENTAL BENEFITS REALIZED DURING
          NAVIGATION MAINTENANCE DREDGING: A CASE
          STUDY IN THE INDIAN RIVER LAGOON, FLORIDA
C. K. Maglio1, R. J. Weaver 2, J. H. Trefry2, C. R. Bostater Jr. 2, J.M. Shenker2, K. B. Johnson2,
S. F. Trulock3, J. D. Ousley4, P. F. Cotter3, P. M. DeMarco3, R. P. Trocine2, A. L. Fox2, and S. L.
Fox2

                                               ABSTRACT

The potential deleterious effects associated with a dredging operation are the primary focus of
stakeholders and regulators. The net positive environmental benefits associated with traditional
navigation maintenance dredging projects are rarely identified and almost never quantified. The
dredging of a portion of the Intracoastal Waterway in Indian River County, Florida was monitored
to determine the ultimate fate of the dredged material and its associated nutrient load through the
dredging and dewatering operations. The quantities and types of materials removed and residual
bedload was also monitored along with various biological indicators.
The project removed approximately 211,000 cubic meters (276,000 cubic yards) of material and
included in this volume was an estimated 240 metric tons (260 short tons) of nitrogen and 130
metric tons (140 short tons) of phosphorus. Minimal return water was released back into the lagoon,
so virtually all this dredged material was permanently removed from the aquatic system and placed
in the upland dredged material management area (DMMA). Thus, this project not only restored the
required navigational depth but also permanently removed a significant quantity of anthropogenic
nutrients from the lagoon, benefiting its overall environmental health.

Keywords: Dredging, Indian River Lagoon, dewatering, dredged material disposal, nutrients.

                                           INTRODUCTION

Navigation maintenance dredging took place in the Indian River Lagoon in 2015, an impaired
waterbody and an important estuary. This lagoon was the focus of international attention due to
harmful phytoplankton blooms in 2011 and large die-off events of not only seagrasses but also
marine mammals. As a result of international and local interest, a partnership between the Florida
Inland Navigation District (FIND), the non-federal sponsor, the U.S. Army Corps of Engineers
(USACE), and the Florida Institute of Technology (FIT), was formed to monitor the operations
associated with dredging this portion of the Intracoastal Waterway (IWW), which had not been

1
  USACE Galveston District, 2000 Fort Point Rd., Galveston, TX 77550.
2
  Florida Institute of Technology (FIT), Ocean Engineering Department of Marine & Environmental Systems, 150
    West University Blvd. Melbourne, FL 32901-6795.
3
  USACE Jacksonville District, 701 San Marco Blvd. Jacksonville, FL 32207.
4
  USACE Headquarters, 441 G St. NW, Washington, DC 20001.

                                                     1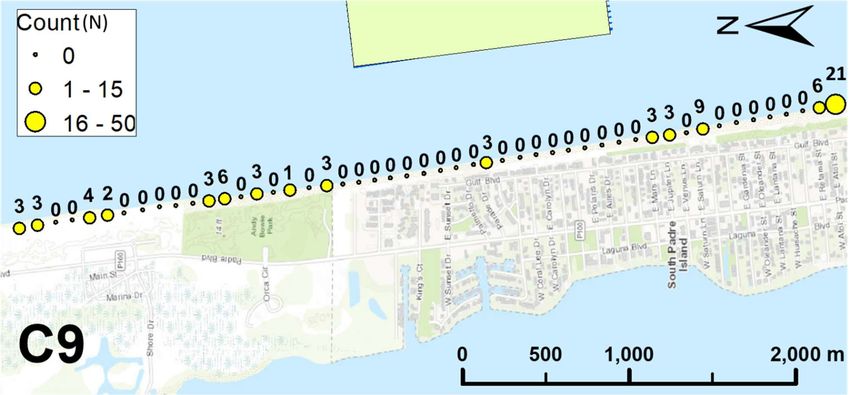
© 2021 Western Dredging Association                                  WEDA Journal of Dredging, Vol. 19, No. 1

maintained since original deepening in 1957. It was a timely opportunity to monitor a relatively
rare but overall standard maintenance dredging event in an imperiled system.

The USACE and FIT collaborated to evaluate the impacts of this shallow draft maintenance
navigational dredging project on muck movement, water quality, nutrient removal, and local biota.
Dredging has historically been viewed as harmful to the surrounding environment in this region,
primarily due to direct impacts of benthos and secondary impacts primarily associated with
turbidity plumes. Recently, there has been a move to utilize dredging to help restore the impaired
ecosystem of the Indian River Lagoon (IRL). Dredging is a significant component of the overall
restoration plan for the IRL to remove undesirable sediments (Weaver et al, 2015).

Two separate yet concurrent events led to a significant decline in submerged aquatic vegetation in
the IRL. A 2010 bloom was dominated by a mix of cyanobacteria, diatoms and dinoflagellates in
the Melbourne area and diatoms and dinoflagellates in the Sebastian and Vero areas. As the first
bloom continued, a second bloom began in the spring of 2011 and reached immense proportions,
deserving the label “superbloom.” The 2011 superbloom covered approximately 53,000 hectares
of open water, including and surpassed all previously documented blooms in intensity (SJWMD,
2012). By the end of summer 2011, seagrass loss was substantial (Morris et al., 2015). These events
led to significant die-off of benthos and even marine mammals. Evidence suggests that the loss of
seagrasses resulted primarily from decreased light penetration during and after the superbloom,
but other events may have played important roles in creating the observed conditions. The near
absence of drift algae throughout 2011 and 2012 could have increased the supply of nutrients
available to phytoplankton because drift algae were not acting as a “sponge” that soaks up
nutrients. Therefore, the combined loss and absence of both drift macroalgae and seagrass may
have freed up nutrients to initiate and sustain the superbloom (Morris et al., 2015).

There are deposits of fine-grained silts and clay sediments mixed with up to a quarter of organic
matter that store anthropogenic chemicals and nutrients. These deposits exist throughout the IRL
and are termed “muck”. The IRL was once a sandy bottom estuary, with a modest accumulation
of organic detritus from shoreline and aquatic vegetation loss. Much of the lagoon bottom is now
covered in a layer of muck, a highly mobile via resuspension, and fine material that has
accumulated over decades of excess runoff and sedimentation. Fine particles and organics carried
in by tributaries, canals, and storm drains accumulate and break down on the bottom, forming a
thick black ooze. This muck builds up in channels and deep pockets where it has reached depths
of up to 4.6 meters (m) (15 feet (ft)). The muck smothers and blocks light from benthic grasses
and organisms and it serves as a legacy load that slowly releases nutrients back into the water
column (Fox and Trefry, 2018). These muck sediments are potentially significant contributors to
lowering the overall environmental health of the IRL.

Sources of shoaling sediments and nutrients within the IRL are numerous: natural streams, rivers,
creeks, drainage canals, stormwater outfalls, overland runoff, groundwater seepage, septic-tank
leachate, and infrequent wet-weather wastewater discharges (Tetra Tech and Closewaters, 2020).
The IRL is still continually receiving urban and construction runoff, various marina pollutant
inputs and, possibly, internal pollutant loading from the IRL’s sediments (Steward et al., 2003;
Fox and Trefry, 2018). The impacts to the lagoon habitat have become so significant that the State
of Florida has appropriated millions of dollars to clean up the IRL in Brevard County (Waymer,

                                                2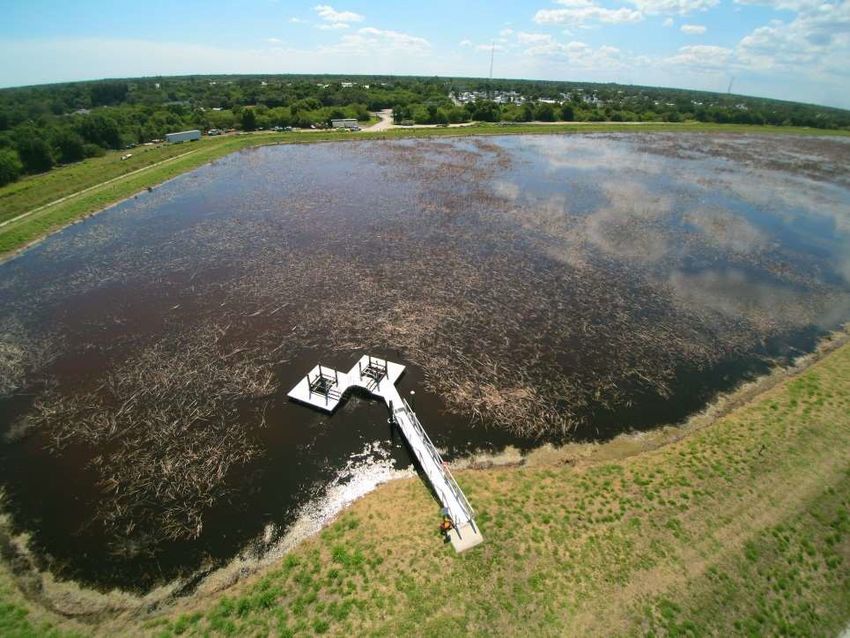
© 2021 Western Dredging Association                                    WEDA Journal of Dredging, Vol. 19, No. 1

2015). Projects have been completed and planned to address the continued input loads, improve
water quality, and remove or contain deleterious materials already within the system. This research
project was devised to help establish the environmental effects or benefits associated with a
navigational maintenance dredging project in the IRL and to assist in guiding and determining
associated impact of ongoing and future restoration dredging efforts in the IRL.

                                      DATA COLLECTION AND RESULTS

The USACE conducted a maintenance dredging project in conjunction with the FIND along the
Intracoastal Waterway (IWW) in the northern five miles of Indian River County, Florida. This
portion of the waterway has not been maintenance dredged since its 1957 deepening to its present
depth of 3.7 m (12 ft) Mean Lower Low Water (MLLW) (Taylor, 1999). The project commenced
in January and dredging was completed in June 2015 with approximately 211,000 cubic meters
(m3) (276,000 cubic yards (cy)) of material removed. The research effort monitored four inter-
related components in relation to the dredging project: dredging operations, muck movement,
nutrient removal, and biological impacts.

Dredging Operations and Sediment

USACE Jacksonville District pre-dredging surveys were used for volume computations of soft
sediments in the channel prior to dredging. To perform this analysis, both high (200 kHz) and low
frequency (28 kHz) data for the IWW Indian River County Reach 1 were compared. The basic
principle employed for this analysis is that the high frequency survey data refracts off the top layer
of soft silt, which is present in Indian River Reach 1, while low frequency returns penetrate to the
bottom of the soft silt layer and reflects off a denser substratum (e.g., Foster et al., 2018). The
difference in these two frequency returns is the thicknesses of soft silt; i.e., isopach (Figure 1)
(Weaver et al, 2015). In order to qualitatively confirm the accuracy of the soft silt thicknesses,
push cores and core borings were collected and analyzed in the project area. The subsurface
sampling confirmed the presence of soft silt deposits as presented in the isopachs. The bulk of the
soft silts were located within the channel footprint and side slopes.

Given the isopach volume and channel dimension, the soft silts that could potentially be removed
within the channel’s dredging footprint were calculated. There are gaps in the low-frequency
coverage from station 43+00 to station 82+00, thus volume calculations (Table 1) only span station
0+00 to station 42+00. Push core samples were used to measure an average bulk density of 1.54
g/cm3 (2,596 lbs/cy) in-situ. Based on the measured bulk density, the associated mass of soft silts
based on volume was estimated along with the average thickness of soft silts (Table 1) (Weaver et
al, 2015).

The IWW channel has a congressionally authorized 38.1 m (125 ft) bottom width with a 3.7 m (12
ft) depth relative to MLLW with 3 horizontal to 1 vertical side slopes. There is an allowable over-
depth allowance of 0.61 m (2 ft) which results in an allowable maximum pay dredging depth of
4.3 m (14 ft) MLLW.

                                                  3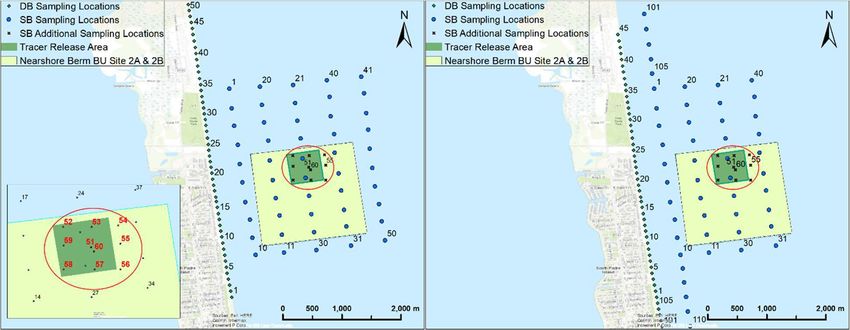
© 2021 Western Dredging Association                                           WEDA Journal of Dredging, Vol. 19, No. 1

   Figure 1. Isopach of high versus low frequency return in IR and push core and boring
                               locations (Weaver et al, 2015).

 Table 1. Pre-dredging volumes and mass of soft silts in the IWW in Indian River (Weaver
                                     et al, 2015).
                                                            Soft      Soft        Mass*
                                                            Silt      Silt        (Short        Mass*
                       Pre-dredge Survey                    (C.Y.)    (m3)        Tons)         (Tons)
               Channel bottom at 12 ft depth                15,085   11,534       19,579         17,762
               Channel bottom at 14 ft depth                31,255   23,896        40,564        36,799
               Channel and side slopes at 12 ft depth       32,096   24,539       41,657         37,790
               Channel and side slopes at 14 ft depth       62,790   48,007       81,494         73,930
               Outside of channel and side slope            34,350   26,262        44,582        40,444
                                                                                    Soft         Soft
                                                                                    Silt          Silt
                                                                                    (in.)        (cm)
               Avg. thickness 12 ft channel and side slopes                          5.3          13.4
              Avg. thickness outside of channel and slopes                      3.1                 7.9
              *Mass estimate computed by 15 March 2015 push core collection in situ
              measured bulk density of 1.54 g/cm3 conversion of 2,596 lbs/C.Y. Short
              tons equals 2,000 lbs.

The volume of soft silt within the 3.6 m (12 ft) deep channel with side slopes is 24,539 m3 (32,096
cy) with a weight of 37,790 metric tons (41,657 short tons). The volume of soft silt was also
calculated within the 38.1 m (125 ft) bottom width without including side slopes (box cut) of

                                                        4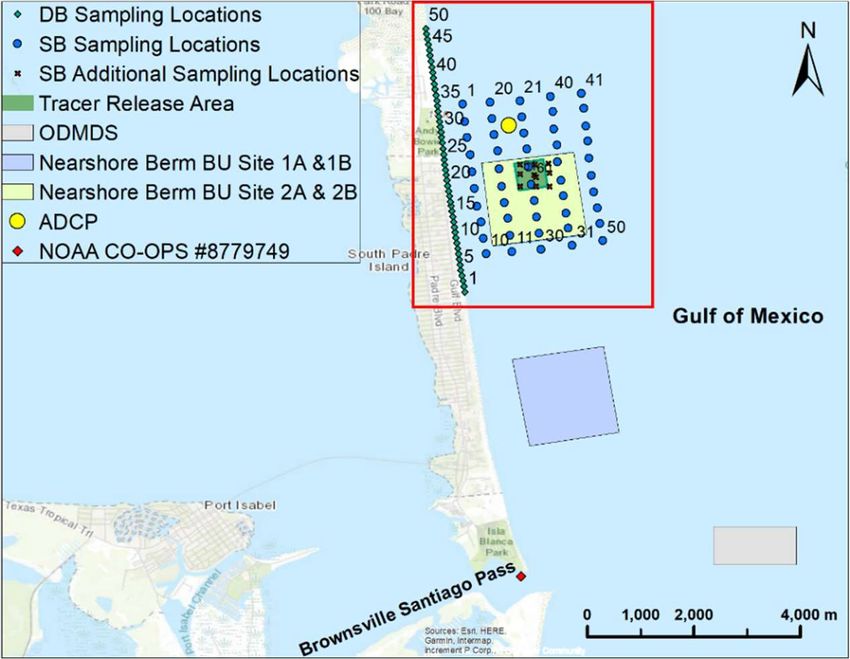
© 2021 Western Dredging Association                                  WEDA Journal of Dredging, Vol. 19, No. 1

11,534 m3 (15,085 cy) with a weight of 17,762 metric tons (19,579 short tons). The volume of soft
silt that would be removed in the 4.3 m (14 ft) deep channel with side slopes is 48,007 m3 (62,790
cy) with a weight of 73,930 metric tons (81,494 short tons). The volume of soft silt was also
calculated within the 38.1 m (125 ft) bottom width of the channel at a 4.3 m (14 ft) channel bottom
without side slopes and was 23,896 m3 (31,255 cy) with a weight of 36,799 metric tons (40,564
short tons) (Figure 2).
The volume difference between the 12 ft design channel and the 14 ft design channel can be
attributed to the fact that the low frequency surveyed surface drops beneath the design surface of
the 12 ft channel in various locations, this resulting in a smaller volume. The high frequency and
low frequency survey data spanned a width greater than the design channel’s dredged footprint.
The average thickness of soft silt outside of the channel limits was 7.9 cm (3.1 in.) while within
the channel 12 ft template it was 13.4 cm (5.3 in.) (Weaver et al, 2015).

The dredged material was all placed into the Dredged Material Management Area (DMMA) IR-2.
The DMMA can also be termed an upland placement area (PA) or a confined disposal facility
(CDF). The site was of sufficient size that percolation and evaporation were adequate to dewater
the placement area without the need for controlled releases of decanting water. Several days of
decanting utilizing the weir structures was performed at the beginning of the project to test the
water control and decanting systems as this was the first operation of the placement area (Figure
3), but ended up being unnecessary during operation.

Fluid Mud Measurements

Movement of highly turbid unconsolidated bottom material creates a lutocline or near bottom
nephelometric layers, reducing the penetration of light reaching the lagoon’s bottom. Monitoring
and measurement systems recently developed for use in shallow marine areas, such as the IRL,

    Figure 2. IWW dredging template; box cut, required depth and allowable over-depth.

                                                5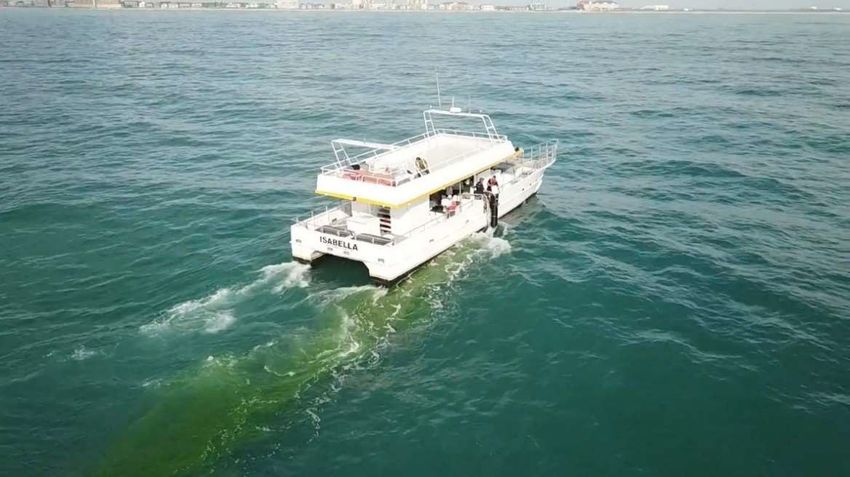
© 2021 Western Dredging Association                                   WEDA Journal of Dredging, Vol. 19, No. 1

Figure 3. Dredged Material Management Area IR-2 and water control weirs 14 May 2015.
                              Photo credit Cavache Inc.

called passive sondes were utilized to estimate suspended fluxes along and across the channel.
These sondes are essentially horizontal facing no-flow-through sediment traps that employ the
principal of inertia to capture suspended sediment fluxes (Weaver et al, 2015). Four locations
within the IWW channel to be dredged were selected for deployment of the sondes prior to, during,
and post-dredging.

The variability between the transect cross sectional average horizontal fluid mud fluxes within the
bottom layer are shown in Figure 4. The results of extrapolation of the results to a cross sectional
bottom water layer followed by applying a nonparametric Kolmogorov test indicate that the pre,
during and post sonde fluxes are significantly different from each other (p
© 2021 Western Dredging Association WEDA Journal of Dredging, Vol. 19, No. 1
Figure 4. Fluxes in metric tons per day (mT day-1) at each transect applied to a 0.5 meter
bottom cross-sectional area indicates the fluid mud mass flux or movement between the pre
dredge, during and post dredge conditions was significantly different, showing cross section
variability with error bars (Weaver et al, 2015).
Slurry, Dewatering, Nutrient Containment and Testing
Water and slurry samples were collected on four occasions (February 19, March 25, April 21 and
May 6, 2015) at five locations within and around the DMMA (Figure 5). These water samples
were filtered and analyzed for the following: total suspended solids (TSS), dissolved phosphate,
dissolved ammonium and nitrate + nitrite plus dissolved organic carbon, dissolved iron and
manganese, as well as particulate aluminum, silicon, iron, organic carbon, total nitrogen and total
phosphorus. Data for salinity, temperature, dissolved oxygen and pH also were collected on site
during each sampling trip (Weaver et al, 2015).
Concentrations of dissolved ammonium and phosphate in the incoming dredged material (at #1,
Figure 5) were quite variable with ranges of 0.2-11 mg N/L for ammonium and 0.1-4 mg P/L for
phosphate, most likely in response to changes in the composition and water content of the sediment
being dredged. By the time water reached the weir (#2), concentrations of ammonium and
phosphate averaged 0.3 mg N/L and 0.2 mg P/L, respectively; these values are lower than found
in the wetland at the end of the discharge pipe leaving the DMMA and at the outfall from the
7© 2021 Western Dredging Association WEDA Journal of Dredging, Vol. 19, No. 1
Figure 5. Map of DMMA IR-2 showing approximate sampling locations: #1 at the incoming
pipe from the dredge, #2 at the weir inside the DMMA, #3 at the pipe leaving the DMMA,
#4 at the outfall to the IRL and #5 in the IRL away from the outfall site (Weaver et al,
2015).
wetland (#3 and #4) but 3-4 times greater than in two samples from the open IRL offshore of the
DMMA (#5). Low values for ammonium and phosphate at the weir suggest uptake of these
dissolved nutrient elements by plants (primarily Cattails) or algae within the DMMA, thus the
placement area was acting as natural filter, similar to a wetland. Increased concentrations of
ammonium and phosphate at the discharge pipe and in the outfall likely represent release of these
two nutrients from decomposing organic matter in the surrounding wetland because no discharges
from the DMMA occurred during the sampling events as the placement area naturally infiltrates
into the surficial aquafer as it is situated on a sand ridge.
Concentrations of TSS carried by the incoming pipe from the dredge averaged 290,000 mg/L (290
g/L). By the time the sediment-water mixture reached the weir, TSS values decreased by about
19,000-fold to an average of 15 mg/L (Figure 6). The typical range of TSS values is 2-25 mg/L for
the overall IRL and 2-13 mg/L in the immediate project area. Therefore, if any discharges from
DMMA IR-2 via the weir occurred, they would have had TSS values within or slightly higher than
values for the IRL.
Trends for particulate nitrogen and phosphorus (in mg/L) followed those for TSS with about 200-
and 1800-fold decreases, respectively, in the masses of particulate nitrogen and phosphorus per
liter during transit between the incoming pipe from the dredge and at the weir. Smaller decreases
in values for particulate nitrogen and phosphorus, relative to those for TSS, were observed along
the length of the DMMA due to increased organic matter (containing carbon, nitrogen, and
phosphorus) in the much smaller concentrations of TSS at the weir (Figure 6). Concentrations of
particulate aluminum and iron (in mg/L) decreased by about 365,000- and 400,000-fold,
respectively, from the incoming dredge pipe to the weir. These extremely large decreases in
particulate aluminum and iron along the length of the DMMA show the near complete removal of
the clay-rich and low organic matter dredged material well before the weir (Weaver et al, 2015).
The 211,000 m3 (276,000 cy) of sediment dredged contained approximately 154,000 metric tons
(169,000 short tons) of dry sediment, 240 metric tons (260 short tons) of nitrogen and 130 metric
tons (140 short tons) of phosphorus. Greater than 99% of the nitrogen and phosphorus carried into
the DMMA was bound to sediments and not dissolved (Table 2). This DMMA was a highly
8© 2021 Western Dredging Association WEDA Journal of Dredging, Vol. 19, No. 1
290,000 ± 40,000
200,000
Total Suspended Solids (mg/L)
50
40
30
20 15 ± 16 9±9 11 ± 3 2.4 ± 0.1
10
0
1
Pipein
2
Weir Pipeout
3
Outfall
4
IRL
5
Figure 6. Concentrations of total suspended solids (TSS) for samples from the following
locations in DMMA IR-2: at the incoming pipe from the dredge (#1, Pipein), at the weir
inside the DMMA (#2, Weir), at the pipe leaving the DMMA (#3, Pipeout), at an outfall to
the IRL (#4, Outfall) and in the open IRL away from the outfall site (#5, IRL) (Weaver et
al, 2015).
efficient trap for the volume and rate of sediment and water deposited during the dredging project
(Weaver et al, 2015).
Biological Assessment
Given future plans to expand dredging efforts to remove muck along much of the IRL this project
was monitored for changes to seagrasses, fish and macroinvertebrate abundance. The potential
discharge of turbid water from the IR-2 placement area into the IRL was monitored for secondary
effects from the nutrients returned and suspended solids associated with the project. The concern
was that nutrients might trigger algal production (phytoplankton, drift macroalgae, and epiphytic
algae), similar to the superbloom. Algae, and suspended solids in the discharge water, could impact
the recovery of the little seagrass remaining in what once was a lush seagrass habitat not too distant
from the discharge location of the DMMA (Weaver et al, 2015) (Morris et al, 2015).
The relatively sparse nearby seagrass and fish populations were monitored for potential regional
effects that might be due to the dredging discharge activity itself, or possibly associated with
undetected seepage or regional effects of the DMMA. The condition and responses of seagrasses
and fishes were monitored before, during, and after the dredging project. A background site on the
shoreline immediately north of the placement area, was monitored for a controlled comparison to
the responses of seagrasses nearest the DMMA’s outfall location, sampling location #4 (Weaver
et al, 2015).
9© 2021 Western Dredging Association WEDA Journal of Dredging, Vol. 19, No. 1
Table 2. Dredged slurry, discharge, background sampling on February 19, March 25, April
21 and May 6, 2015.
Sample Location
Parameter Incoming DMMA at % Removal DMMA Outfall area Open IRL
Pipe Weir by DMMA Discharge in IRL Background
Sampling
Locations
2 or 3 4 4 4 2
Salinity 31 ± 2 26 ± 4 16.1 21 ± 10 19 ± 8 29 ± 1
Temperature (˚C) - 16-27 15-25 15-24 25-26
pH 7.8 ± 0.2 7.2 ± 0.3 7.7 7.2 ± 0.2 7.4 ± 0.4 8.0 ± 0.2
Dissolved Concentrations (mass/volume)
O2
(% saturation) 75 26 ± 21 65.3 26 ± 19 34 ± 45 107 ± 61
Ammonium 4±6 0.3 0.4
(0.2-11) (0.06-1) 92.5 0.8 ± 0.7 (0.1-1.2) 0.08 ± 0.06
(mg N/L)
Nitrate + Nitrite 0.02© 2021 Western Dredging Association WEDA Journal of Dredging, Vol. 19, No. 1
The measures of seagrass abundance showed no statistically significant differences when making
temporal comparisons. The variability and trends of loss or gain comparing transects near the
DMMA and dredging activities to control transects at the away sites display seasonal growth
patterns (Figures 7 and 8). For example, where data are available to show mean percent presence
of Shoal Grass (Halodule wrightii) near the DMMA site before and after dredging, the
nonsignificant trends at the control transects are universally in the increasing direction. The lack
of statistically significant temporal differences suggests no proximal effects of DMMA discharge
or seepage, nor any effects of nearby dredging. Nonsignificant trends tend toward an increase of
seagrass following dredging, but this is also true of the control transects where no dredging was
occurring. Therefore, any perceived changes in the seagrass H. wrightii cannot be differentiated
from regular seasonal changes due to environmental factors unassociated with dredging (Weaver
et al, 2015). This increasing trend likely points to the ongoing natural recovery of seagrasses in the
IRL.
Sampling for fish and macroinvertebrates occurred in March, May and July 2015 and determined
that the nearshore region of the Indian River Lagoon near the DMMA supported an abundant and
diverse array of juvenile fishes that were vulnerable to collection with the 15 m (50 ft) seine net.
The most abundant taxa showed distinct changes in abundance with season that reflects their
recruitment periodicity. For example, Pinfish and grunts typically spawn in winter and recruit into
Figure 7. Seagrass H. wrightii near DMMA outfall.
Figure 8. Seagrass H. wrightii at control site, immediately north of DMMA.
11© 2021 Western Dredging Association WEDA Journal of Dredging, Vol. 19, No. 1
estuarine nurseries in the spring. The increase generally observed in mean size over the seasons
reflects growth of the juveniles.
A primary goal of this portion of the field sampling was to determine if water released from the
DMMA impacted the fauna in the nearshore region of the IRL near the discharge site. Since the
DMMA never filled to capacity, and did not release water into the Lagoon, it was not possible to
evaluate any discharge effects (Weaver et al, 2015).
CONCLUSIONS
Due to the fact that there were no releases from the DMMA other than a few days during the initial
dredge operation to test the weir outfall structures, all of the dissolved and particulate nutrients
pumped into the DMMA were contained within the placement site. Based on the quantity of
dredged material removed and the approximate dry sediment weight: 154,000 metric tons (169,000
short tons), the total weight of nutrients removed can be extrapolated from the measured inflow
samples: 240 metric tons (260 short tons) of total nitrogen, and 130 metric tons (140 short tons)
total phosphorus.
Focusing on the samples taken from the discharge pipe as slurry entered the placement area and
inside the DMMA at the weir, a measurement of the nutrient reduction taking place as the water
migrated through the DMMA can be obtained. A greater than 99.9% reduction in suspended solids,
99.5% reduction in particulate nitrogen and 99.9% reduction in particulate phosphorus was
measured at the weir although no releases were taking place, as shown in Table 2. The dissolved
phosphate was reduced by 93.8%. The concentrations of dissolved nutrients were reduced to the
background levels as measured in the IRL. The design of the DMMA and the size of the dredging
operation resulted in all of the dredged material and all of the carrier water being contained in the
DMMA and slowly percolating. Had there been a need to release, due to the size and configuration
of the DMMA, it is likely that nearly all of the particulates would remain settled out and the
dissolved nutrients in the released water would have the same or similar levels as those found in
the adjacent IRL waters.
From a biological standpoint, with no releases to impact water quality, and the dredging operation
being efficient with no turbidity plumes noted, there should not be any expected impact on the
biology at the timescales of this project. As expected, seagrasses in the vicinity of the DMMA
expressed no significant difference in growth than the seagrass beds selected as the control site to
the north. The changes in fish populations cannot be attributed to the dredging, rather are most
likely natural seasonal variations in populations (Weaver et al, 2015). This navigational
maintenance dredging project achieved the mission of re-establishing the IWW’s congressionally
authorized design depths, while removing hundreds of tons of deleterious nutrients from the IRL,
all without creating a measurable impact to adjacent resources. Future research should focus on
whether more frequent dredging of the IRL navigation channels could lead to improved lagoon
health.
12© 2021 Western Dredging Association WEDA Journal of Dredging, Vol. 19, No. 1
REFERENCES
Foster, G., Riegl, B. M., Foster, K. A. and Morris, L. J. (2018). Acoustic Detection and Mapping
of Muck Deposits in the Indian River Lagoon, Florida. Journal of Coastal Research 34(4):856-
863.
Fox, A. L. and Trefry, J. H. (2018). Environmental Dredging to Remove Fine-Grained, Organic-
Rich Sediments and Reduce Inputs of Nitrogen and Phosphorus to a Subtropical Estuary. Marine
Technology Society Journal 52(4):42-57.
Morris, L. J., R.C. Chamberlain, and C.A. Jacoby. (2015). “Summary report for the northern Indian
River Lagoon”. Seagrass Integrated Mapping and Monitoring Report No. 2. Fish and Wildlife
Research Institute Technical Report TR-17B, St. Petersburg, Florida.
Steward, J. S., Brockmeyer, R., Virnstein,, R., Gostel, P., Sime, P., and Vanarman, J. (2003).
“Indian River Lagoon surface water improvement and management (SWIM) plan, 2002 Update”.
St. Johns River Water Management District, Palatka, Florida, and South Florida Water
Management District, West Palm Beach.
St. Johns River Water Management District. (June 2012). “Indian River Lagoon 2011 Superbloom
Plan of Investigation”. https://www.sjrwmd.com/static/waterways/irl-
technical//2011superbloom_investigationplan_June _2012.pdf
Taylor, R. B., McFetridge, W. F. (1999). “Management Plan IR-2 Dredged Material Management
Area” Taylor Engineering. Prepared for Florida Inland Navigation District. January 1999.
Tetra Tech, Inc. and Closewaters, LLC. (2020). Save our Lagoon Project Plan for Brevard County
Natural Resources Management Department. http://www.brevardfl.gov/SaveOurLagoon/Home.
Waymer, J. (2015). “Florida to fund half the lagoon projects Brevard wanted”. Florida Today. 23
June 2015.
Weaver, R.J., Trefry, J. H., Bostater, C. R., Shenker, J. M., Johnson, K. B., Maglio, C. M. Trocine,
R. P., Fox, A. L., Fox, S. L. (2015). “Assessment of muck movement, discharge water quality and
biological impacts at FIND Dredging Site IR-1: Sebastian River to Wabasso Bridge” Prepared for
Florida Inland Navigation District. Project No. ICW-IR-14-01. October 2015.
SOURCE
This paper was initially presented and published in the Proceedings of the World Dredging
Congress 2016 (WODCON XXI), held in Miami, Florida, USA, June 13 –17, 2016.
13© 2021 Western Dredging Association WEDA Journal of Dredging, Vol. 19, No. 1
PARTICLE TRACER ANALYSIS FOR SUBMERGED BERM
PLACEMENT OF DREDGED MATERIAL NEAR SOUTH
PADRE ISLAND, TEXAS
Jens Figlus1, Youn-Kyung Song1, Coraggio K. Maglio2, Patrick L. Friend3, Jack Poleykett4,
Frank L. Engel5, Douglas Schnoeblen5, and Kristina Boburka6
ABSTRACT
The fate of unconfined dredged sediment placed as a submerged “feeder” berm in the nearshore
region of South Padre Island (SPI), Texas, was investigated through a particle tracer study over
the duration of 15 months. Unconfined sediment feeder systems can be a desirable alternative to
traditional direct beach placement of nourishment material because the feeder systems are less
intrusive to the beach environment and often less expensive. Placing sediment as close to the active
beach profile, as practicable, and relying on natural nearshore processes to slowly distribute the
sediment to the beach can keep a finite resource within the littoral zone. One challenge with this
indirect approach is predicting the short- and long-term effects on the coastal system and shoreline
in light of the complex nearshore dynamics involved. This study aims at elucidating sediment
transport pathways at SPI after tracer release over the feeder berm via assessment of tracer particle
counts obtained from nine sediment sampling campaigns (950 surface-sediment grab samples)
between August 2018 and November 2019, covering a grid of 60 seabed and 50 dry beach
locations. Tracer counts were performed in the laboratory making use of the fluorescent and
ferrimagnetic properties of the engineered particles to separate them from other sediment material.
Results indicate that although the highest tracer counts remained near the initial release site of the
feeder berm during the duration of the study, appreciable amounts of tracer moved throughout the
study region. Even though fluctuations of tracer migration were observed, the most prominent
appearance of tracer particles outside the initial placement site occurred south and immediately
west of it, indicating net alongshore and onshore transport in those directions. Relatively few tracer
particles were found on the dry beach, indicating appreciable deposition of feeder material there
may take years rather than months.
Keywords: Beneficial Use Dredge Material (BUDM), sediment tracer, fluorescent, ferrimagnetic,
Gulf of Mexico
1
Department of Ocean Engineering, Texas A&M University, 200 Seawolf Parkway, Galveston, TX 77554, USA.
2
Galveston District, U.S. Army Corps of Engineers, 2000 Fort Point Road, Galveston, TX 77550, USA.
3
Partrac GeoMarine, Inc., 16225 Park Ten Place #500, Houston, TX 77084, USA.
4
Partrac Ltd., Suite B3D, Milburn House, Dean Street, Newcastle-upon-Tyne, NE1 1LE, U.K.
5
U.S. Geological Survey, South Texas Program, Oklahoma-Texas Water Science Center, 5563 De Zavala Road, Suite
290, San Antonio, TX 78249, USA.
6
City of South Padre Island, Shoreline Department, 321 Padre Boulevard, South Padre Island, TX 78597, USA.
14© 2021 Western Dredging Association WEDA Journal of Dredging, Vol. 19, No. 1
INTRODUCTION
Beach-nourishment projects are important components of coastal risk-reduction strategies but can
be intrusive to coastal ecosystems and beach use. Beach-quality dredged material can be used as
nourishment material if sediment characteristics closely match the native beach sand. However,
transporting the dredged material to the beach and distributing it via heavy machinery is expensive.
Sustainable sediment management practices that are less expensive and less intrusive are desirable
(e.g., Berkowitz et al. 2019, Brutsché et al. 2019, McFall et al. 2016, and Welch et al. 2016).
At South Padre Island (SPI), Texas, a submerged “feeder” berm located outside the surf zone in
nearshore waters (Work and Otay 1997) is being evaluated as an alternative means to supply
sediment to the beach and reduce ongoing coastal erosion. This part of the Gulf of Mexico features
an average diurnal tide range of 0.38 m (1.25 ft). The City of SPI is a densely developed tourist
destination at the southern Texas Gulf coast. Since 1988 SPI has undertaken intermittent
submerged berm nourishment projects as part of a Beneficial Use of Dredged Materials (BUDM)
scheme (Aidala et al. 1992). Sediment removed by maintenance dredging is regularly placed back
into the littoral system, and thus available for cross-shore and alongshore sediment transport to the
beaches. For nearshore placement, maintenance material is placed by a hopper dredge in nearshore
“feeder” berm sites (Fig. 1). Previous monitoring of material placed at these feeder berms indicated
movement toward the beach and dispersal with movement primarily from alongshore sediment
transport (both north and south) but direct tracer verification had not been accomplished prior to
this study. An emergency dredging contract has been utilized to remove material from the
Brownsville Santiago Pass. For this project, the dredged material was again placed at the feeder-
berm sites 2A and 2B closer to the beach, rather than in the available Ocean Dredge Material
Disposal Site (ODMDS) as shown in Fig. 1. However, considerable uncertainty remains regarding
the timing and quantity of material being mobilized and transported to the littoral zone and the dry
beach (Phillips et al. 2017). Although nearshore placement is typically less expensive than beach
placement, quantitative evidence is needed to understand how the material spreads and to
determine whether it is eventually delivered to the active surf zone and deposited on the upper
beach template.
As part of the most recent BUDM placement, a 15-month sediment tracer study was conducted as
a collaboration between the City of SPI, U.S. Army Corps of Engineers Galveston District
(USACE SWG), U.S. Geological Survey (USGS), Partrac GeoMarine Inc., and Texas A&M
University (TAMU). A total of 2,000 kg (4,400 lb) of engineered ferrimagnetic fluorescent tracer
particles were deployed to map sediment pathways after initial placement on the berm (Fig. 2).
Prior to the tracer deployment, USACE SWG placed more than 382,000 m3 (500,000 cu.yd) of
dredged material from nearby Brazos Santiago Pass approximately 1,220 m (4,000 ft) offshore at
a depth of 9.1 m (30 ft). During the duration of the study, more than 900 surface-sediment grab
samples from dry beach (at low tide) and offshore grid points in water depths ranging from
approximately 7.9 m (26 ft) to 11 m (36 ft) were collected at increasing time intervals after initial
tracer deployment.
In addition to tracer release and grab sample collection (dry beach and offshore) a nearshore
acoustic Doppler current profiler (ADCP) was deployed to record the local wave and current
conditions over the course of the study. The focus of this paper is on the results from the laboratory
15© 2021 Western Dredging Association WEDA Journal of Dredging, Vol. 19, No. 1
Gulf of
Mexico
Figure 1. Map of SPI and nearshore berm site (DB: dry beach; SB: seabed).a
Figure 2. Photo of tracer deployment. 2000 kg (4,400 lb) of ferrimagnetic fluorescent tracer
particles (top left inset) engineered to match the hydraulic characteristics of the dredged
material were released via a chute on the side of the boat (bottom right inset) over the top
of the nearshore berm in August 2018 (Inset photograph in the upper left courtesy of
Partrac GeoMarine Inc.; large photograph and inset photograph in the lower right
courtesy of the City of South Padre Island).
All base maps throughout this document were created using ArcGIS® software (ArcMap 10.4.2) by Esri (Esri 2006).
a
Base map data were downloaded from the ArcGIS® online data base (Esri, 2012).
16© 2021 Western Dredging Association WEDA Journal of Dredging, Vol. 19, No. 1
tracer analysis. However, these data are also important to verify numerical modeling approaches
that will be used to gain a better understanding of the local sediment-transport dynamics.
METHODS
On August 15, 2018, 2000 kg (4,400 lb) of dual-signature tracer particles (ferrimagnetic and
fluorescent) were released as a slurry at the location of the newly created submerged feeder berm
in approximately 9.1 m (30 ft) of water 1,220 m (4,000 ft ) offshore of SPI (Fig. 2). The method
applied during this study reflects the method presented by Poleykett et al. (2018) and follows the
methodological framework for the use of sediment tracers in marine and coastal environments
detailed by Black et al. (2017). The particles were manufactured by Partrac Ltd. to closely match
the hydraulic characteristics of the beneficial use dredged material making up the feeder berm (�S0
= 0.19 mm, sediment density �s = 2,600 kg/m3, Gaussian distribution). Black et al. (2007)
discussed optimal characteristics of engineered sediment tracers. The resultant tracer was a
unimodal, well sorted fine sand (σ = 0.044 mm) (Folk 1980). The settling velocities of the tracer
particles were determined using the Soulsby criterion (Soulsby 1997): wd10, wd50, wd90 = 0.007
cm/s, 0.014 cm/s, 0.024 cm/s, respectively. The slurry release into the water was accomplished via
a chute over the side of a slowly moving vessel. The area of tracer deployment spanned
approximately 500 m by 500 m (1,640 ft by 1,640 ft).
An initial grid of offshore surface-sediment grab sampling locations consisting of 10 alongshore
points (�� = 300 m or 984 ft) by five cross-shore points (�� = 300 m or 984 ft) was set up. These
50 seabed (SB) sampling locations were complemented by an additional 10 SB locations near the
initial tracer placement area. In addition, 50 dry beach (DB) sampling locations were set up along
the SPI shoreline (�� = 100 m or 328 ft) as indicated in the left panel of Fig. 3. Nine sediment-
sampling campaigns were completed at increasing time intervals commencing 24 hours after tracer
deployment (Table 1). Ten pre-deployment DB and SB grab samples, respectively, were collected
Figure 3. Grid layout for surface-sediment grab samples. Left panel: sampling locations for
sampling campaigns 1 – 6. Right panel: modified sample-location scheme for sampling
campaigns 7 – 9.
17© 2021 Western Dredging Association WEDA Journal of Dredging, Vol. 19, No. 1
Table 1: Sediment Sampling Campaign Overview.
Time past initial # of surface-sediment
Campaign
tracer deployment grab samples (DB / SB)
0 pre-deployment 10 / 10
1 24 hours 50 / 60
2 3 days 50 / 60
3 1 week 50 / 60
4 2 weeks 50 / 60
5 1 month 50 / 60
6 2.5 months 50 / 60
7 6.5 months 50 / 60
8 10 months 50 / 60
9 15 months 50 / NA
Total # of Samples: 950
Note: Campaigns 1-8 were conducted by the USGS; Campaign 9
was conducted by Partrac GeoMarine Inc. and City of SPI.
to establish base-line conditions (campaign 0). Starting with campaign 7, the sampling grid was
modified slightly in response to measured tracer counts (see right panel of Fig. 3). The line of 10
farthest offshore grid points was removed and replaced by 10 alongshore points, five north and
five south of the initial offshore grid, respectively. In addition, the five northernmost DB locations
were moved to the south and renamed. The last campaign (campaign 9) only included DB samples.
All 950 surface-sediment grab samples were analyzed at the TAMU Coastal Engineering
Laboratory (CEL) on the Galveston Campus. Each sample consisted of approximately 1.0 kg (2.2
lb) of sediment from the top 2 – 4 cm (0.79 – 1.58 in) of the bed. Sample weight was determined
before and after drying. The drying process included 24 hours of air-drying at room temperature,
followed by 24 hours in a sediment oven at 40° C (105° F), and an additional 24 hours of air-
drying afterward to remove all moisture content. The weight of water removed through drying
typically ranged between 10 and 30% of the total wet sample weight. Anytime samples were not
actively being processed, they were stored in dry, enclosed crates sealed in a double layer of
sealable plastic bags to prevent contamination and sample mixing.
Once completely dried, each sample was evenly spread out to an approximate grain monolayer on
a 1 by 2 m (3.3 by 6.6 ft) black PVC tray. Lumped particle accumulations were gently separated
by using a kneading stick or hand-held rolling pin. The monolayer was then inspected visually
with a blue light torch (~ 395 nm) in a dark room (Partrac Ltd. 2018) and the number of tracer
particles was counted manually (Fig. 4).
For samples with large tracer amounts present, the sediment monolayer was divided into six
rectangles of equal size and counting was done for two of them only. The resulting particle counts
were then multiplied by three to stay consistent across all samples. Under the blue light torch, the
fluorescent tracer particles appear bright green and are easily discernible. The bright green
appearance is due to the inclusion of a chartreuse dye pigment in the tracer manufacturing process.
However, samples also contained some micro-plastic fibers of 2–5 mm (0.079–0.197 in) length
exhibiting a blue reflection. Owing to their distinctive shape, the plastic fibers were usually easily
18© 2021 Western Dredging Association WEDA Journal of Dredging, Vol. 19, No. 1
Figure 4. Photo of laboratory tracer assessment. Surface grab samples were dried and
spread out on a flat PVC tray. A 12,000-Gauss cylindrical magnet was used to extract the
ferrimagnetic fluorescent tracer particles for subsequent counting under blue light
illumination.
identifiable but to avoid erroneous tracer particle counts, the ferrimagnetic tracer particles were
extracted from the sample by using a 12,000-Gauss neodymium magnet prior to counting. The
magnet was cylindrical with a diameter of 25 mm (0.98 in) and a length of 300 mm (11.81 in) and
was enclosed in a removable plastic sheath. The cylindrical sheath with the magnet was rolled over
the sediment monolayer surface repeatedly. Ferrimagnetic particles attached themselves to the
outer surface of the sheath allowing for easy transfer to a separate tray by simply removing the
magnet from inside the sheath. The resulting residue contained both native dark gray non-
fluorescent iron-bearing sediment particles and the green fluorescent, ferrimagnetic tracer
material. Tracer particle counting was then completed manually using the blue light torch. Finally,
the individual dry pan or plastic bag where the dried sediment sample was emptied out was
inspected under the blue light torch and any tracer particle detected from the residual dirt was
added to the final tracer count. Two different researchers repeated the procedure independently
and all samples were kept in dark, dry storage protected by double-sealed plastic bags for potential
future analyses.
Wet and dry weight of each sample, along with tracer count results were recorded in table format
(Figlus and Song 2020) and displayed graphically using geographic information system (GIS)
software (Fig. 5 and Fig. 6). Previous studies using similar manual counting approaches have
reported errors of 5 – 10% attributed to counting fluorescent tracer grains by eye (Carrasco et al.
2013).
19© 2021 Western Dredging Association WEDA Journal of Dredging, Vol. 19, No. 1
RESULTS AND DISCUSSION
The results for the tracer particle counts vary based on tracer distribution at the time of sample
collection. Particle counts range from zero to just below 3,000 for individual samples. The
assumption is that the tracer particles behave in a similar way as the placed beneficial-use dredged
sediment because they were designed to have the same hydraulic characteristics. Sediment and
tracer movement is inherently tied to the complex nearshore dynamics at the site and is influenced
by currents, water level fluctuations, waves, surf-zone processes, and morphology evolution (Ingle
2011). Hydrodynamic data are available from a bottom-mounted acoustic Doppler current profiler
(ADCP) specifically deployed for this study (Engel et al. 2020) and from nearby National Oceanic
and Atmospheric Administration (NOAA) Center for Operational Oceanographic Products and
Services (CO-OPS) Station # 8779749 (NOAA 2020), as explained in more detail in the discussion
that follows. In addition, tracer particle counts merely represent snapshots in time and grab samples
were only collected near the sediment surface. This means tracer particles observed at a specific
location at previous time steps can become buried by new sediment with none or varying amounts
of tracer.
Despite these caveats, the results reveal patterns of tracer movement. Figs. 5 and 6 provide
graphical representations of measured tracer counts, N, over the study area for all sediment-
sampling campaigns where tracer counts are represented by circle size and corresponding number
at each sample point by using GIS visualization techniques (ESRI 2006). Sample wet and dry
weights, as well as tracer particle counts for all sampling campaigns and all grid points are reported
by Figlus and Song (2020). Throughout the entire study period, the highest tracer counts were
found at or near the initial release location (up to nearly 3,000). These findings indicate that it takes
on the order of years rather than months to fully redistribute sediment placed at the feeder berm
under the given hydrodynamic conditions. However, a portion of tracer particles moved out of the
initial placement area within 24 hours (campaign 1) after placement: large numbers (between N =
15 and N = 189) of tracer particles were detected just offshore and south of their original location
outside the initial placement area indicating a predominantly southward littoral drift was likely
during the initial 24 hours. This pattern continued over the next week, manifesting itself in the
results from campaign 2 where tracer numbers between N = 21 and N = 2,337 were recorded at all
sampling locations south and immediately offshore of the initial placement area. Several locations
just north and offshore of the initial placement area also showed elevated numbers of tracer
particles between N = 3 and N = 36 indicating that dispersion of sediment was not purely
unidirectional. During this first week, only negligible amounts of tracer migrated onshore and only
sporadic counts of six or less tracer particles were found in DB samples.
By week 1 (campaign 3) the pattern had slightly changed (see Fig. 5). While a majority of elevated
tracer counts outside the initial placement area were still located south of it, a fair amount of
particles per sample had migrated onshore (between N = 6 and N = 156) as well as north (between
N = 12 and N = 72) showing up in most samples collected at the two most shoreward alongshore
rows of sampling locations. This means that onshore migration and alongshore transport in both
directions had occurred. Incidentally, no appreciable tracer amounts were found in the farthest
shore-parallel offshore row of samples during campaign 3, further highlighting the shift to onshore
sediment movement during the preceding time step.
20© 2021 Western Dredging Association WEDA Journal of Dredging, Vol. 19, No. 1
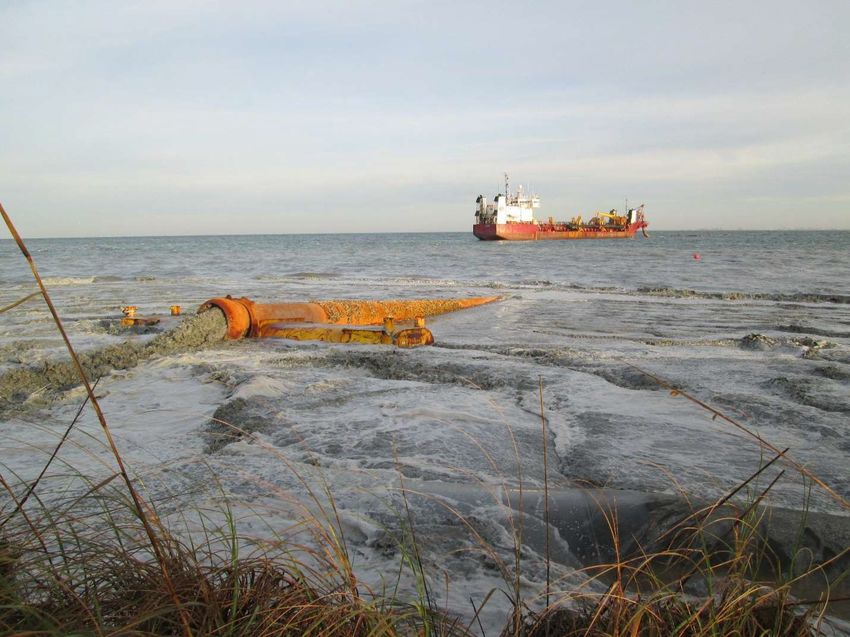
Figure 5. Tracer count results post release for sampling campaigns 1 – 6. C1 (24 hours),
C2 (3 days), C3 (1 week), C4 (2 weeks), C5 (1 month), C6 (2.5 months). The number of
tracer particles, N, is given at each sampling location and visualized by circle size.
21© 2021 Western Dredging Association WEDA Journal of Dredging, Vol. 19, No. 1
Campaign 4 (two weeks post-deployment) revealed yet another shift in sediment dynamics. Large
numbers of tracer particles were collected both south and shoreward (N = 14 to as much as N =
3,240 per sample) and north and shoreward (N = 18 to as much as N = 320 per sample) of the
original placement area as well as in the nearshore region between the feeder berm and the beach
with decreasing concentration toward the shoreline. About half of the DB points also registered
small amounts (N = 3 to 12) of tracer particles indicating that onshore transport from the feeder
berm and deposition on the dry beach was occurring, albeit at low volume. After one month
(campaign 5), the highest concentrations were still apparent in the initial placement area; some
tracer was found at most SB sampling locations, although at reduced concentrations from those
observed in campaign 4, a week prior. The only exceptions were some sampling locations on the
southern edge of the measurement grid, where an increase in numbers from double digits to triple
digits was observed. This increase went hand-in-hand with a decrease in counts at locations
between the original placement area and the southern edge of the grid, highlighting the possibility
for particles to move southward out of the sampling area.
Campaign 6 (2.5 months post deployment) showed appreciable overall count reductions outside
the initial placement area, to mostly zero offshore and lower two-digit numbers in the area
shoreward of it. This could indicate that tracer particles had migrated out of the sampling area or
had been covered by additional sediment as a result of storm activity as discussed below. DB
samples did not show any appreciable tracer counts. These observations prompted the modification
of the sampling grid detailed in the methodology section for the remaining campaigns (Fig. 6).
Six and a half months into the field experiment (campaign 7), the measured tracer distribution
resembled that after 1 week but with an apparent onshore shift of appreciable tracer counts across
almost all sampling locations. At that point, the majority of tracer particles outside of the initial
placement area could be found south and onshore of it with numbers ranging from the low tens to
615 per sample. Only one DB location south of the feeder berm recorded nine tracer particles.
Ten months post initial deployment (campaign 8), the count numbers looked similar but sampling
locations shore- and southward of the initial tracer release area revealed increased particle counts.
This indicates that some onshore movement of sediment occurred over the three and a half months
between campaign 7 and 8. The final campaign after 15 months (campaign 9) only consisted of
DB samples. Counts ranged from zero to N = 21 tracer particles per sample, with zero counts
making up over half of the samples. Only one sample with a count over nine particles (N = 21)
was found. This sample was from the most southward DB location. This pattern in tracer particle
counts indicates that onshore transport and deposition on the dry beach likely occurred but the
stretch of beach with the most benefit may not be the one immediately landward of the feeder berm
depending on the prevailing nearshore dynamics. The tracer results show that placed material
moved to within 150 m (500 ft) of the beach face, and therefore well within the closure depth. The
residence time for material this close to the beach face, and its subsequent along-shore or cross-
shore transport pathways, are not known. It is clear, however, from the present study that material
moves from the nearshore berm to within the closure depth, and therefore is capable of nourishing
the beach.
22You can also read