Natural Hazards 2014 - Earthquake to Flood: Multi-Hazard Impacts - Natural Hazards Research Platform
←
→
Page content transcription
If your browser does not render page correctly, please read the page content below
Natural Hazards
2014

Earthquake to Flood: Multi-Hazard Impacts
CONTENTS 2014
Foreword ---------------------------------------------------------------------------------------------------------------------------------------------------------------------- 4
Platform Manager’s Perspective --------------------------------------------------------------------------------------------------------------------------- 5
The Platform at World Conference on Disaster Risk Reduction ---------------------------------------------------------------- 6
Residential Plan Draws Upon Opus’ Findings -------------------------------------------------------------------------------------------------- 8
Precast Concrete Floors: Seismic Behaviour of Connections and Wall-to-Floor Interactions ---------- 9
Quantifying the Seismic Response of Slopes in Christchurch and Wellington --------------------------------------- 11
Student Profile / Platform in the News -------------------------------------------------------------------------------------------------------------- 14
Mitigating Wildfire Risk: The Role of Weather Prediction ------------------------------------------------------------------------------ 15
Hazards Summary: Volcanic Activity ------------------------------------------------------------------------------------------------------------------- 18
Hazards Summary: Landslide Activity ----------------------------------------------------------------------------------------------------------------- 19
Hazards Summary: Earthquake Activity ------------------------------------------------------------------------------------------------------------- 20
Student Profile / Platform Research Near You -------------------------------------------------------------------------------------------------- 21
From Earthquakes to Floods: Multi-Hazard Impacts Come to the Fore ---------------------------------------- 22
Framework for Supporting Multi-Hazard Risk Assessment and Mitigation --------------------------------------------- 24
Earthquake-Flooding Multi-Hazards: Understanding the Stormwater System -------------------------------------- 27
Using RiskScape to Evaluate Increased Flood Risk --------------------------------------------------------------------------------------- 29
Hazards Summary: Wind and Tornadoes ------------------------------------------------------------------------------------- 31
Overview of ex-Tropical Cyclone Ita -------------------------------------------------------------------------------------------------------------------- 32
Hazards Summary: Temperature --------------------------------------------------------------------------------------------------------------------------- 35
New Zealand’s Volcanic Risk Research on the International Stage ---------------------------------------------------------- 36
Hazards Summary: Heavy Rain and Flood -------------------------------------------------------------------------------------------------------- 38
Hazards Summary: Coastal and Tsunami ---------------------------------------------------------------------------------------------------------- 39
Hazards Summary: Snow, Hail and Electrical Storms --------------------------------------------------------------------------------- 40
Hazards Summary: Low Rain and Drought ------------------------------------------------------------------------------------------------------ 41
Platform International ----------------------------------------------------------------------------------------------------------------------------------------------- 42
ShakeOut NZ --------------------------------------------------------------------------------------------------------------------------------------------------------------- 43
Suggested Citation:
Pinal, C., Brackley, H., Berryman, K. (Eds.) 2015. Natural Hazards 2014. Lower Hutt, NZ: GNS Science. GNS Science Miscellaneous Series 76, 44 p.
Cover: Contaminated flood water covering Christchurch road, 5 March 2014. Photo: Marney Brosnan, University of Canterbury
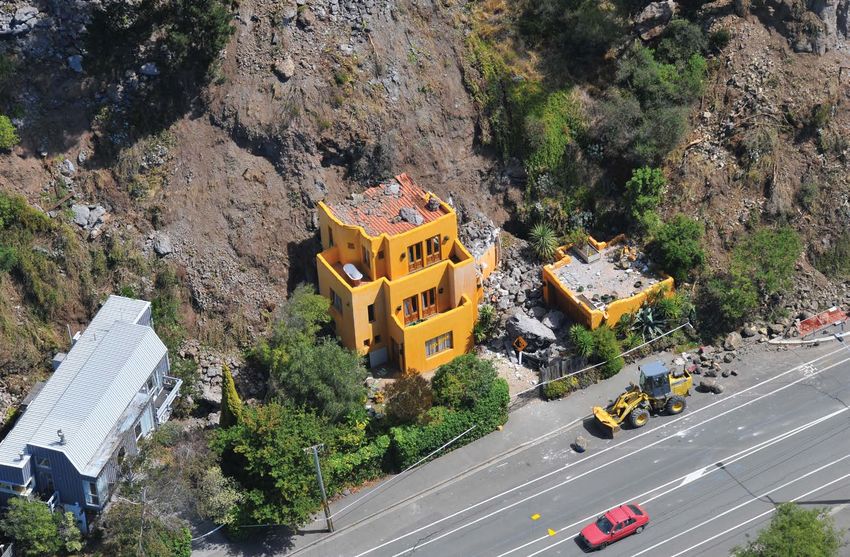
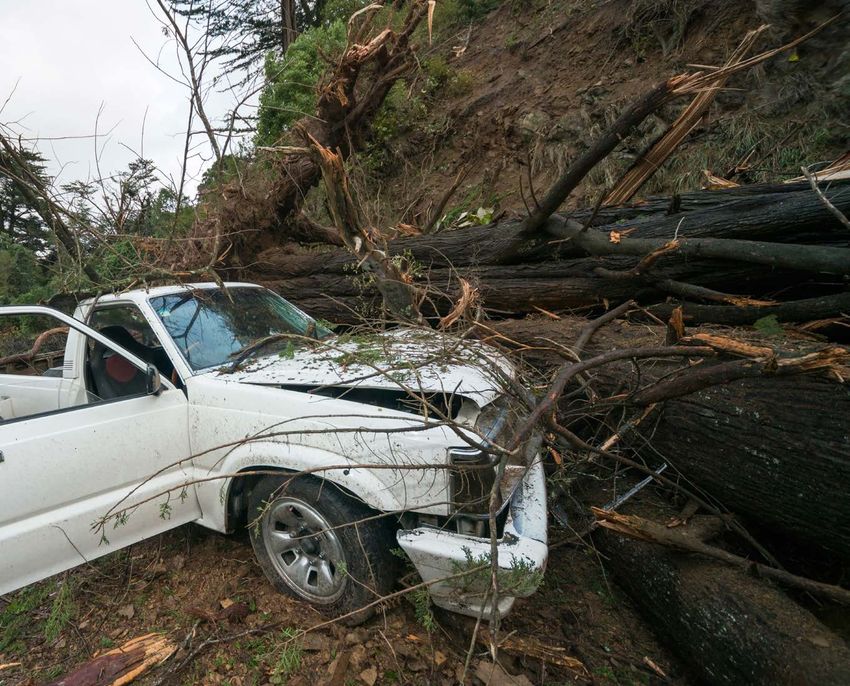
Inside: Rockfall at Redcliffs following the 22 February 2011 Canterbury earthquake. Photo: GT Hancox, GNS Science
Visit us at: www.naturalhazards.org.nz; twitter.com/NHRPNZ
2 3 Natural Hazards 2014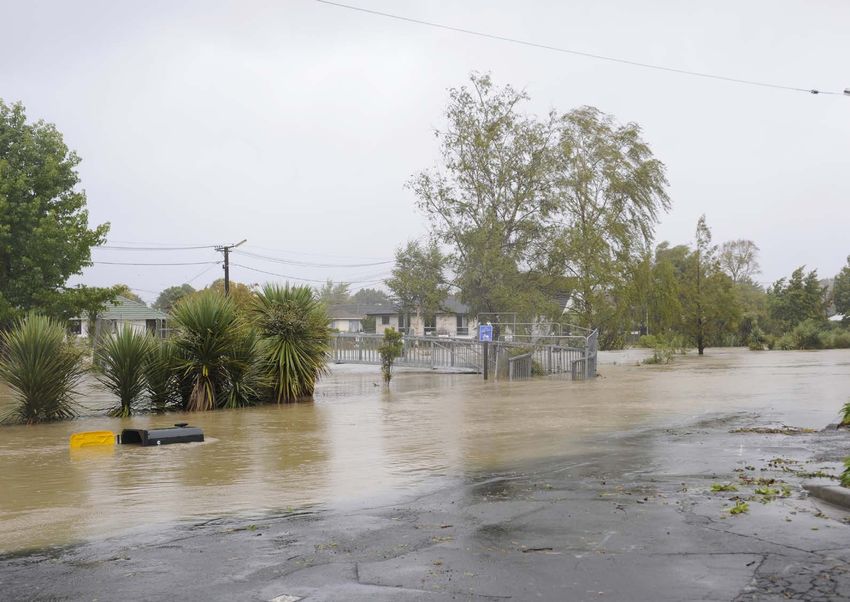
Platform Manager’s Perspective
Foreword
Good science and research are fundamental to disaster risk management (DRM).
Evolution, expectations, events, challenges and
This has long been recognised in New Zealand, together with the importance of
connectedness are key words for 2014 and into 2015. With
collaboration and partnerships.
respect to evolution I mean science priority settings and
There is an international dimension to this. Offshore collaboration enriches our new initiatives such as the National Science Challenges
domestic DRM expertise, not only in the underlying science, but also in policy, and recent announcement of the ‘QuakeCore’ as a Centre
planning and practice across the four "Rs" of risk reduction, readiness, response and of Research Excellence, a significant boost to earthquake
recovery. engineering in New Zealand. I say expectations because in
2014 the Platform was involved in a broad New Zealand-
International collaboration on DRM has also become an important part of New wide partnership involving significant preparation, dialogue
Zealand's world profile. We have a long history of supporting countries affected by and planning for the Sendai Framework for Disaster Risk
disasters, especially in the South Pacific, East and South East Asia and more widely Reduction. Events in 2014 – there were plenty - including
through the United Nations. It is about New Zealand being a good international citizen. It also very much reflects our flooding in Christchurch from rainstorms in March, April and
friendships and responsibilities in our part of the world. DRM is an area where New Zealand's domestic experience and June exacerbated by tectonic subsidence and liquefaction.
expertise are relevant and valued offshore. Platform researcher Dr. Sonia Giovinazzi (University of
Canterbury) gathered a research team to investigate multi- The Platform Management Group. Back row (l-r): Peter
Historically much of the international collaboration centred on readiness and response. The importance of risk reduction
hazard impacts in Christchurch and some of their findings are Benfell, Opus; Pierre Quenneville, U. Auckland; Jarg Pettinga,
and recovery is now being recognised and embraced. U. Canterbury; Front row (l-r): Murray Poulter, NIWA; Kelvin
reported in this issue.
Berryman, Platform Manager, GNS Science; Terry Webb, GNS
Countries in the South Pacific are increasingly providing leadership around disaster planning, especially the link with Science. Absent: Peter Kemp, Massey University
Early in 2014 the Platform was reviewed by MBIE to examine
climate change. Similarly there is very innovative thinking in East and South East Asia on issues such as the role of the
progress over its first four years (2009-13). Reviewers
private sector in helping prepare for and respond to disasters and get recovery under way.
identified that (i) Our performance exceeded contractual
The recent United Nations World Conference on Disaster Risk Reduction in Sendai, Japan, was an important event in expectations; (ii) Delivered value for money; and (iii)
Platform has been involved in a wide range of international
bringing together international experience and building better understanding of disaster risk reduction, its management, Provided a mechanism for the science sector to respond
collaborations. This includes participation in the recent 3rd
the value of investing in science and research, policy planning and practice to build resilient communities. quickly to external events. As always there are things to
World Conference on Disaster Risk Reduction. Engagement
improve upon, but it was recognised that the existence of
The Conference adopted a new Framework for Disaster Risk Reduction through until 2030. This sets out goals, action in the Sendai Framework was, personally, the highlight of
the Platform was critical to providing a coordinated response
priorities, targets and stakeholder roles at the international, regional and national levels. the year. The depth of engagement, trust in advice provided,
during the Canterbury earthquakes, a model mirrored during
and teamwork with MFAT and other agencies demonstrated
New Zealand made a substantial contribution to the Framework both in preparatory meetings over the last two years and the Tongariro eruption.
the excellent opportunity we have as a nation in taking
also in the final negotiations in Sendai. Throughout this process in shaping how New Zealand could most effectively substantial steps forward in reducing the impacts of future
The ‘Resilience to Natures Challenges’ (National Science
contribute, officials drew on a wide range of stakeholders including the Natural Hazards Platform for advice and input. natural hazard events in New Zealand.
Challenge) was in development over 2014. Once advanced,
Similarly the New Zealand delegation at the Conference, led by Hon Gerry Brownlee spanned cental Government, the the Platform and RNC will dovetail their strategy, science
Lastly, the management group of the Platform has also
wider research community, non-governmental organisations and local government representatives. This "joined up" management and stakeholder arrangements so as to
changed in the past year: Terry Webb (GNS Science) and
approach was a powerful demonstration of the value of collaboration and partnerships. maximise benefits for New Zealand. Our aim is to keep
Murray Poulter (NIWA) have retired; and Jarg Pettinga
stakeholders engaged though these new initiatives and
(University of Canterbury) has stepped down from the
It was clear at the Conference that there is continuing offshore interest in the lessons to be learned from our rearrangements.
management team to focus on research activities. I would
Christchurch experience. The Sendai Framework also provides impetus for ensuring a more resilient New Zealand.
like to thank Terry, Murray and Jarg for their major
I well recall in Christchurch the impact and emotions when the USAR teams and help from Australia, the United States, contribution to the success of the Platform. All three were
Japan, China, Singapore, the United Kingdom and others started to arrive. A lesson not to be forgotten. International founding members and their continued advice and support
collaboration and partnerships are essential. When natural disasters strike, they know no boundaries. We are all in it has been much appreciated.
together.
Kelvin Berryman, Platform Manager
More information:
QuakeCore - https://beehive.govt.nz/release/four-more-
centres-research-excellence-funded
Phillip Gibson Sendai Framework for Disaster Risk Reduction - http://www.
wcdrr.org/preparatory/post2015
Special Envoy Disaster Risk Management
Ministry of Foreign Affairs and Trade
4 5 Natural Hazards 2014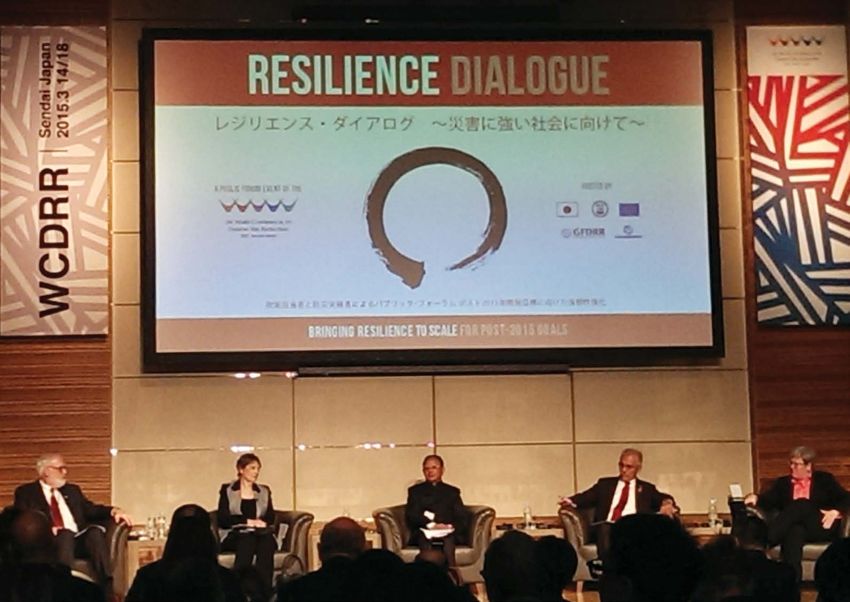
The Platform at World Conference on Disaster                                                                       Risk Reduction

Platform researchers played an active role in the         risk-informed decisions and risk sensitive planning       disaster risk reduction, resilience and transformation
World Conference on Disaster Risk Reduction               from local to global levels. It also calls for the        to achieve a more comprehensive view of disaster
(WCDRR) from 14 to 18 March 2015 in Sendai                coordination of existing networks and scientific          risk.
Japan. Representatives from 187 UN member States          research institutions at all levels, all regions and
                                                                                                                    Synthesis. To facilitate the uptake of scientific
adopted the first major agreement of the Post-2015        between countries. The goal is to strengthen the
                                                                                                                    evidence in policy-making, we need to synthesise it
development agenda, a far-reaching new framework          evidence-base in support of the implementation of
                                                                                                                    in a timely, accessible and policy-relevant manner.
for disaster risk reduction with seven targets and four   the new framework. The Platform recognises that if
priorities for action. The World Conference was           we want to continue to deepen our understanding           Scientific advice. To translate knowledge into
attended by over 6,500 participants, including 2,800      of evolving risks, the root causes of disasters and       solutions, the science community can provide
representatives from 187 governments. The Public          their impact on development, we need actionable           advisory capabilities integrating all fields of science,
                                                                                                                                                                                                             Caption: From left, David Johnston (GNS Science/Massey Univ), Phillip Gibson (see Foreword),
Forum had 143,000 visitors over the five days of the      research that is useful, usable and used. Scientists      technology and innovation in collaboration with                                          and Christine Kenney (Massey Univ) contribute to the 2nd Preparatory meeting for the 3rd
                                                                                                                                                                                                             WCDRR. Photo: YouTube, https://www.youtube.com/watch?v=EZS34TTS5wc
conference.                                               and researchers must work with policy-makers and          practitioners and policy-makers.
                                                          practitioners to co-design and co-produce research
The new Sendai Framework for Disaster Risk                                                                          Monitoring and review. The science and technology
                                                          that can be used effectively. The global science
Reduction 2015-2030 outlines seven global targets                                                                   community is ready to support the development of                                         Statement prepared by the Science & Technology Major
                                                          and technology community can support better                                                                                                        Group to the Third World Conference on Disaster Risk
to be achieved over the next 15 years: a substantial                                                                science-based indicators, common methodologies
                                                          monitoring and forecasting, help develop scenarios                                                                                                 Reduction, Sendai Japan
reduction in global disaster mortality; a substantial                                                               and processes to harness data and information, to
                                                          and identify options to manage risk (including related
reduction in numbers of affected people; a reduction                                                                promote their availability and use at different scales.
                                                          to climate change), propose resilient and sustainable                                                                                              Contact: David.Johnston@gns.cri.nz
in economic losses in relation to global GDP;
                                                          development pathways and test potential solutions to
substantial reduction in disaster damage to critical                                                                Communication and engagement. We need to build
                                                          assess their effectiveness and viability.
infrastructure and disruption of basic services,                                                                    closer partnerships between policy and research and
including health and education facilities; an increase    The Platform supports the global scientific and           among researchers themselves. We need to improve
in the number of countries with national and local        technological community’s call to strengthen the          the communication of scientific knowledge to
disaster risk reduction strategies by 2020; enhanced      implementation and monitoring of the Framework in         facilitate evidence-based decision-making at all levels
international cooperation; and increased access to        multiple ways. These include:                             of government and across sectors of society.
multi-hazard early warning systems and disaster risk
                                                          Assessment. Science can provide analytical tools to       Capacity building. Risk literacy needs to be
information and assessments.
                                                          assess and advance our knowledge of hazard, risk,         promoted through curricular reform, professional
The Post-2015 Framework for Disaster Risk                 and underlying risk drivers. It can also evaluate the     training and life-long learning across all sectors of
Reduction makes a strong call for science to support      need for a regular, independent, policy-relevant          society.
the understanding of disaster risk and to promote         international assessment of available science on

                                                                                                                    Main photo: Resilience Dialogue at the 3rd World Conference on Disaster Risk Reduction. Photo:
                                                                                                                    Hannah Brackley, NHRP

                                                                                                             6          7       Natural Hazards 2014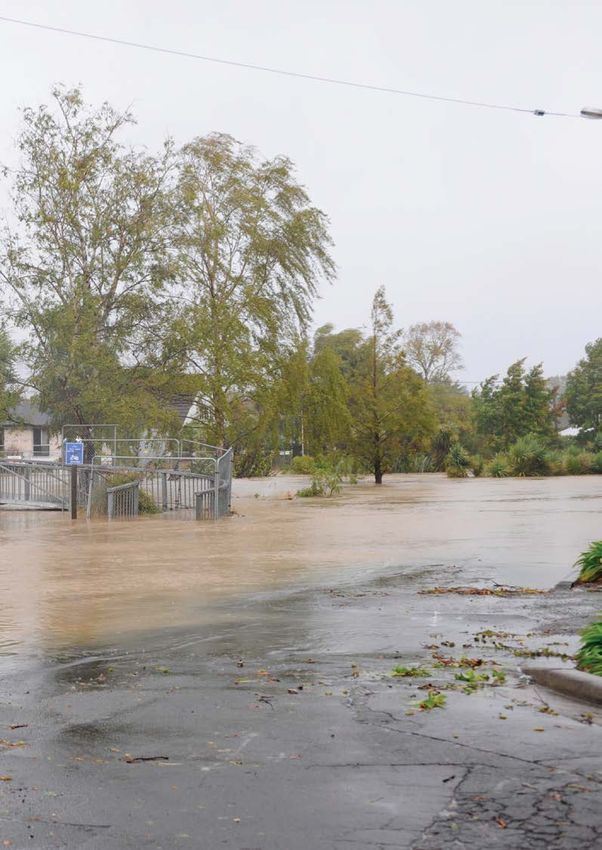
Residential Plan Draws Upon Opus’ Findings Precast Concrete Floors: Seismic Behaviour
of Connections and Wall-to-Floor Interactions
Floor diaphragms play an
important role in the seismic
response of buildings by
transferring forces to lateral and
vertical load-resisting systems.
However, the demands on floors
What will it take for the central city of Christchurch to be a successful place to live?
during earthquakes can result in
damage that compromises their Figure 1: Damage to precast floors during the Canterbury earthquakes
Developing a vibrant central researchers’ knowledge about connection to other elements
city is a critical but challenging urban environments, but some in the building, and in extreme Support connections The outcomes of these precast
component of Christchurch’s results proved surprising, such as cases may result in the collapse Experimental testing has been unit tests have resulted in
vision for recovery from the the one-fifth of respondents with of the floor. In New Zealand, conducted to investigate the recommendations that were used
2010/11 earthquakes. To help school-aged children who were floor diaphragms in multi-storey seismic behaviour of deep to support amendments currently
the city, the natural hazards prepared to move into the central buildings are typically constructed hollowcore precast units that use proposed to the New Zealand
team at Opus Research has been city early in the rebuild. using precast concrete floor recommended support connection Concrete Structures Standard (NZS
developing a robust, timely and units. Research in the past 20
Throughout the project, Opus details. Additional testing is in 3101).
local evidence base to guide years has highlighted a number of
engaged widely. The study itself progress to understand the seismic
rebuild and recovery decisions. vulnerabilities in the connections Wall-to-floor interaction
provided a forum to discuss and behaviour of precast concrete rib
Findings from Opus’ Central of precast concrete floor systems The Canterbury earthquakes
debate how to rebuild the central with timber infill floor systems
City Living Study continue that have resulted in significant further highlighted the need to
city and provide opportunities for that use typical pre-Canterbury
to inform Christchurch City changes to design standards and consider earthquake-induced
everyday activities. earthquake detailing, as well as
Council, Canterbury Earthquake construction practice. deformations on buildings
detailing recommended by the
Recovery Authority (CERA), CERA’s 2015 residential chapter, and the interaction between
Structural Engineering Society
health, transport, and housing A Liveable City, sets out initiatives The Canterbury earthquakes different structural and non-
(SESOC) after the Canterbury
authorities, as well as private in the rebuild. Developed by to stimulate residential recovery reconfirmed several of structural systems. For example,
earthquakes.
sector developers and consultants, Opus’ urban and behavioural in the central city through the previously identified the deformation of reinforced
and inform public discussion in psychology experts, the study changes to planning regulations vulnerabilities in precast concrete
the media. used sophisticated multimedia and processes. It is positive to floors and also raised new
Computer Assisted Personal see a number of our key findings concerns that hadn’t previously
One debate has been whether been considered (Fig. 1). The
Interviewing (CAPI) methods to represented in the chapter. These
people would want an urban Canterbury Earthquakes Royal
generate responses to simulated include recognition that recovery
lifestyle not traditionally offered Commission made a number of
neighbourhood amenity and of the commercial and residential
in Christchurch. Such uncertainty recommendations related to loads
housing options. Rather than sectors can help each other, the
poses a major risk to the recovery, and connection design in precast
simply capturing unrealistic need to support an urban lifestyle
with developers unwilling to concrete floors, as well as a need
‘wishlists,’ the method allows through managing land use and
invest without evidence of to develop greater understanding
researchers to test real life trade- transport, and the importance
demand, and authorities needing of the interactions between
offs. of encouraging early residential
to know which projects would structural elements.
rebuild projects. We will
best support a vibrant central Those individuals willing
continue to observe impacts of This research project is focused
city (such as public space and to move into an incomplete
the initiatives introduced to better on improving the seismic
amenities). We asked potential central city can play a vital role
understand their effectiveness at performance of connections
residents what it would take in the recovery, not least by
aiding recovery. in precast concrete floors and
for them have a good quality of providing a local market for the
life if they were to move to the emerging commercial sector. investigating the interaction
Contact: Vivienne.Ivory@opus.co.nz
central city at different stages Most findings were in line with between floor and wall systems The research team takes a break from seismic testing of a hollowcore floor unit at Stresscrete. From left are Sandra Yassi, James
as buildings deform during Daniels, Sam Corney, and Rick Henry.
earthquakes.
8 9 Natural Hazards 2014
Quantifying the Seismic Response of
Slopes in Christchurch and Wellington
The 2010/11 Canterbury amounts of cliff-top cracking than as sharp breaks in slopes, can also
earthquakes triggered mass smaller cliffs (Fig. 2). amplify ground shaking. However,
movements in the Port Hills an important factor in amplifying
including rockfalls, debris Our data have shown that
ground shaking is contrasting
avalanches, landslides and cliff-top amplification of shaking did not
geological materials, which in the
cracking. The most abundant mass increase linearly with increasing
Port Hills cliffs are quite variable.
movements with the highest risk to height, but instead reflected
people and buildings were rockfalls changes mainly in the cliff Figure 3 shows a schematic of the
and rock/debris avalanches. Over geology. Local topography, such locations where we sampled the
100 residential homes were
Figure 2. Structural interaction between wall and floor systems. Left, a single cantilever wall. Right, a coupled wall system.
impacted leading to the evacuation
of several hundred residents.
concrete walls can be restrained Project team Prof. Des Bull (Holmes Consulting
Our research looks at the effects
by the floor diaphragms (Fig. The project team includes Dr Rick Group and University of Canterbury),
that slope geometry, geology
2). Numerical models are being Henry and Prof. Jason Ingham and the low-damage wall tests were
and earthquake source have on
used to understand how the (University of Auckland), PhD conducted in collaboration with Prof.
amplifying ground shaking leading
deformations induced in the students Sam Corney, Ericson Sri Sritharan (Iowa State University)
to slope failure. This research
floor and the restraint provided Encina and Jonathan Watkins, and Prof. Cathy French (University of
was primarily focused on the
to the wall may alter the seismic and ME students Andy Ahn and Minnesota).
effects of the 2010/11 Canterbury
loads on parts of the building Richard Malcolm. The coupled wall
Contact: Rick Henry, earthquakes on slopes, ranging
and its overall behaviour during analysis included collaboration with
rs.henry@auckland.ac.nz from steep rock cliffs to shallow
earthquakes.
soil slopes in the Port Hills of
Low-damage systems Christchurch. The methods used
Low-damage concrete systems and the lessons learned from
can provide a more resilient Christchurch were then applied
building by minimising damage to some major slope types in
during large earthquakes. Wellington to test the results and
Rocking concrete walls can identify differences.
provide excellent low-damage
Results from the Port Hills cliffs
systems, but new wall-to-floor
For the debris avalanches and
connections need to be developed
rockfalls of the Port Hills (Fig.
to ensure that the floors are not
1), observations and monitoring
damaged and to maximise the
showed that the higher and
likelihood that the building can
steeper cliffs produced more
be reoccupied post-earthquake. A
debris, as one might expect. The
novel isolating connector has been
higher cliffs also suffered larger
developed and a large-scale test
of a rocking wall with a section of
Figure 1. A) The northern end of the Redcliffs site, taken shortly
floor was recently completed by Figure 3. Low-damage rocking wall system test at the University of Minnesota. after the 22 February 2011 earthquakes. B) The same site at
Redcliffs, taken after the 13 June 2011 earthquakes. Photos:
collaborators in the United States G.T. Hancox (GNS Science).
(Fig. 3).
10 11 Natural Hazards 2014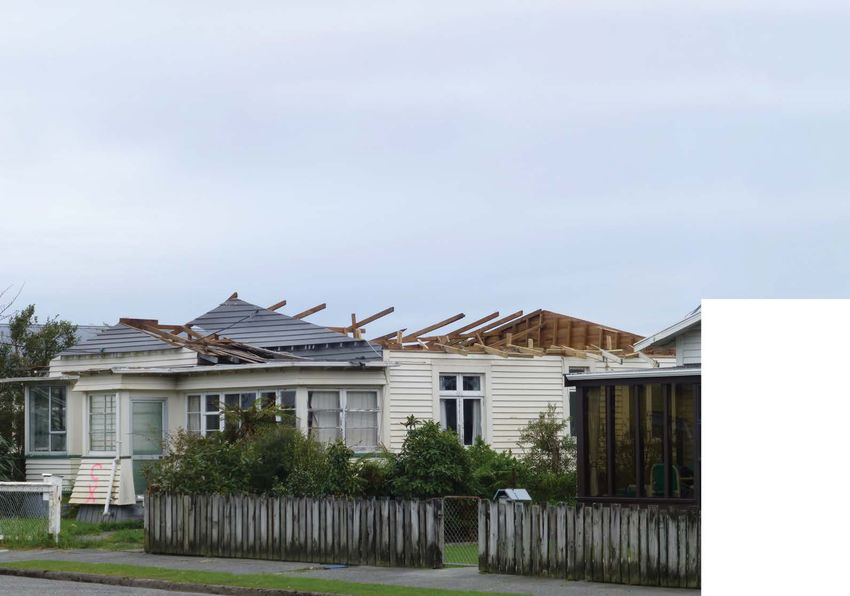
modelled accelerations
(ground motions). AMAX
represents acceleration
at the top of the cliff
“crest”, AFF represents
accelerations at the
bottom “toe” of the cliff,
and KMAX represents the
average accelerations Zone of cliff top cracking and
along a number of A displacement and recession Failure type B Potential failure surface/zone
Shallow rock topple/wedge of deformation in loess
simulated slide surfaces loess AMAX B failure surfaces and volcanic colluvium
(along which the Basalt
Potential deep-seated
failure surface
Cracks
Cliff top: recession and
displaced mass can lava
Topple/wedge deformation (slumping)
move) within the rock Typical
Basalt kMAX
Epiclastic scale loess
mass forming the cliffs. Breccia
10 m Topple/wedge
m
o
For slope-stability 10 m di vem
re
H=V scale ct en
assessments, Trachy-basalt
breccia
io t
n
Typical
characterising the 2010/11 debris
avalanche deposits scale
Volcanic
colluvium
shaking in terms of KMAX AFF 1m
is more representative Trachy-basalt lava 1m Basalt lava
than just using the Pre-2010/11 debris H=V scale
accelerations measured
from a single point at the
cliff top (AMAX) (Fig. 3). Figure 2. Relationships between slope height, inclination and extent of cliff-top cracking for cliffs in the Port Hills affected by the 2010/11 Canterbury Figure 3 A-B. Schematic cliff failure modes in the Port Hills that occurred during the 2010/11 Canterbury earthquakes. Shown are locations corresponding to acceleration sampling points at the crest
earthquakes. (AMAX) and free field (AFF), and average accelerations in the failure zone (KMAX).
Amplification ratios of
peak ground acceleration
(PGA) between the cliff bottom. and more than 10 metres of field and model accelerations compared as one of the inputs to
crest and cliff toe were in height) should include data from slopes in to those at the slope developing land zoning
Thus, the well Wellington, taking into
on average 2.0 (AMAX an amplification factor toe. The magnitude of policy. The lessons
documented Port Hills account the differences
and AFF, respectively), to take into account the amplification is currently from Christchurch are
case histories, involving in earthquake sources,
and 1.5 (KMAX and AFF) effects that slope shape difficult to quantify in influencing decision-
site-specific assessments, geology and topography
for Port Hills slopes and local geology have Wellington because there making across the
can provide more in Wellington compared
between 10 and 100 in amplifying shaking. is very limited subsurface country.
certainty in seismic to those in the Port
metres high and steeper However, for the design information available
landslide assessments, Hills, suggest similar
than 60 degrees. of structures located from the Wellington Contact: Chris Massey,
in general. The results results. That is, tall and
That means the peak near the edge of steep hill slopes, and so more
C.Massey@gns.cri.nz
suggest that the ground steep slopes, contrasting
acceleration (‘ground slopes, the maximum work will be needed in
motions used for geological materials
motions’) experienced acceleration at the slope this area. Our findings in
assessing the stability
at the top of the slope crest (AMAX), may be a and sharp breaks in the Port Hills were used
of steep and tall cliffs more useful parameter. slope cause measurable
could be two times by regulatory authorities
in Christchurch (slopes increases in ground
greater than that at the
greater than 60 degrees Preliminary assessment
12 13 Natural Hazards 2014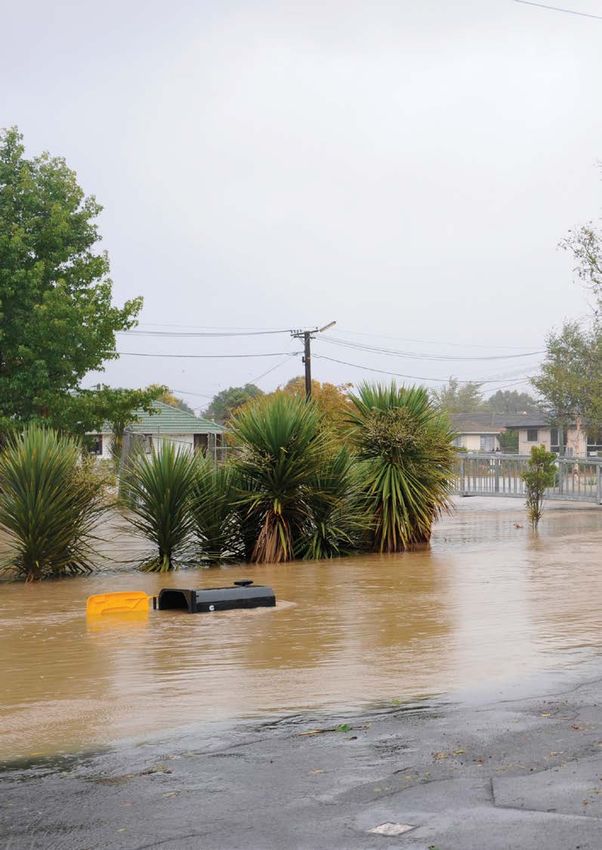
Mitigating Wildfire Risk – The Role of
   Platform-funded Students                                                                                Weather Prediction
   Lukáš Janků is studying towards    Wellington. With the
   a PhD in Engineering Geology       installation of temporary
   at the University of Canterbury,   seismic stations, quantification
   co-supervised by Drs Marlène       and numerical modelling can
   Villenueve (University of          be undertaken to create 2D
   Canterbury) and Chris Massey       seismic models of the sites,
   (GNS Science).                     while the seismic records can
                                      be used for calibration of the
   Lukáš is part of the
                                      models.
   ‘Quantifying seismic response
   of slopes...’ team, contributing
                                                                                                                                                                                                                                           Photo: Scion
   towards understanding the
   stability of hills around

                                                                                                           The NIWA-Scion fire weather             and Grassland. HFI indicates the                  as an integrated product that takes
                                                                                                           system (FWSYS) provides                 intensity of the head of a fire,                  account of land classification type.
Platform in the News                                                                                       practitioners and emergency
                                                                                                           managers with information that
                                                                                                                                                   which takes account of rate of
                                                                                                                                                   spread and land attributes acting
                                                                                                                                                                                                     As an example for Grasslands, the
                                                                                                                                                                                                     FWSYS can take account of the
                                                                                                           alerts them to potentially dangerous    as fuel. HFI can inform responders                initial spread index and the degree
• Researchers from Resilient Organisations invited to the ‘100 Resilient Cities Centennial                 conditions and provides access to       and/or decision-makers about the                  of grassland curing, a measure
  Challenge’ forum in New York. Resilient Organisations researchers John Vargo and Erica Seville           information to understand fire risk     effectiveness of different types of               of the proportion of dead grass
  gave a presentation on 13 June to the Rockefeller Foundation. The Foundation launched the 100            in the rural landscape and how that     suppression resources in containing               material present reflecting the stage
  Resilient Cities Centennial Challenge to enable 100 cities to improve their urban resilience over        risk is expected to change over time.   a fire.                                           of seasonal grass die-off.
  the next three years. Christchurch and Wellington are receiving support from the Rockefeller
                                                                                                           This new FWSYS builds on weather        The FWSYS computes rate of spread                 The current fire danger class as well
  Foundation to create and implement a resilience plan. http://www.comsdev.canterbury.ac.nz/rss/
                                                                                                           prediction research and tool            and head fire intensity for each                  as the FWI codes and indices are
  news/?feed=news&articleId=1339
                                                                                                           development carried out in the          land cover class separately, and                  calculated daily from data supplied
• Radio NZ interviewed Tony Bromley and Mike Revell (NIWA) on the joint NIWA-Opus Research                 Weather Hazards theme, and a
  project investigating wind speed over complex terrain. Their observations in the field and the Opus      strong collaboration with Scion.
  Research Wind Tunnel will contribute to how buildings are designed to withstand environmental
  factors. http://www.radionz.co.nz/national/programmes/afternoons/audio/2599123/measuring-wind-           Estimating Fire Risk: The New
  speed-across-complex-terrain                                                                             Zealand Fire Danger Rating
                                                                                                           System
• University of Canterbury engineers simulate large earthquakes to test low damage design. Stefano         The Fire Weather Index system uses
  Pampanin’s research team simulated high magnitude earthquake shaking based on recent global              observations of temperature, relative
  earthquakes. Their simulation study included adding components of low damage design. http://             humidity, wind speed and rainfall
  www.nzherald.co.nz/technology/news/article.cfm?c_id=5&objectid=11226229                                  to infer the effects of fuel moisture
                                                                                                           and weather on ignition potential
                                                                                                           and probable fire behaviour (Fig.1).
For more news and updates visit our website at www.naturalhazards.org.nz
                                                                                                           The five fire danger classes (Low
                                                                                                           to Extreme) that we see on the
                                                                                                           side of highways are the outcome
                                                                                                           of the Head Fire Intensity (HFI)
                                                                                                           predictor for each of three major
                                                                                                           land classifications: Forest, Scrub

                                                                                                                                                   Figure 1. New Zealand Fire Weather Index (FWI) System: Four weather inputs, three fuel moisture
                                                                                                                                                   codes and three fire behaviour indices. Higher code and index values indicate more severe fire
                                                                                                                                                   potential.

                                                                                                      14        15     Natural Hazards 2014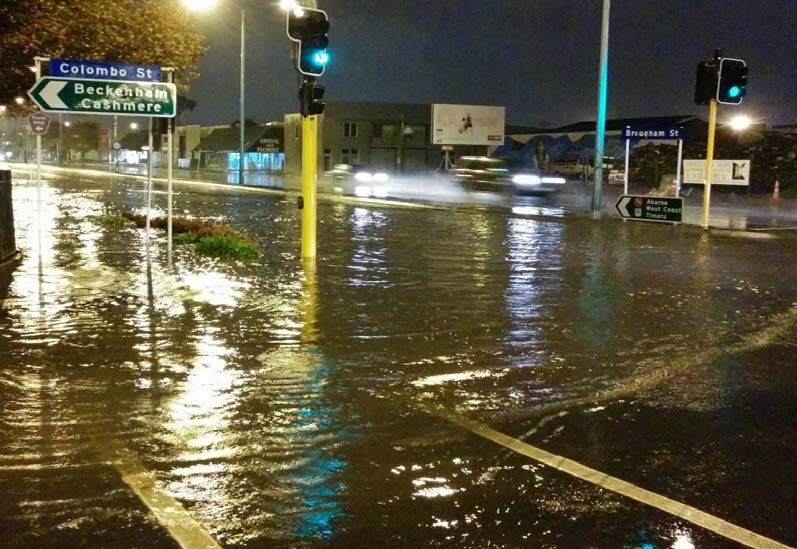
Figure 2. The implementation of the NZFDRS within EcoConnect. The diamonds containing “FWI” denote the system which generates the moisture codes, fire indices and danger classes from input   Figure 3. Observed Fire Danger Classes for (a) 07-Feb-2015, (b) 09-Feb-2015 and (c) 11-Feb-2015 as derived from the Remote Automatic Weather (RAWS) network, and forecast Fire Danger Classes
weather variables.                                                                                                                                                                             for (d) 09-Feb-2015 and (e) 11-Feb-2015 from forecasts initiated on the 07-Feb-2015.

from around 200 automatic                                         forecasts of FWI codes and                                         conditions out to six days ahead                          using forecasts initiated on the 7                               demonstrating the value of the                                    whether to issue burning permits,
weather stations spread across                                    indices, and of Fire Danger Class                                  (Fig. 2). The NZLAM-based fire                            February (and available to end                                   forecast data to mitigate fire risk                               and set readiness levels for fire
the country. Using geospatial                                     can be estimated, up to six days                                   danger forecasts are expected to                          users on that date). The forecast                                through management decisions in                                   suppression resources.
processing techniques (thin-plate                                 ahead.                                                             be the most accurate over the                             for 9 February (d) is based on                                   advance of days with forecast high
spline, above) these site-specific                                                                                                   first 2 days, and then the Global                         a 2-day weather forecast from                                    (or low) fire danger.                                             The new FWSYS is flexible and
data are interpolated onto a 5                                    Two different NWP models lie                                                                                                 NZLAM, while that for 11                                                                                                           automatically leverages advances
                                                                                                                                     model based forecasts for the
km grid that covers the whole                                     behind these calculations: NZLAM                                                                                             February (e) is based on a 4-day                                 Decision Tool                                                     in publicly funded research
                                                                                                                                     following 4 days.
country, allowing estimates of                                    (the New Zealand Limited Area                                                                                                forecast from the Global model.                                  Using the EcoConnect FWSYS                                        on increasingly more accurate
current fire danger to be provided                                Model) is used to provide a high                                   Figure 3 shows example forecasts                          Accordingly Fig. 3a-c show what                                  PC application, users can access                                  weather prediction models. This
for any location.                                                 spatial resolution (12 km) forecast                                of national Fire Danger Class.                            actually happened, and Fig. 3d-e                                 a large range of information to                                   will lead to even greater accuracy
                                                                  of weather conditions out to                                       Figs. 3a-c show the observed                              show the forecast fire danger                                    monitor fire weather conditions,                                  of both current and forecasted fire
Forecasting the Future Risk                                       two days ahead, then a global                                      values for the days of 7,9,11                             class up to 4-days ahead. The                                    determine when to carry out fire                                  danger estimates in future.
Using numerical weather                                           NWP model with 20 km spatial                                       February 2015 ; Figs. 3d-e show                           forecast and actual fire danger                                  prevention publicity efforts, set
                                                                  resolution, to extend the forecast                                 the forecast Fire Danger Class                                                                                                                                                               Contact: Michael.Uddstrom@niwa.co.nz
prediction (NWP) models,                                                                                                                                                                       classes are encouragingly similar,                               fire season restrictions, decide

                                                                                                                                                                                         16         17        Natural Hazards 2014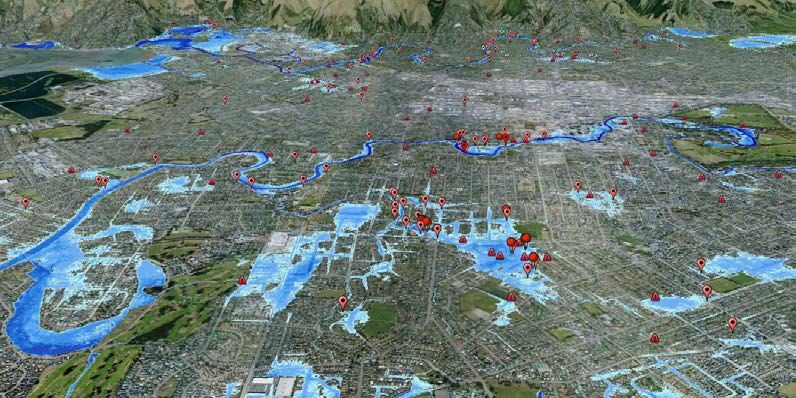
Volcanic Activity Landslide Activity
In contrast with 2012 and 2013, GNS Science recorded over 500
which were busy years with eruptions landslides in 2014, some of which
at Tongariro and White Island, damaged roads, houses and other
2014 was on the quiet side, with no infrastructure. The majority of these
eruptions to report. landslides followed heavy rainfall,
Raoul Island
however a significant earthquake
In early December, Ruapehu Crater
Bay of Islands near Eketahuna triggered about 100
Lake cooled down and reached a
landslides. There was one fatality
minimum of 15 degrees C before
and a near-miss incident as a result of
heating up again, as it has many times
rockfall.
before.
Significant rainstorms that triggered
Tongariro was very quiet, with very Auckland
landslides occurred in Christchurch in
little seismic activity and a general N Mayor Island March, over much of the North Island
decline of gas emissions and fumarole
White Island in April, and in Northland in July.
temperature at the Te Maari vent.
On 6 January a landslide on Tarewa
Except for a short swarm of Edgecumbe
Road, Gisborne, severed the water
earthquakes in August, activity at Haroharo Okataina
pipe that feeds Gisborne’s main water
White Island also remained at a low Tongariro & Taupo Tarawera
Ngauruhoe supply. The Gisborne district was
level, allowing monitoring work to
Taranaki/ faced with a water supply crisis for
be carried out at the crater floor, and
Egmont Ruapehu four days while the landslide was
3-monthly crater floor surveys and
stabilised and the pipeline repaired.
crater lake sampling to resume. We
also took the opportunity to increase On 20 January, the M6.2 Eketahuna
the level of continuous monitoring earthquake triggered landslides and
on the island with the installation of rockfalls, with several large landslides
an additional webcam on the western on the eastern Puketoi foothills.
crater rim, providing unprecedented Rockfalls were reported from as far
Historically active Significant landslide events across New Zealand
views of the crater floor to everyone, away as Parapara Road, Wanganui,
and of a GPS station near the factory, 0 100km Active in the past and on the Rangitikei River cliffs at
in the crater floor. Several remote 10,000 years Mangaweka. 73 near Arthur’s Pass, closing the On 15 July, a large rock avalanche
sensing technologies were also tested popular tourist route for four days. on Mount Cook/Aoraki engulfed a
to measure gas concentrations in the Heavy rain on 4-5 March caused climber’s hut. A section of the South
plume from a distance (laser diode, a moderate-sized slip in Lyttleton On 10 June extreme rainfall in the
(Hillary) Ridge collapsed and swept
FTIR). (about 2,000 cubic metres), which northern part of Coromandel triggered
across the Hooker Valley, nearly
damaged a house and a fuel tank debris flows, resulting in damage of
Zealand volcanoes, restructuring the taking out Gardiner Hut. The 900,000
2014 also marked a change in the below, and forced the evacuation of more than $1 million to roads and
system with an additional level for cubic metre rock avalanche was the
New Zealand Volcanic Alert Level 19 houses while the stability of the infrastructure. The same storm also
‘moderate to heightened volcanic third rock avalanche to hit the area in
(VAL) system. This system is used by hillside was assessed. The same storm triggered landslides on Great Barrier
unrest’ (instead of just one level the last 18 months.
GNS scientists to characterise and caused several slips on Wellington’s Island and in Northland, Waikato,
for all volcanic unrest), and adding
convey the level of activity at New south coast. Bay of Plenty, Gisborne, Wairarapa, In September, a slow-moving
information about the most likely
Zealand volcanoes to the authorities, and North Canterbury regions. landslide on Hill Rd, Gisborne,
hazards accompanying each level of On 16-18 April, ex-tropical Cyclone
stakeholders and general public. damaged a house and put two further
activity. Ita brought heavy rain throughout In Northland, heavy rain from 8-14
Changes in the new system include houses under threat. The three houses
having just one system for all New New Zealand. Many roads were July caused widespread flooding and
Data: GeoNet were evacuated by the Council.
closed or affected by landslides from landslides, including a washout near
the Bay of Plenty to Marlborough. Kawakawa that closed SH1 for seven Data: GeoNet
days. On 19-20 July a second period
On 23 May, heavy rain caused of heavy rain struck the Far North and
an 8,000 cubic metres slip on SH caused further damage.
18 19 Natural Hazards 2014Earthquake Activity
The most significant earthquake of
the year was the M6.2 Eketahuna Platform-funded Students
earthquake of 20 January. It was
centred 14 km east of Eketahuna and Vicki Johnson recently two original evaluations of
was 34 km deep inside the crust of completed her doctorate at disaster education programs for
the subducting Pacific Plate. This was Massey University, Wellington, children in the U.S. and New
the most widely felt earthquake of the supported by GNS Science and Zealand, which served as case
year and the only one to register any the Joint Centre for Disaster studies. Vicki is now living in
reports of heavy damage, attracting Research. Vicki’s thesis, entitled San Francisco with her husband
9,448 'felt it' reports on the GeoNet “Evaluating Disaster Education and son, and is a Policy and
website.There were more than 4,600 Programs for Children,’ aimed Government Affairs Manager
aftershocks, with 18 of those greater to generate new theories on for the San Francisco Public
than magnitude 4 and two over how to evaluate the outcomes Utilities Commission.
magnitude 5. and societal impacts of
disaster education programs
Earthquakes greater than magnitude for children. Based on the
5.0 occurred in the central North finding that few evaluations
Island on 31 March (centred examined program theories,
near Waipukurau), 6 June (near Eketahuna
(Jan 20th) models were developed for
Ohakune), 23 September (northeast
of Eketahuna, near Pahiatua) and
6 October (near Murupara). The
Ohakune quake was the second
most widely felt of the year, with
5,887 'felt it' reports on the GeoNet
Platform Research Near You
website, although most (5,167)
Mag > 4
reported it as 'light'. It was 106 km
deep and was a magnitude 5.1. On
Mag 5−6
23 May and 20 October, quakes of • Scientists map Auckland volcanic zone. A new, geology-based approach has predicted just how
just over magnitude 5.0 occurred in
Mag > 6 susceptible various areas of Auckland are for explosive volcanic activity – with Three Kings and Māngere
Fiordland. Both were centred within identified as potentially high-risk areas. The project team includes Gábor Kereszturi (Massey Univ), Jon
50 km of Te Anau but only a single Procter (Massey Univ), Shane Cronin (Univ Auckland), Mark Bebbington (Massey Univ), Mr Mike Tuhoy,
"strong" report was registered on the Karoly Nemeth (Massey Univ) and Jan Lindsay (Univ Auckland). Link: http://www.massey.ac.nz/massey/
GeoNet site. The 23 May shake, about-massey/news/article.cfm?mnarticle_uuid=B0092F68-C296-2BA4-DE29-AAAC292CCCCB
which was 80 km deep, attracted just usually identified by examination of offshore seismometers were placed
seven "moderate" reports to GeoNet. the continuous GPS data recorded there as part of an international • NIWA develops and tests a first generation flood-inundation model for the Karamea River.
On 20 October, the 134 km-deep by GeoNet. These “slow slip” research project “Hikurangi Ocean
earthquakes usually occur over Bottom Investigation of Tremor and • A GNS Science study on tsunami risk in Napier has been incorporated into the region’s hazards
quake was reported "moderate" by
weeks to months, rather than in Slow Slip (HOBITSS) to capture the planning. In work led by PhD student Stuart Fraser and GNS scientist William Power, earthquake and
three and "light" by 308. A magnitude
seconds, and are not felt by people. slow slip, in order to improve our inundation scenarios, and vertical evacuation options were developed for Napier and incorporated
6.5 quake on 17 November had
In September 2014 there was a understanding of this phenomena. into hazards planning by the Hawkes Bay Regional Council. Link: http://www.stuff.co.nz/dominion-
only six "strong" reports and 62
Magnitude 6.8 slow slip event off post/10120115/Napier-centre-at-risk-of-tsunami.
"moderate", but did get 2,648 'light' Data: GeoNet
the Gisborne coast, which occurred
reports. It was centred about 220 km • ‘Resource Management Act, Emergency Management and Infrastructure Resilience.’ Wendy Saunders
northeast of Gisborne and was about over two weeks and which was
(GNS) and Roger Fairclough (National Infrastructure Unit) gave presentations on the topic in Nelson,
32 km deep. successfully ‘captured’ by recording
Taranaki and Wellington.
instruments onshore, as well as by
“Slow slip” earthquakes are ocean-bottom research seismometers
recognised to be occurring along the on the seafloor off Gisborne. These For more news and updates visit our website at www.naturalhazards.org.nz
Hikurangi subduction zone, and are
20 21 Natural Hazards 2014From Earthquakes to Floods:
Multi-hazard impacts come to the fore
Following the Canterbury earthquakes, damage to engineered lifelines combined with changes
in the physical environment to substantially increase flood risks for some parts of the city.
From low-lying coastal areas to more elevated inland areas, quake-impacted communities
experienced several post-quake floods, with streets, driveways and homes inundated, often with
On 4-5 March 2014, heavy rain fell over Christchurch. contaminated water.
Researchers from the University of Canterbury are working with colleagues from the American
Described as a ‘1-in-100 year’ event, it was the fourth storm Society for Civil Engineering (ASCE) to examine earthquake and flood multi-hazard interactions,
with an additional project focused on the stormwater system. Meanwhile at NIWA, hydrologists
in three months to overcome the city. Researchers from the and engineers applied the RiskScape model to estimate losses and investigate effects of
University of Canterbury and NIWA managed the research mitigation efforts. The increased flood risk after the Christchurch earthquakes has highlighted
that we need to re-think potential future vulnerabilities of communities and engineered lifelines.
response. Main: Contaminated flood water covering Christchurch road. Photo: Marney Brosnan, University of Canterbury. Inset: Differential LiDAR data shows total vertical movements through the
entire Canterbury earthquake sequence. Red shading shows vertical ground differences before and after the earthquakes in the range of 0.5-1 metres. Graphic: David Holland, University
of Canterbury; Data: Canterbury Geotechnical Database (2012) “LiDAR and Digital Elevation Models”, Map Layer CGD0500 - 23 July 2012, retrieved 14 March 2014 from https://
canterburygeotechnicaldatabase.projectorbit.com/
22 23 Natural Hazards 2014Framework for Supporting Multi-Hazard Risk
Assessment and Mitigation
Many strategies and policies for each identified multi-hazard link; Table 2 illustrates *The NZ team with Marion Gadsby (ECAN) investigated the 5 March
the mitigation of natural hazard Natural Built flooding alongside the Geotechnical Extreme Events Reconnaissance
an example related specifically to the “Topography- (GEER) team. See our Report: http://www.geerassociation.org/GEER_
risks consider the majority of Groundwater” interaction.
Topography Land use Post%20EQ%20Reports/Christchurch_Flood_2014/index.html.
hazards as discrete, isolated
events. The 2011 Canterbury Groundwater Wastewater systems Simplified conceptual diagrams summarizing the IRD was formerly the Technical Council on Lifeline Earthquake
earthquakes and the Tohoku EQ relationships are in development. Below is one such Engineering, TCLEE. The IRD team for this project is led by Dr. Craig
Davis and Alex Tang.
earthquake-tsunami sequence Waterways Stormwater systems example representing the possible flood risk effects
demonstrated a different reality. of two consequences of earthquakes: damage to
Baseline System operation buildings and damage to the stormwater system.
After any significant disaster, Floods
multi-hazard interactions and Soils Reconstruction By Su Young Ko, Deirdre Hart, Tom Cochrane and
cascading effects may alter the risk Sonia Giovinazzi
to impacted communities from
other hazards (Fig. 1). Contact: Sonia.Giovinazzi@canterbury.ac.nz
Thanks to initial support from
Figure 1. Components of the natural and built environment that could be affected by an earthquake and modify subsequent flood
the Natural Hazards Research potential.
Platform and co-funding by
stakeholder agencies, a team
current state of knowledge
of engineers and geographers
for urban environments, and
is investigating these issues
identified the components of the EARTHQUAKE
in New Zealand and Japan. A
natural and built environment that
collaboration initiated in New
can be affected by and contribute
Zealand in 2012 between the Manpower in Increases
to multi-hazard interactions and Damages to buildings
University of Canterbury (UC) reconstruction
cascading effects for earthquake-
and the Infrastructure Resilience Decreases
flood scenarios. We have also
Division (IRD), a technical group Demolition Manpower in
developed a conceptual model
of the American Society of Civil maintenance
representing the mechanisms that
Engineers (ASCE), and supported
result in modification of different
by Environment Canterbury,* Pervious surfaces
types of flood risks after an
is allowing us to develop a risk Damages to
earthquake. stormwater network Leaves blocking
assessment framework applicable Photo: Su Young Ko is a PhD candidate in in civil and natural
resources engineering at the University of Canterbury
Sediment erosion stormwater inlets
to the analysis, mitigation The main earthquake-flood
and management of complex interactions are summarized in
multi-hazard scenarios, using the Tables (p. 26). For each one,
within an urban environment, Sediments entering stormwater inlets
earthquakes and floods as a case there is a succinct explanation of
followed by clarifying the needs
study. the key changes to the natural and
and recommended approaches
for investigating the identified built environment brought about Sedimentation and blockages Land drainage
Our aim for the framework Pluvial flooding
earthquake-flood interactions. by the multi-hazard interactions, in sumps/pipes/outlets capacity
is to create a matrix for the
and the main factors influenced by
identification of earthquake-flood
We have so far completed a cascading effects. Table 1 shows
interactions and causative factors Figure 2. Sequence of cascading effects initiated by earthquake-induced damage to buildings and to the storm-water system that could possibly affect flood risk.
comprehensive review of the a list of all factors affected by
24 25 Natural Hazards 2014Main multi-hazard interactions Exposed/Affected Factors ID Earthquake-Flooding Multi-Hazards:
A) Topography - Groundwater Wetland characteristics
Stormwater retention basin capacity
a1
a2
Understanding the Stormwater System
Soil water storage capacity a3
Surface ponding from groundwater a4 Earthquake-induced damage to potable water, of a stormwater system could affect post-earthquake
B) Topography - Stormwater (SW) System SW catchment area b1 wastewater, roading and other lifeline systems has flood risk.
SW system capacity b2 been well documented following recent earthquakes
worldwide, but there has been little research into Our aim is to help lifeline end-users understand and
Surface ponding from runoff b3
understanding the effects on the stormwater system. manage stormwater system multi-hazard impacts.
C) Waterways/Open Channels - SW Water storage capacity c1
End-users can adopt our methodology as a tool to
Water transport capacity c2
One reason might be that, while the importance of help manage lifeline systems and further lifeline
Water transport capacity c3
available drinking water and functioning wastewater system resilience.
Water transport capacity c4 post-event is clear, people may not be aware of
Back water effect upstream c5 the importance of assuring the correct level of Understanding the system, its components and their
D) Waterways/Open Channels - Ocean Tidal influence d1 stormwater protection. purpose is crucial to recognising damage sustained
E) Reconstruction - SW System Infiltration e1
post-event.
Our research addresses how the seismic vulnerability
SW capacity e2
F) Reconstruction - Groundwater Soil water storage capacity f1
G) SW System - Soils Soil moisture and infiltration g1
H) SW System - Groundwater Groundwater table h1
Stormwater drainage capacity h2
I) Wastewater System - Groundwater Groundwater table i1
L) Operational - SW System Tree leaves and debris blocking l1
Table 1. Main multi-hazard interactions between components of the natural (green) and built (blue) environments that could be simultaneously exposed to and/or causative factors for multi-hazard
earthquake-flooding interactions and cascading effects.
A) Topography - Groundwater
Explanation on the main multi-
Key changes Affected factors in relation to flooding
hazard interaction
Changes in the vertical land Wetland characteristics (a1)
elevation means the relative depth
to the groundwater table is changed. Depth to ground-water table Stormwater retention basin capacity (a2)
Changes in hydrogeology (movement
of groundwater) could mean surface Soil water storage capacity (a3)
flooding from groundwater or newly
emerged springs. Previously existing New springs Surface ponding from groundwater (a4)
springs could disappear.
Table 2. Details on “Topography-Groundwater” interaction.
26 27 Natural Hazards 2014Using RiskScape to Evaluate Increased
Flood Risk
A stormwater system taxonomy Using our methodology,
was developed, and we designed stormwater asset managers will
a simplified stormwater system be able to identify data that
placement diagram. This links the are critical to collect and have
components in the taxonomy to a on hand to facilitate pre-event
simplified graphic representation. mitigation strategies and post-
The role of each component can event system assessment and
be viewed at a glance within recovery decision-making.
the system. This is the first time
this approach has been adopted This taxonomy-based approach
in New Zealand. A combined will aid in the identification
taxonomy and layout diagram of elements and/or areas in a
ensures a prompt and systematic stormwater system that could be
model that can be clearly vulnerable to flooding because
understood by the relevant end- of underlying interlinked
users and stakeholders in the environmental factors.The
involved communities. proposed format will provide
Photo: David Holland is pursuing his Master’s of Engineering
a roadmap of possibilities for degree at the University of Canterbury
Currently, damage and changes emergency management and asset
to each system component are managers and can be used to help
being assessed, with limited inform communities nationwide. Council, Waimakariri District Council,
prior research in this area. Selwyn District Council, Environment
Understanding the damage caused By David Holland, Deirdre Hart Canterbury, Chorus, Orion, Contact
and Sonia Giovinazzi Energy and the UC Quake Centre.
to each system component and
documenting the findings using Following the 4-5 March event, NIWA hydrologists and records of emergency callout locations and the
Contact: Sonia.Giovinazzi@canterbury.ac.nz set out to measure the floodwaters and map the resulting point data were interpolated to derive flood
the taxonomy framework will
markedly improve management worst-affected suburbs with the added help of ‘citizen depth maps.
Giovinazzi, Ko, Holland and team
of stormwater system multi-hazard science.’ Using local and social media, residents
are grateful for the support and Once a flood hazard map was available, it was
resilience. useful discussions with Canterbury were asked to email photos they had of the flooding,
CDEM, EQC, Christchurch City especially peak water levels. used in conjunction with the “RiskScape” model to
calculate economic costs of the flooding.
In the space of a few days, more than 600 photos
were received and work began on refining a flood Using the provisional flood maps, RiskScape forecast
map of the event using some of the evidence that homes in Mairehau would cost $1.28 million
provided by residents. to repair, with $900,000 lost in content damage.
When the cost of the clean-up was added in, the cost
The first step was to establish the exact location of of house flooding in Mairehau totalled about $2.2
each photograph (many cameras and smartphones million.
now record time and location information within
the digital image files). Then the water level on Total subsidence*
relevant photographs was calculated. Often the
200-400 mm at Mairehau
water level could be determined (using position 400-1000 mm at Burwood
co-ordinates of the water’s edge) from ground level
information given by post-earthquake, airborne laser Rainfall 4 March 2014
surveys. In locations where photos did not permit 123 mm at Riccarton
clear identification of water levels, field visits were 153 mm at Lyttelton
carried out to make supplemental measurements. *Total subsidence includes subsidence as a result of
Information was collated from all photos, surveys tectonic forces and liquefaction.
28 29 Natural Hazards 2014You can also read