Review Article Possible future scenarios for two major Arctic Gateways connecting Subarctic and Arctic marine systems: I. Climate and ...
←
→
Page content transcription
If your browser does not render page correctly, please read the page content below
ICES Journal of Marine Science (2021), https://doi.org/10.1093/icesjms/fsab182
Downloaded from https://academic.oup.com/icesjms/advance-article/doi/10.1093/icesjms/fsab182/6382408 by guest on 13 October 2021
Review Article
Possible future scenarios for two major Arctic Gateways
connecting Subarctic and Arctic marine systems: I. Climate and
physical–chemical oceanography
Kenneth F. Drinkwater ,* , Naomi Harada , Shigeto Nishino , Melissa Chierici , Seth L. Danielson ,
Randi B. Ingvaldsen , Trond Kristiansen, , George L. Hunt, Jr , Franz Mueter , and
Jan Erik Stiansen
1
Institute of Marine Research, Oceanography and Climate Research Group, PO Box 1870, Nordnes N-5817, Bergen, Norway
2
Japan Agency for Marine-Earth Science and Technology (JAMSTEC), 2-15 Natsushima-cho, Yokosuka 237-0061, Japan
3
Institute of Marine Research, Oceanography and Climate Research Group, Fram Centre, Tromsø, Norway
4
School of Fisheries and Ocean Science, Institute of Marine Science, University of Alaska Fairbanks, Fairbanks, AK 99775-7220, USA
5
Fallon Institute, Petaluma, CA, USA
6
Norwegian Institute for Water Research (NIVA), Gaustadalle´en 21, NO-0349 Oslo, Norway
7
School of Aquatic and Fishery Sciences, University of Washington, Seattle, WA, USA
8
College of Fisheries and Ocean Sciences, University of Alaska Fairbanks, Juneau, AK, USA
∗
Corresponding author: tel: +47 9767552; e-mail: ken.drinkwater@hi.no
Drinkwater, K. F., Harada, N., Nishino, S., Chierici, M., Danielson, S. L., Ingvaldsen, R. B., Kristiansen, T., Hunt, G. L., Mueter, F., and Stiansen, J. E.
Possible future scenarios for two major Arctic Gateways connecting Subarctic and Arctic marine systems: I. Climate and physical–chemical
oceanography. – ICES Journal of Marine Science, : –.
Received March ; revised August ; accepted August .
We review recent trends and projected future physical and chemical changes under climate change in transition zones between Arctic and
Subarctic regions with a focus on the two major inflow gateways to the Arctic, one in the Pacific (i.e. Bering Sea, Bering Strait, and the Chukchi
Sea) and the other in the Atlantic (i.e. Fram Strait and the Barents Sea). Sea-ice coverage in the gateways has been disappearing during the last
few decades. Projected higher air and sea temperatures in these gateways in the future will further reduce sea ice, and cause its later formation
and earlier retreat. An intensification of the hydrological cycle will result in less snow, more rain, and increased river runoff. Ocean temperatures
are projected to increase, leading to higher heat fluxes through the gateways. Increased upwelling at the Arctic continental shelf is expected as
sea ice retreats. The pH of the water will decline as more atmospheric CO is absorbed. Long-term surface nutrient levels in the gateways will
likely decrease due to increased stratification and reduced vertical mixing. Some effects of these environmental changes on humans in Arctic
coastal communities are also presented.
Keywords: Arctic Gateways, Barents Sea, Bering Strait, Chukchi Sea, climate change, Fram Strait, hydrography, nutrients, ocean acidification, sea
ice.
increasing levels of atmospheric carbon dioxide (CO2 ) (e.g. IPCC,
Introduction 2013; Overland et al., 2017). Interest in the Arctic has increased dur-
For much of the last century the world has been warming under the ing the last few decades because of the extraordinary changes that
influence of the greenhouse effect associated with human-induced are occurring there and the declaration by the Intergovernmental
C International Council for the Exploration of the Sea 2021. This is an Open Access article distributed under the terms of the Creative
Commons Attribution License (http://creativecommons.org/licenses/by/4.0/), which permits unrestricted reuse, distribution, and
reproduction in any medium, provided the original work is properly cited.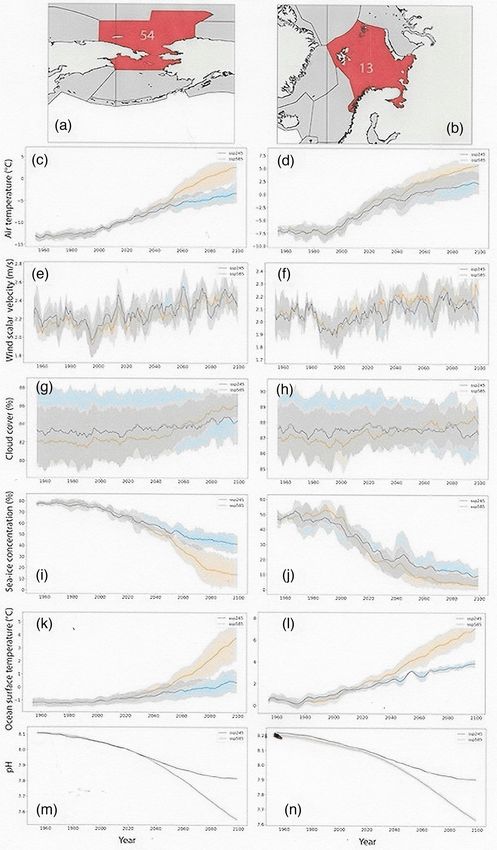
K. F. Drinkwater et al.
Downloaded from https://academic.oup.com/icesjms/advance-article/doi/10.1093/icesjms/fsab182/6382408 by guest on 13 October 2021
Figure 1. The Arctic Ocean showing the surface circulation patterns (red arrows denote relatively warm currents, blue colder currents). The red
and blue bars denote the inflowing and outflowing regions of the major Arctic Gateways. The white regions show the catchment areas for the
fresh water flowing into the Arctic. The yellow circles denote the primary study areas of the RACArctic project. (Modified from Prowse et al.,
). Image courtesy of the Arctic Monitoring and Assessment Programme (AMAP).
Panel on Climate Change (IPCC) that the Arctic region is one of the changes under future climate change. Temporally, focus is on the
areas of the world most vulnerable to global warming (IPCC, 2013). near future (2050s) where possible, but we also consider likely sce-
Indeed, within the Arctic, air and ocean temperatures have risen, narios out towards 2100. We discuss some climate impacts on Arc-
sea-ice coverage has declined, and the area of open water in sum- tic residents as well as a few low probability events that if they did
mer has increased, allowing greater exchange of CO2 between the occur would have major ecosystem consequences.
atmosphere and the ocean. The latter has led to an increased acidity The projections presented below are mostly from General Cir-
(declining pH) of Arctic marine waters (ocean acidification). Un- culation Models (GCMs) or downscaled regional climate mod-
derstanding the impact of the combined warming, sea-ice loss, and els (RCMs) from GCMS. The IPCC (2013) Representative Con-
ocean acidification (OA) on the organisms in the Arctic region is centration Pathway (RCP) 4.5 and RCP8.5 are used for many of
necessary to predict the changes in biological productivity (Mueter the projections of future greenhouse gas (GHG) emissions. The
et al., this issue). former represents an intermediate GHG scenario and the lat-
The present paper reviews recent trends and projected future ter the highest, often referred to as the “business as usual” sce-
conditions of several physical and some chemical characteristics of nario. A few studies we cite use an earlier IPCC classification of
the waters in the transition zones between the Arctic and Subarctic GHG: A2 for high emission (low mitigation) scenarios and B2
in the two major inflow regions to the Arctic (Figure 1), the Pacific for low emissions (high mitigation). We also present some re-
Gateway (Bering Sea, Bering Strait, and the Chukchi Sea, Figure 2) sults as part of CMIP6 (Coupled Model Intercomparison Project
and the Atlantic Gateway (Fram Strait and the Barents Sea, Figure Phase 6) where future GHG emissions result from the world fol-
2). This study was undertaken as part of the Resilience and Adap- lowing the Shared Socioeconomic Pathways (SSPs) 245 and SSP585.
tive Capacity of Arctic Marine Ecosystems (RACArctic) synthesis SSP245 represents a middle of the road approach to mitigation and
project. adaptation of climate change while SSP585 represents business as
The following sections summarize and discuss recent trends usual and suggests a carbon-fueled based economy (O’Neill et al.,
in major atmospheric and oceanographic features and expected 2017).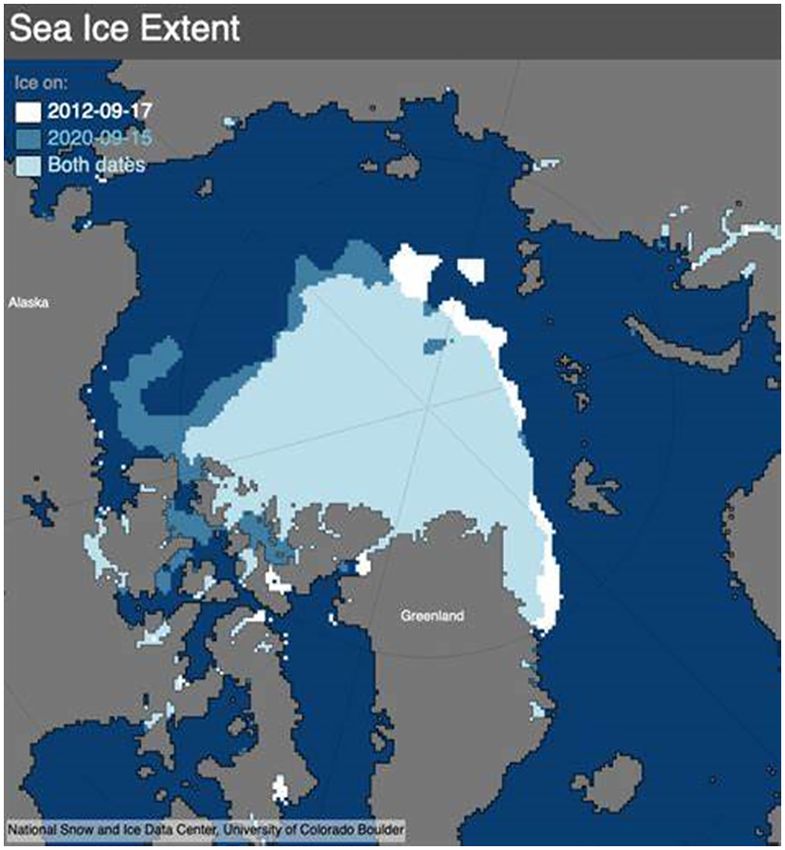
ICESJMS-2021-127 (EA) Theme set on Arctic marine systems under a changing climate
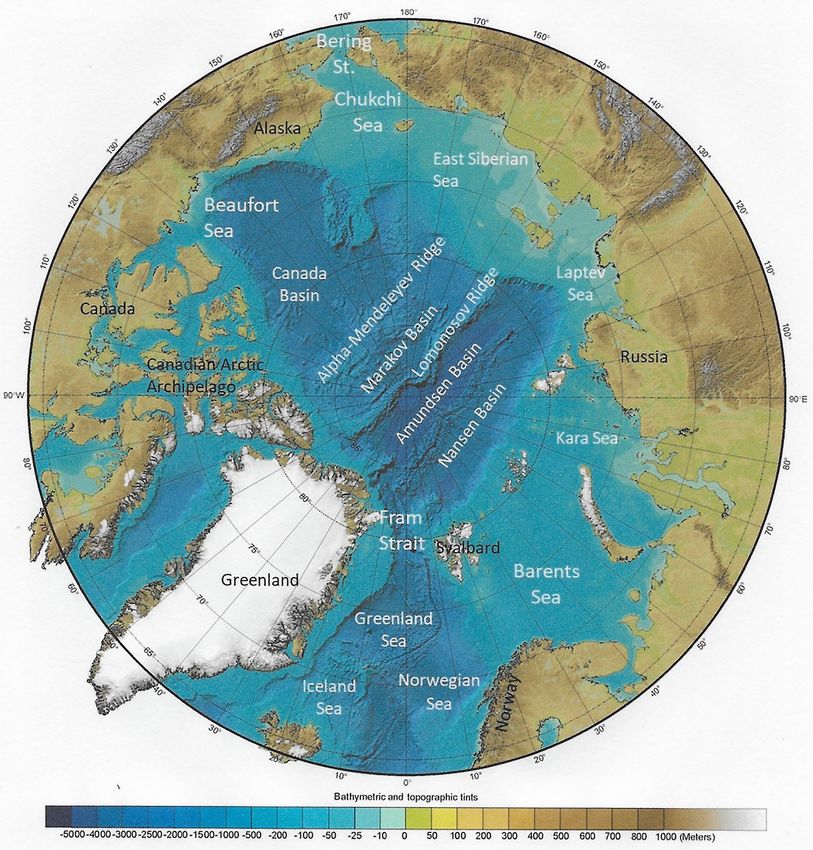
Figure 2. Topographic regions and bathymetry within the Arctic Circle. Downloaded from https://academic.oup.com/icesjms/advance-article/doi/10.1093/icesjms/fsab182/6382408 by guest on 13 October 2021
Present trends and future climate that anthropogenic-induced warming is well underway (e.g. IPCC,
Atmosphere 2013; Alexander et al., 2014; Overland et al., 2017).
Air temperatures have also increased within the Arctic Gateways.
Air temperatures
In the western Barents Sea (70–76◦ N, 15–35◦ E) surface air tem-
Between 1971 and 2019, surface air temperatures (SATs) in the Arc-
peratures rose by approximately 2◦ C between the mid-1990s and
tic increased at a rate approximately three times that of the en-
2016. They then declined but have remained above the 1981–2010
tire globe (AMAP, 2021), a phenomenon termed Arctic amplifica-
long-term mean through to 2020 (Trofimov et al., 2020). The high-
tion (Manabe and Stouffer, 1980). Ballinger et al. (2020) noted that
est air temperature anomalies over the Arctic during October 2017
the October 2019–September 2020 SAT above 60◦ N was the sec-
to September 2018 were in the Bering Strait–Chukchi Sea and the
ond highest since 1900, behind only 2016. They also pointed out
northern Barents Sea, with anomalies of 5◦ C in both regions relative
that 9 of the last 10 years, SAT anomalies were at least 1◦ C warmer
to the 1981–2010 climatology (Overland 2020).
than the 1981–2010 mean. Such changes strengthen the conclusion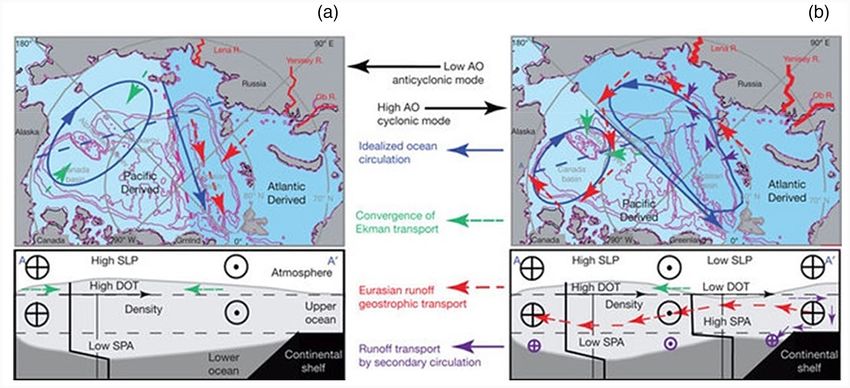
K. F. Drinkwater et al.
Model projections suggest that future air temperatures in the mulation through the winter season has decreased because of the
Arctic will continue to rise but the amplitude will vary spatially shorter snowfall season (Brown et al., 2017).
(Walsh, 2020). From CMIP6, we assembled multi-model averages Projections indicate a further rise in precipitation in the Arctic
of several climate variables for the Large Marine Ecosystems of the including in the gateways, with generally slightly larger increases in
Pacific Gateway (LME54) that includes the northern Bering Sea, winter than in summer (Table 3). Declines in snowfall are projected
the Bering Strait, and the Chukchi Sea (Figure 3a) and the At- to be high within the gateways, e.g. −40% in the Barents Sea (Mård
lantic Gateway (LME13) that includes the Barents Sea and eastern et al., 2017).
Fram Strait (Figure 3b). The number of models per variable ranged On an annual basis, river runoff contributes an amount of fresh
Downloaded from https://academic.oup.com/icesjms/advance-article/doi/10.1093/icesjms/fsab182/6382408 by guest on 13 October 2021
from 3 to 9 and the results are based on SSP245 (intermediate car- water to the Arctic that was estimated to be almost twice that of ice
bon forcing) and SSP585 (high forcing). The variables were aver- melt and six times the direct input from precipitation (Arnell, 2005).
aged spatially before being averaged across models. The plots show With warmer temperatures and higher rainfall, annual river runoff
the filtered mean (5-point annual running mean) as a function of into the Arctic increased by approximately 9–12% between 1971
time along with the 95th percentiles across models. The time se- and 2017 (Box et al., 2019). Future projections suggest it will con-
ries for air temperatures (Figure 3c and d) show rising tempera- tinue to increase with higher runoff in winter and lower in spring,
tures throughout this century. The projected unfiltered air temper- relative to present (Stadnyk et al., 2021). At higher altitudes, much
atures in the Pacific Gateway are expected to increase from around of the winter precipitation will continue to fall as snow, but with
−9◦ C at 2020 to between −5 and −6◦ C by 2050 and between −3.5 higher temperatures, the spring peak in runoff will occur earlier
and 3◦ C by 2100, depending on the SSP level (Table 1). In the At- (Stadnyk et al., 2021). Nummelin et al. (2016) suggest that an in-
lantic Gateway, temperatures are expected to increase from around crease in runoff of around 10% by 2050 relative to 2000 and 26% by
−2◦ C at 2020 to between 0 and 2◦ C by 2050 and between 2 and 2100 under high emission (A2) scenarios, but with high model-to-
5.5◦ C by 2100, again depending on the SSP level (Table 1). Note the model variability.
temperatures in the Pacific Gateway under SSP245 and SSP585 are
similar through to about 2050, after which the SSP585 curve ex-
ceeds the 95th percentile of the SSP245 curve (Figure 3c). In the Winds and storms
Atlantic Gateway, the year when the SSP585 curve exceeds the 95th With the increase of Arctic air temperatures, the temperature gra-
percentile of the SSP245 curve does not occur until around 2070 dient between the Arctic and the mid-latitudes decreases, result-
(Figure 3d). ing in a weakening of the upper-level zonal winds (Francis and
The rate of atmospheric warming varies seasonally. Seasonal Varvus, 2012; Vihma, 2014). Many studies have hypothesized that
projections of air temperature anomalies in the Gateways under the weaker winds have allowed cold Arctic air to flow south into the
RCP8.5 for the 2050s and 2080s relative to 1986–2005 means were mid- and lower-latitudes, accounting for the increase in cold out-
obtained from Overland et al. (2017; their Figures 2.13 and 2.14). breaks and snow during winter in southern Europe, North America
Strong seasonal dependence is expected to continue into the future, and Asia (Overland et al., 2011; Cohen et al., 2018; Ma and Zhu,
with maximum warming in winter, December to February (Table 2019).
2). Their model suggests that by the 2050s, summer (June–August) Mean wind speeds in the central Arctic are projected to increase
air temperature anomalies will be 1–4◦ C and in winter, 3–7◦ C. The by 10–30% between 2000 and 2009 and the end of the century
spring and fall patterns resemble winter but with lower amplitudes. (2090–2099; Aksenov et al., 2017). In Fram Strait, as well as the Bar-
By the 2080s, summer anomalies were in the range of 3–7◦ C and ents and Bering seas, these same authors suggested that the winds
winter anomalies of 11–12◦ C (Table 2). will decrease or remain relatively unchanged under RCP8.5 with
The projected future Arctic warming is expected to result in peak increases in mean wind speed (>2 ms–1 ; 20–30%) likely to oc-
an increased frequency of extreme high air temperatures and a cur over the Chukchi Sea and north of Greenland. In areas where
decreased frequency of extreme low temperatures (ACIA, 2005; winds are expected to decrease, the changes were small (0–1 ms–1 ,
Landrum and Holland, 2020). The natural variability of stochastic i.e. 0–12.5%). Our CMIP6 results generally support the conclusions
weather and climate conditions are projected to drive alternating of Aksenov et al. (2017), indicating the possibility of a slight in-
periods of warm and cool temperatures on top of the underlying crease in the winds over time in both gateways (Figure 3g and h).
warming trends (Medhaug et al., 2017). However, given the strong variability, we do not consider this in-
crease statistically significant. Indeed, our air temperature results
show large interannual to decadal variability (Figure 3e and f), the
Precipitation and runoff most of any of the other climate variables (Figure 3).
Precipitation averaged over the Arctic increased during 1970–2019 During the past decade or so, the passage of cyclones into the
at an estimated annual rate of 9% (AMAP, 2021). Some have sug- Arctic have become more common (Box et al., 2019). Despite model
gested this increase is due to a rise in the moisture content of the uncertainty, future projections tend to support stronger Arctic cy-
air transported into the Arctic (Zhang et al., 2013; Screen et al., clones during summer but a reduction in the number and intensity
2018) while others have pointed to increased evaporation because of storms in winter (Day et al., 2018).
of higher air temperatures and larger open water areas as the main
cause (Carmack et al., 2016; Bintanja and Andry, 2017).
With the increase in air temperature, less of the annual precip- Clouds
itation falls as snow and more as rain (Mård et al., 2017). Indeed, Historically, Arctic cloud cover exhibits strong seasonal variability
the depth of the snow cover on the ice has been observed to be de- ranging from 40 to 70% in winter and from 80 to 95% in summer
clining, especially in the Chukchi and Beaufort seas (Barber et al., and autumn (Shupe, 2011). Based on recent observations during the
2017; Bintanja and Andry, 2017). Despite this reduction in annual period of rapid ice-cover loss, and projections of further ice losses,
snow fall, the rate of snow fall in winter has increased, but accu- cloud cover during autumn is expected in several studies to increase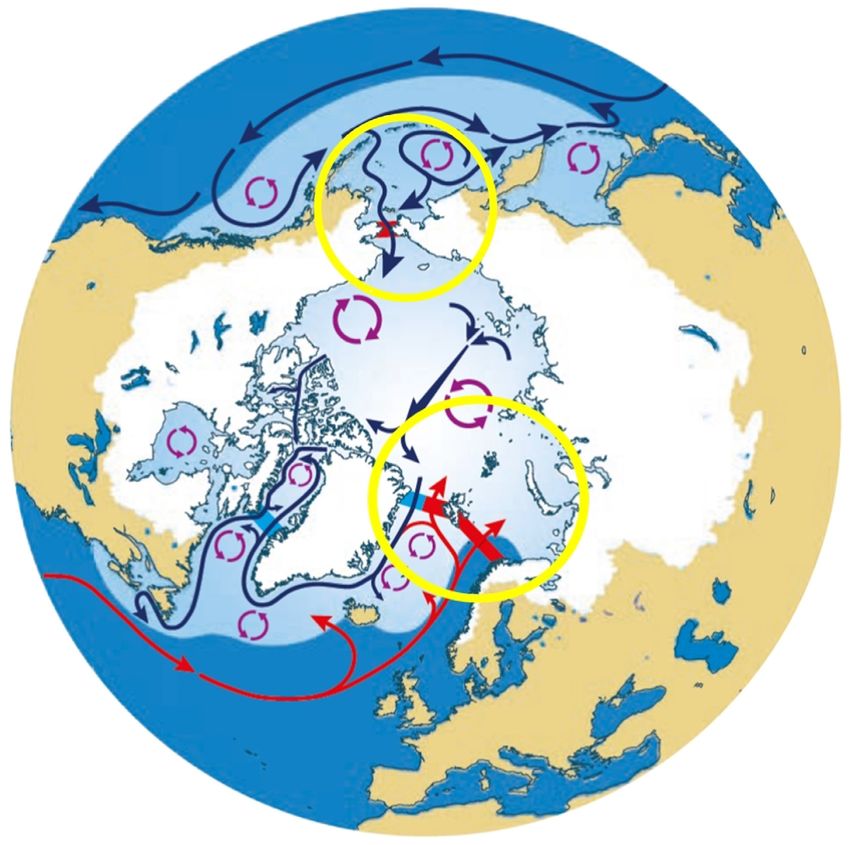
ICESJMS-2021-127 (EA) Theme set on Arctic marine systems under a changing climate
Downloaded from https://academic.oup.com/icesjms/advance-article/doi/10.1093/icesjms/fsab182/6382408 by guest on 13 October 2021
Figure 3. CMIP multi-model averages of climate anomalies for the Pacific (left panels) and Atlantic (right panels) gateways. The climate
variables include: (c) and (d) surface air temperatures in◦ C; (e) and (f) cloud coverage in %age; (g) and (h) scalar winds in ms– ; (i) and (j)
sea-ice coverage in %age (k) and (l) surface ocean temperatures in◦ C; and (m) and (n) pH extracted from geographical boxes in the Large
Marine Ecosystems (LMEs) taken as representative of (a) the Pacific and (b) Atlantic gateways. The data were averaged spatially and then
averaged across models. The plots show the -year running means between the late s and (solid lines) and the th percentile across
models for two scenarios, SSP (blue) and SSP (red).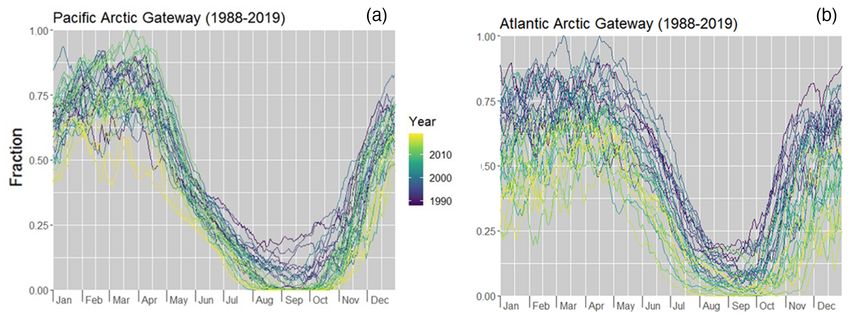
K. F. Drinkwater et al.
Table 1. The mean of the unfiltered climate variables considered in this study at , , and from the multi-model CMIP analyses
for the Pacific and Atlantic gateways. The geographic areas for which the data were averaged are shown in Figure a, b. The number of models
that were averaged for each variable and gateway are also listed. Values after ± signs are standard deviations based on the different models. The
surface air and ocean temperatures are in◦ C; winds are in ms– and are scalar winds (sqrt of u + v ); clouds and sea ice are in % coverage of the
LMEs; and pH are in standard pH units.
2050 2099 # Models
Variable Gateway SSP 2020 2050 2099 # Models
Downloaded from https://academic.oup.com/icesjms/advance-article/doi/10.1093/icesjms/fsab182/6382408 by guest on 13 October 2021
Air Temp Pacific −. ± . −. ± . −. ± .
u −. ± . −. ± . . ± .
Atlantic −. ± . . ± . . ± .
−. ± . . ± . . ± .
Winds Pacific . ± . . ±. . ± .
. ± . . ± . . ± .
Atlantic . ± . . ± . . ± .
. ± . . ± . . ± ,
Clouds Pacific ± ± ±
± ± ±
Atlantic ± ± ±
± ± ±
Sea-ice Pacific ± ± ±
± ± ±
Atlantic ± ± ±
± ± ±
Sea temp Pacific −. ± . −. ± . . ± .
−. ± . . ± . . ± .
Atlantic . ± . . ± . . ± .
. ± . . ± . . ± .
pH Pacific . ± . . ± . . ± .
. ± . . ± . . ± .
Atlantic . ± . . ± . . ± .
. ± . . ± . . ± .
Table 2. The approximate surface air temperature changes in◦ C relative to the – mean for the Pacific and Atlantic gateways to the
Arctic based upon RCP. (taken from Figures . and . of Overland et al., ). The estimated uncertainties, based on the model spread,
are ± and ± .◦ C for summer and winter, respectively. SWBS stands for Southwest Barents Sea.
2050s 2080s
Pacific Atlantic Pacific Atlantic
Bering Bering
Sea/Strait Chukchi Sea Fram Strait Barents Sea Sea/Strait Chukchi Sea Fram Strait Barents Sea
Summer – .– – – – .– – –
June–August
Winter – – – – SWBS – – – SWBS – –
December– –
February
Table 3. Future precipitation increases in terms of % change for summer (April–September) and winter (October–March) under RCP ob-
tained from Mård et al. (). Under RCP., increases are about –% less than those under RCP.. BeS-Bering Sea; NBa-Northern Barents
Sea.
Pacific Atlantic
Summer Winter Summer Winter
s –% –% –%; (–% NBa) –%
s –; (–% BeS) –% –% –%
ICESJMS-2021-127 (EA) Theme set on Arctic marine systems under a changing climate
over the Arctic, but not change much during summer. The latter has variance. The AD is characterized by a high pressure over the North
been attributed to the surface temperatures of the open water and American Arctic region and low pressure over Eurasia, and is asso-
sea ice being similar during the melting season (Vihma, 2014). ciated with meridional (north-south) winds. A negative AD is as-
Using a 39-year data set (1971–2009), Eastman and Warren sociated with the southerly winds, which transport warm south-
(2013) showed a trend of slightly increasing cloud cover in the Arc- ern air masses into the Arctic and reduces sea ice export south-
tic. This is consistent with Nahtigalova (2013) who found that at ward through Fram Strait. The opposite occurs during a positive
Siberian land stations, there was an increase in the total lower level AD phase. The AD index was variable but principally negative from
cloudiness from 1986 to the end of their record in 2012. Based on the 1930s to 2000. After 2000 it became mostly positive (Watanabe
Downloaded from https://academic.oup.com/icesjms/advance-article/doi/10.1093/icesjms/fsab182/6382408 by guest on 13 October 2021
satellite data, Bélanger et al. (2013) observed an increase in cloudi- et al., 2006; Wu et al., 2006; Heo et al., 2021). In the negative-AD
ness thoughout the Arctic, including in the Gateways, during May– decades (1979–1998), atmospheric circulation during summers of
September 1998–2009 that resulted in a decrease in photosyntheti- positive phase AD acts to reduce the sea ice extent (SIE) in the Pa-
cally active radiation (PAR) at the sea surface. The largest declines cific sector but increases it in the Atlantic sector. In the positive-AD
were in Subarctic areas, including the Barents and Bering seas of ap- decades (after 1999), the same atmospheric circulation pattern re-
proximately −1 to −2% year–1 , which were considered statistically duces the SIE in both sectors, resulting in enhanced sea ice melting
significant (p < 0.01). The authors noted that the increased cloudi- across the entire Arctic region.
ness partly counteracts the positive influence of declining sea ice Since the late 1990s with the decline in sea ice and the increased
on light levels. On the other hand, Jun et al. (2016), investigating open water in the Arctic region, the winter AO and the NAO in-
clouds over the Arctic Ocean in winter from satellite and reanalysis dices relative to long-term mean 1960–1990 have been predomi-
data, found that north of 67◦ N cloud amounts decreased from the nantly positive (http://www.climate4you.com/index.htm accessed
late 1970s-early 1980s until the late 1990s, after which cloud cov- 15.08,2021). However, summer indices of AO and AD tended to
erage increased rapidly. These authors concluded that the increase be negative (Cai et al., 2018). CMIP5 modelling studies of future
was linked to the large reduction in sea-ice area. changes during summer indicate a switch to a more positive AO
Cai et al. (2018), as part of CMIP5 modelling studies, provided through most of the present century but a continuing negative trend
projections of cloud fractions in the Arctic out to 2050. Displayed in the AD (Cai et al., 2018). These authors found that neither the AO
as the change in the mean fraction over the period 2006–2050 rela- nor AD contributed appreciably to future temperature and precip-
tive to present day, the cloud cover was similar or decreased slightly itation trends, but that the contribution of the AD was larger than
in the Fram Strait recgion but increased in the Bering Strait area as that of the AO. Future changes of the large-scale pressure patterns
well as thoughout the Barents Sea and the Bering Sea. Our CMIP6 include a likely intensification of the wintertime Aleutian Low and
analysis of clouds, showed no statistically significant trend in cloud the Siberian High, but a weakening of the Icelandic Low (Screen
coverage in either the Pacific or Atlantic gateways given the vari- et al., 2018). Outside of summer, the effect of GHGs is dominant,
ability in the model results (Table 1; Figure 3g and h). leading to more robust projections of an increasingly positive AO
(Screen et al., 2018).
Large-scale atmospheric climate indices
Oceanographic and ecological changes in the Arctic are often re- Sea ice
lated to large-scale atmospheric conditions, which are commonly The Arctic annual mean sea-ice extent from 1979 to 2019 decreased
condensed into climate indices that represent dominant modes of at an estimated rate of 5×10⁵ km2 (4.7%) per decade (Figure 4a).
variability. The dominant atmospheric pattern in the far north is the The rate in summer (September at or near the sea-ice minimum)
Arctic Oscillation (AO; Thompson and Wallace, 1998). The AO is was in the range of −12% per decade (Figure 4b), much faster than
caused by the seesaw movement of air masses between the Arctic predicted by most GCMs (Stroeve et al., 2012). This rate of decline
and mid-latitudes and results in cyclonic (counter clockwise) winds was greater than in winter (March), especially after 2006 (Figure
around the Arctic (the Arctic Vortex) with peak winds near 55◦ N 4b). The sea-ice coverage in September is now limited to the central
latitude. The AO is linked to changes in the major pressure systems: Arctic north of Greenland (Figure 5). The 2 years of ice in the figure
the high pressure over the central Arctic, the Icelandic Low in the (2012 and 2020) are the minima in the satellite record.
Atlantic region and the Aleutian Low in the Pacific. The AO Index, Reductions in sea ice have been greater in the Arctic Gateways
calculated as the first mode of an empirical orthogonal function than in the central Arctic (Onarheim et al., 2018; also, see Figure 6).
(EOF) decomposition of the winter (November–April) sea level at- In the Barents Sea, there has been a 50% reduction in the March sea-
mospheric pressure (SLP) fields in winter between the North Pole ice areal coverage over the past five decades (Docquier et al., 2020)
and 20◦ N latitude, accounts for 25% of the SLP variance (Thomp- while some of the fastest declines in sea-ice cover across the Arctic
son and Wallace, 1998). During a positive AO index, there is an in- have been observed in the Bering and Chukchi seas (Parkinson and
tensification of the zonal (east–west) winds, which tend to confine Cavalieri, 2008; Cavalieri and Parkinson, 2012). The monthly mean
cold Arctic air to the polar regions. During a negative phase, winds variability in sea-ice cover in the gateways for the last three decades
weaken and the cold air extends southward, often resulting in the 1988–2019) are shown in Figure 6. These plots show the decline in
increased storminess in the mid-latitudes (Overland et al., 2015). sea-ice coverage through the decades.
The AO variability is closely related to that of the North Atlantic The ice is melted by heat carried into the Arctic through the air,
Oscillation (NAO; Ambaum et al., 2001). in ocean waters, and in rivers. The flow of warm air toward the
Wu et al. (2006) identified a second major atmospheric pressure Arctic, due in part to the AD, has contributed to sea-ice loss in
pattern, the Arctic Dipole (AD). It is the second EOF mode of the both gateways, especially since 2000 (Budikova, 2009; Bi et al., 2021;
winter (October–March) mean SLP above 70◦ N, which accounts for Wang, 2021). Increased inflows of warm Atlantic water through
between approximately 13% (Wu et al., 2006 during1960–2006) to Fram Strait and the Barents Sea have also contributed to high melt
19% (Watanabe et al., 2006 during 1900–2006) of the winter SLP rates there (Årthun et al., 2012, 2019; Polyakov et al., 2017). Simi- K. F. Drinkwater et al.
Downloaded from https://academic.oup.com/icesjms/advance-article/doi/10.1093/icesjms/fsab182/6382408 by guest on 13 October 2021
Figure 4. Time series of anomalies of Arctic sea-ice extent: (a) annual data; (b) March and September. The plots are based on NOAA data
(https://www.ncdc.noaa.gov/snow-and-ice/extent/).
larly, inflow of warm Pacific waters through Bering Strait has been and Schweiger, 2015). This has made the ice more mobile and re-
hypothesized to be responsible for the rapid reduction of summer sponsive to wind forcing (Spreen et al., 2011). Thinning sea ice also
sea ice in the Chukchi and Beaufort seas (Shimada et al., 2006; means an increase in the solar radiation reaching the sea surface
Woodgate et al., 2010). Moored current meter arrays in Bering (Barber et al., 2017). Kristiansen (unpublished) estimated the in-
Strait between 1990 and 2015 showed a general increase in heat crease in light levels due to changes in sea-ice concentration, sea-ice
fluxes into the Chukchi Sea, sufficient to melt 106 km2 of 1-m thickness, albedo, and snow depth for the Barents and Bering seas
thick ice (Woodgate, 2018). Still, in the Pacific sector, Tsukada et al. using the Norwegian Earth System Model (NorESM). He found an
(2018) found that solar heating in summer during 1999–2015, was increase in surface light levels of 15% and 14%, respectively, by 2050
approximately twice that of the northward heat flux through the and 27% and 24%, respectively, by 2090. The same general rate of
Bering Strait. Additionally, Arctic rivers carried enough heat to melt change in light was modelled for the entire Arctic Ocean in Varpe
around 10% of the sea ice throughout the Arctic during 1980–2015 et al. (2015).
(Park et al., 2020). Sea-ice phenology has also changed. Analyses over a 32-year pe-
Coincident with the reduction in sea-ice coverage, there has also riod, from 1979–1980 to 2010–2011, show that the Chukchi Sea and
been a thinning of the ice with a significant loss of multi-year sea the northern Barents Sea have experienced a delay of the sea-ice for-
ice such that most of the ice is now first or second year ice (Lindsay mation of 1.0–1.4 months and an earlier retreat of sea ice by 1.6–1.9ICESJMS-2021-127 (EA) Theme set on Arctic marine systems under a changing climate
Downloaded from https://academic.oup.com/icesjms/advance-article/doi/10.1093/icesjms/fsab182/6382408 by guest on 13 October 2021
Figure 5. Comparison of the sea-ice minima for (September ) and (September ). Light blue indicates where ice occurred in both
and , while white and medium blue areas show ice cover unique to and to , respectively. (Image courtesy of the National
Snow and Ice Data Center, University of Colorado, Boulder)
months, resulting in a reduction in the duration of the ice season by Projections are that the Arctic Ocean is likely to be nearly ice free
3 months (Stammerjohn et al., 2012). Throughout the Arctic, sea- in summer before the second half of this century or even sooner
ice melting has been occurring earlier in the spring (Stroeve et al., (Wang and Overland, 2009, 2012; Overland and Wang 2013). The
2014) while ice formation in autumn has been delayed (Barber et projected trends are not monotonic and there could still be multi-
al., 2017). year periods when natural variability forcing results in little to no
Although warming and sea-ice reductions are common in most loss of ice extent and even an increase (Barber et al., 2017). Only in
Arctic areas, there has been spatial and temporal variability. For ex- the Barents Sea, is the winter ice projected to disappear by the end
ample, the Bering Sea had extended sea-ice cover and much colder of this century (Årthun et al., 2021).
temperatures in the winter and spring from 2006 to 2013 when most We assembled annual projections of average sea-ice coverage
other Arctic regions experienced warming and retreating sea-ice from CMIP6 models for the Pacific and Atlantic Gateways (Figure
cover (e.g. Overland et al., 2012, 2014; Wood et al., 2015). Since 3i and j). There appears to be much less ice coverage in the Atlantic
then, the Bering Sea has had warmer temperatures and decreased compared to the Pacific but this is simply because all the southern
sea-ice coverage (Danielson et al., 2020), with exceptionally low sea- Barents Sea has been, and is projected to be, devoid of sea ice while
ice cover in 2018 (Stabeno and Bell, 2019; Thoman et al., 2020). the Pacific Gateway is mostly ice covered. The projected decrease in K. F. Drinkwater et al.
Downloaded from https://academic.oup.com/icesjms/advance-article/doi/10.1093/icesjms/fsab182/6382408 by guest on 13 October 2021
Figure 6. Seasonal trends in ice cover in (a) the Pacific Arctic and (b) Atlantic Arctic gateways from plots of daily sea ice for each year from
to . The Pacific Gateway covers the Bering and Chukchi seas and the Atlantic Gateway includes the Barents Sea. Daily concentrations are
expressed as a fraction of the maximum daily extent of sea ice observed in each area over the time series. Data from the NOAA National Snow
and Ice Data Center (Peng et al., ; Meier et al., ).
sea-ice coverage in the Pacific Gateway under SSP245 from 2020 to estimated for the inflow regions to the Barents Sea and Fram Strait
2050 is around 12% and another 10% decrease by 2099 while un- during 1997–2015 (Gluchowska et al., 2017).
der SSP585 the decreases are 16% and 34%, respectively (Table 1). Of the heat flux entering Fram Strait from the south, only approx-
In the Atlantic Gateway, the ice coverage under SSP245 fell from imately one third reaches the Nansen Basin, the rest being lost back
around 29 to 17% between 2020 and 2050 and then a further 8% by to the south because of recirculation (48%), or to surface cooling
2099 and for SSP585 the losses were from 22 to 11% between 2020 (16%) (Kawasaki and Hasumi, 2017). Recently in the Barents Sea,
and 2050 and a further 7% by 2099 (Table 1). Given that the mod- there has been less ocean heat loss owing to the warmer atmosphere
els are often underestimating the rate of sea-ice decline, our CMIP6 (Skagseth et al., 2020).
estimates may be slightly too conservative. Increased precipitation, river runoff, sea-ice melt (see above),
and inflow of low salinity waters through the Bering Strait
(Woodgate, 2018) led to a significant freshening of the Arctic from
Physical oceanography the mid-1990s (Proshutinsky et al., 2009; Armitage et al., 2016),
Ocean temperatures and salinities peaking in the first decade of the 2000s (Proshutinsky et al., 2015).
Ocean temperatures have been increasing in both the Pacific and The largest freshwater storage has been in the Beaufort Gyre (Car-
Atlantic gateways during recent decades. Moored current meter ar- mack et al., 2008; Proshutinsky et al., 2015). In contrast, in the
rays in Bering Strait between 1990 and 2015 showed warm wa- Amundsen and Nansen basins, salinity has increased due to a re-
ter (∼4–8◦ C) flowing from the Bering Sea into the Chukchi Sea duction in Pacific Water inflow there and an increase in salinity
(Woodgate, 2018), which eventually reached Barrow Canyon in of the inflowing Atlantic Water (Wang et al., 2019; Polyakov et al.,
the late 1990s (Itoh et al., 2013; Williams et al., 2014). Summer 2020a).
and fall warming trends over the Chukchi Sea for 1990–2018 were Projections of ocean temperatures using the model EC-Earth as
0.43 ± 0.35◦ C decade−1 , triple the rate during 1922–2018 (Daniel- part of CMIP5 indicated that the warming will continue through
son et al., 2020). Timmermans and Labe (2020) showed that Au- the 21st Century with maximum warming in the Barents Sea and
gust sea surface temperatures (SSTs) during 1982–2020 from Bering vicinity (Koenigk et al., 2013). Estimated heat and volume fluxes
Strait through the Chukchi Sea increased by approximately 0.5–1◦ C into the Arctic using the same model showed that an increasing flow
decade–1 . In the Bering Sea, water column temperatures (1966 to through the Barents Sea will be a major contributor to warming of
present) showed no statistically significant warming but SSTs did waters in the Arctic (Koenigk and Brodeau, 2014). The warming
warm by 0.22 ± 0.1◦ C decade−1 (Danielson et al., 2020). Recently, is primarily due to an increase in the Atlantic Water temperatures
the latter authors estimated that the Chukchi Sea waters in autumn rather than a substantial increase in its volume flux. A future in-
transferred enough heat to the atmosphere to warm the entire Arc- crease in Atlantic Water heat transports due to warmer, but weaker
tic troposphere by 1◦ C. currents in the Barents Sea occurs in other climate model studies
In the Atlantic Gateway, SSTs warmed by 0.3◦ C decade–1 dur- (Årthun et al., 2019). Their study found that the warm Atlantic Wa-
ing 1982–2013 in the Barents Sea (Jakowczyk and Stranska, 2014) ter gradually spreads downstream from the Barents Sea and farther
and Atlantic waters in the northern Barents Sea warmed by into the Arctic Ocean, leading to a reduced sea-ice cover and sub-
0.15◦ C decade–1 between 1970 and 2011 (Lind et al., 2016). In Fram stantial changes in sea-ice thickness. Nummelin et al. (2016) suggest
Strait, the waters increased by 0.73◦ C decade–1 during 1980–2016 from models that there will be little to no change in the Atlantic in-
(Goszczko et al., 2018). Walczowski et al. (2017) reported that the flow through Fram Strait. In contrast, the Bering Strait inflow may
temperature in the Atlantic waters off West Svalbard increased over decrease owing to the reduction in the sea level pressure gradient
the top 1000 m during the period 2000 to 2016, which ev.entually caused by warmer and fresher water north of Bering Strait (Num-
reached Fram Strait. A warming rate of 0.45–0.53◦ C decade–1 was melin et al., 2016). At this stage in the modelling, it is not clear whatICESJMS-2021-127 (EA) Theme set on Arctic marine systems under a changing climate
the resultant change in the inflows, and hence heat fluxes, into the and Laptev Seas to the Fram Strait and by the anticyclonic Beaufort
Arctic will be. Gyre in the Canada Basin. In the Pacific Gateway, the northward
Our CMIP6 results show increasing annual ocean surface tem- flow through the Bering Strait has been increasing during 1990–
perature anomalies in both Bering and Fram straits, with little dif- 2019 at a rate of 0.01 ± 0.006 Sv year–1 (Woodgate and Peralta-
ference between the two regions (Figure 3e and f). A similar rise Ferriz, 2021). In the Atlantic Gateway, Wang et al. (2020) suggested
in SST anomalies of about 2◦ C occurs for both SSP scenarios un- from modelling studies that the Atlantic Water inflow into the Arc-
til around 2050. After that, the temperatures increase significantly, tic through Fram Strait increased though Nummelin et al. (2016),
reaching maxima anomaly values around 5◦ C near 2100. using the NorESM model, indicated that, in the future, the strength
Downloaded from https://academic.oup.com/icesjms/advance-article/doi/10.1093/icesjms/fsab182/6382408 by guest on 13 October 2021
of the cyclonic circulation around the Arctic would increase.
Stratification
In much of the Arctic Ocean, there is a relatively cold and fresh sur- Upwelling
face layer above warm and highly saline Atlantic Water, between
Although wind-driven coastal upwelling in canyons had been ob-
which lies an intermediate layer of cold but gradually saltier wa-
served in the Arctic, Carmack and Chapman (2003) were the first
ter, often termed the cold halocline (Rudels et al., 2004). This halo-
to point out the significant increase in upwelling when sea ice re-
cline results in a strong vertical density stratification of the wa-
treats seaward of the continental shelf. In such cases, upwelling fa-
ter column. River runoff, seasonal ice melt, positive net precipita-
vorable winds are better able to force shelf waters offshore through
tion, and relatively fresh Pacific inflow contribute to the fresh sur-
Ekman transport, which are replaced by deep off-shelf waters. For
face layer (Polyakov et al., 2020a). Seasonally, stratification is max-
example, studies have described upwelling on the slope of the Beau-
imum in the summer and minimum in winter; the latter due to
fort Sea and its relationship to sea-ice conditions and the wind field
mixing by autumn winds and brine rejection during sea-ice forma-
(e.g. Pickart et al., 2009, 2013; Schulze and Pickart, 2012). Woodgate
tion. With warming temperatures and higher amounts of freshwater
et al. (2005) observed upwelling of Atlantic Water along the north-
through increased precipitation and river runoff, the stratification
ern edge of the Chukchi Shelf/Slope. Upwelling was also observed
in the Pacific Arctic has been increasing (Zhuang et al., 2021). In-
north of Svalbard when the ice edge was offshore of the continental
creased stratification reduces the potential of vertical fluxes of nu-
slope (Falk-Petersen et al., 2015; Haug et al., 2017). These results
trients reaching the euphotic zone (Carmack et al., 2004; Tremblay
suggest that as the ice continues to disappear, upwelling will likely
and Gagnon, 2009), which seems to be borne out in the Pacific Arc-
occur more often along the continental slopes in the Arctic (Lewis
tic (Zhuang et al., 2021). The increased stratification in the Pacific
et al., 2020). Shelf-edge upwelling is a more dominant process in the
Gateway contrasts with what is happening in Fram Strait, where
Pacific (western) side of the Arctic than in the Atlantic sector of the
warming and shallowing Atlantic Waters are weakening the stratifi-
Arctic (Randelhoff and Sundfjord, 2018).
cation as they enter the Nansen Basin (Polyakov et al., 2020a). This
leads to increased winter ventilation, further eroding the stratifica-
tion and by the mid-2010s, the Atlantic Water heat began melting
the sea ice (Polyakov et al., 2020b). Chemical oceanography: nutrients and CO
Changes in stratification in the northern Barents Sea were con- Nutrients
sidered by Lind et al. (2018) who linked recent changes in ocean Pacific waters that enter the Arctic from the Bering Sea contain
temperature and salinity in the northern Barents Sea to declines in high nutrient concentrations; e.g. in winter, nitrate concentrations
sea-ice import. They speculated that the northern Barents Sea may are 20–25 μmol l–1 (Hunt et al., 2013; Randelhoff and Sundfjord,
soon complete a transition from a cold and stratified Arctic to a 2018). These nutrients are advected north through Bering Strait
warm and well-mixed Atlantic-dominated climate regime. Further into the Chukchi Sea where they sustain relatively high rates of pri-
studies are needed to determine the likelihood of such a scenario. mary production (Grebmeier et al., 2006; Zhou et al., 2021). De-
spite higher nitrate concentrations than in the Atlantic Waters (10–
13 μmol l–1 ), the total nutrient flux through the Pacific Gateway
Circulation patterns and transports is only about one-quarter that of the Atlantic Gateway owing to
Prior to 1996, the ocean circulation in the Arctic oscillated between the Pacific’s smaller volume flux (Carmack and Wassmann, 2006;
cyclonic (counterclockwise) and anticyclonic (clockwise) circula- Torres-Valdes et al., 2013). However, a large portion of the nutrients
tion patterns approximately every 5–7 years (Morrison et al., 2012; from the Atlantic Sector, through either Fram Strait or the Barents
see Figure 7). During the former pattern, there was an increase in Sea, ends up in the deep waters of the Arctic, and thus is unavailable
the freshwater flux out of the Arctic through Fram Strait while in for biological productivity except over long-time scales.
the latter pattern it declined. However, from 1997 to present the Within the Atlantic Gateway, Rey (2012) noted a long decline in
Arctic has experienced a persistent anticyclonic circulation regime silicate concentrations in the Barents Sea beginning around 1990.
including the reduction in the outflow through the Fram Strait. Hátún et al. (2017) showed that this low silicate water originated
(Proshutinsky et al., 2015). Earlier, reductions in such outflow were from a weakened and retracted subpolar gyre south of Greenland
ascribed to an increase in the southerly winds associated with a with an associated increased influence of nutrient-poor subtropical
negative AD (Watanabe et al., 2006). However, Proshutinsky et al. waters. These authors concluded that the changes in the subpolar
(2015) suggested the lower outflow through Fram Strait was due to gyre were due to the reduction in vertical mixing through convec-
a reduction in the sea level pressure gradient from the Arctic to the tion in the Labrador Sea. Oziel et al. (2017) observed a decline in
Nordic Seas caused by freshwater runoff from Greenland, although nitrate concentrations of around 17% at the eastern entrance to the
this is yet to be substantiated. Barents Sea between the early1980s and 2010. In contrast to the Bar-
The present Arctic surface circulation is dominated by the trans- ents Sea, high nitrates were observed during late spring and sum-
polar drift, which crosses the Arctic Basin from the East Siberian mer in the Nansen Basin in 2014 and 2015 (Randelhoff et al., 2016). K. F. Drinkwater et al.
Downloaded from https://academic.oup.com/icesjms/advance-article/doi/10.1093/icesjms/fsab182/6382408 by guest on 13 October 2021
Figure 7. The Arctic surface circulation patterns taken from Morrison et al. (); (a) the anticyclonic mode and (b) the cyclonic mode.
Microstructure measurements indicated that these high nitrates gest that eventually, there will be less nutrients available in the sur-
were a result of increased turbulent mixing attributed, in part, to face layers. However, this will depend on the extent of vertical nu-
the recent shallowing of the inflow of Atlantic waters as they pass trient fluxes through increased wind mixing, especially in the au-
Fram Strait and enter the Nansen Basin north of Svalbard (Polyakov tumn, and upwelling. Future nutrient levels in the surface layers of
et al., 2017). Henley et al. (2020) showed that the re-supply of nutri- the Arctic are still under debate and remain highly uncertain.
ents was larger in the Atlantic Water north of Svalbard than in the
Arctic waters in the northern Barents Sea.
The loss of sea ice and the accumulation of fresh water observed
in the Canada Basin in the Pacific Sector of the Arctic discussed CO2 and OA
earlier, caused a deepening of the local nutricline and a reduction The Arctic plays an important role in the dynamics of the global
in the nutrient concentrations in the mixed layer (McLaughlin and carbon cycle. Yasunaka et al. (2016, 2018) estimated an annual CO2
Carmack, 2010; Nishino et al., 2011b; Polyakov et al., 2020a). How- uptake by the Arctic Ocean during 1997–2014 of 180 ± 130 Tg
ever, in this region the role of eddies in supplying nutrients later- C y–1 (1 Tg = 1012 g), almost 12% of the net global CO2 uptake
ally from the shelf regions appears important (Nishino et al., 2011b; by the oceans (Gruber et al., 2009; Wanninkhof et al., 2013; Land-
Watanabe et al., 2014). schu¨tzer et al., 2014). That the Arctic is such an effective sink for
The recent loss of Arctic sea ice increases the exposure of the atmospheric CO2 has been attributed to large spring phytoplankton
sea surface to wind stress causing increased wind-driven vertical blooms, strong cooling in the winter, the relatively high alkalinity of
mixing and an upward supply of nutrients (Nishino et al., 2015). the Arctic Ocean, seasonal sea ice and freshwater additions (Taka-
This appears to be an important mechanism especially in the au- hashi et al., 2009; Nishino et al., 2011a).
tumn throughout much of the Arctic. However, given that the pro- The increased CO2 in Arctic waters decreases the pH making
jections of future wind changes in the gateways are relatively minor, the water more acidic, a process referred to as OA. Since the solu-
increased upward nutrient fluxes in these regions are unlikely or will bility of CO2 is higher in colder water, this makes the polar regions
be small. more vulnerable to OA (Orr et al., 2005). The addition of fresh wa-
Nitrification is susceptible to changes in light levels. Shiozaki ter from sea-ice melt and river runoff reduces the ocean’s buffering
et al. (2019) conducted light control experiments in the Chukchi capacity further accelerating OA in the Arctic Ocean, especially on
and Beaufort seas that showed nitrification was inhibited by a light the freshwater-influenced shelf areas (e.g. Yamamoto-Kawai et al.,
intensity above 0.11 mol photons m−2 d−1 . Values exceeding this 2009; Chierici and Fransson, 2009).
level extended to the shelf bottom and upper halocline layer, lim- The aragonite saturation state (Ar ) is a measure of carbonate
iting nitrification in these waters. Satellite data indicate that the ion concentration and an index of OA. Ar greater than 1.0 (su-
area where light levels inhibit nitrification has increased through- persaturation) is required for marine calcifying organisms to form
out the Arctic Ocean due to recent sea-ice reduction (Shiozaki et their skeletons and/or shells while if less than 1.0 (undersaturation),
al., 2019). This suggests that stronger light levels in the future Arctic shells and other aragonite structures begin to dissolve. Recent stud-
Ocean as ice continues to disappear could further suppress nitrifi- ies (Baker et al., 2021) have also shown that atmosphere acidifica-
cation and alter the composition of inorganic nitrogen (increasing tion impacts the quantity and distribution of nutrients (nitrogen,
ammonium-based nutrients), with implications for the structure of phosphorus and iron) delivered to the ocean.
ecosystems (Shiozaki et al., 2019). Although, the entire Arctic Ocean has naturally low Ar and
The projected increased stratification in the future throughout pH relative to rest of the world’s oceans, there are large regional
the Arctic due to ice melt and increased precipitation would sug- differences within the Arctic (e.g. Bates and Mathis, 2009; AMAPICESJMS-2021-127 (EA) Theme set on Arctic marine systems under a changing climate
2013). Pacific Water, containing high CO2 from remineralized or- ing sea level elevation also occurs due to the steric effect from the
ganic matter, have the lowest Ar and pH values. The mean circu- warming and freshening ocean. Erosion has already caused infras-
lation carries this water into the central Arctic and eventually to tructure damage in several coastal communities and in some cases,
western Fram Strait. In contrast, Atlantic water transports high an- has meant, or will mean in the future, that the communities must
thropogenic CO2 but with relatively high total alkalinity resulting relocate (Fritz et al., 2017). Such erosion can also destroy cultural
in higher Ar and pH values relative to the Pacific Arctic. heritage, through the loss of community lands and burial sites.
In recent years, the aragonite saturation states have been de- An additional impact of Arctic warming is the reduction and in-
clining in the Gateway regions and the Arctic in general. Corro- creased instability of landfast ice (Dumas et al., 2006; Vermaire et
Downloaded from https://academic.oup.com/icesjms/advance-article/doi/10.1093/icesjms/fsab182/6382408 by guest on 13 October 2021
sive events are already occurring in the Pacific Arctic (Cross et al., al., 2013). In combination with rising Arctic sea level, the loss of
2018). In the Bering Sea, during 2003–2012, pH declined and the landfast ice has opened low lying arctic coastlines to inundation and
Ar showed high spatial variability with supersaturation of arago- inland flooding with seawater (ACIA, 2005; Manson and Solomon,
nite on the outer shelf due to high biological activity and under- 2007). These storm surges can damage terrestrial vegetation, and
saturation in nearshore waters due to freshwater runoff (Pilcher et result in the salinization of near-coastal soils and freshwater lakes,
al., 2019). Yamamoto-Kawai et al. (2016) observed that the bottom thereby altering their ecosystems (e.g. Pisaric et al., 2011; Deasley
waters on the Chukchi Shelf undergo intermittent aragonite under- et al., 2012; Kokelj et al., 2012; Thienpont et al., 2012).
saturation and calculated that the period of undersaturation has in- Sea ice has traditionally provided access by humans for hunting
creased more than two times that in the pre-industrial times. In the marine mammals, sometimes at considerable distances from shore
Canada Basin, the area of Ar less than 1 expanded from 1997 to (Laidler et al., 2009; Meier et al., 2014; Huntington et al., 2017). If
2008 (Yamamoto-Kawai et al., 2009; Qi et al., 2017). On the oppo- there are large regions of open water, ice floes containing hunters
site side of the Arctic, CO2 concentrations have increased and pH may break away, thereby isolating them from a safe return to land
decreased in the intermediate waters in the Amundsen and Nansen (Gearhead et al., 2006; Laidre et al., 2018). Additionally, the loss of
basins (Ericson et al., 2014; Ulfsbo et al., 2014). Chierici and Frans- sea ice has reduced the extent of habitat available for ice-dependent
son (2018) suggested this was a result of the release of dense CO2 - pinnipeds and their polar bear predators (e.g. Kovacs et al., 2011;
rich brine during sea-ice formation from the shelf break and north- Beatty et al., 2016). These sources of food, fur, and skins are of great
ern Barents Sea into the intermediate and deep waters in the Arctic cultural importance to many coastal communities in the Arctic, and
Ocean. their reduction or loss has negative cultural and economic impacts
Model projections for both gateways suggest that they will expe- (Himes-Cornell and Kasperski, 2015).
rience a reduction in pH in future under either SSP245 and SSP585 Another concern are contaminants that may affect food secu-
(Figure 5i and j) and that the duration, intensity, extent and fre- rity. Rivers are the primary source of mercury to the Arctic Ocean
quency of undersaturation are likely to increase (Steinacher et al., (Fisher et al., 2012). With melting permafrost, more mercury is re-
2009; Mathis et al., 2015; Skogen et al., 2014). Undersaturation is leased from the soil, and because of increased river runoff, more
projected to occur in the bottom waters in the northern Barents mercury will enter the Arctic Ocean. This could affect the health
Sea by 2030 (Popova et al., 2014). Future scenarios suggest a drop of those consuming marine resources such as fish, shellfish, marine
of 0.1–0.4 units in the surface pH by 2100, and in the worst case, mammals, and ultimately humans, as mercury can accumulate in
the Barents Sea will be undersaturated with respect to aragonite the body as occurred in James Bay (Gorrie, 1990). This ultimately
(Fransner et al., 2020). Chierici et al. (2019) showed that the Atlantic could lead to mercury poisoning and severe health issues. Toxins
Arctic inflow area is a net annual ocean CO2 sink, mainly caused by from harmful algal blooms have also been reported with increasing
biological CO2 uptake. Continuing sea-ice declines, with increased frequency in the Pacific Arctic (Natsuike et al., 2013; Lefebvre et al.,
open areas exposed to wind as well as thinner sea ice as projected, 2016), posing additional health risks to coastal communities that
ensures that the Arctic will remain a sink for atmospheric carbon depend on marine species.
dioxide into the future (Nishino et al., 2011a; Fransson et al., 2017). In contrast to these detrimental impacts, the loss of arctic sea ice
has meant opportunities for others. For example, the reduction in
sea ice has opened transportation routes with increasing ship traf-
Climate change impacts on humans fic through the Northeast and Northwest passages, and hence in
Changes in the physical and chemical characteristics of marine the Arctic Gateways (e.g. Dawson et al., 2018; Chen et al., 2020).
ecosystems have a profound effect on human activities in the Arc- Tourist traffic has increased and is expected to increase even fur-
tic, including in the gateways (e.g. Huntington et al., 2020). For ex- ther as ice cover declines (Halliday et al., 2018). This tourist traf-
ample, the loss of open sea ice and landfast ice impacts Indigenous fic is problematic, as the visited sites are often to remote, fragile,
peoples living on arctic coasts via shoreline erosion, interruption of and small Indigenous communities that can be negatively impacted.
transport on ice-covered waters, and less access for hunting marine The decrease in sea ice also opens the Arctic up to oil and gas ex-
animals. These losses also increase access for large vessels to transit ploration, as well as mineral extractions, with the associated poten-
the Arctic and for tourists to visit remote and fragile regions that tial for environmental contamination (Kristoffersen and Langhelle,
are replete with wildlife. 2017). Already, in the National Petroleum Reserve-Alaska, some in-
Shoreline erosion is a major concern along the coasts of Arctic frastructure has become subject to coastal erosion (Holland-Bartels
Alaska and the Yukon, where rates of coastline retreat exceed 5 m and Pierce, 2011). Greater ship traffic also increases the possibility
year–1 in places (Jones et al., 2009). Two main factors are involved: of oil spills (Nevalainen et al., 2019) and the added need for facilities
(1) the length of the open-water season, which is increasingly ex- and personnel to deal with these, if they occur. Increases in marine
tending into the stormy, fall season, and (2) the longer fetch as dis- activities pressure national governments to have search and rescue
tances increase between the shore and the ice edge (Overeem et al., operations available (Ford and Clark, 2019).
2011). The longer fetch allows increased wave heights and overall The effects of climate change on the ecology in the Arctic and
higher water levels, which in turn, increases coastal retreat. Increas- Subarctic including fish and fisheries are dealt with in Mueter et al.You can also read