Whitsunday Regional Council Coastal Hazard Adaptation Strategy (CHAS): Resilient Whitsunday Coast Strategy
←
→
Page content transcription
If your browser does not render page correctly, please read the page content below
Whitsunday Regional Council Coastal
Hazard Adaptation Strategy (CHAS):
R e s i l i e n t W h i t s u n d ay C o a s t S t r at e gy
MAXIMIZING THE RESILIENCE
                           TO CLIMATE CHANGE IN OUR

Solar farm, Collinsville

Page 2                          Wh it sun day Regi onal Counci l Coastal Hazard Adaptati on Str ategy ( C HAS) :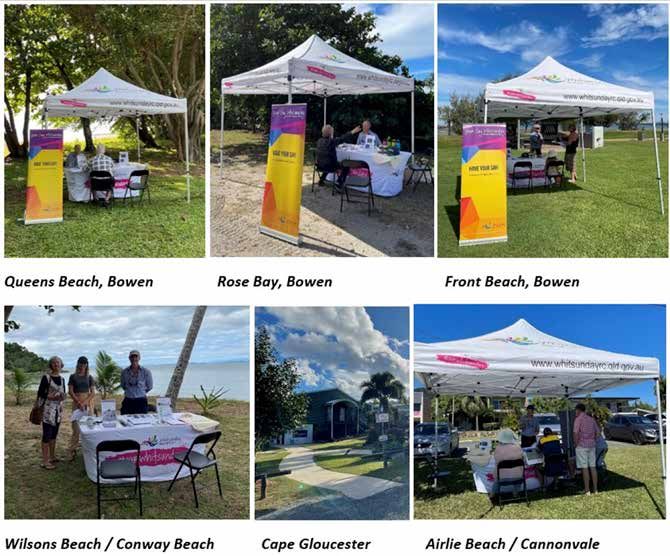
Whitsunday Regional Council Coastal
                     Hazard Adaptation Strategy (CHAS):
                     R e s i l i e n t W h i t s u n d ay C o a s t S t r at e gy

                      Date/ Version:
                      30 July 2021 - Version 2

                      Citation:
                      WRC (2021)
                      Whitsunday Regional Council Coastal Hazard Adaptation Strategy (CHAS):
                      Resilient Whitsunday Coast Strategy, February 2020

                      www.whitsundayrc.qld.gov.au
                      1300 WRC QLD (1300 972 753)
                      info@whitsundayrc.qld.gov.au

R e s il i en t W h i t s u n day C oast St rat e gy                                           Pag e 1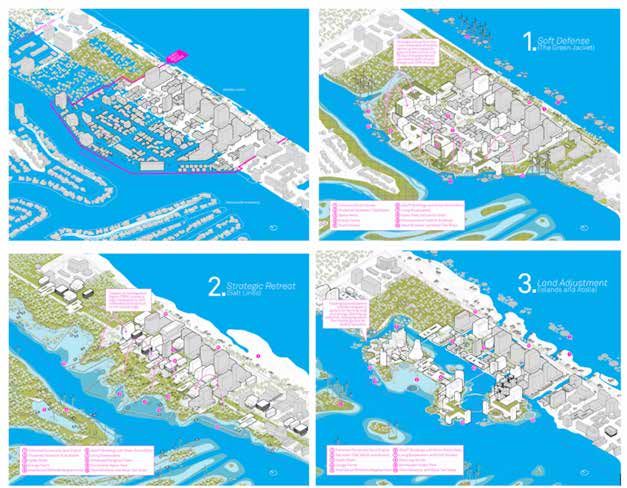
M ayor ’s F o r e w o r d
I am pleased to present the Whitsunday Regional Council
Coastal Hazard Adaptation Strategy. This strategy details
the effects of climate change and coastal hazards on our
coastal urban communities and sets out our commitment to
managing those potential impacts into the future.
Council acknowledges the traditional owners and custodians
of the lands in our region including the Ngaro, Gia, Juru,
Jangga and Birriah groups. We pay respect to Elders past,
present and emerging and acknowledge their ongoing
relationship and connection to Country.
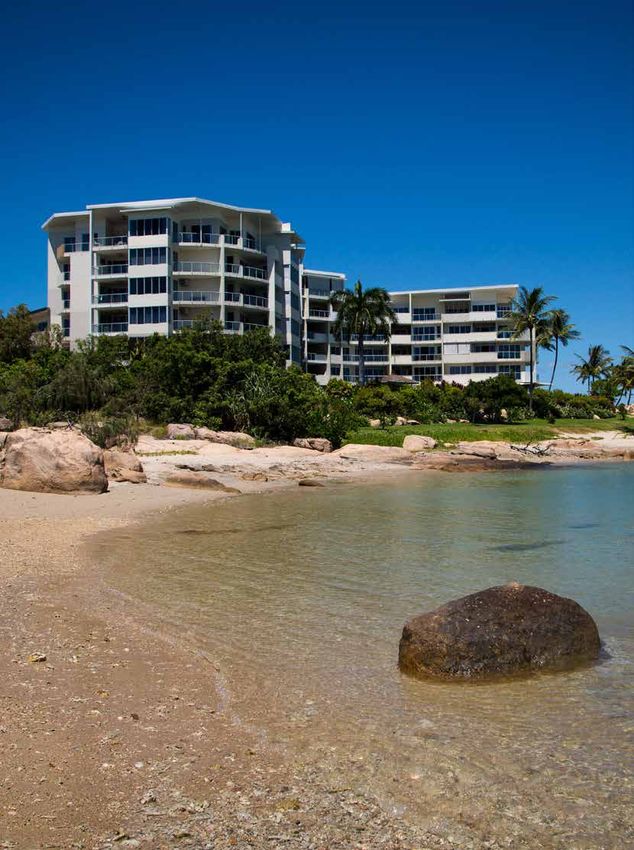
The Whitsunday coastal zone has significant ecological value and features a diverse range of natural
landscapes which are highly valued by our residents and the thousands of visitors who visit the
Whitsunday Region each year.
Home to the over 500 kilometers of coastline and the gateway to the 74 beautiful Whitsunday Islands
and the Great Barrier Reef, we are fortunate to live in a naturally spectacular part of the world. As
well as the thriving ecosystems, the coastline holds significant recreational, commercial, cultural and
tourism value which underpins our economy.
Council acknowledges that our home is exposed to extreme weather events which are becoming
increasingly common. Our coastal landscape is susceptible to storm tide, coastal erosion and
inundation. In the future we will need to add sea level rise to the list of hazards.
I am proud that this Council is taking the important step of assessing our vulnerabilities so we can
develop coastal adaptation options to mitigate the impacts of these hazards. Education and raising
community awareness about climate change and coastal hazards can help build more resilient
communities so I invite our residents to follow us on this journey.
The Queensland State Government and Local Government Association of Queensland (LGAQ)
provided funding to Queensland coastal councils to develop a strategic approach to managing
coastal hazards through the development of the Coastal Hazard Adaptation Strategy (CHAS).
With the funding awarded to Whitsunday Regional Council, we have been able to develop this
Coastal Hazard Adaptation Strategy, and are now better prepared to plan and manage the future
impacts associated with sea level rise in our urban coastal communities.
Page 2 Wh it sun day Regi onal Counci l Coastal Hazard Adaptati on Str ategy ( C HAS) :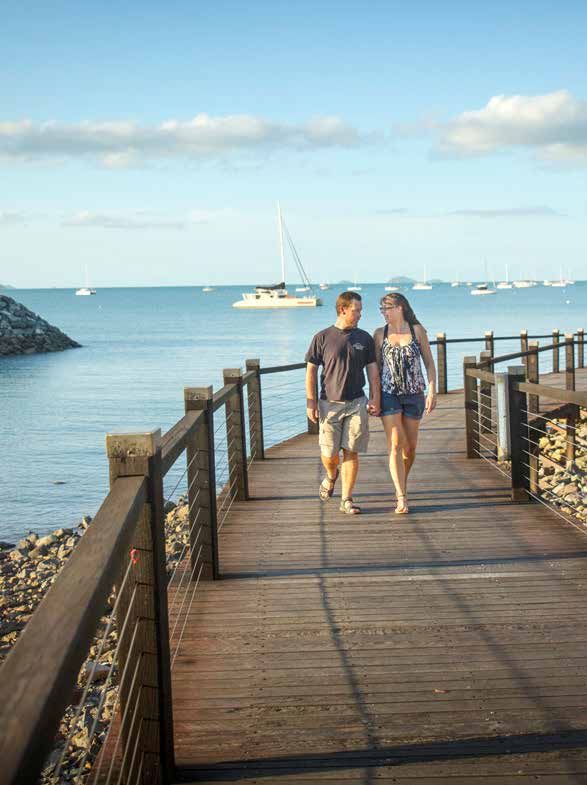
TAB L E O F CO N TE N TS

            Mayor’s Message............................................................. 2     6.4.1    Development Setbacks........................................ 34
            1     Introduction.......................................................... 5     6.4.2    Limited Development........................................... 35
            1.1 Our Coastline......................................................... 5       6.4.3    Redefining Planning Objectives (Rezoning) ....... 35
            1.2 The Resilient Whitsunday Coast Strategy............. 5                         6.4.4    Land Use Planning............................................... 36
            1.3 Engagement........................................................... 7        6.4.5    Land Swap........................................................... 37
            2     The Whitsunday Region...................................... 9                6.4.6    Land Buy-Back..................................................... 38
            2.1 Coastal Landscape................................................ 9            6.4.7    Land Surrender.................................................... 39
            2.2 Social Features...................................................... 9        6.4.8    Compulsory Land Acquisition............................... 39
            2.3 Economic Drivers................................................... 9          6.5      Institutional Options............................................. 40
            2.4 Vulnerability and Resilience................................. 10               6.5.1    Monitoring of Climate Change Adaptation .......... 40
            3     Coastal Hazards................................................. 11          6.5.2    Maintaining the Status Quo.................................. 41
            3.1 Hazards................................................................ 11     6.6      Social Options...................................................... 41
            3.2 Coastal Erosion.................................................... 11         6.6.1    Raising Community Awareness........................... 41
            3.3 Storm Tide Inundation.......................................... 11             6.6.2    Knowledge Sharing.............................................. 42
            3.4 Coastal Hazard Mapping..................................... 12                 6.6.3    Hazard Mapping................................................... 43
            4     Assets Exposed to Coastal Hazards................ 13                         6.6.4    Coastal Imaging Techniques................................ 44
            4.1 Total Exposure..................................................... 14         6.6.5    Communicating through Social Media................. 45
            4.2 Assets Exposed to Coastal Erosion..................... 14                      7        Location Summaries.......................................... 49
            4.3 Assets Exposed to Storm Tide Inundation........... 15                          7.1      Airlie Beach ......................................................... 49
            4.4 Economic Cost of Exposure................................. 17                  7.2      Bowen.................................................................. 51
            5     Assessing Risks to Assets............................... 20                  7.3      Cannonvale.......................................................... 55
            5.1 Approach.............................................................. 20      7.4      Conway Beach..................................................... 56
            5.2 Summary of Risks to Assets................................ 21                  7.5      Dingo Beach........................................................ 58
            6     Approach to Adaptation.................................... 23                7.6      Hydeaway Bay..................................................... 60
            6.1 Regenerative Options.......................................... 24              7.7      Shute Harbour...................................................... 61
            6.1.1 Beach Nourishment............................................. 24            7.8      Wilson Beach....................................................... 62
            6.1.2 Dune Construction and Regeneration.................. 25                      8        General Adaptation Actions & Way Forward...64
            6.1.3 Riparian Corridors Restoration and Generation... 26                          9        References.......................................................... 67
            6.1.4 Mangrove Forests ............................................... 27
            6.2 Coastal Engineering Options............................... 28                  APPENDIX I................................................................... 68
            6.2.1 Artificial Reefs...................................................... 28    About ............................................................................. 69
            6.2.2 Detached Breakwaters......................................... 28             1.    Governance......................................................... 69
            6.2.3 Groynes and Artificial Headlands......................... 29                 2.    Summary of Adaptation Response by Locality ... 70
            6.2.4 Sea Dykes or Levee............................................. 30           3.    WRC Five Year Action Plan................................. 75
            6.2.5 Seawalls............................................................... 31    4. Triggers for Change............................................. 78
            6.3 Coastal Settlement Design Options..................... 32                      11    Supplements........................................................ 79
            6.3.1 Climate Resilient Design...................................... 32            12 Acknowledgments................................................ 79
            6.3.2 Elevated Dwellings............................................... 33
            6.3.3 Raise Land Levels............................................... 33          APPENDIX II ................................................................. 80
            6.4 Planning Options................................................. 34           Community Consultation .............................................. 80

R e s il i en t W h i t s u n day C oast St rat e gy                                                                                                                                    Pag e 3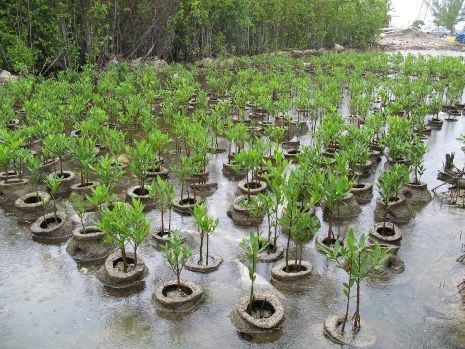
List of Figures
             Figure 1: Diagram of project phases from Minimum Standards and Guidelines      7

             List of Tables
             No table of figures entries found.

             List of Abbreviations

Boardwalk, Cannonvale

Page 4                                   Wh it sun day Regi onal Counci l Coastal Hazard Adaptati on Str ategy ( C HAS) :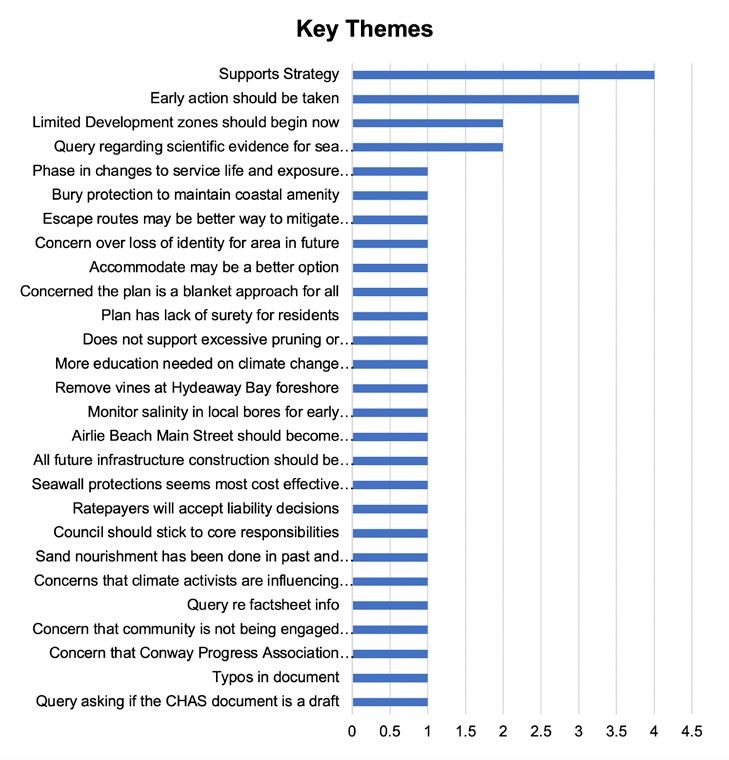
1          I nt ro d u cti o n

                      1.1        Our Coastline
                      The Whitsunday region coastline extends 500 km across numerous coastal communities and
                      adjacent to 74 islands which form a gateway to the Great Barrier Reef. The Whitsunday coastal zone
                      is home to approximately 35,500 permanent residents. The region features a diverse range of natural
                      landscapes such as beaches, reefs, rainforests and national parks which place the Whitsunday in
                      prime position to become a world-class tourism destination.

                      The coastline is composed of a range of coastal landforms including sandy beaches, low beach-ridge
                      plains, tidal mud flats, wetlands, rocky headlands, islands, near shore reefs and mangrove forests.
                      The coastal zone provides valuable ecosystem services and a unique collection of terrestrial and
                      aquatic species which support the region’s economic and social wellbeing. The coastal environment
                      is continuously changing as a result of dynamic natural processes such as tides, waves, erosion,
                      inundation, storms and cyclones, and changes in sea level. However, coastal erosion and storm
                      tide inundation have been identified as coastal hazards for the Whitsunday region because of their
                      potential adverse impacts on people, the built environment and infrastructure.

                      1.2 The Resilient Whitsunday Coast Strategy

                      Context
                      Whitsunday Regional Council was successful in its funding application under the Coastal Hazards
                      Adaptation Program (QCoast2100). The QCoast2100 program is a state-wide initiative of the
                      Queensland Government and the Local Government Association of Queensland (LGAQ) to help
                      coastal councils plan for and address climate change related coastal hazard risks over the long-
                      term. Through their ‘Resilient Whitsunday: Coastal Hazards and Responses’ program, Whitsunday
                      Regional Council have developed a Coastal Hazard Adaptation Strategy (CHAS), which is presented
                      as the Resilient Whitsunday Coast Strategy.

                      The Resilient Whitsunday Coast Strategy:
                       •    Has been developed to proactively manage the current and future impacts of coastal erosion
                            and storm tide inundation
                       •    Was developed in partnership with communities and other stakeholders
                       •    Encompasses eight coastal communities including Airlie Beach, Bowen, Cannonvale, Conway
                            Beach, Dingo Beach, Hydeaway Bay, Shute Harbour and Wilson Beach.

R e s il i en t W h i t s u n day C oast St rat e gy                                                                        Pag e 5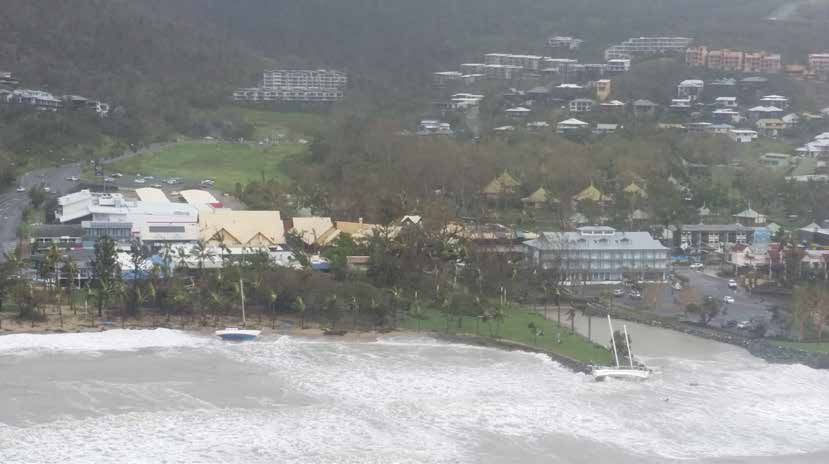
Conway Beach

               Purpose
               The purpose of the Strategy is to:
               •   understand how climate change and coastal hazards affect coastal communities, local economy,
                   natural environment and WRC operations (current and future impacts);
               •   identify areas likely to be exposed to current and future coastal hazards (e.g. storm tide, coastal
                   erosion and inundation and sea level rise);
               •   assess the vulnerabilities and risks to key Council and community assets through a
                   comprehensive data collection and spatial analysis process;
               •   develop potential coastal adaptation options to mitigate the impact of these hazards; and
               •   assess the viability of adaptation options through stakeholder engagement and economic
                   analysis.

               Approach
               The Resilient Whitsunday Coast Strategy has been developed using an eight-phase process which
               align with the QCoast2100 Minimum Standards and Guidelines provided by LGAQ (see Figure 1).
               The process included a series of deliverables such as studies, spatial mapping, risk assessments
               and reports which aimed to:

               •   identify and assess areas at risk from coastal hazards
               •   engage the community to raise awareness of climate change impacts and offer a range of
                   adaptation options
               •   propose priority adaptation options to address short-term impacts
               •   determine costs, priorities and time frames for implementation of adaptation actions

Page 6                                   Wh it sun day Regi onal Counci l Coastal Hazard Adaptati on Str ategy ( C HAS) :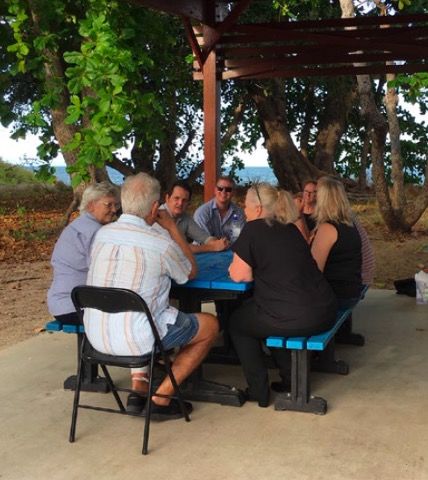
Figure 1: Diagram of project phases from Minimum Standards and Guidelines

                      1.3 Engagement

                      Process
                      The Resilient Whitsunday Coast Strategy has been developed through a transparent engagement
                      process with key stakeholders and the Whitsunday community. Initial community presentations
                      were held in July 2017 at Bowen and Proserpine to encourage the community to participate and
                      share their stories and memories of past weather events. During the early phases of the process,
                      stakeholder engagement meetings were also held with representatives from:

                       •    Dingo Beach Progress Association
                       •    Hydeaway Bay Progress Association
                       •    Whitsunday Catchment Landcare
                       •    Department of Agriculture and Fisheries
                       •    Mackay Regional Council
                       •    Reef Catchments
                       •    Urban Development Institute of Australia
                       •    Queens Beach Action Group

R e s il i en t W h i t s u n day C oast St rat e gy                                                                     Pag e 7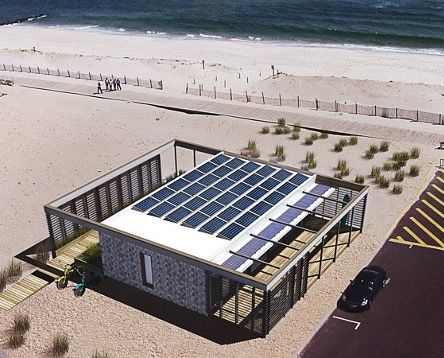
Whitsunday Regional Council facilitated an engagement workshop with Indigenous and Aboriginal
         stakeholders from the Whitsunday community in November 2018. The workshop enabled sharing of
         relevant coastal hazard information and allowed the Juru People to provide meaningful engagement
         about the potential impacts of adaptation options.

         The results of an online survey completed by stakeholders and Council staff members was also used
         to determine preferences for weighting the criteria in the Multi-Criteria Analysis.

         Throughout the process, residents from seven of Whitsunday’s coastal communities joined
         community consultation events to explore the coastal processes shaping our coastlines, and to
         provide feedback on coastal management and adaptation options for the future.

         Communication
         Throughout the development of the Resilient Whitsunday Coast Strategy, regular updates were
         posted on Council’s website to inform the wider community about the progress of the project. The
         ‘Your Say Whitsunday’ website also provided an online platform for the community to upload photos
         of past weather events, participate in online survey, engage in presentations and events and provide
         feedback about the project. A Communication Plan and Stakeholder Engagement Plan created in
         Phase 1 guided the engagement and communication process across all phases of the ‘Resilient
         Whitsunday’ project.

         Community consultation of draft Resilient Whitsunday Coast Strategy
         The Council conducted community consultation during May 2021 on the draft Resilient Whitsunday
         Coast Strategy. Community information stalls and meetings were held at the following locations:

         •    Queens Beach – Bowen (8th of May)
         •    Rose Bay – Bowen (8th of May)
         •    Front Beach – Bowen (8th of May)
         •    Wilsons Beach (9th of May)
         •    Cannonvale (15th of May
         •    Hydeaway Bay (16th of May)

         There were 54 residents who attended the community information stalls over the 6 information stall
         events.

         In addition, the Council conducted an online survey to gauge community support and interest in the
         draft Strategy. The Council received 10 submissions.

Page 8                             Wh it sun day Regi onal Counci l Coastal Hazard Adaptati on Str ategy ( C HAS) :
2 T he W h i ts u n day Region
2.1 Coastal Landscape
Whitsunday’s coastline is environmentally diverse. The land was the traditional home of the Gia
People and Juru People. The coastline and islands are sprinkled with pristine sandy beaches which
are one of the major natural draw cards for visitors. The natural landscapes offer diverse rainforests
and large tracts of national parkland. The beautiful tropical coastline is protected and rejuvenated
by extensive mangrove forests and river deltas. Whitsunday is right in the heart of the Great
Barrier Reef, where fringing reefs adjoin the region’s 74 islands. These features provide a range of
ecosystem services critical to the region’s economy, social well-being and ecosystems.
2.2 Social Features
There were approximately 33,778 permanent residents recorded living in the Whitsunday region in
2016 (ABS 2016). A strong local economy and relative favourable climatic conditions (Bell and Moran
2016) are expected to drive an increase in population going forward with an annual rate of 2.3%
projected for the next twenty years. Socio-economic indicators show that the Whitsunday region’s is
relatively advantaged compared to the State average, which is likely driven by the superior economic
resources maintained by the Whitsunday population (in contrast to the State).
In June 2018, regional unemployment in the Whitsunday region was estimated to be 3.4%. This is a
significant improvement from the 2015 ‘unemployment crisis’ when a reduction in mining operations
in the west of the region drove unemployment beyond 10% ( (WRC 2016).
2.3 Economic Drivers
The Whitsunday region boast a strong and diverse economy which is supported by 15,805 jobs
and a total of economic output of $5.6 billion per year (REMPLAN 2020). The Whitsunday regional
economy is driven by three pillar industries - mining, tourism and agriculture.
Mining
The mining sector is the biggest contributor to the Whitsunday region’s economy, worth $996.3
million or 17.9% of the region’s total industry output (REMPLAN 2020). With mining generating
approximately $926.6 million in regional exports, it is the Whitsunday’s largest exporter and will
continue to be a significant economic contributor going forward.
R e s il i en t W h i t s u n day C oast St rat e gy Pag e 9Tourism
Tourism industry supports around 3,284 jobs which makes it Whitsunday’s biggest employer,
representing 20.8% of total employment (REMPLAN 2020). Many of these jobs (79%) are from
the Accommodation and Food Services which are supported by tourist expenditure. This presents
opportunities to build on the region’s rich indigenous and European history, food tourism and nature-
based experiences. The value of Tourism in the region for 2019-2020 was estimated at $477 million
(REMPLAN, 2020).
Agriculture
The Agriculture, Forestry & Fishing industry is the second largest contributor to the region’s economic
output, generating 1,646 jobs and $599.4 million per year (REMPLAN 2020). In 2017-18, the wider
Mackay Isaac Whitsunday Region contributed over $1.1 billion in gross value to Queensland’s
agriculture production, which equates to 8.5% of the State (ABS 2019). Areas of the Whitsunday
region also have a well-established horticulture industry that supports 13 major crop varieties. With
around 22,000 hectares of cane-growing land currently under cultivation in Proserpine, there is also
opportunity for region’s sugar industry to grow.
2.4 Vulnerability and Resilience
Vulnerability is how susceptible exposed elements, such as people and assets, are to suffer adverse
effects when impacted by a hazard. The concept of vulnerability is closely linked with resilience.
Building resilience involves maximising the capacity of systems to adapt to stressors (i.e. climate
change) in a way which maintains their purpose and function. For Whitsunday to build a resilient
coastal region, this project first explored characteristics of the region’s ecosystems and the socio-
economy which may influence their capacity to absorb and recover from coastal hazard impacts.
An economist conducted a vulnerability assessment to identify the social and economic
susceptibilities of the eight coastal communities. Bowen and Conway Beach were identified as
areas with high socio-economic vulnerability. The assessment also identified five key drivers of
regional vulnerability:
1. Resource vulnerability
2. Financial sustainability
3. Access to affordable insurance
4. Council leadership
5. Climate change governance
Page 10 Wh it sun day Regi onal Counci l Coastal Hazard Adaptati on Str ategy ( C HAS) :3 C oas ta l H a z a r d s
3.1 Hazards Figure 1a: Cyclones through the Whitsunday
region since 1907 (Source bom.gov.au website)
Coastal hazards include erosion of the coastal foreshore and storm tide inundation of low-lying
coastal land. However, these naturally occurring processes are considered coastal hazards because
they have the potential to negatively impact communities, development and natural assets along
the coastline.
The Whitsunday region also experiences impacts from sea level rise and Tropical Cyclones which
are drivers associated with coastal hazards and therefore have the potential to exacerbate coastal
erosion and storm tide inundation.
3.2 Coastal Erosion
Coastal erosion is the removal of beach and dune material which results in a loss of land along
the coastline. This process occurs naturally and is typically driven by strong winds, changing wave
conditions, high tides and severe storms (DILGP 2017).
Short-term erosion is a temporary cycle where beaches move naturally over periods of decades
without causing a permanent change in the position of the shoreline. Through periods of short-term
erosion, the coastline shifts backwards and forwards over many years. However, this erosion is not
permanent, and the coastline, beaches and dunes can rebuild over time.
Furthermore, climate change is predicted to worsen coastal erosion. Sea level rise will speed up the
process as waves reach higher up on the beach and cause permanent inundation of low-lying areas.
This is likely to result in coastal recession which is the landward movement of the coastline over a
longer period of time.
With a history coastal erosion events in the Whitsunday region, both short-term erosion and coastal
recession may impact on Whitsunday’s coastal assets, depending on their proximity to the shoreline.
3.3 Storm Tide Inundation
Storm tide inundation is the temporary flooding of coastal land by unusually high sea levels. A storm
tide occurs when a storm surge, a normal tide and wave action are combined to elevate the water
levels well above normal tidal levels (DILGP 2017). The worst inundation impacts are likely to occur
when the storm surge coincides with a high tide or king tide. This interaction creates a compounding
effect which can lead to increased severity of a storm tide inundation. Storm tides are a prominent
occurrence in the Whitsunday region during severe storm events and Tropical Cyclones.
R e s il i en t W h i t s u n day C oast St rat e gy Pag e 1 13.4 Coastal Hazard Mapping
Updated Mapping
Part of the ‘Resilient Whitsunday’ project included an update to Whitsunday Regional Council’s
coastal hazard mapping. Engineering consultants were tasked with producing coastal erosion
mapping and storm tide inundation modelling of the entire Whitsunday coastline. These mapping
updates included:
• New mapping of coastal erosion prone area for the entire coastline1
• New mapping of permanent inundation due to sea level rise for the entire coastline2
• Updated mapping of storm tide inundation for Bowen3
• Updated mapping of storm tide inundation for the Town of Whitsunday4
In accordance with Queensland Government requirements, a sea level rise of 0.4m by 2050 and
0.8m by 2100 has been adopted for the Whitsunday Resilient Strategy.
1 Whitsunday Regional Council Hazard Mapping Refinement (BMT WBM 2018)
2 Ibid.
3 Bowen Water Hazards Assessment Stage 1: Storm Tide Modelling Basis Report (BMT WBM 2018)
4 Town of Whitsunday Drainage Study (BMT WBM 2017)
Planning Horizons
Planning horizons were considered in the creation of coastal hazard maps to ensure that the
adaptation options undertaken by council encompass short, medium, and long-term actions. The
mapping for coastal erosion and storm tide inundation includes three planning horizons: current
day, 2050 and 2100 (see Table 1). Two sea level rise allowance were adopted for future planning
horizons, including 0.4m of sea level rise for 2050 and 0.8m for 2100, relative to present-day mean
sea level (BMT WBM 2018). Storm tide inundation was also mapped using three levels of probability
called Annual Exceedance Probability (AEP), which represent different chances of inundation
occurring. For each planning horizon, maps were generated for 1% AEP, 0.5% AEP and 0.2% AEP
storm tide inundation events.
Refer the reader to the council website where the coastal hazard mapping is located.
https://mapping.whitsundayrc.qld.gov.au/connect/analyst/mobile/#/main?mapcfg=CHAS
Page 12 Wh it sun day Regi onal Counci l Coastal Hazard Adaptati on Str ategy ( C HAS) :Figure 2: Damage cause by coastal storms, Airlie Beach
Table 1: Coastal hazard maps
Sea Level Rise
Coastal Hazard Planning Horizon AEP Scenarios
Allowance
Current Day - -
Coastal Erosion 2050 0.4 m -
2100 0.8 m -
Sea Level Rise 2050 0.4 m -
Inundation 2100 0.8 m -
Current Day - 1%, 0.5%, 0.2%
Storm Tide Inundation 2050 0.4 m 1%, 0.5%, 0.2%
2100 0.8 m 1%, 0.5%, 0.2%
These coastal maps illustrate the areas that may be exposed to coastal erosion and storm tide
inundation under current and future planning horizons. This does not mean that the land inside
the exposure are will be lost, rather that the assets and people within these areas are likely to be
impacted by coastal hazards. For more information on the mapping approached used, see the
technical reports developed in Phase 3.
R e s il i en t W h i t s u n day C oast St rat e gy Pag e 1 34 A s s e ts E x p o s e d t o Coa sta l H a za rd s
4.1 Total Exposure
The spatial mapping indicates that Whitsunday’s coastal communities are expected to experience
increased exposure to coastal erosion and storm tide inundation by 2050. These communities will
likely see double the area exposed to coastal erosion by 2050, which will reach 1.9 km2 by 2100 (see
Table 2). At present, around 10km2 of land is at risk of exposure to a 1 in 100 year storm inundation
(1% AEP) event. Under this scenario, there is a 58% increase in the total area exposed to storm tide
inundation by 2100. For more severe storm tide inundation events, up to 21 km2 of land is predicted
to be exposed for the 2100 planning horizon. Additional information on exposure is provided in the
summary report produced in Phase 4.
Table 2: Total area exposed to coastal hazards for all coastal communities
(each planning horizon)
Coastal Hazard Current Day 2050 Planning Horizon 2100 Planning Horizon
Coastal Erosion 0.7 km2 1.4 km2 1.9 km2
1% AEP Storm Tide
10 km2 13 km2 16 km2
Inundation
0.5% AEP Storm Tide
11 km2 14 km2 17 km2
Inundation
0.2% AEP Storm Tide
13 km2 17 km2 21 km2
Inundation
*(Note 1km2 = 10ha)
4.2 Assets Exposed to Coastal Erosion
Coastal erosion is likely to have the greatest impact on sandy beaches and buildings situated along
the shoreline. All coastal communities will experience increases in the number of building exposed to
future coastal erosion, with Bowen showing the highest risk (see Figure 2). In Bowen it is estimated
that 38 buildings will be exposed in 2050, which more than doubles by 2100 to 93 buildings.
By 2100, there will be approximately 0.448 km2 of council parks exposed to coastal erosion, which is
equivalent to the area of 25 sporting ovals or 44ha. There are also over 190 km of roads and around
222 km of both sewer and water mains at risk of coastal erosion by 2100. Sandy beaches are the
most at risk from future coastal erosion, with over 66% of beaches exposed in 2050 and 2100.
Page 14 Wh it sun day Regi onal Counci l Coastal Hazard Adaptati on Str ategy ( C HAS) :4.3 Assets Exposed to Storm Tide Inundation
100
90
80
Number of buildings
70
60
50
40
30
20
10
0
Airlie Bowen Cannonvale Conway Dingo Hideaway Wilson
Beach Beach Beach Bay Beach
Curre nt Day 2050 2100
Figure 2: Number of buildings exposed to coastal erosion in each coastal community
A storm tide inundation event is likely to have considerable impacts on property, infrastructure,
social and environmental assets both now and in the future. Under a current day 1% AEP storm tide
inundation event there are 44 buildings exposed with most of these properties located in Bowen
(see Table 3). By 2050, coastal communities can expect around 224 buildings to be at risk of a 1 in
100 year storm tide inundation event. If this scenario where to occur in 2100, it is estimated that 583
building would be exposed, with around 80% originating in Bowen.
R e s il i en t W h i t s u n day C oast St rat e gy Pag e 1 5Table 3: Number of buildings exposed to a 1%AEP storm tide inundation event in each coastal
community
Number of buildings
Interest Area
Current Day 2050 2100
Airlie Beach 5 13 19
Bowen 34 172 466
Cannonvale 2 7 32
Dingo Beach - - 17
Hydeaway Bay 1 2 3
Shute Harbour - 1 1
Wilson Beach 2 29 45
Total 44 224 583
Over half of the council parks are at risk of storm tide inundation by 2100, which is a 63% increase
from current day exposure and equates to the area of 71 sporting ovals. At least 2.9 km of sandy
beach is exposed to both current and future storm tide inundation in urban areas. In 2018, there are
13 km of infrastructure potentially impacted by a 1% AEP storm tide inundation event. This increases
7-fold by 2100 with over 90 km of infrastructure exposed (see Figure 3). By 2100, there could
potentially be 25 km of roads, 33 km of sewer mains, 23 km of water mains, and 9 km of storm water
exposed to storm tide inundation across all coastal communities.
2017
2050
2100
0 10 20 30 40 50 60 70 80 90 100
Length of exposed asset (km)
Roads Sewer Mains Stormwater Mains Wa ter Mains
Figure 3: Length of assets exposed to storm tide inundation for each scenario
(by asset subclass)
Page 16 Wh it sun day Regi onal Counci l Coastal Hazard Adaptati on Str ategy ( C HAS) :4.4 Economic Cost of Exposure
During this project, economic values sourced from Council’s financial databases were assigned to a
range of assets, including property, transport, water, sewer and social assets. The results show the
present value of assets exposed, which represents the current cost required to replace the assets.
For each coastal hazard, the economic cost of assets exposed is estimated to increase substantially
in the future, under both the 2050 and 2100 planning horizons (see Figure 2). The replacement cost
of assets exposed to coastal erosion is likely to rise by $123 million dollars from current day to reach
over $126 million dollars in 2100.
For Whitsunday coastal communities, the present value of assets exposed to a current day 1%
AEP storm tide inundation event is estimated to be $14 million. In the absence of adaptation, this is
predicted to increase to $89 million dollars by 2060, and over $188 million dollars by 2100. These
economic costs are likely to be higher for more intense storm tide inundation events (i.e. 0.5% and
0.2% AEP).
Coastal Erosion
1% AEP Storm
Tide Inundation
0.5% AEP Storm
Tide Inundation
0.2% AEP Storm
Tide Inundation
0 100 200 300 400 500
Present value of assets exposed ($M)
Current Day 2050 2100
Figure 4: Present value of assets exposed to coastal erosion and storm tide inundation
(across planning horizons)
R e s il i en t W h i t s u n day C oast St rat e gy Pag e 1 7Bowen is the coastal community with the highest economic risk to future coastal hazards
(see Table 4). If a 1% AEP storm tide inundation event were to occur in 2100, 66% of the economic
costs would originate from Bowen, making it the largest contributor to economic exposure compared
with the other coastal communities (see Figure 5). In 2100, it is estimated to cost $51 million dollars
to replace the assets exposed to coastal erosion and a further $117 million dollars from a 1 in 100
year storm tide inundation event (1% AEP).
Wilson Beach, 11%
Shute Harbour, 1% Airlie Beach, 7%
Hideaway Bay, 0%
Dingo Beach, 3%
Conway Beach, 9%
Cannonvale, 7%
Bowen, 62%
Figure 5: Percentage of economic costs to each coastal community from a 1% AEP storm tide
inundation event in 2100
In Wilson Beach, it is likely to cost over $20 million dollars for assets exposed to a 1% AEP storm tide
inundation event. Although, with few permanent residents this may present as an economic challenge
for a small coastal town.
Page 18 Wh it sun day Regi onal Counci l Coastal Hazard Adaptati on Str ategy ( C HAS) :Table 4: Present value of assets exposed to coastal erosion and storm tide inundation in 2100
(each coastal community)
Present value of assets exposed ($M)
Coastal
Community 1% AEP storm tide 0.5% AEP storm 0.2% AEP storm
Coastal Erosion
inundation tide inundation tide inundation
Airlie Beach 0.9 12.4 13.7 15.1
Bowen 50.9 117.1 158.3 318.0
Cannonvale 6.5 13.4 18.2 23.4
Conway Beach 24.4 16.8 16.9 17.0
Dingo Beach 19.3 6.4 8.4 12.5
Hydeaway Bay 11.1 0.6 0.7 1.0
Shute Harbour - 1.6 0.0 0.0
Wilson Beach 13.4 20.4 21.0 21.8
Total 126.5 188.8 237.2 408.8
Environmental assets
The ‘Resilient Whitsunday’ project also estimated the economic loss that ecosystem services in
Whitsunday’s coastal communities would experience from coastal hazards. It focused on four key
environmental assets, these included: coastal forests, mangroves/saltmarshes, reefs/shoals and
seagrass, and sandy beaches.
The environmental assets at greatest risk of coastal hazards are sandy beaches. For Whitsunday’s
coastal communities, the loss of sandy beaches to coastal erosion is estimated to cost around $65
million dollars in 2100. The expected losses of sandy beaches to a 1 % AEP storm tide inundation
event is estimated to exceed $30 million dollars in 2100.
Sandy beaches affect three key stakeholder groups in the Whitsunday region, including:
• Tourism businesses: Tourism businesses rely on the regions unique and pristine environment
as the primary tourist attraction to the region. Degradation of sandy beaches assets is likely to
reduce tourist satisfaction which may result in less repeat visitation, reduced numbers of tourists
visiting the region, and/or tourists staying for shorter periods of time (Stoeckl 2014). These risks
are very important for the broader Whitsunday economy.
• Local residents: Local residents receive significant enjoyment from ecosystem-based
recreation activities (such as fishing, diving and walking) as well as the visual aesthetic provided
by these assets.
• Whitsunday Regional Council: Council currently maintain and remediate sandy beach areas
in some key locations (e.g. Airlie Beach). If these responsibilities are to continue, then damage
to these assets represents a substantial cost impost.
R e s il i en t W h i t s u n day C oast St rat e gy Pag e 1 95 A s s e s s i n g R i s ks t o A sse t s
5.1 Approach
An important part of the ‘Resilient Whitsunday’ project was to identify key assets exposed to coastal
erosion and storm tide inundation and estimate the level of risk posed by these coastal hazards.
A risk assessment was conducted using information about an assets’ exposure (consequence)
combined with the probability of a hazard event occurring (likelihood) to determine the risk level
to each asset. The risk assessment included an analysis of:
• Council-owned infrastructure assets (buildings, roads, water, sewer)
• Council-owned buildings and open space assets (buildings, coastal structures, open spaces)
• Building footprints (residential, community and industry buildings) created through spatial
mapping
• Cultural sites and heritage places
• Environmental and ecosystem assets
The process aligned with the Australian standard for risk management AS/NZS ISO 31000:2009. The
risk assessment followed three steps:
1. Assess likelihood of occurrence: The probability of each coastal erosion and storm tide
inundation scenario occurring was determined (see Table 5). Five likelihood levels (consistent
with the Australian standard) were considered. These include almost certain, likely, possible,
unlikely, and rare.
Table 5: Risk likelihood rating for each coastal hazard scenario
Hazard Category Planning Horizon AEP (%) Likelihood
Current day - Almost certain
Coastal Erosion 2050 - Possible
2100 - Unlikely
Current day 1% Unlikely
2050 1% Unlikely
2100 1% Unlikely
Current day 0.5% Unlikely
Storm Tide Inundation 2050 0.5% Unlikely
2100 0.5% Unlikely
Current day 0.2% Rare
2050 0.2% Rare
2100 0.2% Rare
Page 20 Wh it sun day Regi onal Counci l Coastal Hazard Adaptati on Str ategy ( C HAS) :2. Assess level of consequence for assets: The anticipated impact on each asset was identified
based on the severity of exposure. To achieve this, two consequence matrices (for erosion and
inundation) were developed based on workshops with department stakeholders to identify key
asset groups (i.e. property, transport, sewer, water, social, cultural and environment). Five levels
of consequence were adopted including insignificant, minor, moderate, major and catastrophic.
3. Assign the level of risk: the risk to each asset (for erosion and inundation) was calculated
using a risk matrix which combined the likelihood and consequence levels (see Table 6). The
matrix includes four risk levels: low, medium, high and extreme.
Table 6: Risk matrix
CONSEQUENCE
Insignificant Minor Moderate Major Catastrophic
Almost Low Medium High Extreme Extreme
Certain
LIKELIHOOD
Likely Low Medium High Extreme Extreme
Possible Low Medium High High Extreme
Unlikely Low Medium Medium High Extreme
Remote Low Low Medium Medium High
5.2 Summary of Risks to Assets
The Project Team assessed a total of 3,472 risks to assets exposed to coastal hazards in the
identified areas of interests. Since a plethora of information was obtained from the analysis, not all
the results can be presented in this report. This section provides a collective summary of the number
of asset subclasses assigned to each risk level for a current day event and 2100 planning horizon.
The hazard identified with the greatest risk was sea level rise inundation in 2100, with 20 assets
receiving an ‘extreme’ level of risk (see Figure 4). There were also three asset subclasses which
recorded an ‘extreme’ risk for a current day coastal erosion event. For a current day event, there
are 12 assets with a ‘high’ risk for coastal erosion and 16 assets which received a ‘high’ level of risk
under the 0.2% AEP storm tide inundation event (see Table 25). However, there are numerous assets
which received a ‘high’ risk level for all coastal hazards under a 2100 planning horizon. In particular,
there were 51 asset subclasses with a ‘high’ risk for the 1% AEP storm tide inundation scenario.
This is of importance because these ‘high’ risk assets are considered to have a ‘tolerable’ risk which
means they still require immediate to short-term action to reduce the risk to acceptable levels. Site
specific risk summaries are presented in Section 7.
R e s il i en t W h i t s u n day C oast St rat e gy Pag e 2 1Table 7: Number of asset subclasses assigned to each risk level for coastal hazards under a
current day event
Number of asset subclasses assigned to each risk level
Hazard Type
None Low Medium High Extreme
Coastal erosion in 2018 195 38 12 3
1% AEP storm tide inundation in 149 82 17
2017
0.5% AEP storm tide inundation in 145 81 22
2017
0.2% AEP storm tide inundation in 142 77 16 13
2017
Figure 6: Number of asset subclasses assigned to each risk level for coastal hazards
under a 2100 planning horizon
Page 22 Wh it sun day Regi onal Counci l Coastal Hazard Adaptati on Str ategy ( C HAS) :6 A p p r oach to A da ptat ion
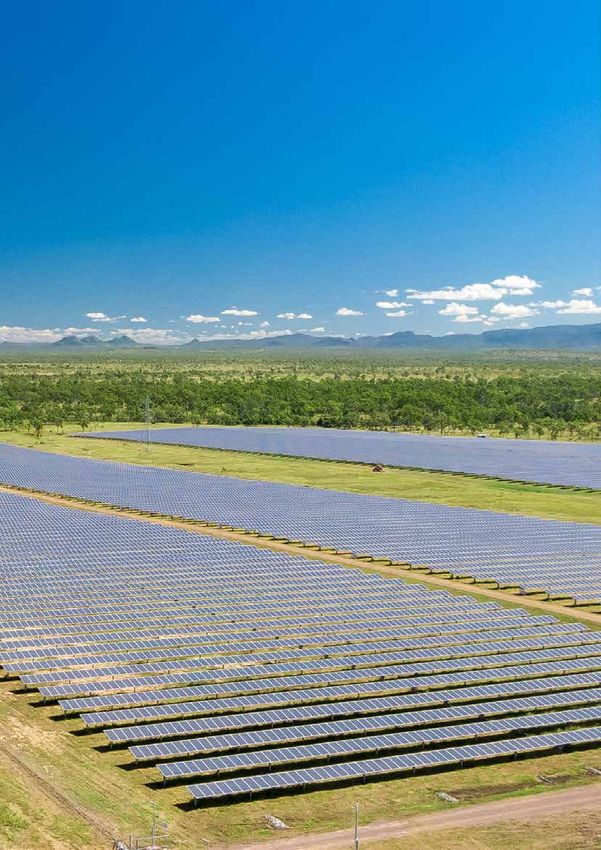
Adaptation Response
MONITOR
At localities where the coastal hazard risk profile is low (according to the Strategic Plan), the
adaptation response is to monitor risk and undertake existing maintenance/asset management
activities. If, over time, the risk profile is observed to increase (as indicated by local trigger levels),
then the adaptation response may shift to mitigate.
MITIGATE
At localities where coastal hazard risks have been identified the adaptation response is to actively
mitigate the risk through implementing a range of adaptation options. Mitigation will be tailored
to each locality, incorporating site-specific processes, community input, and statutory planning
considerations. If, over time, the risk profile is observed to increase (as indicated by local trigger
levels), and mitigation becomes infeasible (due to economic or other factors), then the adaptation
response may shift to transition.
TRANSITION
In some specific areas within a locality, if the coastal hazard risk profile is very high (according to the
Strategic Plan), and mitigation becomes infeasible (due to economic or other factors), a strategic
decision may be made to transition to an alternative land use. Transition is likely to be a gradual
process over time, where mitigating hazards for a period is part of the transition process.
MITIGATE
MONITOR TRANSITION
Actively mitigate the
Monitor the risk of risk of coastal hazards A strategic decision
coastal hazards. through a range of to transition to an
Monitor until local adaptation options. alternative land use in
trigger levels are Mitigate until local some areas. Mitigation
reached to initiate trigger levels are may be part of the
mitigation. reached to initiate transition process.
transition.
Adaption Options
Figure 7: Adaptation response for Council owned land and assets
R e s il i en t W h i t s u n day C oast St rat e gy Pag e 2 36.1 Regenerative Options
Regenerative adaptation options are solutions which aim to mimic natural processes and are typically
designed to “either improve or create existing coastal ecosystems and landforms [which] reduce the
risk of coastal hazards” (Griffith University Centre for Coastal Management and GHD 2012). The
regenerative options reviewed include beach nourishment, dune construction and regeneration,
riparian corridors restoration and generation, and mangrove forests.
6 .1.1 B e ac h N our ish m e n t
Beach nourishment is primarily used as a soft engineering approach in response to coastal erosion,
which involves the artificial addition of sand to a beach system that has a sediment deficit (Zhu,
Linham and Nicholls 2010). This nourishment of a beach helps to dissipate wave energy, and when
combined with dune regeneration, can provide protection from coastal recession and inundation from
storm surges.
Beach nourishment not only maintains the natural values and aesthetics of the beach and coastline
(Griffith University Centre for Coastal Management and GHD 2012) but also provides ecological
benefits such as restoring dune habitat, and creating nesting sites and spawning areas. For example,
the Ocean City Beach replenishment project (see Figure 3 and Figure 4) was initiated in 1988 to
prevent further erosion to the beaches, and required periodic replenishment of beach sand every
three years to maintain a stable beach profile (Van Ryswick 2016).
Beach nourishment is expensive and must be repeated periodically to maintain an adequate sand
profile. The current cost of beach nourishment is estimated to be between $55 - $80 per cubic metre.
These values were supplied by WRC who estimate it to cost $55 per cubic metre for Bowen and $80
per cubic metre for Airlie Beach for sourcing of sand from Don River, as well as delivery, spreading,
and sand pushing and scraping.
Depositing sand onto beaches can also cause a range of adverse environmental impacts including
burial of animals and organisms, increase in water turbidity, altered sediment compositions, and
disruption of beach and ocean habitats (Dean 2002).
Figure 8: Airlie Beach sand nourishment
Page 24 Wh it sun day Regi onal Counci l Coastal Hazard Adaptati on Str ategy ( C HAS) :6 .1.2 D un e C o n st r uc t ion an d R e g e ne r ati o n
Sand dunes are a naturally formed vegetation barrier which store sand deposits and provide stability
to the shoreline (CRD n.d.). Dune construction is when engineering solutions are used to create
artificial dunes which mimic the functioning of a natural dune system (Griffith University Centre for
Coastal Management and GHD 2012). Dune regeneration is the restoration of natural dunes to
improve their overall ecosystem function (Zhu, Linham and Nicholls 2010), whilst also reducing the
risk to coastal erosion and storm tide inundation.
The regeneration of sand dunes provides a range of coastal protection benefits including increased
stability of dunes, habitat for specialised plants and animals, shade for beach users, and wildlife
corridors (NCCARF 2016). For example, in Cronulla New South Wales, high foot traffic and damaged
dune vegetation had resulted in areas of exposed, unconsolidated sands which were highly
vulnerable to coastal erosion (see Figures 5 and 6). In 2015, regeneration works were commenced to
restore the affected sand dunes which included installing new barricade fencing and wind barriers as
well as revegetating the bare dunes with salt tolerant plants (Southern Habitat 2015).
Figure 10: Rose Bay dune restoration
The current costs for dune stabilisation can range from $5,800-$23,200 per hectare (Zhu, Linham
and Nicholls 2010).This includes the depositing sediment onshore, shaping of sand using bulldozer,
dune grass planting and fencing. In 2012, the dune restoration of Merimbula Beach cost a total of
$40,833 including a project officer (Office of Environment and Heritage 2012).
Since sand dunes also pose a barrier to beach access, reconstruction of dunes may receive
opposition from developers or the local community (Zhu, Linham and Nicholls 2010). In some cases,
it may be unfeasible to restrict public access to areas of a beach which are frequently used for
tourism and recreation.
Figure 11: Conway Bea sea wall built in 2020
R e s il i en t W h i t s u n day C oast St rat e gy Pag e 2 56 .1.3 R ipar ian C o r r id or s R e sto r ati o n a nd G e ne r ati o n
Riparian corridors are vegetated zones which run alongside wetlands, rivers, estuaries and
waterways (Land for Wildlife 2011). These systems are typically “comprised of vegetation (trees,
shrubs, grasses and herbs), soils and topography” which regulates ecological processes and
supports diverse biological communities (Beesley, et al. 2017). Restoration and generation
projects reinforce the healthy functioning of riparian zones, allowing them to provide protection
against rising sea levels and storm tide inundation (Zhu, Linham and Nicholls 2010).
Riparian corridors deliver a wide range of ecological and societal services including absorbing
incoming storm energy and high river flows, providing recreational opportunities, and encouraging
relaxation and connection with nature (Zhu, Linham and Nicholls 2010). For example, a large-
scale restoration project was commenced in 2015 to protect, enhance and expand riparian
vegetation along a section of the Maroochy River catchment (Sunshine Coast Council 2019). Over
a four-year period, approximately 4.2 ha of land was restored with 11,000 native plants, and 9 ha
rehabilitated through weed control and assisted regeneration techniques (see Figures 7 and 8).
Riparian corridor regeneration is generally expensive, and the costs can vary depending on the
extent and characteristics of vegetation to be restored (Griffith University Centre for Coastal
Management and GHD 2012). For this reason, community involvement is usually employed
to reduce costs. The success of revegetation is also dependent on careful planning to avoid
inappropriate selection of plant species and problems with stream stability (Land for Wildlife 2011).
There have been many riparian revegetation projects in the Whitsunday region over the last
25 years. It is estimated that between 200 and 250 small (6 .1.4 M an gr ov e F o r e st s
Mangrove forests are increasingly being used as a natural coastal defence system to protect
shorelines from coastal hazards (Spalding, et al. 2014). These natural systems bind and build up
soils to help prevent coastal erosion, reduce wave damage from storm surges, and can contribute to
sustaining land as sea levels rise.
A key benefit of mangroves forests over hard engineering structures is that they can adapt to
changes in climate and self-repair after a coastal erosion or storm tide inundation event (Morris, et
al. 2018). Mangroves also provide valuable resources (e.g. fish, timber) which can improve social
resilience by helping communities recover after a natural disaster.
For example, University of
Melbourne scientists are trailing
mangrove forests as natural
coastal defence structures to
protect the shoreline of Port Phillip
Bay. The project will use a ‘hybrid’
approach which “involves planting
the mangroves within concrete
cultivars that attenuate waves,
accrete sediment and provide the
right conditions for the forests to
grow” (Morris, et al. 2018) (see
Figure 9). Scientists believe these
mangroves forests will reduce
wave height and energy by
trapping sediment and increasing
Figure 14: Mangroves planted within concrete cultivars
the elevation of the land relative to
(Morris, et al. 2018)
sea level (Morris, et al. 2018).
Restoration of large areas of mangrove forest can be an expensive solution, with current costs
calculated to be approximately US$6,200 (AU$9,000) per hectare (Tran and Tinh 2013). This was
source from the Thi Nai Lagoon project which cost US$850,0005 to restore 150 ha of mangrove
forest. Natural coastal defence systems also require ongoing protection and management, and
without appropriate planning, mangrove forests may not achieve the desired level of protection for
the coastline (Morris, et al. 2018).
The Whitsunday Regional Council has not implemented any mangrove forest restoration works.
5 Labour costs are likely to be higher in Australia
Figure 15: Grays Bay sand bag wall
R e s il i en t W h i t s u n day C oast St rat e gy Pag e 2 76.2 Coastal Engineering Options
Coastal engineering adaptation options are hard engineering solutions which are constructed with the
primary purpose of protecting the shoreline from coastal erosion and storm tide inundation (Griffith
University Centre for Coastal Management and GHD 2012). Coastal engineering options reviewed
include artificial reefs, detached breakwaters, groynes and artificial headlands, sea dykes or levees
and seawalls.
6 .2.1 Ar t if ic ial R e e f s
Artificial reefs are submerged structures designed to reduce the force of breaking waves and
dissipate the energy which hits the beach (Cummings et al. 2012). They are typically constructed with
either sand filled geotextile bags or rock/concrete blocks which are transported offshore and dropped
at pre-determined locations based on design requirements (Griffith University Centre for Coastal
Management and GHD 2012). A well-engineered artificial reef can protect the shoreline from coastal
erosion, wave action and storm surges, whilst also promoting the growth of marine organism on
reef structures.
Artificial reefs also provide recreational benefits through the improvement in surfing conditions, and
creation of diving and snorkeling opportunities (Griffith University Centre for Coastal Management
and GHD 2012). For example, in the 1999 an artificial reef was constructed off the coast of
Narrowneck to protect the Gold Coast shoreline from coastal erosion (see Figure 10). The positioning
of 400 prefabricated geotextile bags into a split-V pattern has successfully reduced the velocity of
incoming waves and now accommodates a great abundance and diversity of marine species (Gold
Coast City Council 1999).
The design and construction costs of building an artificial reef can vary considerably depending on
the size and shape of the structure (Griffith University Centre for Coastal Management and GHD
2012). The Narrowneck artificial reef cost approximately $2.5 million in 2000 (Gold Coast City
Council 1999), however City of the Gold Coast is currently constructing an artificial reef in Palm
Beach, Gold Coast, which is estimated to cost $18.2 million (City of Gold Coast 2019).
Furthermore, a poorly managed artificial reef can cause damage to natural habitats through increase
visitation presence, overexploitation of the reef resources or introduction of invasive species (Fabi, et
al. 2015). Artificial reefs will require management costs to regulate such potential adverse impacts.
The Whitsunday Regional Council has not implemented any off-shore artificial reef projects.
6 .2.2 D e tac h e d B r e akwat e r s
Breakwaters are hard coastal structures which protect the shoreline from extreme wave energy and
minimise coastal erosion by modifying wave transmission to the beach (Cummings, et al. 2012).
Detached breakwaters are sloping walls which are constructed from rocks or concrete units and
detached from the coast, forming an offshore structure (Webb 2016).
Page 28 Wh it sun day Regi onal Counci l Coastal Hazard Adaptati on Str ategy ( C HAS) :Detached breakwater can
benefit a coastline by maximising
sediment transport patterns and
maintaining coastal stability.
Innovative ecological designs can
also be incorporated into these
hard engineering structures to
improve the functioning of coastal
ecosystems and increase the
diversity of aquatic habitats (New
York State 2016). For example,
living breakwaters were constructed
off the coast of Staten Island in
New York City using bio-enhancing
concrete, a geotextile seabed, reef
Figure 16: Inundation map, Wilson’s Beach
streets, reef ridges and oyster shell
gabions (see Figure 11).
Although breakwater require low maintenance, their construction costs are high with the current price
estimated between EUR$11,000 and EUR$58,000 per linear metre or around AU$19,000 - $94,000
per linear metre (Climate-ADAPT 2015b). This is consistent with the Living Breakwaters project which
cost around US$60 million (AU$86 million) to construct (New York State 2016).
The primary adverse impact of detached breakwaters that they reduce the longshore transport of
sand which has the potential to cause or significantly increase erosion on neighbouring stretches of
beach (Griffith University Centre for Coastal Management and GHD 2012). Additionally, breakwaters
may have a negative impact on the coastal landscape when they are designed to protrude above the
sea level (NCCARF 2016).
There are a number of rock breakwaters in the Whitsunday region associated with coastal marinas.
6 .2.3 Gr oyn e s an d Ar t if ic ial
Headlan d s
A groyne or artificial headland is a
coastal protection structure that is
built perpendicular to the shoreline
and extends from the shore, over
the beach and into the ocean
(Climate-ADAPT 2015a). Groynes
are designed to trap sand moving
along the coast which makes them
effective in controlling coastal
erosion and longshore drift (Zhu,
Linham and Nicholls 2010).
Their function increases the amount Figure 17: Geotextile groyne on Drummond Cove
of sand on to the updrift side of foreshore (City of Greater Geraldton 2019)
R e s il i en t W h i t s u n day C oast St rat e gy Pag e 2 9the groyne which helps stabilise beaches, provides public space for recreation and fishing, and
improves resilience of a beach against a coastal erosion event (Griffith University Centre for Coastal
Management and GHD 2012). For example, in 2018 the City of Greater Geraldton constructed two
low-crest 40m long groynes on the Drummond Cove Foreshore to reduce the impacts of coastal
erosion (City of Greater Geraldton 2019) (see Figure 12). These geotextile groynes have been
successful in retaining sand and reducing reliance on temporary sand nourishment operations
(Everything Geraldton 2019).
A small geotextile groyne such as the ones built for the Drummond Cove Foreshore project are
expected to cost around $3,100 per linear metre (City of Greater Geraldton 2019). However, costs
are highly influenced by the size of the groyne, the type and availability of material used and
transport rates. Groynes constructed from rock are more expensive and can start from around
EUR$3,400 which is equivalent to AU$5,600 per metre (Climate-ADAPT 2015b).
There are numerous side effects to constructing groynes including reduced aesthetics of the coastal
landscape, altered surfing conditions, restricted access to walking along the beach, and changes to
coastal ecosystems (NCCARF 2016).
6 .2.4 Se a Dyke s or L e v e e
A sea dyke is a coastal structure designed to “protect low-lying, coastal areas from inundation by the
sea under extreme conditions” (Zhu, Linham and Nicholls 2010). A sea dyke consists of a sand core,
a protective waterproof outer layer and a drainage channel (Page and Thorp 2010). Since sea dykes
are primarily used to control extreme water levels associated with storm tides and sea level risk, they
do not preserve beaches from the effects of coastal erosion (Zhu, Linham and Nicholls 2010). Sea
dykes may also be referred to as embankments, levees, floodbanks and stopbanks.
The main benefit of sea dykes is
they are often the cheapest hard
defence solution which means
they can provide a high degree
of protection in low-lying coastal
areas when the value of coastal
land is low (Griffith University
Centre for Coastal Management
and GHD 2012). For example, the
Scheveningen Boulevard is a curved
dike which has been integrated
with the esplanade to form a wave
design (see Figure 13), separating
the various uses of public space
and maximising public recreational
opportunities in the coastal zone Figure 18: 3D model of dike redevelopment in The Hague
(de Solà-Morales 2012). (de Solà-Morales 2012)
Page 30 Wh it sun day Regi onal Counci l Coastal Hazard Adaptati on Str ategy ( C HAS) :You can also read