The Environmental Implementation Review 2019 - LATVIA - European ...
←
→
Page content transcription
If your browser does not render page correctly, please read the page content below
© gettyimages, imantsu

                                                            LATVIA

                         The Environmental
                         Implementation
                         Review 2019

                         C O U N T R Y R E P O R T L AT V I A

                             Environment
EUROPEAN
                           COMMISSION

                                                    Brussels, 4.4.2019
                                                    SWD(2019) 124 final

                    COMMISSION STAFF WORKING DOCUMENT

                   The EU Environmental Implementation Review 2019
                              Country Report - LATVIA

                                Accompanying the document

     Communication from the Commission to the European Parliament, the Council, the
       European Economic and Social Committee and the Committee of the Regions

                      Environmental Implementation Review 2019:
            A Europe that protects its citizens and enhances their quality of life

         {COM(2019) 149 final} - {SWD(2019) 111 final} - {SWD(2019) 112 final} -
         {SWD(2019) 113 final} - {SWD(2019) 114 final} - {SWD(2019) 115 final} -
         {SWD(2019) 116 final} - {SWD(2019) 117 final} - {SWD(2019) 118 final} -
         {SWD(2019) 119 final} - {SWD(2019) 120 final} - {SWD(2019) 121 final} -
         {SWD(2019) 122 final} - {SWD(2019) 123 final} - {SWD(2019) 125 final} -
         {SWD(2019) 126 final} - {SWD(2019) 127 final} - {SWD(2019) 128 final} -
         {SWD(2019) 129 final} - {SWD(2019) 130 final} - {SWD(2019) 131 final} -
         {SWD(2019) 132 final} - {SWD(2019) 133 final} - {SWD(2019) 134 final} -
         {SWD(2019) 135 final} - {SWD(2019) 136 final} - {SWD(2019) 137 final} -
                    {SWD(2019) 138 final} - {SWD(2019) 139 final}

EN                                                                                    EN
This report has been written by the staff of the Directorate-General for Environment, European Commission.
Comments are welcome, please send them to ENV-EIR@ec.europa.eu

More information on the European Union is available at http://europa.eu.

Photographs: p. 7 — ©iStock/imantsu; p. 10 — ©gettyimages/imantsu; p. 10 — ©iStock/Baltskars; p. 15 —
©/iStock/eugenesergeev; p. 20 — ©iStock/imantsu
For reproduction or use of these photos, permission must be sought directly from the copyright holder.

©European Union, 2019
Reproduction is authorised provided the source is acknowledged

                                                       1
Table of Contents

EXECUTIVE SUMMARY ................................................................................................................................... 3
PART I: THEMATIC AREAS .............................................................................................................................. 4
1.      TURNING THE EU INTO A CIRCULAR, RESOURCE-EFFICIENT, GREEN AND COMPETITIVE LOW-
        CARBON ECONOMY .............................................................................................................................. 4
        Measures towards a circular economy ................................................................................................. 4
        Waste management .............................................................................................................................. 6
        Climate change ...................................................................................................................................... 8
2.      PROTECTING, CONSERVING AND ENHANCING NATURAL CAPITAL .................................................. 10
        Nature and biodiversity ....................................................................................................................... 10
        Maintaining and restoring ecosystems and their services .................................................................. 10
        Estimating natural capital ................................................................................................................... 11
        Invasive alien species .......................................................................................................................... 12
        Soil protection ..................................................................................................................................... 12
        Marine protection ............................................................................................................................... 13
3.      ENSURING CITIZENS' HEALTH AND QUALITY OF LIFE ........................................................................ 15
        Air quality ............................................................................................................................................ 15
        Industrial emissions ............................................................................................................................. 16
        Noise ................................................................................................................................................. 17
        Water quality and management ......................................................................................................... 17
        Chemicals ............................................................................................................................................ 19
        Making cities more sustainable ........................................................................................................... 20
PART II: ENABLING FRAMEWORK: IMPLEMENTATION TOOLS ................................................................... 22
4.      GREEN TAXATION, GREEN PUBLIC PROCUREMENT, ENVIRONMENTAL FUNDING AND
        INVESTMENTS ..................................................................................................................................... 22
        Green taxation and environmentally harmful subsidies ..................................................................... 22
        Green public procurement .................................................................................................................. 23
        Environmental funding and investments ............................................................................................ 23
5.      STRENGTHENING ENVIRONMENTAL GOVERNANCE ......................................................................... 27
        Information, public participation and access to justice ...................................................................... 27
        Compliance assurance ......................................................................................................................... 29
        Effectiveness of environmental administrations................................................................................. 30
        International agreements ................................................................................................................... 31
        Sustainable development and the implementation of the UN SDGs .................................................. 32

                                                                                      2
Environmental Implementation Review 2019 – Latvia
Executive summary
Latvia and the Environmental Implementation Review Latvia aims to maintain a good level of environmental
(EIR) protection, particularly for air and water quality. It scores
well on the quality of its bathing waters, 91.1 % of which
In the 2017 EIR report, the main challenges identified for
were of excellent quality in 2017. However, for the vast
Latvia for the implementation of EU environmental policy
majority of rivers and lakes the ecological status or
and law were:
potential as set out in the Water Framework Directive is
to improve waste management, particularly less than good.
increasing recycling, rolling out separate collection
Latvia is making further progress in complying with the
and reducing landfilling;
EU Urban Waste Water Treatment rules. However, there
to reduce resource intensity, which would lessen the
is an on-going infringement procedure against Latvia as it
exposure of Latvian businesses to rising resource
still does not ensure that waste water is collected and
costs.
treated in accordance with the Directive in 15 larger
Latvia organised an EIR national dialogue in December agglomerations.
2017, with particular focus on waste management.
Examples of good practice
In 2017 the Commission launched the TAIEX-EIR Peer-to-
Two projects in Latvia are outlined as best practices
Peer (EIR P2P) tool to facilitate peer-to-peer learning
and showcases. These are: (i) the LIFE Nature project
between experts from environmental authorities. Latvia
‘Protection and management of coastal habitats in
participated in an EIR P2P workshop on the exchange of
Latvia’; (ii) protected green infrastructure and water
knowledge and experience of effective measures and
bodies in the Zemgale Region and northern
good practices to reduce emissions from domestic
Lithuania.
heating.
Latvia grants the public, particularly individuals and
Progress on meeting challenges since the 2017 EIR NGOs, very broad access to justice in environmental
cases. It has well-developed legislation on access to
Waste management remains a challenge for Latvia,
information and public participation. The action plan
particularly in terms of not being able to divert waste
on open government partnership and the work of
from landfilling. According to the Commission’s ‘Early
the Environmental Consultancy Board are good
Warning Report’ (2018), Latvia remains at risk of not
examples of how these rights are being put into
attaining the 2020 municipal waste recycling target and
practice.
of not meeting the 2020 landfill diversion target for
biodegradable waste.
The circular (secondary) use of material in Latvia was
well below the EU-28 average in 2016. However, the
country performs above the EU-28 average in terms of
how many people are employed in the circular economy.
The proportion of SMEs that have taken resource-
efficiency measures is below the EU average, even
though the proportion of SMEs that have benefited from
public support measures for the production of green
products is well above the average. Latvia ranks rather
low on eco-innovation, despite it being the 5th fastest
growing innovator.
Latvia has a relatively high density of green
infrastructure natural areas compared to other EU
Member States. Latvia currently expects to implement
further plans and activities directly relating to green
infrastructure, e.g. flood management in cities and
Natura 2000 development. Latvia has pioneered a MAES
(mapping and assessment of ecosystems and their
services) assessment for its marine waters. This confirms
the substantial progress Latvia has made since January
2016 on implementing MAES.
3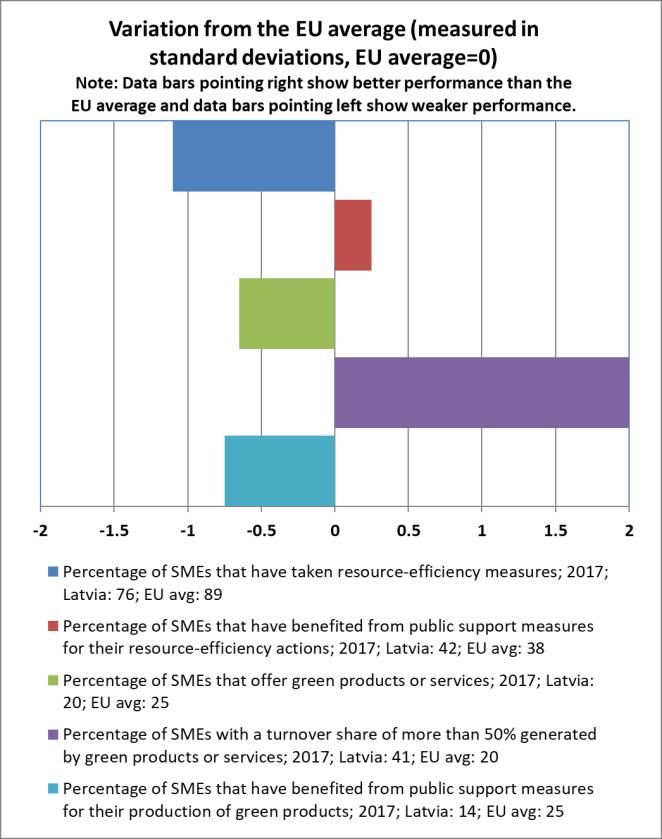
Environmental Implementation Review 2019 – Latvia
                                                        Part I: Thematic areas

                            1. Turning the EU into a circular, resource-efficient, green and
                                            competitive low-carbon economy

                                                                                           5
                                                                             2.04 EUR/kg . Figure 1 shows that Latvia’s resource
Measures towards a circular economy                                          productivity has not improved since 2010.
The Circular Economy Action Plan emphasises the need                         Figure 1: Resource productivity 2010-2017
                                                                                                                                 6

to move towards a life-cycle-driven ‘circular’ economy,
reusing resources as much as possible and bringing
residual waste close to zero. This can be facilitated by
developing and providing access to innovative financial
instruments and funding for eco-innovation.

Following the adoption of the Circular Economy Action
Plan in 2015 and the setting up of a related stakeholder
platform in 2017, the European Commission adopted a
                                                        1
new package of deliverables in January 2018 . This
included additional initiatives such as: (i) an EU strategy
for plastics; (ii) a Communication on how to address the
interplay between chemical, product and waste
legislation; (iii) a report on critical raw materials; and (iv)
a framework to monitor progress towards a circular                           Targeted policy documents on the circular economy are
          2
economy .                                                                    in the early stages of development and are undergoing
                                                                                                7
                                                                             academic research . The report on the necessity of and
Based on the 10 indicators in the circular economy
                                                                             opportunities for transitioning towards a circular
monitoring framework, Latvia was well below the EU
                                                                             economy in Latvia is a first step towards a more
average for circular (secondary) use of material, scoring
                                                                             comprehensive circular economy policy in the country.
3.9 % in 2016 (EU average 11.7 %). Despite this, it did
post an increase compared with previous years. In                            In December 2017, the Ministry of Agriculture adopted
contrast, Latvia performs above the EU-28 average for                        the 2030 Latvian bioeconomy strategy. Ministries have
the number of people employed in the circular economy                        been asked by the government to take the strategy’s
(2.89 % of total employment in 2016, EU-28 average                           fields of action into account when revising and
1.73 %).                                                                     developing policy planning documents.
In the 2017 Special Eurobarometer 468 on attitudes of                        The need to educate businesses on the circular economy
EU citizens towards the environment, 89 % of Latvian                         has received some attention in Latvia, most notably
people said they were concerned about the effects of                         through the organisation of an international conference
                                                                                                            8
plastic products on the environment (EU-28 average                           on the subject in Riga in 2016. .
87 %). 90 % said they were worried about the impact of
                                          3                                  Latvia has also signed a 2018-2021 cooperation
chemicals, in line with the EU-28 average . In addition,
                                                                             programme with Flanders (Belgium), which also covers
89 % of Latvian people support greater EU investment in
                                                                             the circular economy. As for EU Ecolabel products and
environmental protection (EU-28 average 85 %).
                                          4
Latvia’s resource productivity         (how efficiently
the economy uses material resources to produce wealth),
in terms of value produced per kg of resources used was
                                                                             5
0.51 EUR/kg in 2017. This is far below the EU average of                       Eurostat, Resource productivity.
                                                                             6
                                                                               Eurostat, Resource productivity.
                                                                             7
                                                                               Tambovceva, T., Atstāja, D., Dimante, D. Development of Circular
1
  European Commission, 2018 Circular Economy Package.                        Economy – a Case Study of Latvia. No: 12th Conference of the European
2
  COM(2018) 029.                                                             Society for Ecological Economics: Programme & Abstract Book, Ungārija,
3
  European Commission, 2017, Special 486 Eurobarometer, ‘Attitudes of        Budapest, 20.-23. jūnijs, 2017. Budapest: Corvinus University of
European citizens towards the environment’.                                  Budapest, 2017, p. 466.-467.
4                                                                            8
  Resource productivity is defined as the ratio between gross domestic         Development of Business Education for Circular Economy in Latvia in
product (GDP) and domestic material consumption (DMC).                       New Challenges of Economic and Business Development, May 2016.

                                                                         4
Environmental Implementation Review 2019 – Latvia
                                  9
EMAS-licensed organisations , as of September 2018                        intentions to invest in resource efficiency were about the
Latvia had only 15 products and 4 licences registered in                  same as in 2015, similar to the EU average. A notable
the EU Ecolabel scheme out of a total of 71 707 products                  exception is minimising waste and increasing recycling
                               10
and 2167 licences in the EU . Moreover, Latvia and                        inside the company, for which awareness is significantly
                                  11
Croatia are the only EU countries with no organisations                   below the EU average.
registered on EMAS. However, the ISO 14001
                                                                          Only 7 % of Latvian companies relied on external support
environmental management system has gained
                                                                          in their efforts to be more resource efficient, compared
popularity in Latvia. The number of certificates has
                                             12                           to an EU average of 22 % covering a range of 3 % to 38 %.
steadily grown from 90 in 2005 to 373 in 2017 .
                                                                          42 % of Latvian companies collaborated with business
                                                                          associations.
SMEs and resource efficiency
                                                                          Of the Latvian companies surveyed, 33 % did not identify
Latvian SMEs score in line with the EU average on
                                                                          any form of external assistance as useful in helping them
environmental issues, as shown in Figure 2. A below-
                                                                          become resource efficient. Less importance is assigned to
average proportion of SMEs in Latvia have taken
                                                                          assistance on better cooperation among companies along
resource-efficiency measures and offer green products or
                                                                          value chains (11 %).
services. Conversely, Latvia has a far above average
percentage of SMEs which have a turn-over of more than                    There is potential to raise awareness and ambition
50% generated by green products or services.                              among SMEs in Latvia about becoming more resource
                                                      13                  efficient. Many SMEs have already recognised the
Figure 2: Environmental performance of SMEs
                                                                          potential of the market for green products and services.
                                                                          The challenge is to reach out to the more mainstream
                                                                          businesses.

                                                                          Eco-innovation
                                                                          In 2018, Latvia ranked 24th on the European Innovation
                                                                          Scoreboard 2018, being the 5th fastest growing innovator
                                                                                                        15
                                                                          (11.6 % increase since 2010 ). However, the country’s
                                                                          overall position on the 2017 Eco-innovation index has
                                                                          declined (see Figure 3), and continues to be below the EU
                                                                                                  nd
                                                                          average. It ranks the 22 . (see Figure 4).
                                                                          Figure 3: Latvia’s eco-innovation performance

                                                                          The main impetus for eco-innovation and the circular
                                                                          economy in Latvia continues to come from the energy
                                                                          and resource-efficiency targets of the EU’s Europe 2020
                                                                          strategy. Investments in bioeconomy, smart materials,
The 2018 Eurobarometer on ‘SMEs, resource efficiency                      sustainable energy solutions and research are a high
                 14                                                                                                         16
and green markets ’ showed that Latvian companies’                        priority in Latvia’s smart specialisation strategy .

9                                                                         14
  EMAS is the European Commission’s Eco-Management and Audit                 Flash Eurobarometer 456 ‘SME, resource efficiency and green
Scheme – a programme to encourage organisations to behave in a more       markets’ January 2018. The 8 dimensions were Save energy; Minimise
environmentally sustainable way                                           waste; Save materials; Save Water; Recycle by reusing material
10
   European Commission, Ecolabel Facts and Figures.                       internally; Design products easier to maintain, repair or reuse; Use
11
   As of May 2018. European Commission, Eco-Management and Audit          renewable energy; Sell scrap materials to another company.
                                                                          15
Scheme.                                                                      European Commission, European innovation Scoreboard 2018.
12                                                                        16
   ISO Survey of certifications to management system standards.              Smart specialisation strategies were introduced as a way to increase
13
   European Commission, 2017-SBA factsheet: Latvia.                       efficiency in research and innovation investments by integrating policy

                                                                      5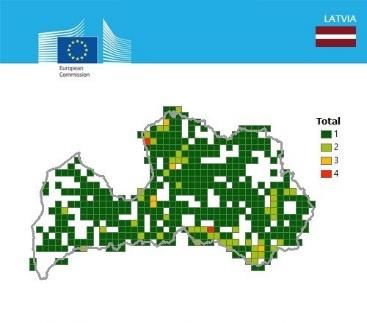
Environmental Implementation Review 2019 – Latvia
17
Figure 4: 2017 Eco-innovation index (EU=100) 2019 priority action
Develop a more coherent circular economy policy
framework.
Waste management
Turning waste into a resource is supported by:
(i) fully implementing EU waste legislation, which
includes the waste hierarchy, the need to ensure
separate collection of waste, the landfill diversion
targets, etc.;
(ii) reducing waste generation and waste generation per
capita in absolute terms; and
(iii) limiting energy recovery to non-recyclable materials
and phasing out landfilling of recyclable or recoverable
waste.
This section focuses on management of municipal
waste19 for which EU law sets mandatory recycling
20
targets. .
Municipal waste generated in Latvia amounted to
410 kg/y/inhabitant in 2016. This was below the EU
Assistance from the EEA/Norway Grants has also
average of 486 kg/y/inhabitant, but since 2012 the figure
provided a very significant boost for eco-innovation in 21
has been following a steep upward trend .
Latvia, as has the availability of natural resources such as
forests, water and soil. However, overall developments in Figure 5 depicts municipal waste by treatment in Latvia in
eco-innovation in Latvia are taking place in individual kg per capita. In 2016, disposal by landfilling (the least
businesses and organisations rather than system-wide. preferred treatment in the waste hierarchy) remains the
main treatment option for municipal waste, with Latvia
Businesses’ relative lack of willingness and capacity to
landfilling 64 % of municipal waste, compared with the
innovate can still be considered as factors hampering
EU average of 24 %. While the landfilling rate
eco-innovation. Lack of understanding about the
continuously decreased since 2012, it increased by 2 %
processes of eco-innovation is also a barrier.
from 2015. Since 2014 Latvia has increased its
Furthermore, there is a lack of a targeted national policy
composting rate from 6 % to 10 % (EU average 17 % in
framework in Latvia and fragmented support landscape.
2016), but material recycling remains at the very low
The venture capital market has recognised the potential level of 10 %.
of eco-innovation. The Ministry of Education and Science
Figure 6 depicts recycling rates for municipal waste.
has identified topics such as energy efficiency,
While the decrease in the recycling rate in 2016 seems to
sustainable transport and the knowledge-based bio
be influenced by improvements in waste data collection,
economy as priority science sectors for the 2018-2021
Latvia’s recycling performance is very weak. As a result,
period.
Latvia was listed in the Commission’s ‘Early Warning
22
Research prioritisation and investment in these fields is report’ among the countries at risk of not attaining the
beginning to deliver results. Circular economy and eco- 2020 municipal waste recycling target. Latvia is also at
innovation areas are also well covered by clusters such as risk of not meeting the 2020 landfill diversion target for
the Smart City Cluster of Latvia, the Life Science Cluster biodegradable waste (a 75 % reduction from 1995 levels)
of Latvia, the Green Tech Cluster and the Cleantech and is lagging behind its 2013 target of 50 % reduction
18
Cluster .
19
Municipal waste consists of mixed waste and separately collected
waste from households and from other sources, where such waste is
similar in nature and composition to waste from households. This is
without prejudice to the allocation of responsibilities for waste
management between public and private sectors.
20
areas - between regions, sectors and levels. These strategies have to be See Article 11.2 of Directive 2008/98/EC. This Directive was amended
developed by Member States or regions to receive cohesion funding. in 2018 by Directive (EU) 2018/851, and more ambitious recycling
17
European Commission, Eco-innovation Observatory: Eco-Innovation targets were introduced for the period up to 2035.
21
scoreboard 2017. European Commission, Eurostat, Municipal waste and treatment, by
18
European Commission, Eco-Innovation Observatory: Eco-innovation type of treatment method.
22
Country Profiles 2016-2017. COM(2018) 656 and SWD(2018)420.
6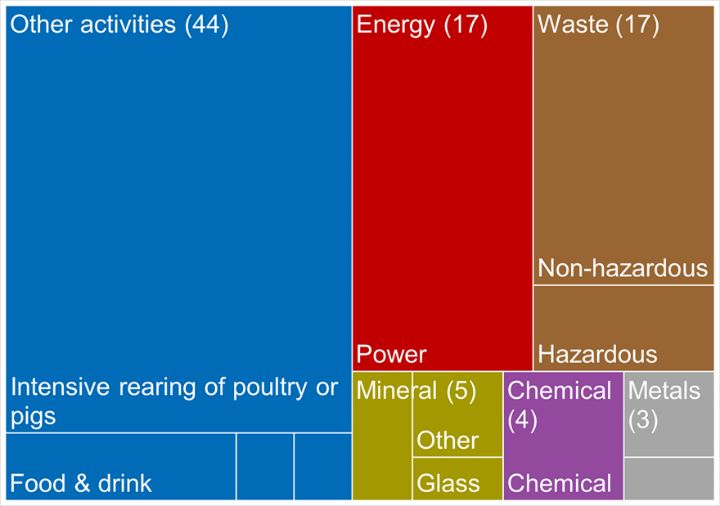
Environmental Implementation Review 2019 – Latvia
(by 2015 Latvia had reduced the amounts of such waste                        However, there is no clear vision on how to encourage
                          23
going to landfills by 32 % ).                                                people living in apartment blocks to separate waste at
                                                                             home.
Figure 5: Municipal waste by treatment in Latvia 2009-
     24
2016                                                                         Starting from 2021 there will be mandatory separate
                                                                             collection of bio-waste part of municipal waste, which
                                                                             makes up almost half of municipal waste generated. Until
                                                                             then it remains voluntary, but it is being incentivised
                                                                             through EU funds.

To help bridge the implementation gap in Latvia, the                         The focus so far has been on MBT (mechanical biological
                                 25
Commission’s early warning report recommended a set                          treatment) technology which, apart from stabilising and
of detailed priority actions.                                                diverting small amounts of biodegradable waste from
                                                                    26
                                                                             landfills, does very little to contribute towards recycling
Figure 6: Recycling rate of municipal waste 2009-2016                        performance.
                                                                             The Law on Natural Resource Tax foresees a gradual
                                                                             increase of the landfill tax from 20 EUR/tonne in 2017 to
                                                                             50 EUR/t in 2020. As this tax will generate more
                                                                             revenues, it is important that these are channelled
                                                                             towards measures to improve waste management in line
                                                                             with the waste hierarchy. In addition, to make recycling
                                                                             economically viable and support implementation of the
                                                                             waste hierarchy, a tax on treatment of residual waste
                                                                             (e.g. via MBT) should be introduced albeit at a lower level
                                                                             than the landfill tax.
                                                                             Data collection has improved somewhat in the past few
                                                                             years. All packaging data are now included in the
                                                                             reported municipal waste data and this largely explains
                                                                             the increase in the recycling rates since 2012. However,
                                                                             significant shortcomings in data collection remain and
                                                                             need to be urgently addressed.
Separate collection at source of dry recyclables relies on                   The extended producer responsibility scheme for
systems that for now contribute insufficiently to Latvia’s                   packaging operates on a competitive basis. While the
recycling performance. Recently adopted minimum                              scheme covers a large amount of the packaging put on
requirements for municipalities to ensure adequate                           the market, more coordination is needed in collection
density of separate collection bring sites and collection                    and infrastructure to make it more cost-efficient and to
points for household waste could improve the situation.                      make the schemes cover all the costs of collection and
                                                                             treatment of packaging waste. Latvia is working towards
23
   Latvian report on the transposition and implementation of Directive       setting up a mandatory deposit system for beverage
99/31/EC on the landfill of waste for 2013-2015.                             packaging.
24
   European Commission, Eurostat, Municipal waste by waste
operations.                                                                  Despite the shorter term recommendations set out in the
25
   Adopted 24.9.2018.                                                        early warning report even more effort will be necessary
26
   European Commission, Eurostat, Recycling rate of municipal waste.

                                                                         7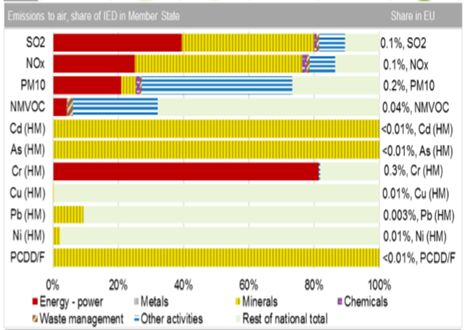
Environmental Implementation Review 2019 – Latvia
to comply with the recycling targets set for the post-2020 For emissions not covered by the EU ETS, Member States
27
period . have binding national targets under the Effort Sharing
legislation. Latvia had lower emissions than its annual
Waste management was the main topic of discussion at
targets in each of the years 2013-2017. For 2020, Latvia's
the EIR national dialogue with Latvia in December 2017.
national target under the EU Effort Sharing Decision is to
2019 priority actions avoid increasing emissions by more than 17 % compared
to 2005. For 2030, Latvia's national target under the
Implement the landfill tax increase as planned to Effort Sharing Regulation will be to reduce emissions by 6
phase out landfilling of recyclable and recoverable % compared to 2005.
waste. Channel those revenues towards measures to
improve waste management in line with the waste Figure 7: Change in total greenhouse gas emissions
29
hierarchy. 1990-2017 (1990=100%) .
Improve and extend separate collection of waste,
including for bio-waste. Review and / or harmonise
minimum service standards for separate collection
(e.g. frequency of collections, types of containers etc.)
in municipalities to ensure high capture rates of
recyclable waste.
Use economic instruments such as ‘pay as you throw’,
and set mandatory recycling targets for municipalities
with measures to tackle non-compliance (e.g. fines).
Develop and run implementation support
programmes for municipalities to help support efforts
to organise separate collection and improve recycling
performance.
Improve the functioning of extended producer
responsibility systems, in line with the general
28
minimum requirements on EPR .
Climate change The Sustainable Development Strategy of Latvia until
2030 sets a 55% greenhouse gas emissions reduction
The EU has committed to undertaking ambitious climate target compared to 1990 levels.
action internationally as well as in the EU, having ratified
the Paris Climate Agreement on 5 October 2016. The EU Transport represents almost a quarter of Europe's
targets are to reduce greenhouse gas (GHG) emissions by greenhouse gas emissions and is the main cause of air
20 % by 2020 and by at least 40 % by 2030, compared to pollution in cities. In 2016, total GHG emissions in the
1990. As a long-term target, the EU aims to reduce its transport sector, compared to 1990 level, have increased
emissions by 80-95 % by 2050, as part of the efforts by 5.1% but have been decreased by 0.5% compared to
required by developed countries as a group. Adapting to 2015. The last 3 years, from 2013 to 2016, transport
the adverse effects of climate change is vital to alleviate emissions increased by 10 %.
its already visible effects and improve preparedness for The F-gas Regulation requires Member States to run
and resilience to future impacts. training and certification programmes, introduce rules for
penalties and notify these measures to the Commission
The EU emissions trading system (EU ETS) covers all large by 2017. Latvia has notified both measures.
greenhouse gas emitters in the industry, power and
aviation sectors in the EU. The EU ETS applies in all The accounting of GHG emissions and removals from
Member States and has a very high compliance rate. Each forests and agriculture is governed by the Kyoto Protocol.
year, installations cover around 99 % of their emissions A Preliminary accounting for 2013-2016 depicts net
with the required number of allowances. debits of, on average, 1.4 Mt CO2-eq per year, which
corresponds to a negative contribution of -1.2% of the
EU-28 accounted sink of -115.7 Mt CO2-eq. Latvia is one
27
Directive (EU) 2018/851, Directive (EU) 2018/852, Directive (EU)
29
2018/850 and Directive (EU) 2018/849 amend the previous waste Annual European Union greenhouse gas inventory 1990–2016 (EEA
legislation set more ambitious recycling targets for the period up to greenhouse gas data viewer). Proxy GHG emission estimates for
2035. These targets will be taken into consideration to assess progress 2017Approximated EU greenhouse gas inventory 2017 (European
in future Environmental Implementation Reports. Environment Agency). Member States national projections, reviewed by
28
Directive (EU) 2018/851. the European Environment Agency.
8Environmental Implementation Review 2019 – Latvia
of six EU Member States which show net debits in this were over EUR 63 million. National legislation - The Law
preliminary accounting exercise. on Pollution, prescribes that revenues derived from the
auctions of EU emission allowances must be spent for
Figure 8: Targets and emissions for Latvia under the
30 climate-related measures, therefore in 2016 new
Effort Sharing Decision and Effort Sharing Regulation .
national green investment scheme for tackling global
climate change, supporting adaptation to the
consequences of climate change and reducing
greenhouse gas emissions has been established. Four
calls for projects have been organized since 2016 with
overall co-funding in amount of 50 MEUR. All unspent
revenues from the auctions of allowances from previous
years are accumulated and earmarked for climate
change-related open tenders for projects and measures
in upcoming years.
Figure 9: Greenhouse gas emissions by sector (Mt. CO2-
32
eq.). Historical data 1990-2016 Projections 2017-2030 .
The EU Strategy on adaptation to climate change,
adopted in 2013, aims to make Europe more climate-
resilient, by promoting action by Member States, better-
informed decision making, and promoting adaptation in
key vulnerable sectors. By adopting a coherent approach
and providing for improved coordination, it seeks to
enhance the preparedness and capacity of all governance
levels to respond to the impacts of climate change. While
in 2013 only 15 Member States had an adaptation
strategy, today all but three have adopted one, with the
three remaining Member States actively working on it. In
2016, the Commission launched an evaluation of this
strategy. The evaluation examines the actual 2019 priority action
implementation and the achievement of the objectives of
the strategy. The evaluation is currently underway, with In this report, no priority actions have been included on
findings to be published in autumn 2018. climate action, as the Commission will first need to assess
the draft national energy and climate plans which the
Latvia is expected to finalise its National Adaptation Member States needed to send by end of 2018. These
Strategy (NAS) to climate change up to 2030 in early plans should increase the consistency between energy
2019. Climate change risk and vulnerability assessments, and climate policies and could therefore become a good
cost-benefit and cost-effectiveness assessments for example of how to link sector-specific policies on other
adaptation measures were developed in 2017 for the interlinked themes such as agriculture-nature-water and
most vulnerable sectors, which include biodiversity and transport-air-health.
ecosystem services, forestry and agriculture, tourism and
landscape planning, health and welfare, building and
infrastructure planning, civil protection and emergency
planning. The draft NAS includes an adaptation
monitoring, reporting and evaluation system with 18
adaptation indicators and 24 climate change parameters.
The total revenues from the auctioning of emission
31
allowances under the EU ETS over the years 2013-2017
30 32
Proxy GHG emission estimates for 2017Approximated EU greenhouse Annual European Union greenhouse gas inventory 1990–2016 (EEA
gas inventory 2017 (European Environment Agency). Member States greenhouse gas data viewer). Proxy GHG emission estimates for
national projections, reviewed by the European Environment Agency. 2017Approximated EU greenhouse gas inventory 2017 (European
31
Auctions of allowances for the EU ETS 3rd period started in 13 Environment Agency). Member States national projections, reviewed by
November, 2012. the European Environment Agency.
9Environmental Implementation Review 2019 – Latvia
2. Protecting, conserving and enhancing natural capital
pressures of high impact. Latvia elaborates guidelines for
Nature and biodiversity setting conservation objectives to get better acceptance.
The EU biodiversity strategy aims to halt the loss of
biodiversity in the EU by 2020. It requires full Progress in maintaining or restoring favourable
implementation of the Birds and Habitats Directives to conservation status of species and habitats
achieve favourable conservation status of protected Member States report every 6 years on the progress
species and habitats. It also requires that the agricultural made under the Birds and Habitats Directives. As a result,
and forest sectors help to maintain and improve no new information is available on the state of natural
biodiversity. habitats and species in Latvia or on progress to improve
the conservation status of species and habitats, as
Biodiversity strategy compared to the 2017 EIR Latvia country report.
Latvia’s environmental policy concept (EPC) for 2014-
33
2020 covers biodiversity protection issues linked to the
implementation of the goals and objectives of the
34
Convention on Biological Diversity.
Overall, it is acknowledged that improvements in the
status of species and habitats have recently been
reported in Latvia.
Setting up a coherent network of Natura 2000 sites 2019 priority actions
The situation has not changed since the 2017 EIR. Complete the special areas of conservation (SAC)
designation process and put in place clearly defined
Designating Natura 2000 sites and setting conservation conservation objectives and the necessary
objectives and measures conservation measures for sites.
New data on the conservation status of habitats and Improve incentives for foresters and farmers to
species will be available for the next EIR. The results from better protect forest and grassland habitat. Ensure
Latvia’s last report under Article 12 of the Birds Directive sustainable forest management and efficient use of
show that short-term trends of breeding birds are biomass.
improving for 19 % of species and are stable for 22 %, but
are decreasing for 12 % of species. The same categories Maintaining and restoring ecosystems and
for long-term trends are 47 %, 18 % and 25 %. Although their services
data under Article 12 do not provide pressure
information for all bird species, Latvia reports that The EU biodiversity strategy aims to maintain and restore
climate change, biological resource use other than ecosystems and their services by including green
agriculture & forestry and sylviculture and forestry are infrastructure in spatial planning and restoring at least
15 % of degraded ecosystems by 2020. The EU green
infrastructure strategy promotes the incorporation of
green infrastructure into related plans and programmes.
33
Latvian Cabinet of Ministers, Environ.
34
THE EPC does not directly address implementation of target 2 of the
EU Biodiversity Strategy.
10Environmental Implementation Review 2019 – Latvia
40
The EU has provided guidance on the further deployment of the green infrastructure strategy review report ; and
35
of green and blue infrastructure in Latvia and a country (iii) make full use of the EU guidance on a strategic
page on the Biodiversity Information System for Europe framework for further supporting the deployment of EU-
36
(BISE) . This information will also contribute to the final level green and blue infrastructure. It is also invited to
evaluation of the EU Biodiversity Strategy to 2020. provide regular updates on its green infrastructure-
37 related developments via its country page on the
Latvia’s 2014-2020 national development plan includes 41
Biodiversity Information System for Europe BISE . This
green infrastructure targets such as increasing the
information will also contribute to the final evaluation of
organic farming area, increasing forest coverage,
the EU biodiversity strategy to 2020, which will be
promoting the sustainable use and biodiversity of land
communicated to the Council and Parliament in 2020.
and other natural resources and species conservation
measures. Latvia’s sustainable development strategy Latvia is invited to provide information about: (i) progress
38
covering the period until 2030 also mentions green on a restoration prioritisation framework as referred to
corridors within the urban transport network. The in Action 6a of the EU biodiversity strategy; (ii) or other
strategy states that the government should introduce a strategic approaches to restoration; and (iii) any
plan to preserve and restore natural capital at state level. information on practical implementation. As part of the
This would also include spatial planning of nature LIFE+ project Nat-Programme, Latvia has established
preservation and restoration. restoration priorities for habitats of community interest
42
within its Natura 2000 sites .
Several LIFE projects in Latvia put in place green
infrastructure. Examples of these are the projects to
restore bittern habitats and protect coastal habitats. Estimating natural capital
Green infrastructure has also been incorporated into The EU biodiversity strategy calls on Member States to
Riga’s 2014-2020 development programme and green map and assess the state of ecosystems and their
infrastructure initiatives have been implemented in the 43
services in their national territories by 2014, assess the
city of Liepāja. In 2018, the Latvia-Lithuania cross border economic value of such services and integrate these
co-operation project “Enhancement of Green values into accounting and reporting systems at EU and
Infrastructure in the Landscape of Lowland Rivers national level by 2020.
39
(ENGRAVE) was launched. Lead by Zemgale planning
region, it will provide methodological guidelines on green Latvia has pioneered a MAES assessment for its marine
infrastructure and landscape planning and test it at four waters, including internal marine waters, territorial
case study areas. waters and exclusive economic zone. The assessment
However, further information is needed on the was performed in 2016 as one of the steps for
incorporation of green infrastructure in sector-specific implementing an ecosystem-based approach in
policy areas and in spatial planning. Challenges include development of the national maritime spatial plan.
the lack of awareness of green infrastructure in general Latvia continues to be involved in two LIFE projects which
and the lack of a national strategy in this area. A are relevant for MAES. The LIFE Viva Grass44 project aims
mechanism for coordination between different sectors is to demonstrate opportunities for the multifunctional use
needed, as well as capacity building and training of of grasslands as a basis for strengthening the
relevant stakeholders and development of an incentives sustainability of rural areas and as a stimulus for local
system and instruments for green infrastructure economies. LIFE Ecosystem services is about mapping
development. ecosystems and carrying out an economic evaluation of
45
Latvia is encouraged to: (i) continue its efforts in the identified services in a number of pilot areas .
deploying green and blue infrastructure and In 2017 Latvia also started the biophysical mapping of
incorporating them across other policies consistent with habitats of EU importance. The aim is to set the baseline
the MAES framework; (ii) consider the recommendations information on the extent, areas and quality of the
habitat types listed in the Habitats Directive and present
40
The recommendations of the green infrastructure strategy review
35
The recommendations of the green infrastructure strategy review report
41
report and the EU Guidance on a strategic framework for further Biodiversity information system for Europe, Green Infrastructure in
supporting the deployment of EU-level green and blue infrastructure. Latvia.
36 42
Biodiversity Information System for Europe. National Conservation and Management Programme for Natura 2000
37
Cross-Sectoral Coordination Centre, National Development Plan of sites in Latvia.
43
Latvia for 2014–2020. Ecosystem services are benefits provided by nature such as food,
38
Saeima of the Republic of Latvia, Sustainable Development Strategy clean water and pollination on which human society depends.
44
of Latvia until 2030. LIFE Viva Grass project.
39 45
Keep.eu website. European Commission, LIFE EcosystemServices.
11Environmental Implementation Review 2019 – Latvia
in Latvia. The mapping will be done in the whole country, Figure 11: Number of IAS of EU concern, based on
49
not only for Natura 2000 sites. available georeferenced information for Latvia
The MAES working group meeting held in Brussels in
September 2018 noted that Latvia has made substantial
progress since January 2016 in implementing MAES
(Figure 10). This assessment was made by the
46
ESMERALDA project and is based on 27 implementation
questions. The assessment is updated every 6 months.
Figure 10: Implementation of MAES (September 2018)
Business and biodiversity platforms, networks and
communities of practice are key tools for promoting and Between the entry into force of the Union list and
facilitating natural capital assessments among business 18 May 2018, Latvia did not notify any new appearances
and financial service providers, for instance via the of IAS of Union concern, as provided for in Article 16(2) of
47
Natural Capital Coalition’s protocol . The assessments the IAS Regulation.
contribute to the EU biodiversity strategy by helping Latvia has fulfilled all its notification obligations under
private businesses better understand and value both the Directive.
their impacts and dependence on nature. Biodiversity
48
platforms have been established at EU level and in a Soil protection
number of Member States.
The EU soil thematic strategy underlines the need to
Latvia has not yet established such a platform. ensure a sustainable use of soils. This entails preventing
further soil degradation and preserving its functions, as
Invasive alien species well as restoring degraded soils. The 2011 Roadmap to a
Under the EU biodiversity strategy, the following are to Resource Efficient Europe states that by 2020, EU policies
be achieved by 2020: must take into account their direct and indirect impact
(i) invasive alien species identified; on land use.
(ii) priority species controlled or eradicated; and
(iii) pathways managed to prevent new invasive species Soil is an extremely fragile finite resource and it is
from disrupting European biodiversity. increasingly degrading in the EU. The percentage of
50
This is supported by the Invasive Alien Species (IAS) artificial land in Latvia (Figure 12) is the 3rd lowest in
Regulation, which entered into force on 1 January 2015. the EU (after Sweden and Finland). This can be seen as a
measure of the relative pressure on nature and
The report on the baseline distribution (Figure 11), for biodiversity, and of the environmental pressure from
which Latvia reviewed its country and grid-level data, people living in urbanised areas.
shows that out of the 37 species on the first Union list, 7
have been observed in the environment in Latvia, and all
of them established. According to available data,
Sosnowsky’s hogweed (Heracleum sosnowskyi) is the
49
most widely spread among them. Tsiamis K; Gervasini E; Deriu I; D`amico F; Nunes A; Addamo A; De
Jesus Cardoso A. Baseline Distribution of Invasive Alien Species of Union
concern. Ispra (Italy): Publications Office of the European Union, 2017.
50
Artificial land cover is defined as the total of roofed built-up areas
46
European Commission, Esmeralda project. (including buildings and greenhouses), artificial non built-up areas
47
Natural Capital Coalition, Natural Capital Protocol. (including sealed area features, such as yards, farmyards, cemeteries,
48
Business and Biodiversity, The European Business and Biodiversity car parking areas etc. and linear features, such as streets, roads,
Campaign aims to promote the business case for biodiversity in the EU railways, runways, bridges) and other artificial areas (including bridges
Member States through workshops, seminars and a cross media and viaducts, mobile homes, solar panels, power plants, electrical
communication strategy. substations, pipelines, water sewage plants, and open dump sites).
12Environmental Implementation Review 2019 – Latvia
51
Figure 12: Proportion of artificial land cover, 2015 levels of soil erosion can reduce productivity in
agriculture and can have negative and transboundary
impacts on biodiversity and ecosystem services. High
levels of soil erosion can also have negative and
transboundary efforts on rivers and lakes (due to
increased sediment volumes and transport of
54
contaminants). According to the RUSLE 2015 model ,
Latvia has an average soil loss rate by water of 0.32
−a −y
tonnes per hectare per year (t ha yr ) compared to the
−a −y
EU mean of 2.46 t ha yr . This indicates that soil
erosion in Latvia is low on average. Note that these
figures are the output of an EU-level model and therefore
not be considered as locally measured values. The actual
rate of soil loss can vary strongly within a Member State
depending on local conditions.
Soil organic matter plays an important role in the carbon
cycle and in climate change. Soils are the second largest
carbon sink in the world after the oceans.
As part of the 2009-2014 EEA grants programme
“National Climate Policy” a digital soil database has been
developed. The dataset contains historical information
about soil maps of agricultural lands (mapped from 1960
until 1991). Currently it is not possible to provide
qualitative and up-to-date reliable soil information to
various stakeholders (public bodies, farmers, researchers,
international organizations).
With the support from the Kingdom of Norway (the
55
Norwegian Financial Mechanism 2014-2020) Latvia
Latvia ranks below the EU average for artificial land plans to establish a national soil carbon monitoring
coverage, with 1.6 % of artificial land (EU-28 average: system as well to establish up-to-date information on
2
4.1 %). The country’s population density is 31/km , land use management in the context of climate change.
52
significantly below the EU average of 118 .
Contamination can severely reduce soil quality and Marine protection
threaten human health or the environment. A recent EU coastal and marine policy and legislation require that
53
report of the Joint Research Centre (JRC) estimated that by 2020 the impact of pressures on marine waters be
potentially polluting activities have taken or are still reduced to achieve or maintain good environmental
taking place on approximately 2.8 million sites in the EU. status (GES) and ensure that coastal zones are managed
At EU level, 650 000 of these sites have been registered sustainably.
in national or regional inventories. 65 500 contaminated
sites already have been remediated. Latvia has registered The Marine Strategy Framework Directive (MSFD) aims
56
3 574 sites where potentially polluting activities have to achieve good environmental status of the EU’s marine
taken or are taking place, and already has remediated or waters by 2020. To that end, Member States must
applied aftercare measures on 44 sites. develop a marine strategy for their marine waters, and
Soil erosion by water is a natural process, but this natural cooperate with the EU countries that share the same
process can be aggravated by climate change and human marine (sub)region.
activities such as inappropriate agricultural practices, For Latvia, the Baltic Marine Environment Protection
deforestation, forest fires or construction works. High Commission (Helsinki Commission) plays an important
51
European Commission, Eurostat, Land covered by artificial surfaces by
54
NUTS 2 regions. Panagos, P., Borrelli, P., Poesen, J., Ballabio, C., Lugato, E.,
52
European Commission, Eurostat, Population density by NUTS 3 Meusburger, K., Montanarella, L., Alewell, C., The new assessment of
region. soil loss by water erosion in Europe, (2015) Environmental Science and
53
Ana Paya Perez, Natalia Rodriguez Eugenio, Status of local soil Policy, 54, pp. 438-447.
55
contamination in Europe: Revision of the indicator “Progress in the Legal Acts of the Republic Of Latvia.
56
management Contaminated Sites in Europe”, 2018. Directive 2008/56/EC.
13Environmental Implementation Review 2019 – Latvia
contribution to achieving the Directive’s goals. Major
gaps remain in Latvia regarding the good environmental
status (GES) definitions for many aspects of the marine
environment, namely hydrographical changes,
contaminants, marine litter and underwater noise. The
same applies for birds, mammals and fish species in
biodiversity.
Latvia reports ‘existing’ measures in its programme,
relating to an extensive list of existing international
conventions, EU policies and national legislation and
efforts. How these will address pressures on the marine
environment, GES and targets is, however, not provided
in detail. Latvia reports ‘new’ measures, specifically
designed for the purposes of the Marine Strategy
Framework Directive (MSFD), in its programme of
measures, which mainly raise awareness or aim to fill
knowledge gaps and support the identification of future
needs for measures to achieve GES. These do not directly
address pressures.
The programme of measures covers some relevant
pressures on its marine environment and targets to be
achieved. It does not, however, address some pressures,
activities and associated impacts identified as important
at sub-regional level, such as the introduction of non-
indigenous species through shipping and pressures on all
biodiversity species and habitats. There are no specific
measures for hydrographical changes and underwater
noise, reportedly because of data gaps.
One shortcoming in the measures is their
implementation timeline, as Latvia reports it will
implement them in 2018, 2019 and 2020. This is not in
line with MSFD requirement to reach GES by 2020.
Overall, the Latvian programme of measures does not
address MSFD needs to progress towards GES, with
significant weaknesses noted in coverage of pressures for
several descriptors and delayed implementation of new
measures.
2019 priority actions
Define good environmental status and targets where
these do not exist, as well as timelines for achieving
GES, when these have not been reported.
Provide more information about measures, establish
more measures with a direct impact on pressures and
quantify how far the measures are expected to
reduce pressure, and monitor progress.
Ensure regional cooperation with Member States
sharing the same marine (sub) region to address the
main pressures.
Ensure reporting of the different elements under the
Marine Strategy Framework Directive by the set
deadline.
14Environmental Implementation Review 2019 – Latvia
3. Ensuring citizens' health and quality of life
(SOx) fell by 11 %, emissions of ammonia (NH3) by 2.34 %,
Air quality emissions of volatile organic compounds (NMVOCs) by
EU clean air policy and legislation require the significant 8.22 %, emissions of fine particular matter PM 2.5 by
improvement of air quality in the EU, moving the EU 10.65 % and emissions of nitrogen oxides (NO x) by 3.76 %
closer to the quality recommended by the World Health between 2014 and 2016 (see also Figure 13 on the total
Organisation. Air pollution and its impacts on human PM2.5 and NOx emissions per sector).
health, ecosystems and biodiversity should be further Figure 13: PM2.5 and NOx emissions by sector in Latvia
61
reduced with the long-term aim of not exceeding critical
loads and levels. This requires strengthening efforts to
reach full compliance with EU air quality legislation and
defining strategic targets and actions beyond 2020.
The EU has developed a comprehensive body of air
57
quality legislation , which establishes health-based
standards and objectives for a number of air pollutants.
According to a special report from the European Court of
58
Auditors , EU action to protect human health from air
pollution has not had its expected impact. There is a risk
that air pollution is being underestimated in some
instances. Member States are now required to report
both real-time and validated air quality data to the
59
Commission . Upgrading its air quality monitoring
system, which is planned in 2019, will put Latvia in a
position to report also real-time air quality data.
Despite these emission reductions, additional efforts are
needed to attain the emission reduction commitments
(compared with 2005 emission levels) laid down in the
62
new National Emissions Ceilings Directive for 2020 to
2029 and for any year from 2030.
For 2016, Latvia does not report having exceeded any air
63
quality limit values . Air quality in Latvia is reported to
be generally good, with exceptions. For 2015,
the European Environment Agency estimated that about
1 600 premature deaths could be attributed to fine
64
particulate matter concentrations, 50 to ozone
65 66
concentration and over 130 to nitrogen dioxide
67
concentrations in Latvia .
Emissions of several air pollutants have decreased
60
significantly in Latvia . The emission reductions between
1990 and 2014 mentioned in the previous EIR continued
61
between 2014 and 2016. Emissions of sulphur oxides 2016 NECD data submitted by Member State to the EEA.
62
Directive 2016/2284/EU.
63
EEA, Eionet, Central Data Repository.
57 64
European Commission, 2016. Air Quality Standards. Particulate matter (PM) is a mixture of aerosol particles (solid and
58
European Court of Auditors, Special report no 23/2018: Air pollution: liquid) covering a wide range of sizes and chemical compositions. PM10
Our health still insufficiently protected. (PM2.5) refers to particles with a diameter of 10 (2.5) micrometres or
59
Article 5 of Commission Implementing Decision 2011/850/EU of 12 less. PM is emitted from many anthropogenic sources, including
December 2011 laying down rules for Directives 2004/107/EC and combustion.
65
2008/50/EC of the European Parliament and of the Council as regards Low level ozone is produced by photochemical action on pollution.
66
the reciprocal exchange of information and reporting on ambient air NOx is emitted during fuel combustion e.g. from industrial facilities
quality (OJ L 335, 17.12.2011, p. 86) requires Member States to provide and the road transport sector. NOx is a group of gases comprising
Up-To-Date data. nitrogen monoxide (NO) and nitrogen dioxide (NO2).
60 67
See EIONET Central Data Repository and Air pollutant emissions data EEA, Air Quality in Europe – 2018 Report, p. 64. Please see details in
viewer (NEC Directive). this report as regards the underpinning methodology).
15Environmental Implementation Review 2019 – Latvia
Figure 14: Air quality zones exceeding EU air quality Figure 15: Number of IED industrial installations by
68 72
standards in 2017 sector, Latvia (2015)
2019 priority action
Take action, in the context of the forthcoming
The industrial sectors identified contributing the most
national air pollution control programme, to reduce
emissions to air in Latvia are: (i) the energy-power sector
the main emission sources.
for pollutants such as sulphur oxides (SOx), nitrogen
oxides (NOx), particulate matter (PM10) and chromium
Industrial emissions (Cr); (ii) the minerals sector for sulphur oxides (SOx),
The main objectives of EU policy on industrial emissions nitrogen oxides (NOx), cadmium (Cd), arsenic (As) and
are to: polychlorinated dibenzodioxins and polychlorinated
(i) protect air, water and soil; dibenzofurans (PCDD/F); and (iii) ‘other activities’
(ii) prevent and manage waste; (intensive rearing of poultry or pigs and surface
(iii) improve energy and resource efficiency; and treatment) for non-methane volatile organic compounds
(iv) clean up contaminated sites. (NMVOCs) and particulate matter (PM10). The
To achieve this, the EU takes an integrated approach to breakdown is shown in the following graph.
the prevention and control of routine and accidental Figure 16: Emissions to air from IED sectors and all oher
industrial emissions. The cornerstone of the policy is the national total air emissions, Latvia (2015)
69
Industrial Emissions Directive (IED).
The overview below on industrial activities regulated by
the IED is based on the ‘industrial emissions policy
70
country profiles’ project .
In Latvia, around 90 industrial installations are required
71
to have a permit under the IED . In 2015, the industrial
sectors in Latvia with the most IED installations were the
intensive rearing of poultry or pigs (42 %), followed by
the energy-power sector (19 %) and waste management
(19 %).
Regarding water emissions, the energy-power sector was
identified as having a significant environmental burden
68
EEA, EIONET Central Data Repository. Data reflects the reporting due to its generation of non-hazardous waste. The waste
situation as of 26 November 2018. management sector mainly contributes to hazardous
69
Directive 2010/75/EU covers industrial activities carried out above
certain thresholds. It covers energy industry, metal production, mineral waste generation.
and chemical industry and waste management, as well as a wide range The EU enforcement approach under the IED creates
of industrial and agricultural sectors (e.g. intensive rearing of pig and
poultry, pulp and paper production, painting and cleaning).
strong rights for citizens to have access to relevant
70
European Commission, Industrial emissions policy country profile – information and to participate in the permitting process.
Latvia.
71
This overview of industrial activities regulated by IED is based on the
72
project on Industrial Emissions policy Country profiles: Industrial European Commission, Industrial emissions policy country profile –
emissions policy country profiles Latvia.
16You can also read


