RENEWABLE ENERGY FROM WASTE TYRES - July 2017 - J Lyons Marketing
←
→
Page content transcription
If your browser does not render page correctly, please read the page content below
RENEWABLE ENERGY FROM WASTE TYRES

                Green Distillation Technologies Corporation Limited
July 2017                          ABN 44 154 895 539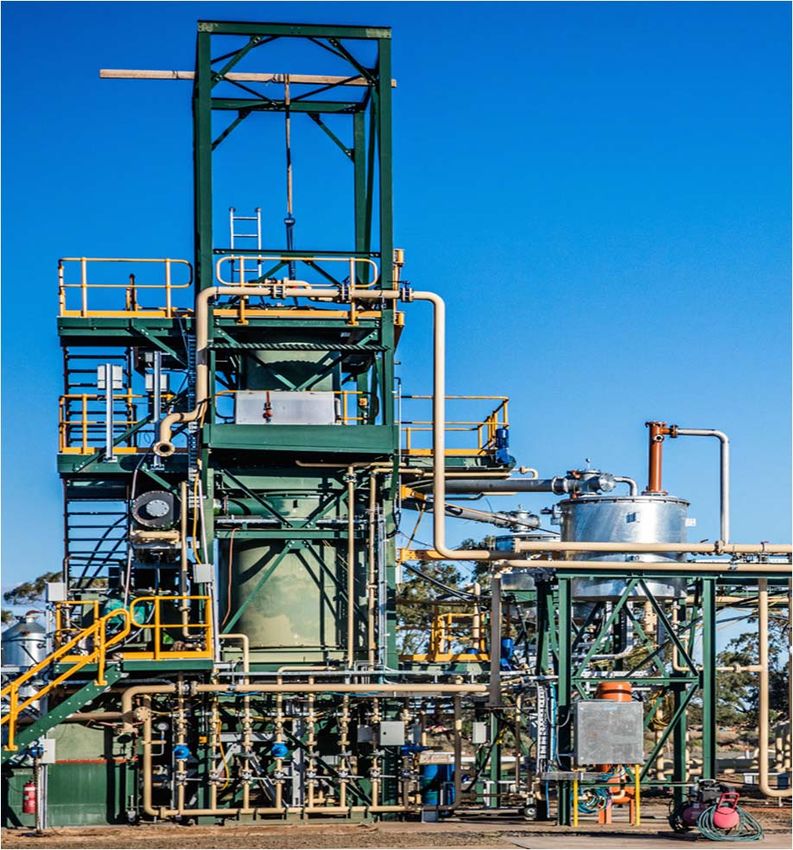
Important Notice and Disclaimer
2
This material has been prepared by Green Distillation Technologies Corporation Ltd (“GDTC”) for
informational purposes only, and is neither an offer to buy or sell, nor a solicitation of an offer to buy or
sell, any security, instrument, or investment, nor solicitation of an offer of any service. This document is
issued by GDTC for the information of the recipient only. The information and opinions expressed in this
material are based on publicly available information and the information GDTC has legally obtained. This
information has not been verified by GDTC and GDTC gives no warranty and makes no representation as
to the accuracy or completeness of the contents of this document.
The document and its contents are confidential and may not be provided or otherwise communicated to
anyone other than those to whom it is addressed. Furthermore, the information and opinions contained
in this material may change without prior notice, and may be affected by changes in the initial premises
due to, including but not limited to, shifts in the market environment, and/or amendments in accounting
and taxation rules and regulations.
The assumptions presented herein are strictly hypothetical, and this material does not suggest nor specify
all possible risks. The ultimate decision to use the information and opinions expressed in this material
should be made based on the sole judgment of each individual receiver of this material.
GDTC is not a tax or legal advisor, and as such does not dispense any advice on matters of tax or law. Any
references to tax or legal matters contained in this document do not constitute advice upon which reliance
should be placed and an appropriate tax or legal advisor should be consulted prior to taking any action in
respect of contents of this document.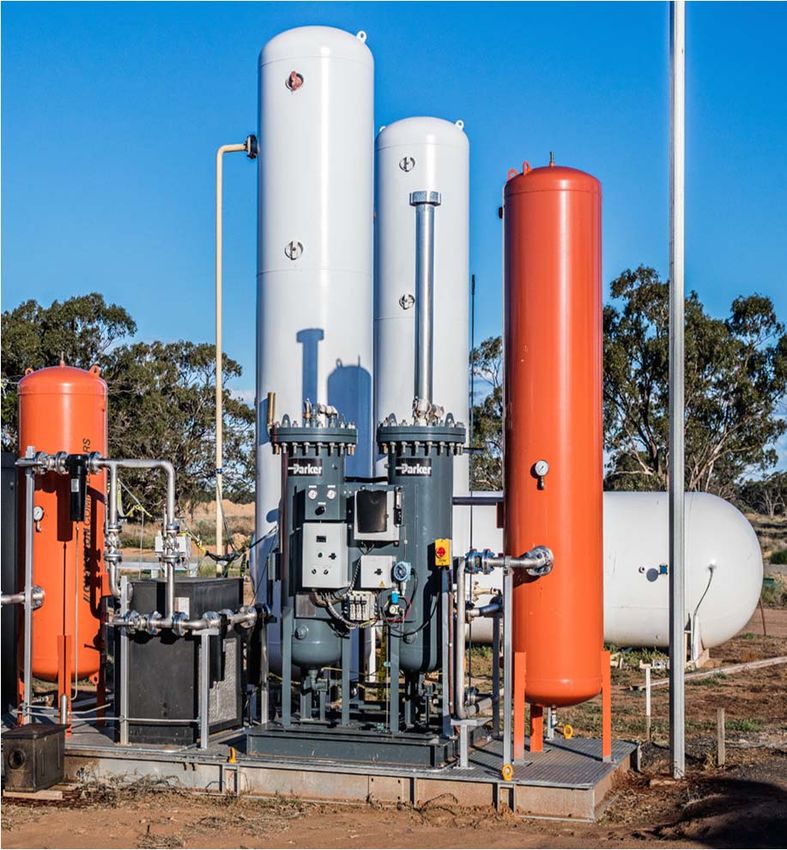
What is the Opportunity?
3
The Opportunity Current Practice
Green Distillation Technologies Corporation Limited (“GDTC”
or the “Company”) has developed technology that solves the
significant global issue of the effective disposal of end of life
tyres (“ELTs”)
Approximately 1.4 billion equivalent passenger units LANDFILL SHREDDING (TDF) SHIP TO ASIA
(“EPUs”) are generated each year (51m EPU’s in Australia). Increasingly Difficult to Against regulations
being legislated commercialise and potentially
GDTC can earn approximately A$435/tonne from the against Hazardous
conversion of ELTs into saleable commodities: The Future
GDTC receives a $165/tonne gate fee to accept ELTs; and OIL
can generate $270 revenue /tonne from the sale of Oil, GDTC
Full Reutilization of ELT
Carbon, and Steel produced from ELTs at current prices. Destructive
Globally, policy and legislation is moving strongly against Distillation
Commodities
current landfill, burning and recycling practices. Plant CARBON
GDTC has funded its first commercial plant in Warren,
NSW with equity and government grants.
The Technology is now proven and commercialised. STEEL
GDTC is now seeking to raise up to $7m by way of a pre
IPO equity raising to fund its second Australian plant.
The expected financial returns from the Australian
market alone are substantial, and GDTC has multiple
international JV opportunities.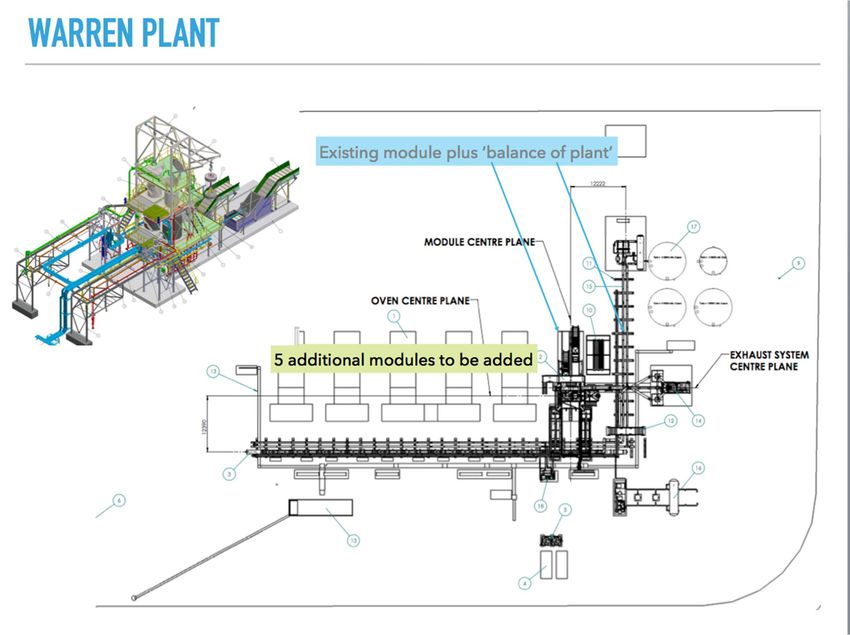
Background
4
Background to this Opportunity GDTC Fuel Oil
Green Distillation Technologies was established in 2009 to
commercialise the destructive distillation process developed by
Denis Randall, who has extensive experience in the Oil and Gas,
Chemical and Waste to Energy space.
GDTC has raised $34.5m to date, including $8m from the
Federal Government in the form of Commercialisation Australia
grants and R&D Incentives.
After successful testing in successive pilot plants, GDTC
constructed the first module of its commercial scale plant in
Warren, NSW in early 2012, to simulate continuous processing. Twin Tube Commercial Plant in Warren
Following successful trials, GDT is now installing the remaining
5 modules of the full scale commercial plant at Warren and is
planning its second Australian plant. The base case sees 7
plants established in Australia within 5 years.
Each plant can process approximately 4% of Australia's annual
waste tyres allowing considerable scope for growth.
GDTC intends to raise a further $7m in a pre‐IPO Placement to
complete funding of it second Australian plant.
GDTC intends to list on the ASX in Q2 2018, with a small IPO
equity raising of $2m to $4m.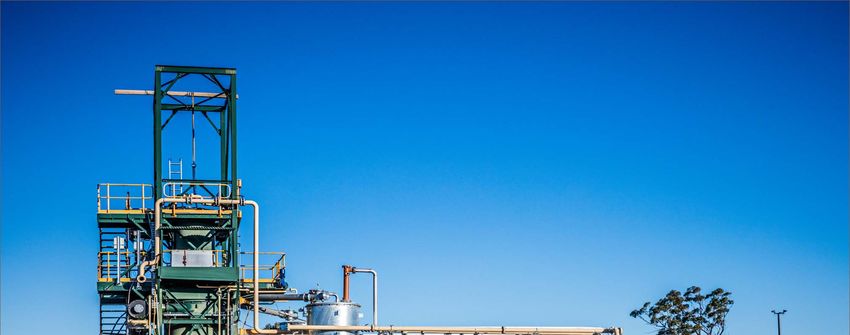
Technology Overview
5
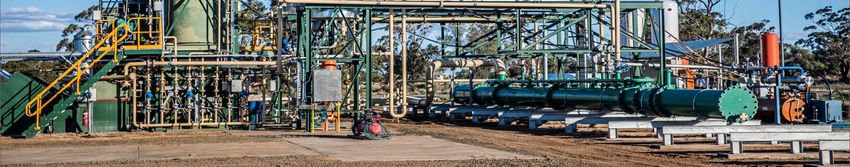
Process Description ‐ Continued Combustion Process
Two separate gaseous streams leave the process:
a product vapour stream, containing condensable
oils from the process; and
a combustion exhaust stream containing the residual
heat from the process.
The product vapour stream is sent to a condenser,
where the condensable fraction (oils) is captured.
The residual heat is removed to the cooler and
exhausted.
The balance of the gases are returned to the heat
process, for re‐use.
Solid products from the conversion process, including
steel wire and carbon are removed from the bottom of
the reactor for further processing and separation as
commercial products for sale.
The Technology is now proven and commercialised.
Simplicity of process reduces risk of plant failure and improves recovery yields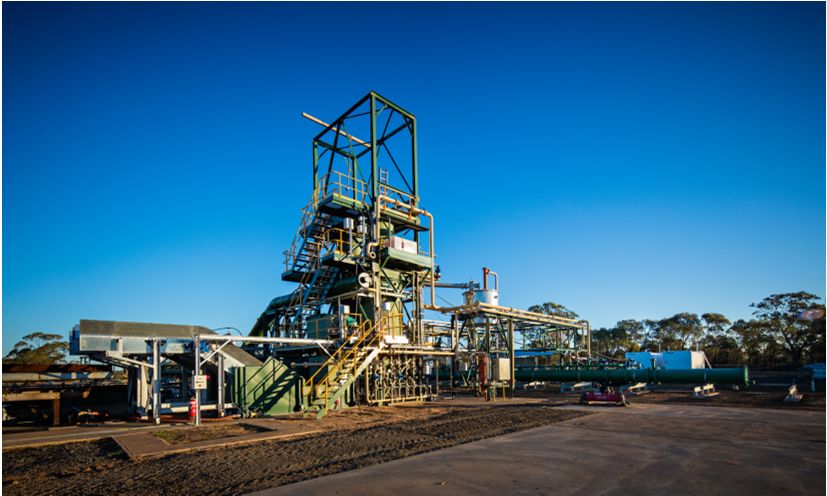
Technology Overview
6

                          Caron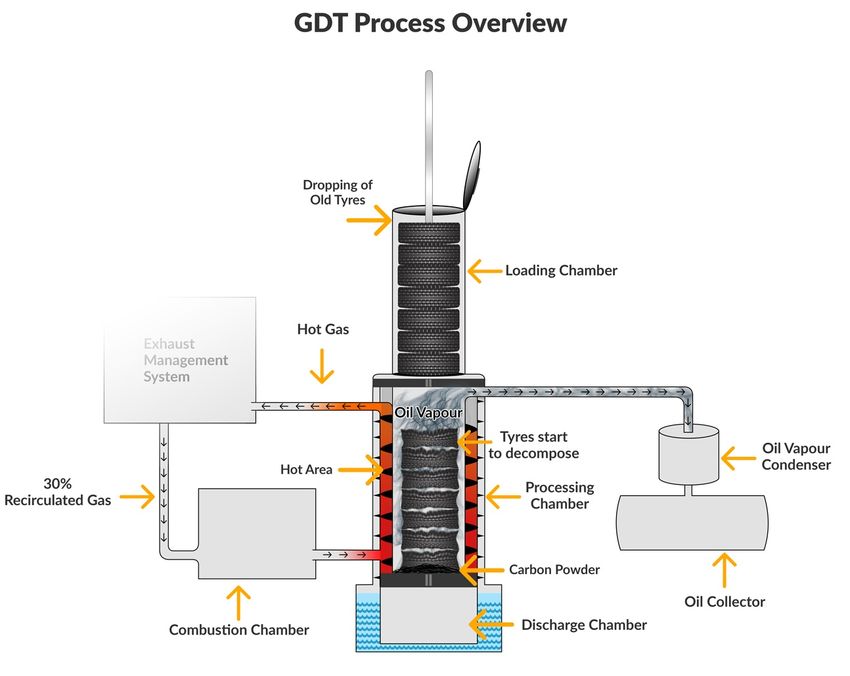
Economic Model – Single Commercial Plant
7

             GDT Single Plant            Volume      %        Rate    Financials    %
                                                                           ($k)
             Revenue ‐
             Tyres                        19,300t   100      $165/T      3,195.6    38
             Carbon                        7,747t    40      $200/T      1,549.4    18
             Oil                          7,975KL    35       40cpl      3,189.9    38
             Steel                         2,985t    15      $170/t        493.9     6
             Total Revenue                                               8,428.8   100

             Cost of Sales ‐
             Plant Payroll                                               1,031.7
             Property, Ins. & security                                     132.0
             Electricity                 400Kwh           $0.06/Kwh        202.1
             Oil                           521KL              40cpl        208.4
             Repairs & Maintenance                                         840.4
             Total Cost of Sales                                         2,414.2

             Gross Profit                                                6,014.5
             Variable Admin Cost                                           336.5
             EBITDA                                                      5,677.9
             Depreciation                                                   840
             EBIT                                                        4,837.9
             Tax                                                         1,451.4
             NPAT                                                        3,386.6

         The Payback period for a single plant is less than 3 years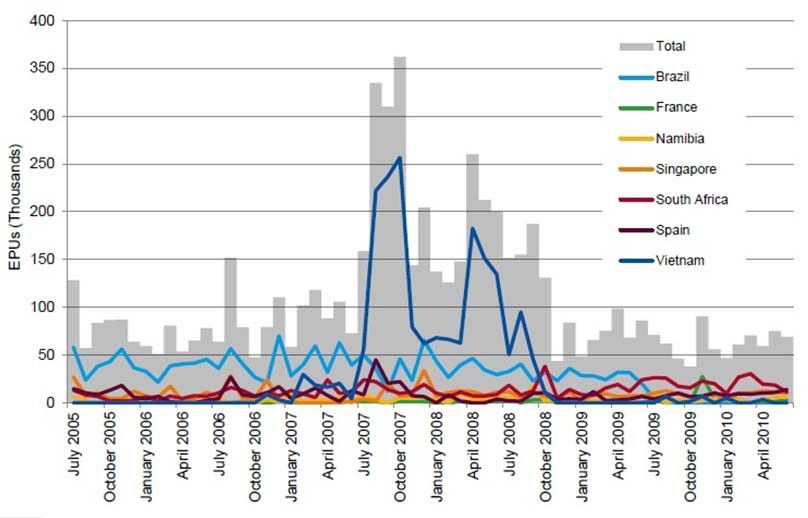
Capital Cost – Warren Commercial Plant
8
Testing Results of Pilot Plants Capital Budget
WARREN CAPITAL COST A$ %
The capital costs for a 12 tube commercial plant capable of Land 0 0.0%
processing in excess of 600,000 tyres per year are detailed in the
Plant Site & Civil Works 150,000 1.3%
adjacent table. Site Buildings 250,000 2.2%
Plant Foundations 550,000 4.8%
Full Development approval has been obtained for the Warren Plant,
Structure/Monorail 1,000,000 8.7%
and all land/road preparation is complete including the provision of
Main Processing Units 2,000,000 17.4%
power and services. Water Circuits 500,000 4.3%
Auxillary Systems 1,500,000 13.0%
The first module has been commissioned with the remaining 5 Electrical 1,550,000 13.5%
modules to be installed in the coming months. Tyre Handling 500,000 4.3%
Output Product Handling 750,000 6.5%
The first commercial plant (in Warren, NSW), GDTC has a 10 year
Freight 100,000 0.9%
lease agreement (with two 10yr renewal options) with HCI Land Pty
Contstruction 1,600,000 13.9%
Ltd providing GDTC with a right of use of 21.3 hectares of land GST 1,070,000 9.3%
adjacent to the Warren Landfill. Contingency 0 0.0%
TOTAL 11,520,000 100.0%
The operating projections assume lower capex for subsequent plants
(for non‐recurring expenses associated with Plant 1) and then a cost Estimated costs for plants going forward after the
escalation for all subsequent plants of 3.5% per year. elimination of certain non‐recurring costs are as follows:
PLANT COST GOING FWD A$ %
Construction time to complete plant 2 is assumed to be fifteen Land ‐ 0.0%
(15) months and for plants 3 to 7, twelve (12) months each. Plant Cost 10,450,000 110.6%
Less non‐repeat costs (2,300,000) ‐24.3%
Plans are progressing for the construction of the second plant to GST 882,000 9.3%
commence in either Tasmania, Victoria or Queensland. Contingency 420,000 4.4%
TOTAL 9,452,000 100.0%
Efficiency of design results in lower capital costs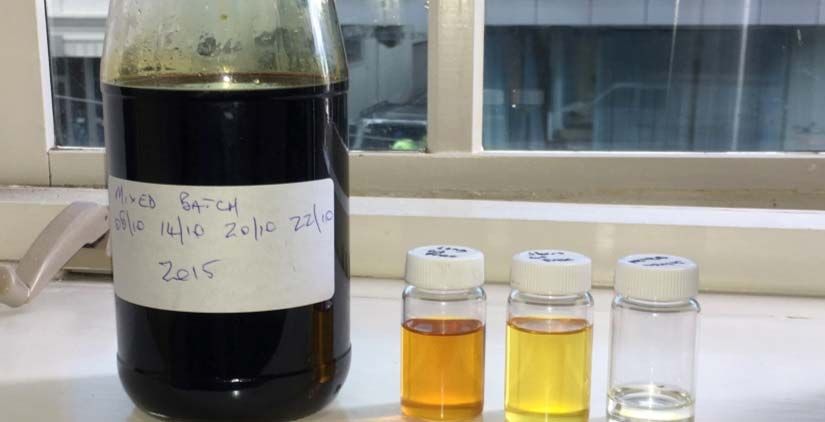
Warren Plant – Progress Images
9

         Installed Module 1                                         Nitrogen System

                        Warren Plant construction continues to progress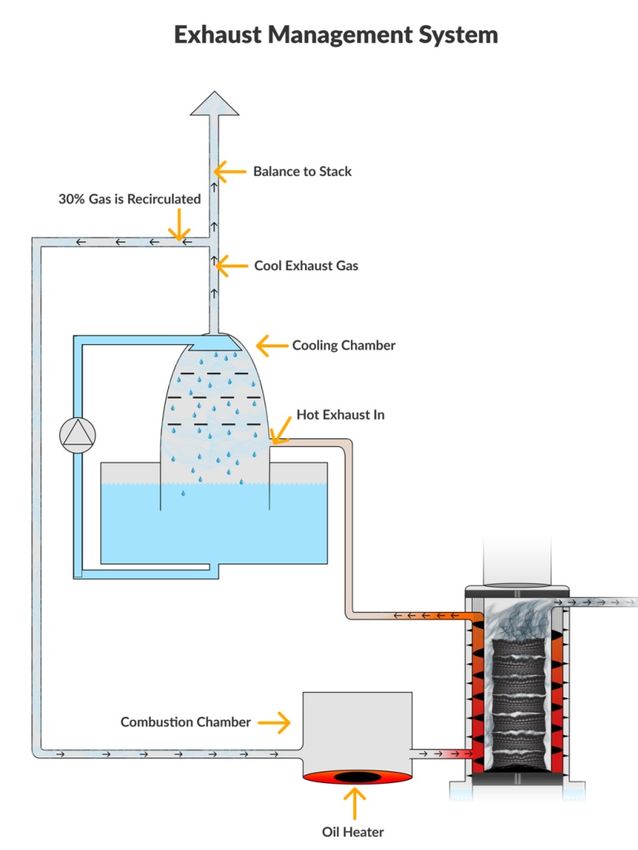
Warren Plant
10
Existing Commercial Plant
11
Testing Results of Pilot Plants Existing Commercial Module in Warren
Single Module Proof of Concept (“POC”)
Proving of the technology has progressed through an initial pilot
Design Commercial Plant
plant, the Alpha (commercial scale) Module through to the full
commercial plant at Warren.
The pilot plants were used to test volume parameters and adjust to
achieve maximum throughput, oil and carbon delivery.
Further series of tests have refined the temperature controls,
maximum load conditions and cycle times and volumes,
confirming all previous results plus some improvements.
Average processing speed of 246 Kgs per hour of truck tyres The POC Commercial Plant was partially funded through
an AUSIndustry non‐refundable POC grant which was
(approximately 29 EPU) delivers the following results:
awarded to GDTC on a competitive basis.
22.5% by weight of steel (truck tyres contain a larger percentage
of steel; by contrast a 100% car tyres delivers 15% steel). Output Commodities
29.7% by weight of oil (confirming results of the pilot plant tests) Carbon and Steel Oil
42.2% by weight of Carbon (slightly higher than pilot plant
averages due to greater efficiencies in heat management)
Exhaust gasses are recycled and scrubbed removing all
harmful gasses from the waste stream resulting in zero toxic
emissions from the exhaust.
The technology, and its commercial viability, have been extensively testedGDTC Off‐Take Status
12
Uses of GDT’s output Carbon and Oil CHARACTERISTICS OF GDT CARBON & OIL
GDT's Oil is a mixed hydrocarbon and can therefore be refined into various GDT CARBON
fractions. Heavy oils suitable as use as a bitumen substitute or in the
manufacture of ‘oil coke’, middle oil with some water content suitable for Carbon 86% Heavy MetalsGDTC Off‐Take Status
13
Uses of GDT’s output Steel ISRI Classifications for Scrap Tyre Wire I
Code DESCRIPTION
The steel wire used in the manufacturing of tyres already meets certain minimum
272 Pulled bead wire (Truck)—Grade 1.
standards (such as ASTM D6477 – 13). Therefore, there is strong buyer interest from Not chopped; made up of loops of wire. Less than five
steel companies who use the scrap wire to produce new tyre wire for the manufacture percent (IP Protection
14
GDTC has sought legal advice as to whether or not it should file for a Patent to protect its IP.
The advice from the Patent Attorney has been to NOT patent the technology but rather keep the technology as a
“Trade Secret”.
The reasons not to Patent are as follows:
A patent will not prevent someone else from copying the technology and competing with GDTC, but will provide GDTC
with the option to take a civil legal suit against such parties which may be extremely costly and may not necessarily
provide the desired result.
The patent itself is publically discoverable and will allow other parties to copy the technology potentially in
jurisdictions where GDTC is not resourced to take legal action.
The complexity of GDTC’s technology lends itself to a trade secrets approach since detailed disclosure is necessary to
replicate the technology.
The construction and operation of the commercial module in Warren (which has been independently reviewed, tested
and documented) provides evidence of the technology “being used and known by others” and therefore provides
protection against a third party filing a patent for the technology.
To protect it’s trade secrets, GDTC has implemented strict confidentiality/IP protection documentation drafted by its Patent
Attorney with all parties it conducts business with including its employees.
No one fabricator is involved in building the entire plant.
All key reactor control software which is critical to the performance of the Plants has been developed in‐house and is
part of the overall Trade Secret.
Freedom to operate advice has been received from GDTC’s Patent Attorney which involved conducting a worldwide
patent search to ensure GDTC is not in breach of any existing patents.
GDTC has decided NOT to patent its technology but rather keep it a Trade SecretCompetitor Analysis – Chipping & Crumbing
15
Limitations of Chipping and Crumbing Numerous Competitors
Company Business
Tyre Crumbing is a High Cost Process
Operations
Tyre shredding, crumbing or powdering is energy intensive
Pre‐removal of steel is a complex and largely manual process Largest tyre recycler in Queensland recycling
ELTs into road surfacing, walking surfaces,
GDT’s process demonstrates far stronger economic returns industrial adhesives, equestrian surfaces,
Limited Market for End‐product sporting and playground surfacing.
Finite market for playground and sporting surfaces
Collects, sorts, resells those ELTs that can be
Some product used in adhesives, brake pads and other limited specialty
reused, otherwise retreads or sends to
industrial applications
landfill
GDT’s outputs of oil, carbon and steel can all be sold into broad global
commodity markets
Higher Level of Waste Produces rubber mulch from ELTs for
Crumbing typically uses only part of the tyre (tread) with sidewalls often exporting to overseas buyers
discarded or incinerated Tyre Recyclers WA
GDT provides >90% recovery converted into re‐usable commodities with only Produces a range of rubber granules and
waste heat generated fine powders from ELTs, which are then
used for a variety of applications from road
Toxic End‐Product surfaces and brake pads, to children's
All toxic chemicals remain in the rubber through the crumbing process playgrounds and sporting surfaces.
Banned in some US states for use as playground base due to toxicity
GDT process produces clean oil, carbon and steel with a low toxicity scrubbed Producing tyre crumb from ELTs for civil
exhaust engineering or industrial applications
Shredding is Not Recycling
Shredding represents only a re‐use of waste rubber not recycling
GDT’s process recycles >90% of the tyre for re‐use
GDT offers more effective recycling with better economic returnsCompetitor Analysis – Pyrolysis Processes
16
Pyrolysis processes have been used to break down tyres for many years, but have not achieved broad economic success
GDT’s destructive distillation process has some similarities with pyrolysis in using heat to drive chemical and molecular changes
in an oxygen free environment ‐ but there are fundamental differences in the process and the outputs
The Pyrolysis reaction requires temperatures of 500oC to 1,000oC to breakdown the hydrocarbons in tyre rubber
GDT’s destructive distillation process occurs at temperatures below 400oC through a carefully managed process
The lower temperature of the GDT process delivers multiple significant benefits:
Lower temperatures requires less energy, reducing the processing cost
Increased oil output per kg of tyre input, as less oil is consumed in generating the required process heat
Improved quality and value of output commodities:
– GDT’s Oil is stable, with a higher cetane index than Pyrolysis oil and a higher value with broad market demand
– Carbon is of high purity, low ash whereas Pyrolysis produces lower value carbon with higher levels of waste ash and char
– Steel is released cleanly, at lower temperatures so the high tensile tyre steel retains its characteristics, whereas pyrolysis
reduces the steel to scrap carbon steel
GDTC’s technology recovers higher levels of Carbon, Oil and Steel with higher purity and higher value
As a result, the economics of GDT’s destructive distillation process outperforms pyrolysis
Pyrolysis plants also typically release higher levels of toxic chemical and hydrocarbon waste
As a result of the poor economics and environmental issues, active pyrolysis plants are mostly confined to countries with low
environmental standards
Dozens of pyrolysis plants have been shut down in Malaysia and China in recent years due to environmental and safety issues
GDT produces higher value output commodities at lower cost than traditional pyrolysisTarget Markets
17
GDTC has plans for 7 plants in Australia (including the existing plant at Warren in NSW) plus an additional 8 target locations
Key Factors in Selecting Sites
Current Pipeline Queensland Proximity to ELT Sources
Additional Target sites
Brisbane Can be in the form of tyre retailers,
‐ 1 plant ELT stock piles, landfill etc…
Gold Coast
Availability of Cheap Transport
‐ 1 plant
Mt. Isa In the absence of a sufficient supply of
‐ 1 plant locally produced ELTs, additional ELTs
can be transported in from outside
locations
NSW
Capital Cost of Land
Warren
Plant sites are typically not in CBD
‐ 1 plant
Young
locations due to high land costs
‐ 1 plant Local Demand for Output Commodities
Camden Sydney Where there is high demand from
‐ 1 plant local industries (who require large
Victoria Manildra amounts of heat/electricity)
Stawell ‐ 1 plant
Newcastle Existence of Active Local Government
WA ‐ 1 plant
‐ 1 plant Recycling and Energy Recovery Programs
Numurkah
Fremantle ‐ 1 plant Such programs are directly aligned
‐ 1 plant Wyndham with GDTC’s technology
Tasmania
‐ 1 plant
Warragul Longford
‐ 1 plant ‐ 1 plant
GDTC has a pipeline of potential Plant locations allowing rapid scalabilityTytec OTR Joint Venture
18
GDT has a joint venture with Tytec Logistics Pty Ltd to recycle whole Off The Road (OTR) tyres.
Tytec is the leader in OTR tyre logistics, storage, retreading, and repairs in Australia, and under the JV will offer the first
environmentally friendly OTR tyre recycling process in the world.
The JV will recycle and reuse 100% of OTR tyres processed.
The plant is in the final design stage with components being ordered, and will be in production next year.
Under the JV terms, Tytec will arrange full project capex funding, to be repaid from operating cash flows, minimising
the capital requirement from GDT.
The JV partnership is for four reactors (a different configuration to a standard GDT plant, which equates to
slightly less than two standard GDT passenger/truck tyre plants) to be built in Perth by FY21.
Forecast
Jun‐18 Jun‐19 Jun‐20 Jun‐21
TYTEC RECYCLING (GDT’s Share)
Total Revenue* ‐ 1,310,736 2,621,472 6,553,680
Operating Exp/COGS 74,697 681,801 964,781 1,439,895
Total Gross Profit (74,697) 628,935 1,656,691 5,113,785
Fixed Over Head Costs 218,471 363,635 383,437 398,693
EBITDA (293,168) 265,300 1,273,254 4,715,093
EBITDA Margin 0.0% 20.2% 48.6% 71.9%
Depr/Amort Expense 257,051 366,951 736,751 836,551
EBIT (550,219) (101,651) 536,503 3,878,542
Interest Exp ‐ ‐ ‐ ‐
NPBT (550,219) (101,651) 536,503 3,878,542
Tax Expense (203,384) (521,493) 38,349 285,214
NPAT (346,836) 419,842 498,154 3,593,328
NPAT Margin 0.0% 32.0% 19.0% 54.8%Growth Strategy
19
Huge growth potential exists internationally for GDTC’s technology. GDTC is well advanced in negotiations for Joint Venture
operations in Japan, UK and USA
Additional incentives such as Feed‐in‐Tariff schemes also exist internationally which can lead to greater profitability.Asia
Asia
Japan
‐ MOU agreed
‐ 125m ELTs/yr (Est.)
China
‐ 112m ELTs/yr
Thailand
‐ 30m ELTs/yr
- Agr Waste 22mil T/Yr
Indonesia
‐ 80m ELTs/yr (Est.)
‐ Palm Oil Ag Waste is
over 60mil T/yr
North America Malaysia
North America ‐ 14m ELTs/yr
‐ MOU Signed Oceania/Pacific ‐ Palm Oil Ag Waste is
‐ 300m ELT/yr Europe over 60mil T/yr
‐ Potential Partner Australia
already identified United Kingdom ‐ 24m ELT (51m
‐ 50m ELT/yr EPUs)/yr
‐ 7 Plants planned
Rest of Europe New Zealand
‐ 700m ELTs/yr ‐ 4.8m ELTs/yr
‐ 50 Plants ‐ 2 PlantsInternational JV Opportunities
20
GDT has been approached by multiple parties in North America, Europe and Asia, wanting to utilise GDT’s technology .
GDT’s strategy is to JV internationally, where GDT controls the technology with the other party providing capital and market access.
Japan UK North America
GDT has an MOU with a major GDT is in the final stages of negotiation Multiple parties in the US and Canada
Japanese Trading House for an with one of the largest tyre recyclers in are vying for the opportunity to partner
exclusive JV in Japan and Brazil the UK. in North America.
Trading House is a major shareholder The terms of the JV are currently in The economic model proposed for
in one of the world’s largest tyre discussion and will not be significantly North America would see GDT receive
manufacturers and is their distributor different from JV terms in other an up‐front licence fee of circa $2.5m
in those two countries. jurisdictions. which reduces GDT’s 50% share of
Fees paid in Japan for accepting tyres capex to $1.8m per plant.
are approximately 3 times those in Europe GDT would receive 50% of the NPAT
Australia, making plant economics (being $1.69m p.a. per plant), indicating
highly attractive. GDT is in negotiation with a large an ROI of > 90% and a rapid payback.
European tyre manufacturer (who
The Trading House plans 20 plants in approached GDT) to establish a JV for a
Japan with more in Brazil. global network plants to process Off
North America GDT JV Partner Total
Under the proposed JV terms, the The Road (OTR) tyres including large Plant Cost $4.285 $4.285 $8.570
Trading House will arrange funding to mining tyres. Licence Fee ‐$2.50 $2.50 ‐
cover the full capex cost, to be repaid The terms of the JV are expected to be Net Investment $1.785 $6.785 $8.570
from operating cash flows. similar to the Japanese MOU, with NPAT $1.693 $1.693 $3.386
GDT will provide the technology and minimal capital contribution required ROI 95% 25% 39%
oversee construction. by GDT. Payback 1.05yrs 4.0yrs 2.53yrs
GDT will hold a 50% economic interest
in the Japan/Brazil JV with no direct
capital requirement.GDTC Chairman – John Fletcher
21
John Fletcher - Bio
John Fletcher is a former CEO of Coles Myer, a leading retailer in Australia. Prior to Coles Myer, John Fletcher was
CEO of Brambles Industries for eight years as part of a long career with them spanning 27 years. He was also a
non‐executive director on the board of Telstra for six years from 2000 to 2006. Mr. Fletcher is a Fellow of CPA
Australia.
Brambles industries 1974 ~ 2001
Brambles Industries was an international business‐to‐business
industrial‐services company with over 40,000 employees and operating in
more than 30 countries worldwide.
During his eight year tenure as CEO he led the company in realizing a 41% average
annual growth rate in total shareholder returns (“TSR”).
Coles Myer 2001 ~ 2007
In Sept 2001 he was approached to take over as CEO of Coles Myer which was
Australia’s largest private employer with 165,000 people.
Over a six year period John Fletcher delivered an average annual TSR of 31%
before the Coles Group was sold to Westfarmers for $20 billion.
MIDAS Australia
In 2008 John Fletcher co‐invested with Lazard Asset Management in purchasing
purchasing the national car care chain MIDAS Australia, and for 6 years was
chairman of the company
MIDAS Australia was sold to Metcash in June 2014.
DP World Australia
In February 2016, John Fletcher was appointed as a non‐executive director of
Australia’s largest container terminal stevedore operator.
In July 2016 , he was appointed Chairman.Experienced Management Team
22
Name Position Experience
Craig Dunn CEO, Began Career at KPMG in New Zealand and Australia.
Non‐ Has held senior roles in numerous companies focused on investment structures and corporate business
Executive development, and venture capital.
Director As the owner and Director of Motor Trade Finances Australia Group for over twenty years, has specialized
in developing structured financing strategies for the automotive industry.
Holds a bachelors degree in Business Administration and is a qualified accountant.
Trevor Bayley COO, Owner and Managing Director of Japsco Australia Pty. Ltd. and President of its sister company Japsco Japan
Non‐ K.K., which provide services to develop and support commercial relationships, projects and alliances
Executive between Japanese entities in China, Thailand and Korea.
Director Trevor holds a Master’s degree in Sociology, University of Leicester (UK).
Denis Randall Chief Passionate inventor of waste to energy/renewable energy technologies
Engineering Invented and refined GDTC’s Destructive Distillation technology based on thirty years of practical research,
Officer including implementation of systems in the oil industry, management of waste wood in Singapore, palm oil
processing, waste water and other liquid management
Has owned or held senior management positions in a variety of chemical industry companies in Australia
and South East Asia including technical roles in metallurgy, corrosion and pollution for BHP.
Mr Randall holds the following qualifications: M Aus IMM; PhD; B eng (Mech); Bsc (Chem); Bsc (Math).
Rob Murray Chief Qualified as an Accountant in the UK in 1988.
Financial Held a variety of senior financial roles in retail/newspapers & manufacturing before moving to Australia in
Officer 2001.
Prior to GDT worked for 12 years in the gases and energy business.
Holds a Bachelor of Science in Economics & Statistics.
GDT intends to appoint additionally suitably qualified independent non‐executive directors prior to its IPO in 2018Summary Financial Forecast
23
GDTC plans to establish 7 plants in Australia in the next 5 years from a pipeline of 15 potential plant locations.
The table below is based on GDT’s Australian operations only, including the Tytec OTR Joint Venture in W.A.,
but excludes the significant potential economic contribution from JV opportunities in overseas markets.
Forecast
Jun‐17 Jun‐18 Jun‐19 Jun‐20 Jun‐21
Total Revenue* ‐ 2,973,233 11,316,808 20,037,507 36,155,304
Revenue Growth ‐ ‐ 280.6% 77.1% 80.4%
Operating Exp/COGS 17,500 1,223,117 4,227,679 7,091,808 11,750,494
Total Gross Profit (17,500) 1,750,115 7,089,129 12,945,699 24,404,810
Gross Margin 0.0% 58.9% 62.6% 64.6% 67.5%
Fixed Over Head Costs 961,455 2,440,478 3,522,066 4,254,106 5,071,409
EBITDA (978,955) (690,363) 3,567,063 8,691,593 19,333,401
EBITDA Margin 0.0% ‐23.2 31.5% 43.4% 53.5%
Depr/Amort Expense 16,678 1,080,516 1,899,303 3,184,871 4,723,839
EBIT (995,633) (1,770,879) 1,667,760 5,506,722 14,609,562
Interest Exp 105,000 ‐ 87,610 590,224 1,445,936
Interest Income 54,840 56,936 65,029 107,557 281,368
NPBT (1,045,793) (1,713,942) 1,645,180 5,024,055 13,444,994
Tax Expense (55,416) (203,384) (349,617) 1,371,856 3,103,006
NPAT (990,377) (1,510,559) 1,994,797 3,652,199 10,341,988
NPAT Margin 0.0% ‐50.8% 17.6% 18.2% 28.6%Capital Raising & Capital Structure
24
Gross Amount Valuation @ Pre‐ Valuation @ IPO
Shares
Indicative Capital Structure Raised IPO Price Price
(million) (%)
(A$m) (A$m) (A$m)
Existing Shareholders (318 shareholders) 143.6 75.2% ‐ $35.91 $43.09
Placement (@ $0.25 per share) 28.0 14.7% $7.00 $7.00 $8.40
Total 171.6 89.9% $7.00 $42.91 $51.49
Conversion of Convertible Notes 6.0 3.1% ‐ $1.80
IPO Capital Raising (@ $0.30 per share) 13.3 7.0% $4.00 $4.00
Total 191.0 100.00% $11.00 $57.29
• GDTC has raised $34.5m to date including $8m in Government grants and R&D incentives Major Shareholders
%
post Placement
• GDT intends to raise $7m and up to $8m via a pre‐IPO Placement at $0.25 per share
CBI Pty Ltd 26.1%
• The pre‐money valuation of $36m compares favourably with the $34.5m of funds applied
to development Dennis Randal 13.1%
• The IPO price will be at a 25% premium to the pre‐IPO Placement price, implying that no John Fletcher
5.9%
escrow will apply to pre‐IPO investors (Incl Conv. Notes)
• The pre‐IPO Placement is expected to be completed in June 2017 Adams Family 3.2%
• GDT intends to complete an IPO on the ASX in Q2 2018 to raise an additional circa $2m to Total 48.2%
$4m, at which point GDT expects to have two commercial plants in operation, and to have
progressed international JV expansion plans
• GDT’s forecast for the Australian operations alone indicates a P/E ratio of 24x in FY19 and 13x in FY20 with strong growth
prospects thereafter (at the pre‐IPO price and fully diluted for the IPO).Use of Funds
25
Funds Available (A$m)
Cash on Hand 3.6
Funds raised from the Placement 7.0
Total Funds Available $10.6m
Use of Funds
Capital Cost – Warren Plant
4.0
Capital Cost – 2nd Commercial Plant (50%) 4.2
Costs of the Offer 0.4
General Working Capital 1.9
Total $10.6mInvestment Highlights
26
• GDT has the leading proprietary technology that solves the global issue of the effective disposal of end of
life tyres in an environmentally effective way
• Massive global need with no current effective solution: 1.4 billion equivalent passenger units (EPUs) end
of life tyres are generated annually globally (51 million in Australia), with circa 4 billion EPUs in stockpile
and landfill worldwide
• The destructive distillation process reduces tyres to saleable and re‐useable commodities of Oil, Carbon
and Steel with circa 90% recovery
• The economics of the process are proven and are highly attractive, with GDT paid to take end of life tyres
as the input, and able to sell all output commodities.
• After extensive testing in pilot plants up to commercial scale, GDT is currently commissioning a full scale
plant at Warren in NSW capable of processing 20,000 tonnes of tyres p.a. (4% of Australia’s annual waste
tyres). The expected revenue from the Warren plant exceeds $8m p.a., with EBITDA margins exceeding
60%
• The pre‐IPO Placement of $7m will provide capital for construction of the 2nd of 7 proposed commercial
plants in Australia
• Opportunities for rapid international expansion via JV’s with industry leaders at low capital cost for GDT
have commenced
• Experienced management and technical team ready to commercialise and expand the business
• GDT intends to list on the ASX in Q2 2018 with a small IPO raising ($2m to $4m)27 Appendix
28 Market Overview
Market Overview ‐ Australia
29

                                                                                                                                                            Domestic & International destination of EPUs in Australia (2009‐10)
                                                                                                                                                                Passenger              Truck             Passenger & Truck            OTR                TOTAL
     Data Source: Study into domestic and international fate of end‐of‐life tyres – Hyder Consulting Pty Ltd

                                                                                                                               Recycling                   1,853,750   14.0%    2,999,750      20.4%    4,853,500      17.4%     75,000      0.4% 4,928,500      10.2%
                                                                                                                               Energy Recovery               250,000    1.9%                    0.0%      250,000       0.9%                 0.0%    250,000      0.5%
                                                                                                               Domestic

                                                                                                                               Civil Engineering           1,016,625    7.7%    1,276,375       8.7%    2,293,000       8.2%    500,000      2.4% 2,793,000       5.8%
                                                                                                                               Licensed Landfill           1,450,073   11.0%      161,119       1.1%    1,611,192       5.8%                 0.0% 1,611,192       3.3%
                                                                                                                               Unknown                     1,865,043   14.1%    9,078,286      61.9%   10,943,329      39.3% 19,400,840     94.2% 30,344,169     62.6%
                                                                                                                               SUB TOTAL                   6,435,491   48.8%   13,515,530      92.1%   19,951,021      71.6% 19,975,840     97.0% 39,926,861     82.4%
                                                                                                                               Resuse and retreading          45,758    0.3%       56,281       0.4%      102,039       0.4%      8,448      0.0%    110,487      0.2%
                                                                                                               International

                                                                                                                               Recycling                   3,261,175   24.7%      522,350       3.6%    3,783,525      13.6%    218,900      1.1% 4,002,425       8.3%
                                                                                                                               Energy Recovery             3,455,180   26.2%      579,721       4.0%    4,034,901      14.5%    393,704      1.9% 4,428,605       9.1%
                                                                                                                               SUB TOTAL                   6,762,113   51.2%    1,158,352       7.9%    7,920,465      28.4%    621,052      3.0% 8,541,517      17.6%
                                                                                                                               TOTAL                      13,197,604           14,673,882              27,871,486            20,596,892           48,468,378
                                                                                                                               All units are in EPUs

                                                                                                                                Export of AHECC 40122000 – Used pheumatic rubber tyres                  Export of AHECC 40040000 – Waste, parings & scrap or rubber

                                                                                                                                                                                                        AHECC 40040000 has replaced 40122000 as the main export
                                                                                                                                                                                                        code used to disguise the export of whole baled tyres.
                                                                                                                                                       The dubious practices of whole tyre exporters have now been exposed
Market Overview ‐ Australia
30
In the last 10 years, stricter Federal and State regulations have Export of Tyres and TDP by Type 2009‐10
made it difficult or prohibitively expensive to landfill ELTs resulting
High Occurrence in more illegal dumping or stock piling of ELTs by collectors.
or Illegal Dumping The EPA in Australia is currently dealing with a number of large
or Stockpiling illegal tyre dumps where the original collectors are no longer
around.
Since 2007, ELT collectors in Australia started to export ELTs
predominantly to Vietnam.
As of 2009‐10 it is estimated that 29% of all ELTs on an EPU basis
Illegal Exporting were being exported overseas of which 67% went to Vietnam.
to Asia It is understood that various export codes for waste/scrap rubber
(which are only measured by weight) are being used to disguise
the export of whole baled tyres which is in contravention of the
Basel Convention (2009) to which Australia is a signatory. Top 10 Export Destinations for ELTs 2009‐10
The above illegal practices have resulted in greater regulatory
scrutiny over how ELTs are disposed of in Australia.
Recent TV and news articles have exposed the current practice
resulting in strong public and regulatory criticism.
In 2009, the “National Waste Policy" was enacted into law which
sets Australia's waste management and resource recovery
Changing direction from now until 2020.
A key strategy of the policy has resulted in the implementation of
Regulatory legislation that has introduced the Tyre Stewardship scheme
Environment (“ATS”). Under this legislation those involved in producing,
manufacturing, selling, using and disposing of products will have a
shared responsibility to ensure their environmentally sound
management.
As the ATS becomes entrenched, large tyre retailers are
increasingly focused on finding environmentally sound disposal
Data Source: Study into domestic and international fate of end‐of‐
solutions for the ELTs they receive as part of their new tyre sales. life tyres – Hyder Consulting Pty Ltd; May 2012
Increased regulation is fueling demand from Tyre retailers for a disposal solutionMarket Overview ‐ Australia
31
Tyres have come into Australia via three main supply chains:
Tyres in Use by Tyre Type
Tyres imported on vehicles
Entry of tyres
Domestically manufactured tyres
into Australia Tyres imported on consignment
However, since Goodyear and Bridgestone closed their respective
factories in 2008 and 2009, there is now no local production of
tyres in Australia.
There are an estimated 115mil EPUs in use in Australia (2009‐10)
115m Tyres in use of which 66mil are passenger tyres, 29mil are truck tyres, with the
48.5 mil ELTs/year balance (20mil) being OTR tyres.
(units: EPUs) NSW, QLD and VIC account for approximately 85mil of EPUs in use.
In 2009‐10 an estimated 48.5mil ELTs were produced (EPU units).
Tyre Transformation/Re‐processors include a limited number of
players covering a wide range of activities from retreading, Tyres in Use by Jurisdiction
Limited shredding and chipping through to the manufacture of tyre‐
Transformation or derived products.
Re‐processing This side of the industry, however, has struggled due to the high
cost of production, an inability to achieve high sale pricing and the
saturation of substitute products in the market.
Barriers to entry into the ELT collection business are very low and
therefore the market is characterized by a large number of small
High Occurrence collectors operating at very low margins.
or Illegal Tyre retailers charge their customers a fee for removing and
Dumping or disposing of used tyres. The retailers in turn pay the tyre collector
Stockpiling and transport operators a disposal fee. The collectors then choose
the cheapest disposal method to maximize their profits.
Data Source: Study into domestic and international fate of end‐of‐
life tyres – Hyder Consulting Pty Ltd; May 2012
Australia produces approximately 48.5 mil ELTs per year (on a EPU basis)Sourcing Raw Materials (ELTs)
32
Discussions to Date Potential Suppliers of ELTs
GDTC has completed agreements with tyre collectors to Company Business Operations
supply ELTs (both passenger and commercial vehicle ELTs) to Beaurepaires is the largest tyre retailer in
the Warren Plant at a price of A$165/ton net of all Australia by number of stores at 300. GDTC
transportation costs which are covered by the collector. estimates they produce over 3m ELTs/yr
To source these ELTs, the collectors themselves have entered
A recycler of ELTs producing rubber crumb.
into collection agreements with major tyre retailers to collect
Tyrecycle has had discussions to supply
ELTs from the retailers gate in return for market level tipping ELTs to GDTC’s plant at Warren.
fees as detailed in the below table.
The difference between these fees and the $165/ton received Tyrepower has approximately 250 stores
nation wide. GDTC estimates they produce
by GDTC represents the collectors gross profit from which they
over 2m ELTs/yr
must cover labor, transportation and storage costs.
Bridgestone has approximately 180 retail
Going forward, the Victoria and NSW state EPAs are preparing stores nation wide. GDTC estimates they
to implement stricter regulatory requirements for the produce approx 2m ELTs/yr
management and disposal of ELTs.
Bob Jane has approximately 132 stores (22
DISPOSAL FEES Car 4WD Truck Supe Wgt owned and 110 franchised) nationwide.
Tyr / RV r Avg/Tota GDTC estimates they produce 2m ELTs/yr
e Singl l
e
Avg Wgt/Tyre(kgs) 10.0 16.0 50.0 70.0 29.2
Tyreright has been supplying tyres to GDT’s
Disposal Fee/Tyre(1) $5.0 $7.5 $15.0 $20.0 $10.0 site at Warren on an as required basis.
% Mix per Plant 40% 20% 30% 10% 100%
(1) These are typical disposal fees paid by tyre retailers to tyre collectors
Strong interest in supplying ELTs from major tyre retailers & collectors in AustraliaRegulatory Framework
33
Tyre Disposal Regulations State Regulation Development Approval
National Waste Policy Environmental Protection Regulations Plant Development
The NSW EPA has amended regulations regarding unlicensed storage of Requirements are highly
Product Stewardship Act 2011 ELTs. Previously 5,000 ELTs could be stored in NSW without the State specific
requirement to be licensed. The regulations have now been changed to
reduce the maximum number of ELTs to 500. This amendment is
In certain States (such as
Australian Tyre Industry Council designed to force ELT collectors and recyclers to be licensed enabling Tasmania) a Notice of Intent
Tyre Stewardship Australia (NPO) the NSW EPA to better track and control the management of ELTs. (provided to the EPA) may be
required before applying for
Previously Victorian EPA had no regulation regarding the management, development approval.
transport or storage of ELTs. This has resulted in a large number of ELTs
Australian Tyre Stewardship Scheme being transported from outside Victoria into Victoria, including a In other States only
number of large and potentially dangerous unmanaged stockpiles of development approval is
ELTs. The EPA has now implemented regulation in response to this required assuming the plant
A voluntary product
issue. is to be built on appropriately
stewardship scheme has
GDTC has been advised that the States of Australia are working
entitled land.
commenced.
cooperatively with the Federal Minister of the Environment. The Requirements for
The scheme aims to increase assistant secretary to the Minister has visited the GDTC plant and development approval
resource recovery and Warren NSW and has been briefed on the GDTC solution for ELTs. applications vary considerably
recycling, and to reduce the
State regulation is being strengthened for the management of ELTs. between different states, but
negative environmental, health
typically cover all areas of
and safety impacts of all ELTs in A State or Territory that remains unregulated, or with insufficient safety, construction
Australia. regulation of ELTs, will by default become a dumping site for large
permitting, emissions etc..
stockpiles of ELTs.
The scheme was launched by Fire Services Acts must also
the Federal Minister for the The EPAs of each State are also exploring their ability to require tyre
be complied with particularly
Environment, Greg Hunt, on manufacturers to clean up tyre stockpiles where their tyres are
identified by name and brand.
with regard to the storage of
January 21st 2014
ELTs
GDTC’s business, while not dependent on, is uniquely aligned with regulatory trendsGlobal ELT Market Overview
34
According to the World Business Council for Sustainable Development Recovery Rates in key OECD Regions
one passenger tyre per person is discarded each year in the developed
Large Global world and approximately 1 billion ELTs are generated globally.
Volume of ELTs Furthermore an additional four billion ELTs are currently in landfills and
stock piles worldwide.
While developed economies generate most of the ELTs (due to a
greater number of vehicles in use), recovery rates in such countries are
ELTs are typically typically high with the exception of Australia.
recycled in the Conversely in developing economies where land‐use and disposal
Developed World regulations are weak and infrastructure for collections is missing,
recovery/recycling ratios are low.
In addition to domestic stocks, many developing countries also receive
Biggest problem imported ELTs (in contravention of Basel agreement) that further add to
is ELTs in already problematic stockpiles of ELTs from local sources. Non ELT recovery rates
Developing With car ownership dramatically increasing in the developing world, a Material Recycling Rate (%)
Countries potential environmental time bomb exists with respect to the disposal
Europe USA Japan
of ELTs.
While many countries have experimented with pyrolysis technologies, Tyres (2003‐2006) 84 86 85
Current recycling no one has successfully commercialized a specific technology on any Glass 65 22 90
practices are real scale.
Current recycling practices typically involve the production of tyre Car Batteries 90(UK) 99 ‐
relatively
derived fuel (burning whole or shredded), civil engineering applications
unsophisticated (road surfacing etc..) or recreational facilities (artificial grass, children’s Steel Containers 63 63 87.5
playgrounds etc…) Aluminum beverage 52 52 92
cans
As noted above, one glaring exception with respect to recovery rates is
Australia’s poor Australia, which as a developed economy, has a poor recovery rate for PET bottles 39 24 66
record ELTs with 66% of its ELTs being used in Landfill, stockpiled or discarded
as waste (as of 2009‐2010). Paper/Cardboard 64 50 66
In general most developed countries have appropriate ELT recovery ratiosRecovery Practices in Select OECD Countries
35
Per the table below, as compared to other developed OECD countries, Australia’s recovery practice is poor with only a 34%
recovery rate with 66% of ELTs being disposed either to landfill, stockpiled, illegally dumped or categorized as unknown.
One factor that impacts the off‐the‐road (“OTR”) tyres is that they continue to nearly all be landfilled or stockpiled, most
often at mines or quarries.
Recycling Civil Energy Export Total Disposal
Engineering Recovery Recovery
United States (i) 17% 55% 2% 89% 11%
(ii)
Europe 43% 47% 5% 94% 6%
Japan (iii) 9% 64% 17% 91% 9%
Mexico (iv) 90% 90% 10%
(iv)
South Korea 16% 77% 93% 7%
(iv)
Canada 75% 20% 95% 5%
(iv)
New Zealand 15% 15% 85%
Australia (total) 10% 6%Commodity Recovery from GDT Process
36
Commodity Recovery Feed Stock Data (for Typical GDTC Comm Plant)
The GDTC Destructive Distillation technology is an ELT Feed Stock by Tyre Type (No. Tyres/yr)
extremely efficient technology recovering, in the form 66,326
of saleable commodities, 90% of the input weight of 198,979 10%
30% 265,306
the ELT feed stock. 40%
Passenger Tyres
This is achieved since GDTC’s process heats the ELTs in
4WD/RV Tyres
a vacuum (as opposed to burning the tyres) and as a
Truck Tyres
result there is very little oxidization.
Super Singles
The remaining 10% is effectively consumed through
partial oxidization (which is exothermic) during the 132,653
destructive distillation process. 20%
Commodity Recovery (Tons/Yr) Quantity of ELTs vs Tons of ELTs per yr
1,937 12,000 300,000
10% 10,000 250,000
Number of Tyres per
Tons of Tyres per
2,905 8,000 200,000
7,747 6,000 150,000
15% Carbon
40% 4,000 100,000
Oil 2,000 50,000
- -
Steel
Passeng
4WD/RV
Lost
Tyres
Singles
year
Tyres
Super
Truck
Tyres
year
er
6,779
35%
Tons of Tyres No. of Tyres
Process is very efficient recovering saleable commodities = 90% of feedstock weight37 Development Timeline
Plant Development Timeline ‐ Warren
38
Site works at the Warren Plant are well advanced including:
All services have been connected. Power and telecom services have been delivered to the site. Roads have been laid and completed. Concrete
for the base pads has been laid, and water and oil storage tanks are in place.
Construction of the 1st module has been concluded with ancillary services ‐ cooling systems, oil collection systems & discharge chambers fitted.
Under the terms of the DA processing of up to 5,000 tonnes is permitted. The first of 6 modules has been erected and commissioned to allow
EPA testing for extension of the DA approval to meet the processing targets of the full plant of 19,300 tonnes per year.
Sufficient tyres to conduct commissioning and confirm quality of output have been secured on site.
Site buildings and power rooms have been installed.
It is expected the commercial operation of the first module will commence in September 2017 with all six modules in operation by January
2018 and all modules operating at full capacity by March 2018.
Plant expected to be in full commercial operation by March 2018Additional Six Plant Development Timeline
39
Current plan is for the seventh plant to be completed by Dec 31, 202040 GDT Organisation
History of GDTC
41
Overview Key Milestones
Financial Technical & Public Relations
GDTC is a green technology start‐up based in Melbourne, Oct CBI Pty Ltd 1st equity raise Sep Secured Development Approval to
Australia. 2009 $1.75m. 2010 operate a commercial facility @
Warren.
GDTC has developed a proprietary destructive distillation June Successfully obtained POC & Dec First Pilot built proving the technology
technology which is capable of recycling end‐of‐life car and 2011 EE Grants from Aus Industry 2010 (output yields by wgt of 40% Carbon,
of $438k. 35% Oil & 15% Steel.
truck tyres (“ELTs”) into saleable commodities of carbon, oil Aug Received R&D rebate of Aug Oil & Carbon independently tested with
and steel. 2012 $598k for FY 2012. 2011 calorific values of 43 GJ/t and 36GJ/t
respectively.
GDTC has a commercial spec plant already in partial Dec Raised a further $3.25m of July Completed 2nd pilot plant (commercial
operation which has been extensively tested by potential 2012 capital. Established public 2012 spec) with higher yields of 40% Carbon,
company GDTC with John 35% Oil & 15% Steel.
buyers of its commodity outputs as well as the Australian Fletcher as Chairman.
Government, Department of Innovation, Industry, Science June Successfully obtained ESC Apr Became the 1st Australian Co. to receive
2013 grant from C. A. of $2m. 2015 an Edison award for innovation.
and Research (“AUS Industry”). Aug Oct
Received R&D rebate of Established JV with Tytec Logistics to
GDTC has identified fifteen (15) suitable locations in 2013 $740k for FY 2013. 2015 develop technology for OTR Tyres in
Australia, from which it intends to develop at least 7 mining & Agriculture.
Dec Raised a further $4.385m of Mar Completed construction of 1st of 6
operating plants. 2014 share capital. 2016 modules for Warren plant.
The first plant is being commissioned in Warren, NSW and will Aug Received R&D rebate of Sept Produced 1st Oil from Mining Tyres
2014 $1,175k for FY 2014. 2016 using OTR prototype oven. Oil on show
take approximately 9 months to reach full operating capacity. at World Mining Expo.
GDTC is looking to raise AUD$7 million in equity to finance the Aug Received R&D rebate of Oct QUT successfully blended 20% GDT Oil
2015 $942k for FY 2013. 2016 with diesel to fuel a Cummins truck
construction of a second commercial plant in Longford, engine with no loss of power and 30%
Tasmania. reduction in NOX emissions.
Aug Received R&D rebate of Nov The QUT findings aired on the ABC
Once these initial plants have operating track record, they will 2016 $1,511k for FY 2016. 2016 catalyst programme generating
be financeable, freeing up capital, which combined with significant interest.
Dec Raised a further $6.76m of Dec Agreement reached with Southern Oil
operating surpluses, will be sufficient to build the near term 2016 share capital. 2016 to develop a process for re‐processing
pipeline of plants. sludge to improve yield.
May Successful raising of $5.5m Mar MOU signed with major Japanese
2017 via priority private placing 2017 Trading House.
and CPS Capital.
GDTC is has achieved a significant amount in its journey so farLegal Structure & Shareholdings
42
CARBON BLACK INVESTMENTS PTY LTD (“CBI”) Corporate Structure
CBI was established for the purposes of raising the initial capital
necessary to commence a R&D program to test the viability of the
technology and the building of the first test plants.
New 15.9% GDTC 26.5%
GREEN DISTILLATION TECHNOLOGIES CORP LTD (“GDTC”) Investors 15.2% Ltd 25.3%
GDTC is a public entity that has been established for the purposes of a
potential IPO currently scheduled for June 2018.
GREEN DISTILLATION TECHNOLOGIES PTY LTD (“GDT”) 100%
100%
GDT is the main asset holding entity. It owns the pilot plant and the
proof of concept plant plus all IP associated with the technology as
well as all development approvals for the Warren commercial plant. GDT GDT OTR
Pty Ltd Pty Ltd
HCI LAND PTY LTD (“HCI”)
HCI owns four parcels of land in Warren including the Banks Street
R&D site, where the existing pilot plants are located, and Oxley
Highway where the commercial plant is located. HCI owns industrial
50%
land and buildings in Stawell, VIC.
TYTEC RECYCLING PTY LTD Tytec
Tytec recycling Pty Ltd is a Joint Venture company formed to develop Recycling
and commercialise the GDT’s destructive distillation technology for Pty Ltd
oversize, off the road (OTR) tyres used in Mining and Agriculture.
Private Placement Equity Investors will become shareholders in GDTCGDTC Organization Structure
43
Board of Directors
John Fletcher (Chairman),
Craig Dunn & Trevor Bayley
Chief Executive Officer
Craig Dunn
Chief Engineering Chief Operating Supply Chain Chief Financial
Officer Officer Logistics Manager Officer
Denis Randall Trevor Bayley TBA Rob Murray
Commodity Senior Onsite Project Drafting Manager Procurement
Analysis Engineer Engineer Manager Office Manager Human Manager
Farhad Hossad Zac Cox TBA Robert Papov Resources Ritchie May
Plant Plant Plant Plant Plant Engineering
Supervisor Supervisor Supervisor Supervisor Supervisor Design Team (3)
TBA TAS QLD VIC SA
Plant Plant Plant Plant Plant
Operatives Operatives Operatives Operatives Operatives
(9)44 Financial Information
Key Financials
45
During the first five years GDTC expects to establish seven plants in Australia from a pipeline of 15 potential
plant locations.
The table below excludes the Tytec JV for OTR tyres and excludes significant commercial opportunities for the
technology in overseas markets.
Historical Forecast
Jun‐16 Jun‐17 Jun‐18 Jun‐19 Jun‐20 Jun‐21 Jun‐22
Number of Plants ‐ ‐ 0.5 1.5 2.5 4.0 6.0
Number of ELTs Processed ‐ ‐ 233,965 777,370 1,370,477 2,329,367 3,973,536
Tons of ELTs Processed ‐ ‐ 6,832 22,699 40,018 68,018 116,027
Tons of Carbon Produced ‐ ‐ 2,733 9,080 16,007 27,207 46,411
Liters of Oil Produced ‐ ‐ 4,018,696 11,925,802 19,912,770 31,826,379 47,775,927
Total Revenue ‐ ‐ 2,973,233 10,006,072 17,416,035 29,601,624 50,495,742
Revenue Growth 0% 0% 0% 237% 74% 70% 71%
Total Gross Profit ‐ ‐ 1,824,812 6,460,194 11,289,008 19,291,025 33,903,252
Gross Margin 0.0% 0.0% 61.4% 64.6% 64.8% 65.2% 67.1%
EBITDA 814,906 (916,142) (397,195) 3,301,763 7,418,339 14,618,308 28,682,328
EBITDA Margin 0.0% 0.0% ‐13.4% 33.0% 42.6% 49.4% 56.8%
NPAT 740,483 (1,037,565) (1,165,819) 1,566,862 3,111,517 6,574,849 14,695,816
Net Margin 0.0% 0.0% ‐39.2% 15.7% 17.9% 22.2% 29.1%
Earnings/Share $ 0.01 $ (0.01) $ (0.01) $ 0.01 $ 0.02 $ 0.04 $ 0.08Balance Sheet
46
Loans are paid down as soon as cash reserves permit however these may be extended in order to fund potential
international expansion opportunities. The table below excludes domestic and international Joint Ventures.
GDTC Limited Forecast Balance Sheet
Historical Forecast
ASSETS Jun‐16 Jun‐17 Jun‐18 Jun‐19 Jun‐20 Jun‐21 Jun‐22
Current
Cash & Marketable Securities 271,108 3,902,674 5,412,392 2,482,065 4,024,310 8,399,888 17,365,805
Accounts Receivable 1,537,847 278,020 484,206 1,106,756 1,712,013 3,043,579 4,842,057
Other Current Assets 204,347 (158,112) (665,129) (661,408) (501,218) (493,377) (813,970)
Total Current Assets 2,013,302 4,022,582 5,231,469 2,927,413 5,235,106 10,950,090 21,393,892
Property Plant & Equipment 179,563 182,603 10,882,603 19,813,079 29,250,245 48,596,435 68,427,622
Less: Depreciation (95,748) (114,268) (937,733) (2,470,085) (4,918,204) (8,805,492) (14,643,549)
Net Property Plant & Equipment 83,815 68,335 9,944,870 17,342,994 24,332,040 39,790,943 53,784,073
Other Non‐Current Assets 32,452,714 33,929,322 32,310,978 32,510,218 37,407,921 37,647,638 27,845,740
Total Assets 34,549,831 38,020,239 47,487,318 52,780,626 66,975,067 88,388,671 103,023,705
LIABILITIES & EQUITY Jun‐16 Jun‐17 Jun‐18 Jun‐19 Jun‐20 Jun‐21 Jun‐22
Current
Accounts Payable 1,345,332 136,926 104,234 287,472 461,288 772,937 1,118,180
Accrued Expenses 838,176 445,069 74,178 ‐ ‐ ‐ ‐
Convertible Notes 1,000,000 ‐ ‐ ‐ ‐ ‐ ‐
Total Current Liabilities 3,183,508 581,995 178,412 287,472 461,288 772,937 1,118,180
Net Debt 745,925 1,750 1,750 3,629,590 14,538,332 29,065,067 28,658,665
Total Liabilities 3,929,433 583,745 180,162 3,917,063 14,999,620 29,838,004 29,776,845
Issued & Paid up Capital 28,015,143 36,609,999 47,609,999 47,609,999 47,609,999 47,609,999 47,609,999
Retained Earnings 2,605,255 826,495 (302,844) 1,253,564 4,365,447 10,940,669 25,636,861
Total Common Stock & RE 30,620,398 37,436,494 47,307,155 48,863,563 51,975,446 58,550,668 73,246,860
Total Liabilities & Net Worth 34,549,831 38,020,239 47,487,318 52,780,626 66,975,067 88,388,671 103,023,705Revenue Drivers
47
Availability of Raw Materials: Key revenue driver is availability of raw materials (ELTs) and what level of disposal fees can be
earned from the destruction of such ELTs
Commodity Pricing: Key Revenue Driver is Commodity Pricing (Crude Oil and Steel) as these will affect the output sales
achieved. Have conservatively assumed commodity prices stay at current levels despite likely recovery in global demand.
Historical Forecast
Jun‐16 Jun‐17 Jun‐18 Jun‐19 Jun‐20 Jun‐21 Jun‐22 Jun‐23
Number of Plants ‐ ‐ 0.5 1.5 2.5 4.0 6.0 7.0
Number of ELTs Processed ‐ ‐ 233,965 777,370 1,370,477 2,329,367 3,973,536 4,642,848
Tons of ELTs Processed ‐ ‐ 6,832 22,699 40,018 68,018 116,027 135,571
Growth 0.0% 0.0% 0.0% 232.3% 76.3% 70.0% 70.6% 16.8%
Disposal Fee Revenues ‐ ‐ 1,127,244 3,745,367 6,602,957 11,222,890 19,144,496 22,369,242
Avg Disposal Fee/Tyre (2) ‐ ‐ 4.82 4.82 4.82 4.82 4.82 4.82
Growth 0% 0% 0% 232% 76% 70% 71% 17%
Tons of Carbon Produced ‐ ‐ 2,733 9,080 16,007 27,207 46,411 54,228
Tons Oil Produced ‐ ‐ 2,391 7,945 14,006 23,806 40,610 47,450
Litres of Oil Produced ‐ ‐ 2,813,087 9,346,726 16,477,968 28,007,213 47,775,927 55,823,419
Tons of Scrap Steel Produced ‐ ‐ 1,025 3,405 6,003 10,203 17,404 20,336
Total Output (Tons) ‐ ‐ 6,149 20,429 36,016 61,216 104,425 122,014
Avg Yield 0.0% 0.0% 90.0% 90.0% 90.0% 90.0% 90.0% 90.0%
Commodity Sales Revenue ‐ ‐ 1,845,988 6,260,705 10,813,078 18,378,733 31,351,246 36,632,125
Avg Rev per Ton of Output ‐ ‐ 300.2 306.5 300.2 300.2 300.2 300.2
Growth 0.0% 0.0% 0.0% 0.0% 0.0% 0.0% 0.0% 0.0%
Other Revenues (1) 1,511,715 ‐ ‐ ‐ ‐ ‐ ‐ ‐
TOTAL REVENUES 1,511,715 ‐ 2,973,233 10,006,072 17,416,035 29,601,624 50,495,742 59,001,367
(1)
This relates to R&D tax refund in Jun‐16
(2)
These are disposal fees paid by tyre collectors to GDTCMargin Drivers – Gross Margin
48
Gross Margin is expected to improve as the Company Grows:
Variable Operating Cost: Comprised of utilities/energy costs and repairs & maintenance costs (all of which are
assumed to grow at 2.5% p.a.)
Plant Payroll Cost: Comprised of Onsite Personnel necessary to operate each plant (assumed to grow at 2.5% p.a.)
Plant Insurance, Security, Rent and Property Tax Costs: Typical plant specific fixed costs (assumed to grow a 2.5% p.a.)
Historical Forecast
Jun‐16 Jun‐17 Jun‐18 Jun‐19 Jun‐20 Jun‐21 Jun‐22
Total Revenue 1,515,144 ‐ 2,973,233 10,006,072 17,416,035 50,495,742 59,001,367
Plant Operating Capacity (1) 0.00% 70.00% 80.00% 82.50% 88.00% 100.00%
Variable Operating Cost 0 466,519 1,611,333 2,836,384 4,963,311 8,667,240
Plant Payroll Cost 0 531,939 1,607,629 2,744,110 4,501,728 6,917,851
Plant Insurance 0 124,659 212,784 349,074 536,425 640,816
Security 0 0 62,278 102,168 157,003 187,556
Rent Expense 0 25,304 51,854 95,291 152,132 179,027
Property Taxes (Rates) 0 0 0 0 0 0
Gross Profit ‐ ‐ 1,824,812 6,460,194 11,289,008 40,185,143 42,408,877
Gross Margin 0.0% 61.4% 64.6% 64.8% 79.6% 71.9%
Variable Op Cost/ELT (Ton) ‐ ‐ 68.3 71.0 70.9 73.0 74.7
Growth 0.0% 0.0% 0.0% 4.0% ‐0.2% 3.0% 2.4%
Plant Payroll Cost/Plant ‐ ‐ 1,055,589 1,075,020 1,098,976 1,128,003 1,154,730
Growth 0.0% 0.0% 0.0% 1.8% 2.2% 2.6% 2.4%
Plant Ins Cost/Plant ‐ 49,955 53,277 58,268 76,632 91,545
Growth 0.0% 0.0% 0.0% 6.7% 9.4% 31.5% 19.5%
(1)
For conservatism, the projection assumes the plants operate at reduced capacity in certain yearsYou can also read