2019 ESG TRENDS TO WATCH - January 2019 - ETicaNews
←
→
Page content transcription
If your browser does not render page correctly, please read the page content below
— GENERAL —

                                               RESEARCH INSIGHT

              2019 ESG TRENDS TO
              WATCH
Linda-Eling Lee, Matt Moscardi

January 2019

                                                    JANUARY 2019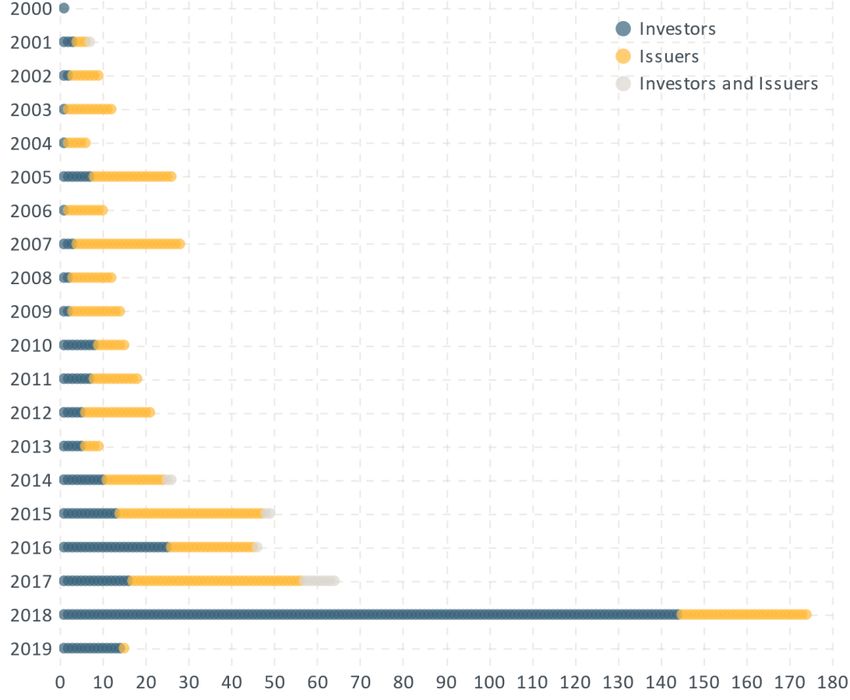
— GENERAL —

                                                                                        2019 ESG TRENDS TO WATCH | JANUARY 2019

EXECUTIVE SUMMARY

          Trade wars.1 Technological disruption.2 Political dysfunction.3 Rising volatility4
          and vulnerability.5 The beginning of 2019 has already been described in a
          multitude of ways, but the overarching themes coming forth tend to follow a
          clear narrative: The bull market may be ending, and everyone is bracing for the
          long haul.6

          For an ESG investor, the long haul already has started. Underlying many of the
          2019 themes are potentially overlooked costs and opportunities, and our 2019
          ESG Trends to Watch have one thing in common: Acting today could make the
          difference tomorrow.

          “JUST ONE WORD: PLASTICS” – MR. MCGUIRE, THE GRADUATE (1967)
          In 2019, companies and investors are forced to contend with the new reality:
          Waste reduction isn’t a marketing priority; it’s a business challenge.

          “WELCOME TO THE PARTY, PAL!” – JOHN MCCLANE, DIE HARD (1988)
          In 2019, the script flips, and it isn’t just companies that are fielding ESG-related
          disclosure requirements. Investors will see escalating demands as regulators
          ramp up scrutiny beyond primarily issuers to focus on the business of ESG
          investing.

          © 2019 MSCI Inc. All rights reserved. Please refer to the disclaimer at the end of this document.   MSCI.COM | PAGE 2 OF 32
— GENERAL —

                                                                              2019 ESG TRENDS TO WATCH | JANUARY 2019

“I WISH IT NEED NOT HAVE HAPPENED IN MY TIME” – FRODO BAGGINS, THE
FELLOWSHIP OF THE RING (1954)
In 2019, we will see the end of the argument that time is on our side. Nowhere
will it be more evident than in private assets like real estate.

“…KNOW WHY YOU OWN IT” – PETER LYNCH, ONE UP ON WALL STREET (1989)
In 2019, as we look out onto the next decade for ESG Ratings, having more data
will be the easy part. The hard part – and the important part – will be knowing
how to identify and apply the most relevant signals and achieve better-
differentiated investment objectives.

“THE CEO IS THE LINK BETWEEN THE INSIDE THAT IS ‘THE ORGANIZATION,’
AND THE OUTSIDE OF SOCIETY, ECONOMY, TECHNOLOGY, MARKETS, AND
CUSTOMERS.” – PETER DRUCKER (2004)
In 2019, investors stop asking after a scandal, “What did the board know, and
when did they know it?” and start asking before a scandal hits, “What are my
rights?”

With contributions from Michael Disabato, Ric Marshall, Gillian Mollod, Gaurav
Trivedi

© 2019 MSCI Inc. All rights reserved. Please refer to the disclaimer at the end of this document.   MSCI.COM | PAGE 3 OF 32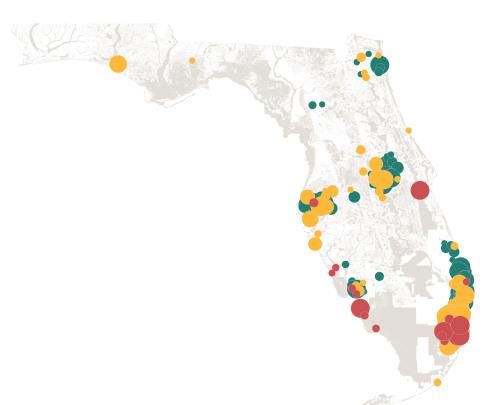
— GENERAL —

                                                                                  2019 ESG TRENDS TO WATCH | JANUARY 2019

1   “JUST ONE WORD: PLASTICS” – MR. MCGUIRE, THE GRADUATE (1967)
    Filmgoers may have chuckled at Mr. McGuire’s attempt to give advice to a
    waylaid Benjamin Braddock, but he was right: The plastics industry was rising in
    material dominance.7

    Today, plastic is one of the most-produced manmade products in the world.8 An
    estimated 8.3 billion metric tons of virgin plastics (synthetic organic polymers)
    have been produced in the past 70 years,9 79 percent of which has accumulated
    in landfills or the natural environment.10 Its ubiquity has become so disruptive
    that the UN Environmental Programme (UNEP) declared that “unless we take
    action, there will be more plastic [in the ocean] than fish by 2050.”11

    In fact, in 2019, we anticipate this disruption will change the global regulatory
    landscape, forcing companies to grapple with waste reduction not as a
    marketing priority but a significant business challenge.

    Why do we think this will happen now? Because China exited the thriving global
    trade in waste.

    Previously, countries that couldn’t repurpose or handle their own garbage
    exported it to other countries, mostly in Asia. China, for example, together with
    Hong Kong, was importing an estimated 70 percent of the annual waste
    produced globally since 1992.12

    Then China sent a shock wave through the global waste trade by notifying the
    World Trade Organization (WTO) that it would stop accepting 24 kinds of solid
    waste beginning Jan. 1, 2018 – including the prevalent forms of plastic waste
    exported.13

    In the wake of China’s decision, exporting countries scrambled to find new
    markets for their waste. Immediately, imports of plastic trash increased by 56
    percent in Indonesia, 100 percent in Vietnam and 1,370 percent in Thailand in
    the first half of 2018. The tsunami of foreign waste triggered waste-import bans

    © 2019 MSCI Inc. All rights reserved. Please refer to the disclaimer at the end of this document.   MSCI.COM | PAGE 4 OF 32
— GENERAL —
2019 ESG TRENDS TO WATCH | JANUARY 2019
in Thailand14 and Malaysia,15 with more countries, including Poland and Turkey,16
considering similar restrictions to stem the flow.
Correspondingly, major trash-exporting countries, including the U.K., Germany
and France, moved to curb their waste production, initially focusing on single-
use plastics. The European Parliament, for example, voted in late 2018 to ban
single-use plastics by 2021, including a requirement to recycle more than 90
percent of beverage bottles by 2025.17 The U.K. could impose a similar ban as
early as 2019.18
Companies have taken notice. The number of earnings calls in 2018 that
mentioned “plastic waste” increased by 340 percent compared with 2017.19
Some of the more vulnerable industries, like the restaurant industry (especially
fast-food chains) and food and beverage manufacturers (particularly the soft-
drink industry), rely extensively on single-use paper cups or plastics. Yet only 30
percent of the industry constituents in the MSCI ACWI Index as of Dec. 31, 2018,
had declared a formal commitment toward reducing or phasing out plastic
waste. Companies in the packaging sector like Amcor and Sealed Air, with a
sizable amount of their revenue coming from plastic materials as of Dec. 31,
2018,20 declared a formal commitment toward reducing or phasing out plastic
waste. These companies, tied to both plastic packaging and to the EU, are likely
exposed to any regulatory changes for packaging in Europe.
But it isn’t just the obvious sectors that could be affected. When we used a
natural-language processing technique to analyze regulatory filings of the 2,450
constituents of the MSCI USA IMI (as of Dec. 12, 2018), we identified as many as
12 relevant industries potentially exposed to malfeasant rubbish, including
Agricultural Products and Office Services and Supplies. Such companies include
Fresh Del Monte Produce, which uses plastic packaging for both its existing and
under-development products, and Ingredion, which relies on plastic users to
purchase their value-added materials.1
1
Screening criteria: (a) more than three companies in GICS subindustry and (b) 25 percent or more companies in the GICS
subindustry with greater than 0.1 cosine similarity to the plastic-related keywords in company 10-Ks, focusing on the
pertinent sections of the reports: Business, Risk Factors, Management’s Discussion, Analysis of Financial Condition and
Results of Operations. Notably one of the GICS sub-industries didn’t meet the minimum companies in industry screening
criteria but had high exposure, and Newell Brands and Tupperware Brands had 100 percent of their product lines
exposed to these issues.
© 2019 MSCI Inc. All rights reserved. Please refer to the disclaimer at the end of this document. MSCI.COM | PAGE 5 OF 32— GENERAL —
2019 ESG TRENDS TO WATCH | JANUARY 2019
Exhibit 1: More companies will potentially be exposed to plastic and plastic-
related regulation beyond the obvious industries
Based on analyzing the most recently released annual filings as of Dec 12, 2018, of the 2,450 MSCI USA IMI constituents.
The assessment identified companies within each sub-industry group that referenced key phrases and terms related to
plastic waste and plastic-waste recycling in their disclosures. Source: MSCI ESG Research
Companies in these sectors will likely be looking for solutions, providing an
opening for winners to emerge. Packaging innovations, such as biodegradable,
fiber-based renewable packaging, or paper, will likely be further developed to
meet the demand from at-risk companies. Already, there has been an uptick in
revenue for those companies in the Container and Packaging industry of the
MSCI ACWI Index with a majority of their revenue made from innovative paper-
based packaging solutions. All have seen a steady increase in their quarterly
revenue since the first quarter of 2016,2 while their plastic-packaging peers
(those with a majority of their revenue from plastic-based packaging solutions)
have seen a corresponding decrease in revenues. It seems a systemic shift has
begun.
2 See Appendix A
© 2019 MSCI Inc. All rights reserved. Please refer to the disclaimer at the end of this document. MSCI.COM | PAGE 6 OF 32— GENERAL —
2019 ESG TRENDS TO WATCH | JANUARY 2019
While all eyes remain on the trade war between the U.S. and China, another
global trade war, in waste, is beginning to unfold. How the world addresses the
disruption it creates will have ripple effects across multiple industries and
countries, ripping the issue from the pages of glossy sustainability reports and
thrusting it into investor presentations and financial filings as a subject of
business risks and opportunities. And in 2019, we anticipate seeing a globalized
world forced to look locally for solutions on how to deal with waste.
© 2019 MSCI Inc. All rights reserved. Please refer to the disclaimer at the end of this document. MSCI.COM | PAGE 7 OF 32— GENERAL —
2019 ESG TRENDS TO WATCH | JANUARY 2019
2 “WELCOME TO THE PARTY, PAL!” – JOHN MCCLANE, DIE HARD (1988)
In Australia, the Modern Slavery Act – passed in December 2018 – calls for
companies to take action on modern-slavery risks in the operations and supply
chains.3 The U.K. instituted disclosure of the gender pay gap; Japan of gender
composition, retention and promotion of corporate staff. Even Malaysia and
Thailand are in on the action, with updates to corporate governance codes; in
Malaysia’s case, companies now have to “comply or offer an alternative” rather
than “comply or explain.” Companies have been the target of regulators for ESG
topics since as early as 1838, when the Dutch government mandated that
information about the environmental and human-capital risks they faced were to
be disclosed in annual reports. In fact, company- or issuer-focused regulations
brought by policy makers outnumber investor-focused regulations by almost 2.5
to 1.21
In 2019, the script flips, and it isn’t just companies that are fielding ESG-related
disclosure requirements. We anticipate that investors, both asset owners and
asset managers, will see escalating demands as regulators ramp up scrutiny
beyond primarily issuers to focus on the business of ESG investing. Are
institutional investors prepared?
Historically, investors generally have welcomed regulatory and quasi-regulatory
measures that target issuers, as most of these regulations led to improved data
disclosure and transparency on their portfolio companies. In fact, some
institutional investors actively seek regulators to weigh in – exemplified by the
investor-led efforts in October 2018 to petition the U.S. Securities and Exchange
Commission to codify rules on ESG disclosure.22 And an Ernst & Young survey of
220 global institutional investors found 70 percent wanted regulators to close
the gap between what issuers disclose and what investors want in terms of ESG
data.23 Even in relatively opaque markets such as in China, the requirement
imposed by the China Securities Regulatory Commission (CSRC) and the Ministry
of Ecology for mandatory ESG disclosures by all listed companies and bond
issuers has usually met with approval from investors, as they may otherwise lack
3
This follows the UK Modern Slavery Act adopted in 2015.
© 2019 MSCI Inc. All rights reserved. Please refer to the disclaimer at the end of this document. MSCI.COM | PAGE 8 OF 32— GENERAL —
2019 ESG TRENDS TO WATCH | JANUARY 2019
confidence in the governance oversight of these issuers.24 The growth in
regulations broadly – illustrated in Exhibit 2 – has been exponential, with as
many new regulations and quasi-regulations proposed in 2018 as passed in the
prior six years.
Exhibit 2: Number of ESG regulations has increased since 2000
Regulations collected by MSCI and the UN PRI’s ESG regulations database; regulations can be either
mandatory, voluntary, or explanatory in nature – and are collected globally. Source: MSCI ESG Research, UN
PRI, as of Jan. 15, 2019.
The regulations in Exhibit 2 are broken out into investor and issuer targets. What
is evident is that ESG-focused regulatory attention is turning increasingly toward
investment products and processes used by investors. Of the more than 170
regulatory or quasi-regulatory measures proposed in 2018, 80 percent of them
© 2019 MSCI Inc. All rights reserved. Please refer to the disclaimer at the end of this document. MSCI.COM | PAGE 9 OF 32— GENERAL —
2019 ESG TRENDS TO WATCH | JANUARY 2019
target institutional investors, not issuers. Aggregating country-level assets under
management (AUM) data from PwC, Boston Consulting and others indicates that
there could have been as much as USD 32.6 trillion in AUM as of 2018, subject to
regulations now under discussion for asset managers and asset owners alike.4
Whether global investors will support these measures with the same vigor as
they did for those imposed on issuers, will likely depend on the regulation – and
the investor.
A number of measures seek to clarify the roles and duties of investors – mostly
those of large asset owners – and financial institutions that can reduce the
amount of second-guessing about ESG’s treatment in their investment
processes. The most prescriptive of these measures include those of the U.K.
Department for Work and Pensions, which announced in September 2018
updated regulations25 to clarify trustees’ duty to consider all material issues
“whether those are traditional, such as company performance, interest or
exchange rates, or broader such as those resulting from ESG considerations
including climate change.”5 In 2019, a similar clarification on considering ESG
risks as a part of fiduciary duty will be included in a wide-ranging set of
Sustainable Finance Initiative proposals that will be voted on by the European
Commission.6
In jurisdictions such as Ontario, Canada, the requirement is less prescriptive and
more descriptive. There, institutional investors are required only to disclose how
they account for ESG factors, if they account for them at all.26 And then there is
4 Data on country-level assets under management from PwC, Boston Consulting, IFIC, the Korea Herald and Nomura
Research as of 2017 and 2018. We added estimates of AUM for China, Canada, South Africa, Japan, EU members and
South Korea, given pending regulations in each, to estimate a global AUM number. Sources: PwC, Boston Consulting,
Investment Funds Institute of Canada, Nomura Research, Korea Herald
5
In the UK, financial regulators – the Financial Conduct Authority (FCA), the Pensions Regulator (TPR), the Financial
Reporting Council (FRC) and the Prudential Regulation Authority (PRA) -- also announced that they will start to report
how pension schemes and other companies under their remit are addressing climate risk. The PRA had launched a
consultation on a draft supervisory statement that sets out its expectations for firms managing financial risks from
climate change. https://www.bankofengland.co.uk/-/media/boe/files/prudential-regulation/consultation-
paper/2018/cp2318.pdf?la=en&hash=8663D2D47A725C395F71FD5688E5667399C48E08
6
The stated goals of the Sustainable Finance Initiative are: (i) reorienting capital flows towards sustainable investment in
order to achieve sustainable and inclusive growth, (ii) assessing and managing relevant financial risks stemming from
climate change, resource depletion, environmental degradation and social issues, and (iii) fostering transparency and
long-termism in financial economic activity. These proposals will be a major focus of regulatory and investor activity on
ESG topics in the EU through 2019. See Appendix B.
© 2019 MSCI Inc. All rights reserved. Please refer to the disclaimer at the end of this document. MSCI.COM | PAGE 10 OF 32— GENERAL —
2019 ESG TRENDS TO WATCH | JANUARY 2019
the U.S., where ESG considerations can be interpreted to be more restrictive.
The Department of Labor (DOL) issued guidance27 to clarify that funds governed
by the Employee Retirement Income Security Act of 1974 (ERISA), such as
corporate pension funds, can only consider ESG factors when they are
economically relevant.28
What about the retail market, where interest in ESG investing also has grown
substantially? The European Commission is proposing that investment advisers
ask clients directly about their sustainability preferences, “and take them into
account when assessing the range of financial instruments and insurance
products to be recommended.”29 That should get the conversation started.
Given additional consultations from regulatory bodies such as the European
Securities and Markets Authority (ESMA),7 the reach into retail investments
could eventually be highly significant.
While these clarifications could be seen positively by some institutional investors
as they navigate between what they can do versus what they should do in
considering ESG factors across diverse jurisdictions, regulatory efforts aimed at
classifying ESG investment products could be more equivocal and contentious,
particularly for asset managers.
If done well, efforts such as those being proposed by the European Commission
to create a taxonomy for sustainable finance or to institute standards for what
can be considered “green” relative to green bonds can also support the
development of the market for ESG investments. Setting some minimum
standards can create trust by enabling comparison across investment offerings,
increasing transparency and limiting potential “greenwashing.”
Done poorly, hard lines drawn about what can or cannot be considered ESG,
green or sustainable could stifle the diversity of choices available and the
innovation happening now in a market that is evolving rapidly to meet the many
goals and approaches that investors seek. New business models and
technological solutions could emerge tomorrow that could be magnitudes better
than what qualifies as green in today’s criteria. Conversely, digital privacy or
7 TheEuropean Securities and Markets Authority (ESMA) announced three public consultation on 19 December 2018, two
of which seek input into the integration of ESG risks into MiFID II, AIFMD and UCITS directive.
https://www.schjodt.no/en/news/newsletters/integrating-sustainability-into-aifmd-and-the-ucits-directive/
© 2019 MSCI Inc. All rights reserved. Please refer to the disclaimer at the end of this document. MSCI.COM | PAGE 11 OF 32— GENERAL —
2019 ESG TRENDS TO WATCH | JANUARY 2019
cybersecurity are risks today that many investors incorporate, but would have
been difficult to account for as important ESG criteria five or 10 years ago.
Further, some investors intentionally seek to create value by holding companies
with poor ESG practices and engaging with them intensively to improve their
performance.
In practice, it may be difficult to strike a balance between creating a standard to
prevent a free-for-all on what counts as sustainable, and reducing the
opportunity set for investors seeking a variety of innovative approaches to
achieve a more sustainable economy and investments. Drawing on our own
experience, when we consulted in 2018 with more than 20 clients representing
USD 9.5 trillion-plus in assets on how best to construct a useful ESG rating for
funds, we found that one of the top concerns expressed was how to avoid
greenwashing30 and allowing some funds to appear strong on ESG risk
management without proper manager diligence or stated intentions. While
there was consensus that providing a fund-level signal aids fund selection and
flows to ESG investments, even criteria as basic as whether negative screening
(removing a company, sometimes for moral reasons) should constitute strong
“ESG” engendered much debate. As industry experts are still developing various
ESG approaches, it will be important to allow flexibility in designating standards.
In 2019, we anticipate that regulatory developments will escalate around ESG
investments, rather than ESG disclosures for issuers. For investment institutions
that have treated ESG from a narrow, thematic point of view, applying ad hoc
divestments or other theme-style offerings, 2019 may well be a year to play
catch-up, as measures governing investors’ roles and duties compel the
development of investment policies that address ESG more holistically as an
investment-relevant risk.
© 2019 MSCI Inc. All rights reserved. Please refer to the disclaimer at the end of this document. MSCI.COM | PAGE 12 OF 32— GENERAL —
2019 ESG TRENDS TO WATCH | JANUARY 2019
3
“I WISH IT NEED NOT HAVE HAPPENED IN MY TIME” – FRODO BAGGINS, THE
FELLOWSHIP OF THE RING (1954)
In the latest Intergovernmental Panel on Climate Change (IPCC) report on the
impacts of global warming, one line among many might give investors pause:
“Transition challenges as well as identified trade-offs can be reduced if global
emissions peak before 2030 and marked emissions reductions compared to
today are already achieved by 2030” (emphasis added).31 If not, by 2040, the
atmosphere’s temperature will have risen by 2.7 degrees Fahrenheit (1.5
degrees Celsius), inundating coastlines and intensifying drought, poverty and
subsequent migration.
It is a finding that converges the time horizons for science and investment – and
puts investors on a timeline in which investment allocations made in 2019 will
need to, at times, account for an accelerated carbon transition, or accelerated
climate-related impacts, before they finish paying out.
Building a portfolio that incorporates the question of climate – particularly the
reality of a 2-degree-constrained world – can reflect diverse intents. Some
investors aim to push toward a 2-degree world by allocating their capital in ways
that can raise the cost of capital for high emitters or that can provide market-
signaling to them that change is needed. Others are simply trying to avoid the
downside risks of holding assets that lose value in an economy that is less
carbon-intensive.
It’s the difference between trying to change the future or avoid potential future
losses. In either case, the underlying assumption is the same: Some combination
of technology and policy forces will limit emissions going forward, such that we
© 2019 MSCI Inc. All rights reserved. Please refer to the disclaimer at the end of this document. MSCI.COM | PAGE 13 OF 32— GENERAL —
2019 ESG TRENDS TO WATCH | JANUARY 2019
can avoid the worst outcomes of climate change. We will eventually adopt a
route to long-term prosperity.
Or, for various, myopic reasons, we won’t.
It’s a possibility working its way into investor thinking in 2019, especially for
those investing in less liquid assets. While public-equity investors may not see
the price implications of climate change reflected immediately, valuing a variety
of other investments is routinely pegged to longer-term time frames. For
example, many companies budget for new projects by using 10-year Treasury
bond rates to set their cost-of-capital expectations.32 According to the Energy
Information Administration (EIA), lease operating expenses for drilling often are
incurred over a 20-year period, if not longer.33 Sports-jersey licensing deals often
span eight to 10 years, such as Nike’s deal extension with the U.S. National
Football League (NFL), signed in 2018.34
Many investments take shape in a time frame that flirts dangerously with the
IPCC’s projected time span before emissions need to peak and before an
acceleration toward climate calamity. Within the lock-up periods of some types
of private investments, many could see their projects implicated in climate-
related problems and facing enhanced regulations before their payout. Among
these are real estate investments.
We estimate the total size of the professionally managed global real estate
investment market to be USD 8.5 trillion, as of the end of 2017.35 Real estate
investors already are exposed to possible losses due to sea-level rise: A study by
the University of Colorado Boulder and Pennsylvania State University found
properties exposed to sea-level rise selling at a 7-percent discount relative to
comparable but less-exposed properties across the U.S.36 And real estate
investors are often buying – or even leasing – assets today with useful lives that
extend far into a changed climate world.
We examined the possible effects that the IPPC’s new recommended timeline
could have on real estate assets, using a small sample of aggregated MSCI Real
Estate data that focuses on Florida, where the effects of climate change are
expected to be dramatic.37
© 2019 MSCI Inc. All rights reserved. Please refer to the disclaimer at the end of this document. MSCI.COM | PAGE 14 OF 32— GENERAL —
2019 ESG TRENDS TO WATCH | JANUARY 2019
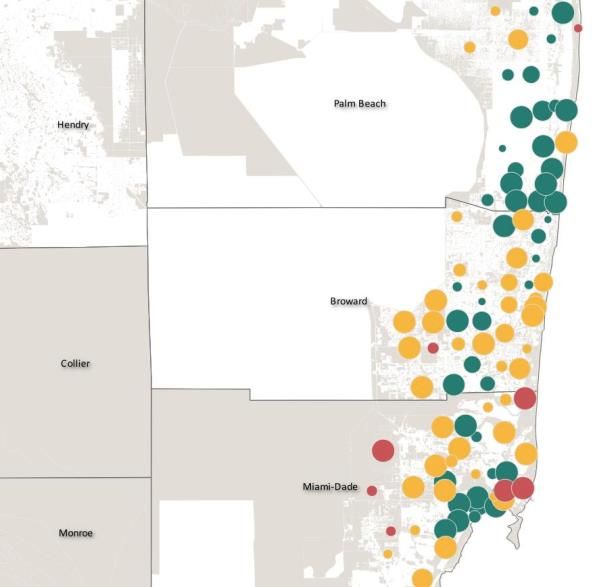
Exhibit 3: Florida will have different risks and opportunities as sea level begins
to inundate coastlines over the next decades
Legend
Properties in High Flood Risk
Properties in Moderate Flood Risk
Properties in Low Flood Risk
FEMA Flood Zones
High flood-zone pertains to ZIP codes with 66 percent or greater of landmass in a flood zone as defined by
FEMA; Moderate flood-zone pertains to ZIP codes with greater or equal to 33 percent and less than 66
percent of landmass in a flood zone as defined by FEMA; low flood-zone pertains to ZIP codes with 33
percent or less of landmass in a flood zone as defined by FEMA. Source: MSCI ESG Research, MSCI Real
Estate Database (IPD) for Florida real-estate, as of Dec. 31, 2018
Exhibit 3 highlights the 456 commercial real estate properties in our sample
which are located in approximately 200 Florida ZIP codes representing USD 22
billion in capital value. It is separated into “high,” “moderate” and “low” flood
risk, as defined by the MSCI ESG research team using data from the Federal
Emergency Management Agency’s (FEMA) National Flood Hazard Layer (NFHL)
geospatial database.
Mapping the assets in aggregate already shows the potential scope of the
problem – 51 percent of the assets find themselves in the vanguard of rising seas
representing approximately USD 10 billion in capital value. But examining the
properties by asset construction dates is even more alarming. If “high” to
“moderate” flood-risk zones are likely to be inundated by sea-level rise in 2040,
© 2019 MSCI Inc. All rights reserved. Please refer to the disclaimer at the end of this document. MSCI.COM | PAGE 15 OF 32— GENERAL —
2019 ESG TRENDS TO WATCH | JANUARY 2019
we can see that approximately one in five of these mapped commercial assets
was constructed in a flood-prone ZIP code after the year 2000, representing USD
4.4 billion in capital value. This means these properties will likely be affected by
sea-level rise before the end of their usable life, using the average lifespan of a
commercial property estimated at 50 years.
For some investors, though, it may not all be doom and gloom. In 2010, Michael
Burry, the former head of Scion Capital made famous by the book The Big Short,
invested in something curious at the time: agricultural land with water
rights.38 “A bottle of wine takes over 400 bottles of water to produce — the
water embedded in food is what I found interesting,” said Burry. In 2018, it was
reported that Harvard University was accruing vineyards in California – all with
water rights.39 Saudi Arabia is buying agricultural land,40 and Canadian-farmland
investors are finding new sources of revenue as the growing season has been
extended by weeks because of rising temperatures.41
In accordance with the opportunists, we can use our data from Florida in Exhibit
3 to isolate two factors investors may already be seeking: Land and
elevation. Low-rent properties at higher elevations adjacent to flood-prone areas
or places affected by sea-level rise could potentially increase in value over its
lifespan as buyers, lessors and consumers migrate inland.42 We estimate that 12
percent of the low-risk properties in the Florida data set, representing USD 3.7
billion in capital value, are less than halfway through their useful life and selling
at lower-than-average returns as of Sep. 2018. As the seas rise due to global
warming, inland-migration or burdensome flood-related costs (like insurance or
cleanup and adaptation costs) could drive up the price for a subset of properties
such as these.
There is much more at stake for investors in 2019 than those in the real estate
sphere. The U.S. National Climate Assessment report issued in November 2018
directly linked recent extreme weather events to changes in the climate, and
projects that the economic impact from climate change could be double the
impact of the Great Recession.43 But the pinch may happen faster in some places
than in others, with real estate as a prime example of an asset class that will
inevitably be impacted by climate in the next decade. While private assets like
real estate may be the tip of the spear, eventually all assets may have to be
judged by the same question: Where are the winners and losers in my portfolio?
© 2019 MSCI Inc. All rights reserved. Please refer to the disclaimer at the end of this document. MSCI.COM | PAGE 16 OF 32— GENERAL —
2019 ESG TRENDS TO WATCH | JANUARY 2019
4 “…KNOW WHY YOU OWN IT” – PETER LYNCH, ONE UP ON WALL STREET (1989)
Thirty years ago, Peter Lynch, then a vaunted Fidelity fund manager, famously
said, “know what you own...”44 in his book One Up on Wall Street.
Overshadowed is the second half of what he said: “…and why you own it.”
The “big data” revolution already has helped investors answer the first half of
Lynch’s statement. But in 2019, investors will turn their attention from data
proliferation to signal proliferation, recognizing that the value of ESG data as a
relevant factor depends as much on knowing why they own something as on
knowing what they own.
Deeper understanding of investor portfolios and the drivers behind their
performance has been greatly facilitated by the increased availability of
disparate new data sources, from satellite imagery of parking-lot activity to job-
posting and land-use data.45 And there will be even more: IBM has estimated
that 90 percent of data in use today was created in just the last two years.46
ESG investing has been a major beneficiary of this explosion of new data sources.
Looking back at the past decade since Innovest launched its updated “IVA
Ratings” model in 2008 (predecessor to the MSCI ESG Ratings), contextual,
alternative data has always been used alongside voluntary corporate-disclosure
data to assess companies’ exposure to ESG risks. The use of alternative data was
necessary because disclosure alone was so sparse and could tell investors
relatively little about companies’ latent and emerging ESG risks.
Consider the example of companies’ product safety performance. Fewer than 1
percent of companies in the Autos, Pharmaceutical and Food industries disclose
comprehensive information on product safety recalls, with between 17 percent
to 54 percent providing only some comments on a few, select incidents. Hence,
as Exhibit 4 shows, the vast majority of product safety lapses are identified
© 2019 MSCI Inc. All rights reserved. Please refer to the disclaimer at the end of this document. MSCI.COM | PAGE 17 OF 32— GENERAL —
2019 ESG TRENDS TO WATCH | JANUARY 2019
through text-mining of sources such as local regulatory databases,
nongovernmental organizations (NGO), industry and media.8
Exhibit 4: Identifying companies with product recalls requires many more data
sources beyond company disclosure
“n” references the companies flagged for product recalls. Source: MSCI ESG Research, MSCI ACWI as of 20 Dec 2018
The “big data” revolution has allowed investors to become less reliant on
voluntary corporate disclosure, as the universe of ESG information from
alternative sources continues to expand at a pace that far exceeds
improvements in voluntary disclosure (see examples in Exhibit 5).
But data alone – structured or unstructured, alternative or company-disclosed –
does not address the second half of Mr. Lynch’s maxim: “…know why you own
it.” And it is the “why” question that can best help investors make sense of all
this data and extract the most relevant signals.
8Examples of sources for information on pharmaceutical recalls: US: Food and Drug Administration (FDA);
Canada: Health Canada; China: China Food and Drug Administration (CFDA); United Kingdom: Medicines
and Healthcare Products Regulatory Agency (MHRA); Australia: Therapeutic Goods Administration (TGA);
and Japan: Pharmaceuticals and Medical Devices Agency (PMDA)
© 2019 MSCI Inc. All rights reserved. Please refer to the disclaimer at the end of this document. MSCI.COM | PAGE 18 OF 32— GENERAL —
2019 ESG TRENDS TO WATCH | JANUARY 2019
Exhibit 5: Examples of what investors can know about companies’ ESG risks
and opportunities without voluntary disclosure
Source: MSCI ESG Research
In 2008, Nate Silver used what he called a “big soup of polling”47 to create his
startlingly accurate ratings of that year’s elections. His was a discrete goal: to
predict the outcome of highly unpredictable elections at scale. Yet even after his
forecasts in 2008 were validated by election results, skeptics derided Silver’s
process as “merely political punditry dressed up as sophisticated mathematical
thinking.”48 We see a similar chorus of “caveat emptor” today when it comes to
ESG ratings. Skeptics downplay emerging research supporting49 the financial
relevance of ESG ratings, such as evidence that high ESG-rated companies
tended to show higher profitability, higher dividend yield and lower idiosyncratic
tail risks (from January 2007 to May 2017).50 They continue to demand bigger
and better data, and promote the idea that better data would lead to one single
true “unified” ESG signal. But the data alone, no matter how big, cannot tell
investors how to apply them if they lack an investment thesis. In 2019, as
© 2019 MSCI Inc. All rights reserved. Please refer to the disclaimer at the end of this document. MSCI.COM | PAGE 19 OF 32— GENERAL —
2019 ESG TRENDS TO WATCH | JANUARY 2019
investors become more familiar with the ESG data landscape, the most
successful will be those who recognize that they have an advantage only if they
have a clear view and construct a signal to match.
Unlike Nate Silver and his election predictions, the signals extracted from the
“big soup” of ESG data serve not one goal, but rather a panoply. For some
investors, the core objective is to identify emerging risks and opportunities and
maximize long-term investment returns. For others, it is to identify positive
social or environmental impacts, or to match investments with moral values. Not
all “ESG ratings” or other rankings labeled as “ESG” aim to achieve the same
goal, nor are they equally effective in achieving their particular goal. Different
methodologies lead to uncorrelated signals.
ESG ratings today serve as a reference for a growing number of investors – a
common language for measuring the long-term resilience of companies and their
ability to manage emerging ESG risks and opportunities. For many investors, it
also provides a foundation on which to add value, building on the ratings signal
to better realize their unique form of differentiation. More and more investors
are marrying disparate metrics, like factors and ESG,51 in ways that reflect
competitive differentiation and diverse investment beliefs.
In that sense, the rise of ESG has coincided with a rise in other, new investment
metrics. Factors and “smart beta” concepts give the markets attributes that
investors can pick and choose to assert their own worldview. Increasingly,
technological solutions that deploy artificial intelligence are making it easier to
find ever more patterns in big data that can be used alongside existing
investment signals.52
The mainstreaming of ESG is just an indicator of this larger change – a move to
understand how best to extract signals from a proliferation of ever-bigger data,
signals that can best answer the “why” for a given investor. In 2019, as we look
out onto the next decade for ESG Ratings, having more data will be the easy part.
The hard part – and the important part – will be knowing how to identify and
apply the most relevant signal and achieve better-differentiated investment
objectives.
© 2019 MSCI Inc. All rights reserved. Please refer to the disclaimer at the end of this document. MSCI.COM | PAGE 20 OF 32— GENERAL —
2019 ESG TRENDS TO WATCH | JANUARY 2019
5 “THE CEO IS THE LINK BETWEEN THE INSIDE THAT IS ‘THE ORGANIZATION,’
AND THE OUTSIDE OF SOCIETY, ECONOMY, TECHNOLOGY, MARKETS, AND
CUSTOMERS.” – PETER DRUCKER (2004)
It might have been hard for Peter Drucker to imagine the world as it is today,
with no internal memos; now, virtually everything is external. It is no secret that
corporate leadership is under increased scrutiny, and that every gaffe can end up
as part of a news cycle or viral tweet. The disintegration of walls between the
executive suite and markets, governments and even employees has not just
exposed corporate leadership to potential reputational damage. It also has
opened investors to new vulnerabilities, as company after company has been
shaken by revelations of questionable conduct at best, or illegal activities at
worst.
But in 2019, we anticipate investors will stop asking after a scandal, “What did
the board know, and when did they know it?” and start asking before a scandal
hits, “What are my rights as shareholders?”
If ever there was a wake-up call it was the case of Liu Qiangdong, founder of
China’s largest online retailer, JD.com.53 As Mr. Liu sat in jail on allegations of
rape on Sept. 2, 2018,54 investors could choose either to ride the sharp drop in
stock price55 or divest. Their minimal rights as shareholders precluded any
resolute action.56 And the situation was made worse as the company had not
held a shareholder meeting since listing on the NASDAQ in 2014,57 nor was it
required to do so, according to its bylaws.58 When prosecutors ultimately chose
to drop charges almost four months later, it hammered home the fact that
shareholders had little recourse but to follow the company’s headlines, along
with the rest of the world.
Mr. Liu’s case is just one example of many executive scandals at this point: Les
Moonves of CBS, Steve Wynn of Wynn Resorts and Carlos Ghosn of Renault and
Nissan; the list grows steadily. Our own data on companies implicated in ESG-
© 2019 MSCI Inc. All rights reserved. Please refer to the disclaimer at the end of this document. MSCI.COM | PAGE 21 OF 32— GENERAL —
2019 ESG TRENDS TO WATCH | JANUARY 2019
related controversies9 shows a steady rise in controversies involving conduct
issues with corporate leadership in the last five years for companies that are
constituents of the MSCI ACWI Index (Exhibit 5).
Exhibit 6: Instances of company controversies has increased
120
5-year CAGR: +22%
Count of Instances of "Misconduct" by Year
100
80
60
40
20
0
2013 2014 2015 2016 2017 2018
Cases involving “CEO” and “misconduct” in the MSCI ESG Controversies database between 2010 and 2018.
Source: MSCI ESG Research, MSCI ACWI Index Constituents, as of Dec. 31, 2018
The direct implications are obvious – headline risk, customer backlash, share-
price pressure and even regulatory scrutiny. But there can be longer-lasting
effects that are less obvious, particularly with a company’s employees and future
recruitment prospects. Revelations that Google had paid huge sums in severance
to senior managers accused of sexual misconduct prompted 20,000 employees
to walk out in public protest.59 Employee morale at Facebook, as measured by
internal surveys, reportedly has declined due to exposés detailing how senior
leaders have handled problems with online misinformation and data privacy.60
To put in perspective how long a company’s employee problem can last after a
scandal, surveys of bank and Wall Street employees nearly a decade after the
financial crisis were still rife with negative perceptions61 of the industry or their
companies as a result of those companies’ behaviors years earlier.62 The result
9We used a natural-language search through our MSCI ESG Controversies database between 2010 and 2018 for word
combinations like “CEO” and “misconduct,” among others. For a full description of the methodology.
© 2019 MSCI Inc. All rights reserved. Please refer to the disclaimer at the end of this document. MSCI.COM | PAGE 22 OF 32— GENERAL —
2019 ESG TRENDS TO WATCH | JANUARY 2019
for banks: Deloitte found in 2014 that banks had been supplanted by technology
companies as the premier talent recruiter.63
When a scandal will hit, and how it will affect a given company is largely
unpredictable. But for investors, the ability to do something about it may not be.
Outside of the decision to invest or divest, investors tend to control two key
elements of a company: the proxy vote and, by extension, the board. Investors
know when the companies in which they hold stakes have controlling
shareholders that limit their rights. Less obvious may be the limits imposed on
their ability to influence companies with widely dispersed shareholders, where
the ability to influence change through proxy votes may be nearly impossible for
any individual shareholder.
Based on our assessments of ownership structure and board effectiveness,10 21
percent of MSCI ACWI Index constituents as of Dec. 31, 2018, rank in the bottom
third for both, a combination that greatly limits investor influence. What
happens when a leadership scandal or crisis erupts at these companies?
Largely what you might expect – the companies with weak boards and limited
shareholder rights, which limit “investor influence,”11 tend to either react and
change more slowly or protect their own interests over shareholders’.
Examining data from 2015 for companies in the MSCI ACWI Index that were
implicated in controversy involving its leadership, we found that over the
following three years, on average, companies in the lower third of “investor
influence” refreshed their boards and CEOs far less often than did more easily
influenced companies. In the less easily influenced companies, 49 percent of the
directors at these companies in aggregate were replaced, and 14 percent of
CEOs replaced; compared to 58 percent of directors and 44 percent of CEOs
replaced at the more easily influenced companies.12 This supports the notion
10 These assessments were based on each company’s scores in the Ownership and Control and Board sections of our
overall Corporate Governance scores, as of Dec. 31, 2018, ranked by thirds.
11 Based on board structure, ownership structure and assessment of shareholder rights
12
We divided all the companies rated by MSCI ESG Research into three groups, based on their Board and Ownership and
Control scores, as determined by the MSCI Governance pillar scoring model. Companies in the lowest-scoring third were
identified as being the most difficult to influence by shareholders, and the highest third identified as being the easiest to
influence; the middle third were identified as being of average difficulty to influence. We then identified those companies
in each group that had experienced one or more leadership-misconduct controversies in 2015, by applying permutations
of relevant search terms (e.g., “director,” “president” and “CEO” with “testify” and “arrest”) to MSCI’s ESG Controversies
database. We calculated the average percentage of board and CEO turnover for each of the three groups over the next
three years, from 2015 to 2018.
© 2019 MSCI Inc. All rights reserved. Please refer to the disclaimer at the end of this document. MSCI.COM | PAGE 23 OF 32— GENERAL —
2019 ESG TRENDS TO WATCH | JANUARY 2019
that unless shareholders have recourse, companies are less likely to react to a
controversy (Exhibit 7).
Exhibit 7: Company responsiveness to controversies varies by level of investor
influence
Average change in board and CEO in the next three years for
companies flagged with "misconduct" cases,
by Investor Influence Percentile, 2015
70%
60%
50% 56% 58%
40% 49%
44%
30%
20% 14% 26%
10% of board CEOs of board CEOs of board CEOs
replaced replaced replaced replaced replaced replaced
0%
Low Investor Influence (0-33) Moderate Investor Influence High Investor Influence (67-100)
(34-66)
Source: MSCI ESG Research, MSCI ACWI Index constituents, as of Dec. 31, 2015
Nowhere was this more evident than at Volkswagen. Predicting the automaker’s
emissions scandal64 may have been impossible for an investor; even regulators
were largely fooled. But even after the fact, investors looking for change have
been forced to mostly wait, as just 20 percent of the Volkswagen board was
refreshed over the last year, three members of the founding family continue to
serve and influence board decisions, and the supervisory board still lacks an
independent majority, according to our research. Even the CEO and
management changes took nearly three years to manifest, all while investors
were left to wait and see or divest from the company altogether.65
© 2019 MSCI Inc. All rights reserved. Please refer to the disclaimer at the end of this document. MSCI.COM | PAGE 24 OF 32— GENERAL —
2019 ESG TRENDS TO WATCH | JANUARY 2019
In 2019, that’s likely to change. Pension funds such as CalPERS and Norges Bank
Investment Management already have put their portfolio companies on notice.
To accelerate board refreshment, CalPERS has announced that, in 2019, it will be
voting against all directors who exceed 12 years in tenure.66 CalPERS also will
vote against boards that lack at least one diverse candidate,67 and the global
movement to increase board diversity is being coupled with a demand to
remove entrenched or ineffective board members.
The age of transparency means there are fewer and fewer places for
questionable corporate practices and even personal conduct to hide. What
happens in the executive suite – or in internal chatrooms or remote factories – is
unlikely to stay there. But the age of transparency also can turn into an age of
vigilance. Investors are starting to insist that, while the parade of CEOs behaving
badly may be difficult to predict and avoid, replacing them and cleaning house in
the wake of a scandal should not be. As a result, 2019 may mark a turning point
for investors tired of paying the cost for companies slow to adapt when the
internal becomes external and the whole world can judge misconduct for itself.
© 2019 MSCI Inc. All rights reserved. Please refer to the disclaimer at the end of this document. MSCI.COM | PAGE 25 OF 32— GENERAL —
2019 ESG TRENDS TO WATCH | JANUARY 2019
APPENDICES
APPENDIX A |
QUARTER-ON-QUARTER REVENUE GROWTH OF COMPANIES WITH A MAJORITY
OF THEIR REVENUES FROM PAPER VERSUS PLASTIC PACKAGING, Q1 2016 – Q3
2018
© 2019 MSCI Inc. All rights reserved. Please refer to the disclaimer at the end of this document. MSCI.COM | PAGE 26 OF 32— GENERAL —
2019 ESG TRENDS TO WATCH | JANUARY 2019
APPENDIX B | EUROPEAN COMMISSION PROPOSALS ON SUSTAINABLE
FINANCE
1. Green taxonomy: Proposal for a regulation on the establishment of a
framework to facilitate sustainable investment
2. Fiduciary Duty:
a. Proposal for a regulation on disclosures relating to sustainable
investments and sustainability risks and amending Directive (EU)
2016/2341
b. Commission draft delegated regulation amending Regulation (EU)
2017/565 supplementing Directive 2014/65/EU as regards
organizational requirements and operating conditions for
investment firms and defined terms for the purposes of that
directive
c. Commission draft delegated regulation amending Delegated
Regulation (EU) 2017/2359 with regard to environmental, social
and governance preferences in the distribution of insurance-
based investment products
3. Low-Carbon benchmarks: Proposal for a regulation amending Regulation
(EU) 2016/1011 on low-carbon benchmarks and positive carbon-impact
benchmarks
4. Source: European Commission:
https://ec.europa.eu/info/publications/180524-proposal-sustainable-
finance_en
© 2019 MSCI Inc. All rights reserved. Please refer to the disclaimer at the end of this document. MSCI.COM | PAGE 27 OF 32— GENERAL —
2019 ESG TRENDS TO WATCH | JANUARY 2019
CONTACT US AMERICAS ABOUT MSCI ESG RESEARCH PRODUCTS
AND SERVICES
+ 1 212 804 5299
esgclientservice@msci.com
MSCI ESG Research products and services
EUROPE, MIDDLE EAST & AFRICA are provided by MSCI ESG Research LLC,
and are designed to provide in-depth
+ 44 20 7618 2510 research, ratings and analysis of
environmental, social and governance-
ASIA PACIFIC related business practices to companies
worldwide. ESG ratings, data and analysis
+ 612 9033 9339 from MSCI ESG Research LLC. are also used
in the construction of the MSCI ESG
Indexes. MSCI ESG Research LLC is a
Registered Investment Adviser under the
Investment Advisers Act of 1940 and a
subsidiary of MSCI Inc.
ABOUT MSCI
For more than 40 years, MSCI’s research-
based indexes and analytics have helped
the world’s leading investors build and
manage better portfolios. Clients rely on
our offerings for deeper insights into the
drivers of performance and risk in their
portfolios, broad asset class coverage and
innovative research.
Our line of products and services includes
indexes, analytical models, data, real estate
benchmarks and ESG research.
MSCI serves 99 of the top 100 largest
money managers, according to the most
recent P&I ranking.
For more information, visit us at
www.msci.com.
© 2019 MSCI Inc. All rights reserved. Please refer to the disclaimer at the end of this document. MSCI.COM | PAGE 28 OF 32— GENERAL —
2019 ESG TRENDS TO WATCH | JANUARY 2019
NOTICE AND This document and all of the information contained in it, including without limitation all text, data, graphs, charts (collectively, the “Information”) is
the property of MSCI Inc. or its subsidiaries (collectively, “MSCI”), or MSCI’s licensors, direct or indirect suppliers or any third party involved in making
or compiling any Information (collectively, with MSCI, the “Information Providers”) and is provided for informational purposes only. The Information
DISCLAIMER may not be modified, reverse-engineered, reproduced or redisseminated in whole or in part without prior written permission from MSCI.
The Information may not be used to create derivative works or to verify or correct other data or information. For example (but without limitation),
the Information may not be used to create indexes, databases, risk models, analytics, software, or in connection with the issuing, offering,
sponsoring, managing or marketing of any securities, portfolios, financial products or other investment vehicles utilizing or based on, linked to,
tracking or otherwise derived from the Information or any other MSCI data, information, products or services.
The user of the Information assumes the entire risk of any use it may make or permit to be made of the Information. NONE OF THE INFORMATION
PROVIDERS MAKES ANY EXPRESS OR IMPLIED WARRANTIES OR REPRESENTATIONS WITH RESPECT TO THE INFORMATION (OR THE RESULTS TO BE
OBTAINED BY THE USE THEREOF), AND TO THE MAXIMUM EXTENT PERMITTED BY APPLICABLE LAW, EACH INFORMATION PROVIDER EXPRESSLY
DISCLAIMS ALL IMPLIED WARRANTIES (INCLUDING, WITHOUT LIMITATION, ANY IMPLIED WARRANTIES OF ORIGINALITY, ACCURACY, TIMELINESS,
NON-INFRINGEMENT, COMPLETENESS, MERCHANTABILITY AND FITNESS FOR A PARTICULAR PURPOSE) WITH RESPECT TO ANY OF THE
INFORMATION.
Without limiting any of the foregoing and to the maximum extent permitted by applicable law, in no event shall any Information Provider have any
liability regarding any of the Information for any direct, indirect, special, punitive, consequential (including lost profits) or any other damages even if
notified of the possibility of such damages. The foregoing shall not exclude or limit any liability that may not by applicable law be excluded or limited,
including without limitation (as applicable), any liability for death or personal injury to the extent that such injury results from the negligence or
willful default of itself, its servants, agents or sub-contractors.
Information containing any historical information, data or analysis should not be taken as an indication or guarantee of any future performance,
analysis, forecast or prediction. Past performance does not guarantee future results.
The Information should not be relied on and is not a substitute for the skill, judgment and experience of the user, its management, employees,
advisors and/or clients when making investment and other business decisions. All Information is impersonal and not tailored to the needs of any
person, entity or group of persons.
None of the Information constitutes an offer to sell (or a solicitation of an offer to buy), any security, financial product or other investment vehicle or
any trading strategy.
It is not possible to invest directly in an index. Exposure to an asset class or trading strategy or other category represented by an index is only
available through third party investable instruments (if any) based on that index. MSCI does not issue, sponsor, endorse, market, offer, review or
otherwise express any opinion regarding any fund, ETF, derivative or other security, investment, financial product or trading strategy that is based on,
linked to or seeks to provide an investment return related to the performance of any MSCI index (collectively, “Index Linked Investments”). MSCI
makes no assurance that any Index Linked Investments will accurately track index performance or provide positive investment returns. MSCI Inc. is
not an investment adviser or fiduciary and MSCI makes no representation regarding the advisability of investing in any Index Linked Investments.
Index returns do not represent the results of actual trading of investible assets/securities. MSCI maintains and calculates indexes, but does not
manage actual assets. Index returns do not reflect payment of any sales charges or fees an investor may pay to purchase the securities underlying the
index or Index Linked Investments. The imposition of these fees and charges would cause the performance of an Index Linked Investment to be
different than the MSCI index performance.
The Information may contain back tested data. Back-tested performance is not actual performance, but is hypothetical. There are frequently material
differences between back tested performance results and actual results subsequently achieved by any investment strategy.
Constituents of MSCI equity indexes are listed companies, which are included in or excluded from the indexes according to the application of the
relevant index methodologies. Accordingly, constituents in MSCI equity indexes may include MSCI Inc., clients of MSCI or suppliers to MSCI. Inclusion
of a security within an MSCI index is not a recommendation by MSCI to buy, sell, or hold such security, nor is it considered to be investment advice.
Data and information produced by various affiliates of MSCI Inc., including MSCI ESG Research LLC and Barra LLC, may be used in calculating certain
MSCI indexes. More information can be found in the relevant index methodologies on www.msci.com.
MSCI receives compensation in connection with licensing its indexes to third parties. MSCI Inc.’s revenue includes fees based on assets in Index
Linked Investments. Information can be found in MSCI Inc.’s company filings on the Investor Relations section of www.msci.com.
MSCI ESG Research LLC is a Registered Investment Adviser under the Investment Advisers Act of 1940 and a subsidiary of MSCI Inc. Except with
respect to any applicable products or services from MSCI ESG Research, neither MSCI nor any of its products or services recommends, endorses,
approves or otherwise expresses any opinion regarding any issuer, securities, financial products or instruments or trading strategies and MSCI’s
products or services are not intended to constitute investment advice or a recommendation to make (or refrain from making) any kind of investment
decision and may not be relied on as such. Issuers mentioned or included in any MSCI ESG Research materials may include MSCI Inc., clients of MSCI
or suppliers to MSCI, and may also purchase research or other products or services from MSCI ESG Research. MSCI ESG Research materials, including
materials utilized in any MSCI ESG Indexes or other products, have not been submitted to, nor received approval from, the United States Securities
and Exchange Commission or any other regulatory body.
Any use of or access to products, services or information of MSCI requires a license from MSCI. MSCI, Barra, RiskMetrics, IPD, and other MSCI brands
and product names are the trademarks, service marks, or registered trademarks of MSCI or its subsidiaries in the United States and other
jurisdictions. The Global Industry Classification Standard (GICS) was developed by and is the exclusive property of MSCI and Standard & Poor’s.
“Global Industry Classification Standard (GICS)” is a service mark of MSCI and Standard & Poor’s.
© 2019 MSCI Inc. All rights reserved. MSCI.COM | PAGE 29 OF 32You can also read