Multilateral development banks in Latin America - Recent trends, the response to the pandemic, and the forthcoming role - Repositorio ...
←
→
Page content transcription
If your browser does not render page correctly, please read the page content below
ISSN 1728-5437

                                 SERIES

STUDIES AND PERSPECTIVES           21

                         ECLAC OFFICE
                  IN WASHINGTON, D.C.

                   Multilateral
           development banks
              in Latin America
                     Recent trends,
                the response to the
                 pandemic, and the
                   forthcoming role

                             Pablo Fleiss
Thank you for your interest in
   this ECLAC publication

     ECLAC
     Publications

  Please register if you would like to receive information on our editorial
products and activities. When you register, you may specify your particular
areas of interest and you will gain access to our products in other formats.

                                         Register

                                        www.cepal.org/en/publications

                                        facebook.com/publicacionesdelacepal

                        Publicaciones
                                        www.cepal.org/apps
21
Multilateral development banks
in Latin America
Recent trends, the response to the
pandemic, and the forthcoming role
Pablo FleissThis document was prepared by Pablo Fleiss, a consultant with the Economic Commission for Latin America and the Caribbean (ECLAC) office in Washington D.C. The author acknowledges the contribution of Marcelo Bisogno in the preparation of this document. The views expressed in this document, which has been reproduced without formal editing, are those of the author and do not necessarily reflect the views of the Organization. United Nations publication ISSN: 1728-5437 (electronic version) ISSN: 1727-9909 (print version) LC/TS.2021/62 LC/WAS/TS.2021/2 Distribution: L Copyright © United Nations, 2021 All rights reserved Printed at United Nations, Santiago S.21-00262 This publication should be cited as: P. Fleiss, “Multilateral development banks in Latin America: recent trends, the response to the pandemic, and the forthcoming role”, Studies and Perspectives series- ECLAC Office in Washington, D.C., No. 21 (LC/TS.2021/62-LC/WAS/TS.2021/2), Santiago, Economic Commission for Latin America and the Caribbean (ECLAC), 2021. Applications for authorization to reproduce this work in whole or in part should be sent to the Economic Commission for Latin America and the Caribbean (ECLAC), Documents and Publications Division, publicaciones.cepal@un.org. Member States and their governmental institutions may reproduce this work without prior authorization, but are requested to mention the source and to inform ECLAC of such reproduction.
ECLAC - Studies and Perspectives series-Washington, D.C. No. 21                                           Multilateral development banks in...              3

Contents

Abstract ............................................................................................................................................ 5
Introduction .......................................................................................................................................... 7
I.       Multilateral development banks in Latin America and the Caribbean:
         basic concepts and main institutions ......................................................................................... 11
         A. Major multilateral development banks serving the region ................................................. 13
II.      Stylized facts of multilateral lending to Latin America and The Caribbean ................................ 19
         A. Multilateral debt has declined relative to total public debt during the last decade ............. 19
         B. For the smaller and poorer countries, multilaterals remain the main source
              of public finance. Larger economies bear higher exposures to private
              and bilateral Chinese debt ................................................................................................. 21
         C. Multilateral non-sovereign guaranteed lending has increased faster than sovereign
              guaranteed, while concessional lending has fallen ............................................................ 23
         D. Lending by regional banks has outpaced that of the World Bank to the region..................24
         E. Financial flows have been countercyclical, although cyclicality varies
              across multilaterals ........................................................................................................... 25
         F. Multilaterals face a competitiveness problem regarding
              their highest-ranked borrowers .........................................................................................26
III.     A tale of two crises: comparing the multilateral response during the COVID-19 pandemic
         and the global financial crisis ....................................................................................................29
         A. Multilateral response during the crises .............................................................................. 31
         B. A Brief History of Recent Capital Increases ........................................................................ 35
         C. Credit Rating Agencies and Multilateral Development Bank’s Operative........................... 38
ECLAC - Studies and Perspectives series-Washington, D.C. No. 21 Multilateral development banks in... 4
IV. The renewed role of multilateral development banks: key issues .............................................. 41
A. Anti-Cyclical Support ........................................................................................................42
B. Adequate Level of Capital .................................................................................................44
C. Strong Coordination.......................................................................................................... 45
Bibliography ........................................................................................................................................49
Tables
Table 1 Multilateral development banks serving Latin America and the Caribbean ................ 14
Table 2 Main MDBs in LAC: basic information, 2019 .............................................................. 15
Table 3 Public and publicly guaranteed debt by type of creditor
Latin America (excluding high-income countries) ...................................................... 21
Table 4 China’s Finance to Latin America and Multilateral Commitments 2009-2019 ............22
Table 5 Sovereign Guaranteed Lending, 2018-2020, by MDB ................................................ 34
Table 6 IMF’s Financial Assistance to LAC, 2018-2020............................................................ 35
Figures
Figure 1 Multilateral debt stocks in real term and as a percentage of PPG debt.......................20
Figure 2 Total Approvals CABEI + CAF + IDB + World Bank, by type of risk
and concessionality ................................................................................................... 23
Figure 3 SG+NSG Approvals by MDB to LAC, 3-year moving averages 1995-2020 ..................24
Figure 4 MDBs disbursements to Latin America ...................................................................... 25
Figure 5 Sovereign Yields and MDBs SG All-In Rate Equivalents ............................................. 27
Figure 6 Latin America, GDP Growth and External Debt as a Percentage
of Gross National Income .......................................................................................... 30
Figure 7 CAF, IDB and World Bank, 2007-2010 & 2017-2020, Sovereign
Guaranteed Approvals ............................................................................................... 32
Figure 8 Equity Increases 2007-2019/2020 by MDB ................................................................. 37
Boxes
Box 1 The Evolution of Mandates of Multilateral Development Banks ................................ 16
Box 2 Standard and Poor’s Methodology to Evaluate Multilaterals ..................................... 39
Maps
Map 1 Multilateral Debt as a Percentage of Total Public
and Publicly Guaranteed Debt ...................................................................................22ECLAC - Studies and Perspectives series-Washington, D.C. No. 21 Multilateral development banks in... 5 Abstract The COVID-19 crisis has hit Latin America and the Caribbean harder than any other developing region. In 2020 the regional GDP will experience its greatest decline in 120 years. The pandemic represents a formidable social challenge, exposing all the regions’ endemic problems. Against this backdrop, this paper analyses the Multilateral Development Banks (MDBs) response to the COVID-19 crisis and their post-pandemic role and prospects in LAC. Some basic information is presented on the major MDBs that serve the region and their main trends during the last decade to provide an adequate context. Preliminary data indicate that MDBs combined approved approximately $50 billion to the region in 2020. This represents a 25% increase with respect to 2019. In comparison, in 2008, the first year of the Global Financial Crisis, the increase was 45%. While all MDBs expanded their credits to the region in 2020, the size of their respective incremental responses appears to be linked to their differences in equity levels and portfolio-associated risks. The paper closes by sketching some critical factors that will continue to play an important role in the discussions among MDBs in the near future. We identify three major issues: providing anti-cyclical support, maintaining an adequate level of capital, and encouraging strong coordination among MDBs.
ECLAC - Studies and Perspectives series-Washington, D.C. No. 21          Multilateral development banks in...   7

Introduction

The COVID-19 crisis has hit Latin America and the Caribbean (LAC) harder than any other developing
region. In 2020 the LAC’s Gross Domestic Product (GDP) will plunge -7.7% (ECLAC, 2020). That figure
represents the greatest decline in 120 years. The regional fall in economic activity significantly exceeds
the average drop in developing economies and the world’s output, -3.3% and -4.4%, respectively (IMF,
2020). By December 2020, the region accounted for 8.5% of the world’s population but almost 20% of
cases and 30% of deaths for COVID-19.
      This crisis struck a region already in a slowdown. The period 2014-2019 was the one with the
lowest growth (0.3% annual average) since the 1950s (ECLAC, 2020). The collapse will make the 2020’s
GDP per capita similar to the 2010’s, turning this decade into another lost decade for the region.
Furthermore, recovery will be neither as strong nor as immediate as in other regions. In 2021, the
regions’ GDP is projected to grow at 3.7%, below developing economies and global averages (6.0% and
5.2%, respectively). The recovery is not expected to bring a return to pre-crisis GDP levels until 2023,
and forecasts until 2025 are below the world’s average as well (IMF, 2020).
        The pandemic represents a formidable social challenge. The crisis exposed all of the regions’
endemic problems. The decline in GDP and the expected increase in unemployment rates will raise the
number of people living in poverty and extreme poverty by 45 and 28.5 million, respectively (ECLAC,
2020). As a result, more than 230 million people in LAC live in poverty right now. The crisis
disproportionally hit low-income households and smaller firms. Informality and inequality will probably
rise, countering the progress made in the last decade.
       The health and economic crisis will probably lead to debt distress and financial crises. Since the
pandemic outbreak, governments worldwide have provided liquidity to businesses and supported
households struck by a sudden loss of income and employment. As a result, the public sector will face
increased financing needs. On top of the additional health bill and the costs associated with the expected
immunization programs, and amid all programs to mitigate the drop in household income, governments will
have to confront lower revenues due to economic contraction in the context of already high public debt
vulnerabilities. Depending on alternative GDP trajectories and public spending, the average debt in LAC
countries could increase by 15 points, reaching 73% of GDP in 2022 on average (Pineda, et al., 2020).
ECLAC - Studies and Perspectives series-Washington, D.C. No. 21 Multilateral development banks in... 8
Against this backdrop, this paper analyses the Multilateral Development Banks (MDBs) response
to the COVID-19 crisis and the post-pandemic prospects of these institutions in LAC. Some basic
information on the major MDBs that serve the region and their main trends during the last decade is
presented to provide an adequate context. The Global Financial Crisis (GFC) of 2008-2009 is a useful
benchmark to compare multilateral responses during the current crisis. The paper closes with a
discussion of issues that will be important in determining how MDBs will adapt to the new global
scenario.
MDBs have historically played a significant role in addressing LAC’s main regional development
challenges, whether social, infrastructure, integration, or climate change. Beyond this structural
support, when a crisis hits the region, client countries appeal to MDBs for resources and advice to
mitigate the negative shocks’ immediate effects, shorten the downfall and strengthen the recovery
phase. MDBs have responded accordingly, supporting the region throughout all the previous crises,
including the debt crisis of the 1980s, the Tequila and Asian crisis of the 1990s, and the GFC.
Since the aftermath of the GFC and throughout the past decade, some interesting trends have
been observed. First, multilateral debt has declined as a percentage of total public debt in the last ten
years. This decline resulted from the faster increase in public debt financed by both private creditors
through bonds and commercial banks. However, for the smaller and poorer countries, MDBs remain the
main source of public finance. Larger economies bear higher exposures to private debt, while some
economies have witnessed a surge in bilateral Chinese debt.
Within MDBs, non-sovereign guaranteed flows have increased faster than sovereign guaranteed
ones as private-sector lending and mobilization have been placed at the center of MDBs strategies.
While LAC has become a middle-income region, concessional lending has fallen. After the GFC, the
World Bank reduced its lending to the region, while regional MDBs continued expanding. As a result,
lending by regional banks (especially the Inter-American Development Bank, IDB, and the Development
Bank of Latin America, CAF) has significantly outpaced that of the World Bank to LAC. MDBs’ financial
flows have been countercyclical as a whole, and disbursements raise during crises, although cyclicality
varies across MDBs. Finally, MDBs face a competitiveness problem regarding their highest-rated
borrowers due to their easy access to international financial markets.
In this crisis, while all MDBs have expanded their credits to the region, the size of their respective
incremental responses appears to be linked to their differences in equity levels and portfolio-associated
risks. Overall, preliminary data indicate that MDBs approved approximately $50 billion in new resources
in 2020. This represents a 25% increase with respect to 2019. In comparison, in 2008, the first year of
the GFC, the increase in approvals was 45%. On top of that, the International Monetary Fund (IMF) has
offered a significant response to the crises in terms of speed and volume. Between 2018 and 2020, the
IMF has approved $185 billion in emergency financing, some two times more than the total MDBs’
sovereign guaranteed approvals during the same period. IMF’s lending has been mainly precautionary
and concentrated on six countries.
A robust response requires substantial resources to be made available to their clients. We look
into the evolution of equity in each institution to understand why some have acted more vigorously. In
2018-2019 the World Bank Group obtained a capitalization (including a substantial replenishment of the
International Development Agency). Moreover, the IDB Invest (the private sector arm of the IDB) and
the Central American Bank of Economic Integration (CABEI) also agreed on a capitalization in the last
five years. These capital increases allowed each of these institutions to substantially expand their
finance to the region in 2020. On the contrary, the last capital increase of the IDB occurred further back
in time. The new IDB’s president (elected in October 2020) has launched a discussion to increase the
capital and expand the annual lending capacity to $20 billion a year. At the CAF, the last capital increaseECLAC - Studies and Perspectives series-Washington, D.C. No. 21 Multilateral development banks in... 9
was negotiated in 2015 (the final of four consecutive capitalizations between 2007 and 2015), and it is
still receiving contributions.
The paper also discusses the role of Credit Rating Agencies (CRAs) on the MDBs operative.
Maintaining high ratings to obtain optimal financial terms to transfer to their clients is key to the MDBs’
financial models. Consequently, trying to preserve the highest possible rating is a clear policy mandate of
these institutions. Rating considerations constraint MDBs lending, especially during crises, because the
CRAs methodologies, which adapt methods designed to assess commercial banks, fail to capture the
anticyclical role embedded in MDBs. CRAs methodologies evaluate the portfolio quality and measure it
against the bank’s equity. In a crisis, the portfolio quality decreases, so more equity is needed to support
the same lending level. Hence, a significant rise in lending without a parallel rise in capital may jeopardize
MDBs ratings. In this way, CRAs might limit MDBs financing expansion during crises and hinder MDBs
anticyclical lending. Risk considerations and CRAs views also matter for debt standstill discussions.
Once analysed the main trends of the last decade and the immediate response to the COVID-19
crisis, the paper closes by sketching some critical topics that will probably play an important role in the
discussions among MDBs in the near future. We identify three major issues: providing anti-cyclical
support, maintaining an adequate capital level, and encouraging strong coordination among MDBs.
The COVID-19 pandemic reinforced the idea that MDBs play a role in mitigating negative shocks.
However, MDBs are not always geared to respond to cycles. An institution’s capability to behave
countercyclically and expand activities during a descending phase of a cycle is linked to its ability to
moderate its approvals and lending during the ascending phase. Managing cyclical lending requires an
institutional governance that develops the ability to modify lending rapidly. Moreover, the financial
rating criteria to which MDBs are subject does not contemplate their anticyclical role, penalizing their
stance during crises and failing to judge the financial health of an MDB throughout the entire cycle.
Beyond expanding or contracting the level of resources allocated each year, an important element of
MDB’s anti-cyclical support is the possibility of offering ex-ante financial support to face crises. While
the MDBs have traditionally focused on ex-post emergency lending, they have progressively extended
the set of contingent and precautionary loans. These ex-ante instruments involve significant benefits to
borrowing member countries.
The pandemic has also highlighted the importance of having MDBs well prepared to confront the
current and upcoming crises. The response to the exceptional demands generated by this crisis is
stretching the balance sheets of the MDBs. As the size of MDBs’ response is linked to the available
spaces in their balance sheets and their ability to implement quick changes in their programming, it is
important to evaluate how well-equipped the MDBs are. MDBs would need periodical assessments of
their capital needs and an agreement on how and under which conditions they require a capital increase.
This type of conversation may contribute to the coordination among shareholders, and between them
and MDB’s management. So far, the launch of the capitalization discussions has been ad-hoc,
depending on external dynamics and occasional shareholder appetite. These processes systematization
could bring enormous benefits to the multilateral system.
The COVID-19 crisis erupted in a context marked by the resurgence of nationalism and mistrust
of the multilateral system. In this context, international cooperation has been limited, and so was the
assistance received by developing countries (especially the middle-income ones), contrasting with
developed countries’ ambitious domestic policies. Coordination among MDBs has become more
complex due to their larger number and the more fragmented ownership structure. Still, there is a
consensus in the international development community that strong coordination between MDBs would
reinforce each institution’s actions and increase efficiency. Operating in a more coordinated manner
and working as a system allows MDBs to achieve better results. This is particularly important whenECLAC - Studies and Perspectives series-Washington, D.C. No. 21 Multilateral development banks in... 10
tackling global public goods and addressing collective action problems like climate change. MDBs also
help to scale up the mobilization of private financing for development.
MDBs can tackle debt distress associated with the COVID-19 pandemic in a coordinated fashion.
So far, most of the debt relief initiatives have focused on the world’s poorest countries, leaving aside
most LAC countries. Collective MDBs actions to tackle debt problems in MICs are oriented toward
expanding fiscal access and obtaining more financing from international markets at better rates. For
example, by advocating for an MDB green sovereign debt guarantee scheme to help countries maintain
market access and set the stage for a green recovery. Another option proposes that central banks, in
coordination with the IMF and the MDBs, establish a special-purpose vehicle that would bridge the vast
amount of currently available global liquidity and emerging economies’ growing financing needs. The
last suggestion consists of creating an off-balance-sheet vehicle purpose-built to take on more risk
exclusively during a crisis, which multiple MDBs could access.
MDBs are uniquely prepared to address global and regional challenges of different nature at every
stage of the economic cycle. The post-pandemic countries’ demands will include the continuous requests
for structural lending (i.e., the type of lending that was the original reason for creating the MDBs). MDB
will also likely continue to fulfil an important catalytic role in crowding-in private finance for development.
Countries’ demands to MDBs will probably move in two other directions. On the one hand, it is expected
that the demands for anticyclical financing be enhanced. On the other hand, countries facing debt
problems will expect some help from MDBs. The size of MDBs responses will depend on the available
spaces in their balance sheets and the ability to implement quick changes in their programming. MDBs will
need an adequate capital level to maintain their relevance, a clear framework for counter-cyclical and
contingent support to clients, and strong coordination among institutions.
In summary, the MDBs’ future appears active. New viruses, environmental crises, and more
economic shocks of a global scale make uncertainty a certainty for the future. Mitigating their most
adverse effects will be a key task. The next decade may bring about a renewed role for multilateralism.
The post-COVID19 world will be one of heavier governments, more public debt, and perhaps more
regulation. For that, MDBs would need to continue changing to step up to the challenges. While
important in the initial phases of a crisis, MDBs become critical in the recovery stage. Recovery financing
should be deeply aligned with the Sustainable Development Goals.ECLAC - Studies and Perspectives series-Washington, D.C. No. 21 Multilateral development banks in... 11
I. Multilateral development banks in Latin America and
the Caribbean: basic concepts and main institutions
There is a significant variation regarding MDBs ownership, funding sources, financial instruments,
operations, and objectives. Despite the absence of a unique or consensual definition, some essential
characteristics among these institutions can be highlighted (Xu, et al., 2019). First, MDBs need to have
independent legal status. MDBs usually benefit from a special status governed by international treaties
and are usually not subject to national regulations or local laws. Second, MDBs have a public-policy
mandate. They are established to fulfill certain development or strategic objectives rather than
maximize profits as commercial banks do. Third, in close relationship with the pursuit of public policy
objectives, MDBs are established and supported by governments of two or more countries.1
The last common feature is that MDBs are self-sustainable financial institutions that leverage
governments’ capital support by taking on debt in international financial markets. As MDBs have neither
deposits nor access to central bank funding, they heavily rely on market funding. MDBs issue bonds and
securities purchased mainly by institutional investors (such as pension funds, commercial banks,
insurance companies, and corporations worldwide) and governments. The funds obtained are used to
finance medium to long-term finance to borrowing countries. In this way, countries in need of
investments can use savings accumulated throughout the world.
The capital base of all MDBs includes the paid-in contributions and retained earnings. Paid-in
capital represents the cash contributions made by government members during the successive
replenishment of capital. Retained earnings are the net income that is held and added to the capital as
accumulated reserves. MDBs usually maintain the full amount of their earning. This practice reinforces
1
Overall, MDBs are part of a broader set of international organizations called international development finance institutions (DFI).
MDBs are different from financial-stabilization funds like the International Monetary Fund (IMF), which are international but not
development finance institutions. As opposed to national development banks, MDBs are established by governments of two or more
countries.ECLAC - Studies and Perspectives series-Washington, D.C. No. 21 Multilateral development banks in... 12
MDBs’ balance sheets significantly. Also, member countries grant MDBs a guarantee to repay their
obligations if needed. This guarantee is called callable capital, and the member countries give it to MDBs
to back up their bond issues. This portion of the capital subscriptions is subject to call only when required
and up to the extent necessary to meet the MDBs’ obligations with third parties on borrowings of funds
or guarantees. To date, no MDB has ever had to draw on its callable capital.
Both borrowing and non-borrowing member countries make concessions to contribute to the
strengths of MDBs’ capital. The complex arrangement behind the institutional architecture of MDBs
entails a mechanism for allocating these subsidies among borrowing member countries (Buiter & Fries,
2002). Shareholders do not receive dividends for their capital investments (i.e., net income is fully
retained), nor do they charge any fees for the callable capital used as a guarantee. For donors, the
multilateral nature of MDBs entrenches a comparative advantage in allocating finance for development
by helping mitigate the risk of investing in developing countries by themselves (Rodrik, 1995).
Borrowing members also make a distinctive contribution to MDBs by granting a preferred creditor
treatment (PCT) on their exposures. The PCT implies that MDBs have priority in the repayment by
allowing a senior claim to the borrowing members’ reserves or primary government surpluses and are
expected to be repaid even if the sovereign borrower restructures private or bilateral debt.
Altogether, these features assure that most MDBs enjoy high credit ratings, usually AAA or AA.
As a result, MDBs generally access the international financial markets in more favourable financial terms
than individual borrowing members. In turn, MDBs transfer their better funding conditions to their
borrowing-country clients in the form of loans with long maturities and grace periods and low-interest
rates. Clients demand loans from MDBs mainly because their financial terms are more favourable than
what countries would get if they issued sovereign bonds or requested credits from commercial banks.
Maintaining high ratings to obtain optimal and competitive financing to transfer to their clients is
central to the MDBs’ financial models. MDBs are particularly instrumental in channelling funds to
developing countries when financial markets are thin. MDBs could be the major (if not the only) source
of international financing for the smaller and less developed countries.
Most of the MDBs lend according to two main risk categories: with and without a sovereign
guarantee. Sovereign guaranteed (SG) loans are those given to national governments (central or
federal) and local governments or state-owned enterprises but guaranteed by the national ones. Most
SG financing is provided on non-concessional terms. The pricing is based on the banks’ cost of funding
plus a spread that covers operative and administrative costs and accumulates capital. A typical non-
concessional loan is charged at a LIBOR rate plus a spread that goes from 50 to 350 basis points,
depending on the bank’s credit rating and the loan’s maturity. The fact that loans are classified as non-
concessional does not preclude the possibility that they are cheaper than private lending, as mentioned
in the previous paragraph.
Besides, many MDBs provide concessional SG lending to their poorest members. In the case of
these concessional loans, the interest rates are subsidized and below market prices. A typical
concessional loan can be repaid at a “bullet” (a single lump-sum payment at the bond’s maturity) at 30
or 40 years, with a 0.25-0.5% yearly interest rate. In some MDBs, concessional loans can be provided
from separates funds, which usually have different governance than the non-concessional window and
their own administrative expenses. Moreover, borrowing countries receive non-reimbursable grants for
technical cooperation programs. Grants can be financed by the MDB’s financial resources or funds from
donors administrated by the MDB.ECLAC - Studies and Perspectives series-Washington, D.C. No. 21 Multilateral development banks in... 13
MDBs provide financing without a sovereign guarantee (NSG) to private and state-owned
companies and financial institutions. NSG loans can lend to a project (project finance) or a corporate
structure (corporate finance). These loans should promote MDB’s member countries’ economic
development by encouraging the private sector’s expansion and modernization, complementing public
sector financing. To do that, NSG lending aims at initiatives with high development impact, which often
carry significant risks for which the private banking sector may lack appetite. The pricing of the NSG
loans is set at market rates to avoid commercial banks’ crowding-out. For some MDBs, the preparation,
approval and administration of these loans are made by separate institutions with their own governance
and administrative expenses.
Beyond financing, MDBs also offer a set of non-financial services. MDBs’ lending comes bundled
together with know-how and valuable experience gained in similar projects in other countries and is
often complemented with non-reimbursable technical cooperation. While many of these components
could be separately purchased by the client countries, they come all packed together in the case of the
MDBs. The combination of financial, analytical, and technical support in one product (i.e., bundling) has
proven to be highly valued by borrowers.
MDBs can be grouped by their regional coverage. There are global, regional, and sub-regional
MDBs. Global MDBs lend to several continents. Regional MDBs (RMDBs) lend to just one continent Sub-
regional MDBs focus on a specific region that is smaller than a continent. This classification is not
absolute, as there are overlapping and border cases (Delikanli, et al., 2018).
MDBs’ mandates and instruments have evolved along with the international community varying
views on development. These mandates and instruments have also been continuously revised to
accommodate their client countries’ fluctuating needs as economic and financial market conditions
shifted over time. MDBs’ responses can be understood as the international community’s answer to the
challenges posed by critical situations at different points in time. In that regard, the COVID-19 pandemic
is the latest crisis that motivates a strong and immediate response from the MDBs, but surely it will not
be the last one. Box 1 briefly describes the evolution of mandates of MDBs since the creation of the first
one in the post-second world war.
A. Major multilateral development banks serving the region
Several MDBs provide financing to Latin America and the Caribbean (LAC). The first global MDB, the
World Bank, was established in 1944. At their conception, the World Bank was created to finance Europe
and Japan’s post-war reconstruction. However, once the Marshall Plan took over that duty, the
institution focused on assisting poorer countries. The first loan for LAC was granted to Chile in 1953. In
1959, the Inter-American Development Bank (IDB) was created in the Cold War context, replicating the
World Bank organization at the regional level. Since then, following a global trend of MDBs proliferation
(Kellerman, 2019), MDBs have continued to be created. In LAC, the Central American Bank for Economic
Integration (CABEI) was funded in 1960 and the Andean Development Corporation (CAF, now
rebranded as Development Bank of Latin America) in 1970. Table 1 lists all the Multilateral Development
Banks serving the region.ECLAC - Studies and Perspectives series-Washington, D.C. No. 21 Multilateral development banks in... 14
Table 1
Multilateral development banks serving Latin America and the Caribbean
Name Acronym Established
World Bank Group WBG 1944
Inter-American Development Bank Group IDB 1959
Central American Bank for Economic Integration CABEI 1960
Development Bank of Latin America CAF 1970
Caribbean Development Bank CDB 1970
International Investment Bank IIB 1970
Financial Fund for the Development of the River Plate Basin FONPLATA 1974
Islamic Development Bank IsDB 1974
OPEC Fund for International Development OFID 1976
International Fund for Agricultural Development IFAD 1977
Foreign Trade Bank of Latin America BLADEX 1979
Nortth American Development Bank NADB 1993
New Development Bank NDB BRICS 2014
Asian Infrastructure Investment Bank2 AIIB 2016
Source: (Ocampo & Ortega, 2020).
The four largest MDBs account for more than 95% of development lending to LAC. They are quite
different institutions in terms of geographic scope, assets, lending, capital volumes, and administrative
size. Table 2 presents some basic information. The World Bank and the IDB are relatively complex
organizations, with various sub-institutions and funds, each of these having its own membership,
governing boards, and articles of agreement. At the World Bank, SG lending is provided by the
International Bank for Reconstruction and Development (IBRD), the International Finance Corporation
(IFC) provides NSG lending, and the International Development Agency (IDA) grants concessional loans.
At the IDB Group, public sector loans are funded by its Ordinary Capital (ORC), and the IDB Invest provides
NSG lending. Concessional loans at the IDB were traditionally granted through the Fund for Special
Operations (FSO). In 2017, all the FSO’s assets and liabilities were transferred to ORC. On the other hand,
CAF and CABEI are simpler institutions, each with a single balance sheet for SG and NSG lending.
2
The AIIB was created to serve the Asia-Pacific region, but with the possibility of lending to members beyond Asia if the project
delivers a clear benefit to the region. Currently, Brazil, Ecuador, and Uruguay are non-regional members, and five other LAC
countries are prospective members. To date, the first project for LAC is being prepared: A $50 million credit line for Ecuador’s
National Financing Corporation.ECLAC - Studies and Perspectives series-Washington, D.C. No. 21
Table 2
Main MDBs in LAC: basic information, 2019
(In million of dollars)
World Bank Group IDB Group CAF CABEI
IBRD IDA IFC IDB ORC IDB Invest SG+NSG SG+NSG
Non-Conc. Concessional NSG SG NSG
Loans Outstanding 204 231 165 380 58 650 96 723 2 070 26 318 7 704
Of which LAC Region 61 757 2 925 12 085
Commitments 27 976 30 365 11 135 12 961 4 668 13 010 2 638
Of which LAC Region 6 798 978 3 165
Disbursements 20 238 21 179 10 518 10 574 1 607 10 043 1 934
Of which LAC Region 5 799 466 NA
Total Assets 296 804 199 472 95 800 136 358 42 294
Total Equity 40 387 168 171 25 182 33 871 12 797
Paid-in Capital 18 034 241 343 19 567 11 852 9 370
Callable Capital 269 968 … … 164 901 1 590
Net Income -42 -1 114 -1 672 1 385 326
Administrative Expenses 2 080 2 389 1 281 834 155
Rating S&P AAA AAA A+
Source: Compiled by authors based on MDBs Information Statements.
Note: Data for the WBG refer to the fiscal year 2020 ended in June. For the rest, data correspond to the calendar year 2019. IDB ORC paid-in includes $5.8 billion from the transfer of FSO’s assets and liabilities.
CAF’s paid-in includes amounts paid over the nominal value by shareholders. Data for IDB’s ORC contain some NSG lending.
Multilateral development banks in...
15ECLAC - Studies and Perspectives series-Washington, D.C. No. 21 Multilateral development banks in... 16
The four banks have different shareholding compositions. Non-borrowing countries dominate
the World Bank’s voting power, while CAF and CABEI are almost entirely owned by borrowing members.
Borrowing countries have a slight majority (50.015%) at the IDB. However, the US is the biggest
shareholder and enjoys veto power on major policy decisions that depend on the Board of Governors
(the highest governance body of each MDB). Differences in shareholdings between borrowing and non-
borrowing countries, together with who is the major shareholder, have a bearing on pricing and lending
volumes (Humphrey & Michaelova, 2013), (Humphrey, 2014) and the pattern of capital accumulation,
including the magnitude and frequency of capital replenishments (Artecona, et al., 2019).
Size-wise, the four MDBs are significantly different. The World Bank’s total assets are 4, 14 and
51 times higher than those of the IDB, CAF and CABEI, respectively. World Bank’s assets and
outstanding (i.e., loans disbursed and not yet repaid) are allocated across six regions worldwide. The
IDB is the main multilateral creditor of LAC in terms of outstanding. Its outstanding portfolio is almost
four times that of the CAF and 30% above the World Bank’s exposure to the region. In both the IBRD
and IFC at the World Bank, LAC has the highest exposure among the six administrative regions (30%
and 20%, respectively). However, the concessional fund of the Group (IDA) has limited exposure to LAC.
Most of the countries in the region have already graduated from this fund. The IDB group is also the
major institution in the region based on commitments (approvals) and disbursements, followed by CAF
(in the last seven years).
The leverage of each institution varies with client diversification opportunities, the overall
portfolio’s risk, and the source of funds. With far more clients and hence stronger risk pooling prospects,
the IBRD has the highest leverage. MDBs’ leverage can be measured by the ratio of development assets
(loan outstanding) to total equity. This ratio is 5 for the IBRD (5 dollars are lent per dollar of equity). In
turn, the IDB has higher leverage than the other two regional banks because its geographical
diversification is higher as well, and the risk embedded in its portfolio is lower. IDB’s leverage is close to
3, while CAF’s and CABEI’s leverages are close to 2. IDA operates mainly as a fund, lending only its capital
(with no leverage), and donor contribuitions funds its highly subsidized, long-tenured loans.
Box 1
The Evolution of Mandates of Multilateral Development Banks
MDBs views on development have continuously evolved. The World Bank’s initial focus was on infrastructure, in
line with the growth theories of the 1950s and 1960s that considered public infrastructure fundamental for
development. By the early 1960s, development views had started to recognize human capital as a necessary
complement to physical capital for economic development. The initial focus of the RMDBs broadening the scope
beyond infrastructure to include social sectors (García, 2015). RMDBs also placed an important emphasis on
integration.
The Debt Crisis in the 1980s dramatically changed the development priorities in the region. It revealed that
sovereign borrowing from private banks exposed the region to a type of risk significantly different from that of
borrowing from MDBs and other official sources. Private financing, if unrestrained, could make emerging markets
more volatile, further deepening their economic cycles. Against this background, a structural reform process was
undertaken in most countries in the region during the 1980s and early 1990s. The predominant view at the time, what
came to be known as the Washington Consensus, was that developing countries needed to open their economies,
reduce the scope of government intervention, and adopt prudent macro and monetary policies. In this context, MDBs
promoted state-owned enterprises’ privatization and addressed the states’ scaling down and modernization.
To assist countries facing debt and balance of payment imbalances, MDBs developed a new set of tools, the
“Policy Loans”: an instrument for which money flowed to the treasuries of the countries in exchange for policy and
institutional reforms that were thought to address the structural causes of the imbalances. The policy reforms were
induced through the conditionality attached to disbursements. Policy loans would provide additional fast funding to
heavily indebted countries in need of fresh funds. Inducing structural reform through policy conditionality required
close coordination between the main international financial institutions to guarantee their implementation.
Consequently, the roles of the IMF and Washington’s established MDBs were coordinated to deliver on the
implementation of those policy recommendations.ECLAC - Studies and Perspectives series-Washington, D.C. No. 21 Multilateral development banks in... 17
By the mid-1990s, the achievements of the Washington Consensus’s reforms were deemed to have come short of
expectations. Some of the reforms were later reversed. Following this change in paradigm, during the second half of
the 1990s and the beginning of the twenty-first century, MDBs adopted a more complete and complex view of
development. Efforts to substitute public sector financing and provision in social areas were re-evaluated, reassessing
the role played by public sector institutions in achieving growth and development (Burki & Perry, 1998). This vision
was anchored in Douglas North’s “New Institutional Economics.” This change resulted in project loans aimed at
improving the public sector’s efficiency and effectiveness, focusing on the quality of institutions in service delivery
rather than reducing the size of the public sector.
Departing from the Washington Consensus, MDBs revised conditionality. Policy loans continued to be
appreciated and demanded by client countries as a mechanism of budget support, but the conditionality included in
those loans changed. The preparation of this kind of loans became more of a dialogue between the MDB and the
borrower rather than an imposition. The twenty-first century also brought about new demands for social inclusion in
the region that, together with the increased access to international financing enjoyed by most countries in Latin
America, resulted in changes to MDBs operations. Interventions in poverty alleviation were strengthened, policy
conditionality was reviewed, and governments’ policy ownership was revalued. Environmental concerns continued to
evolve while MDBs developed internal structures to address these issues and expanded their involvement with civil
society to defend environmental and social safeguards.
Beyond SG lending, MDBs have always provided loans to the private sector. In 1956 the World Bank Group
launched the IFC “to further economic development by encouraging the growth of productive private enterprise in
member countries, particularly in the less developed areas, thus supplementing the activities of the IBRD” (IFC, 2017).
Similarly, the IDB created the IIC in the early 1990s, although its ordinary capital always allowed NSG lending.
Moreover, since its creation, CAF has provided financing with and without sovereign guarantees in similar amounts.
The relevance of private-sector lending has significantly increased in the last 20 years. Policy changes worldwide
placed a greater dependence on the private sector to promote development. Consequently, private sector lending
and mobilization have been placed at the centre of MDBs strategies, increasing the demand for better coordination
between the public and the private sector.
Finally, the New Development Agenda has imposed a re-focus of the mandates of the MDBs toward greater
collaboration to achieve the Sustainable Development Goals (SDGs). As a result, MDBs current focus pays special
attention to sustainability, social and environmental safeguards, climate change, and gender equality. According to
this new mandate, MDBs should play a critical role in supporting their member countries’ efforts to translate the SDGs
into meaningful country-level targets, policies, programs, and projects. To fulfil this mission, direct and indirect
financing (through mobilization) is required, as well as implementation support, policy advice, and technical
assistance. Nowadays, the main strategic priorities and a substantial percentage of operations and financial flows in
MDBs are associated with the SDGs. The New Development Agenda also calls for greater coordination among MDBs,
including the convergence around core standards (Shanmugaratnam, 2018). Still, coordination has become
progressively more complex over time due to the larger number of MDBs with significant differences in shareholding
serving the region.
Source: Prepared by the authors on the basis of (Artecona, et al., 2019.
Only sovereign guaranteed windows of resources have access to callable capital, which, as we
mentioned, is a guarantee granted by shareholders in case of impossibility of repaying MDBs’ obligations.
This callable capital is significantly higher in institutions with mixed ownership (borrowers and non-
borrowers). The main value-added of the guarantees lies in those granted by the high-rated, non-borrowing
member countries.
Banks also differ in how they use their income to accumulate reserves and increase equity. Net income
is negative for the IBRD’s and IFC’s due, in part, to transfers to IDA. On the other hand, the IDB heavily relies
on net income to accumulate equity, given the lack of appetite of IDB’s shareholders for regular
replenishments. Nowadays, only 35% of IDB’s equity corresponds to paid-in contributions, meaning that
accumulated reserves have generated 65% of the equity. CAF, which experienced four consecutive
replenishments between 2007 and 2015, does not need to generate a large net income to increase its capital,
as it relies on its members paid-in contribution. 73% of CAF’s equity corresponds to paid-in.ECLAC - Studies and Perspectives series-Washington, D.C. No. 21 Multilateral development banks in... 18
Finally`, the more diversified the portfolio, the higher the donors’ support, the clearer the policy
mandate, and the better the capital adequacy, the higher the MDB’s credit rating is. Capital adequacy
refers to the amount of equity needed by an MDB to meet its financial obligations, given the risk
embedded in its assets. The World Bank and the IDB are AAA institutions with a clear mandate from
their Governors to maintain this rating. CAF and CABEI do not achieve the highest rating, in part, due
to the limited diversification imposed by their sub-regional nature. Their ratings have been volatile,
depending on the sub-regional economic context.
Having analysed the basic features and financial information of MDBs serving the region, the next
section focuses on multilateral lending trends to LAC.ECLAC - Studies and Perspectives series-Washington, D.C. No. 21 Multilateral development banks in... 19
II. Stylized facts of multilateral lending to Latin America
and The Caribbean
This section focuses on the basic trends of multilateral lending to the region in the last 25 years. These
trends can be summarized as follows:
A. Multilateral debt has declined relative to total public
debt during the last decade
Although multilateral debt has grown in real terms, it has been declining as a percentage of total
external debt over the past fifteen years. The evolution of multilateral debt stocks has three well-
defined phases. During the period 1997-2004, multilateral debt grew in the region. Many countries
(notably Argentina, Brazil, Colombia, and Uruguay) obtained emergency loans to alleviate the emerging
markets’ crisis initiated in 1997 with the Asian financial crisis. Most of this debt (and particularly the
emergency loans) was repaid during 2005-2008; in these years, multilateral debt shrank. The beginning
of the GFC in 2008-2009 pushed multilateral debt up to $173 billion in 2019 (Figure 1). Multilateral debt
grew 1.8% yearly in real terms during the 1995-2019 period.
There was a decoupling between multilateral and public and publicly guaranteed (PPG) debt
during the last decade. PPG refers to debt either owed by the public sector or by the private sector but
backed by public guarantees. Until the first decade of this century, both the ratio of multilateral to PPG
debt and multilateral debt grew. Nevertheless, since 2010, while multilateral debt continued growing,
the ratio of multilateral to PPG debt decreased by about 7.5 percentage points, from 26.3% to 18.8%.
This decline resulted from a faster increase in public debt financed by private creditors (both through
bonds and commercial banks) than multilateral debt.ECLAC - Studies and Perspectives series-Washington, D.C. No. 21 Multilateral development banks in... 20
Figure 1
Multilateral debt stocks in real term and as a percentage of PPG debt
(In million of 2019 Dollars and as a percentage)
180,000 Multilateral Debt in Real 30
Terms
160,000 172,925
25
140,000
Million of 2019 dollars
120,000 20
Multilateral Debt as
Percentage
100,000 Percentage of Total 18.8
PPG Debt (Right Axis) 15
80,000
60,000 10
40,000
5
20,000
0 0
Source: Compiled by authors based on International Debt Statistics and US Bureau of Labor Statistics.
PPG debt can be financed by official (multilateral and bilateral) and private creditors. The latter
can be further divided into bonds and commercial banks’ lending. Table 3 shows the composition of PPG
debt among these categories. There is a prevalence of bonds over commercial banks’ loans on the
private creditors’ side since the Brady Plan was launched in the early 1990s.3 In the last 25 years, and
especially in the aftermath of the GFC, international financial markets have opened to small countries
and expanded to big ones, significantly increasing the region’s capital flows. As a result, nowadays, 60%
of the total public debt corresponds to bond issuances (more than $550 billion). Commercial banks’
share lending recovered in the last ten years due to improvements in macroeconomic conditions in
many countries and a low-interest-rate environment.
On the official side, the decrease of bilateral debt to LAC over the last two decades results from
a concerted move of the international donor community to focus on Africa and away from middle-
income countries (MICs), reducing the share of bilateral to only one-quarter of the 1990s’. On the other
hand, multilateral debt increased its share up to 2010 and sharply decreased thereafter.
3
Brady bonds were created to convert bank loans to Latin American countries into a variety of new tradable bonds after many of
those countries defaulted on their debt in the 1980s.ECLAC - Studies and Perspectives series-Washington, D.C. No. 21 Multilateral development banks in... 21
Table 3
Public and publicly guaranteed debt by type of creditor
Latin America (excluding high-income countries):
1990 2000 2010 2019
In percentage of total PPG debt
Bonds 24.1 56 57 60.7
Banks + Other Private 38.8 9.6 8.8 15.6
Sub-total Private Creditors 62.9 65.7 65.9 76.4
Bilateral 19 11.6 7.8 4.8
Multilateral 18.1 22.8 26.3 18.8
Sub-total Official Creditors 37.1 34.3 34.1 23.6
In millions of dollars
Total PPG Debt 309 989 394 997 478 778 919 000
Multilateral 56 034 89 863 125 977 172 925
Source: Compiled by authors based on International Debt Statistics.
B. For the smaller and poorer countries, multilaterals remain the main
source of public finance. Larger economies bear higher exposures
to private and bilateral Chinese debt
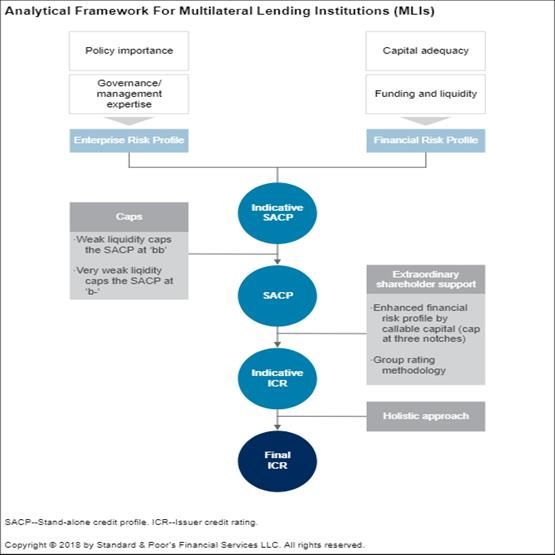
Aggregated data underestimate the importance of multilateral financing in the smaller and poorer
countries, where MDBs still account for more than half of PPG debt. Map 1 shows the percentage of
PPG debt by country in 2019. The 18.8% figure in the previous table is a weighted (by debt size) average
of bigger countries such as Brazil, Mexico, and Argentina (where multilateral debt is less than 20% of
PPG); and smaller and poorer countries such as Bolivia, Guatemala, Guyana, Honduras, and Nicaragua,
where more than 50% of PPG debt is multilateral. In these latter countries, international capital markets
are still incipient, with fewer bond issuances and less private financing access.
Data on bilateral debt deserves to be handled with caution. The International Debt Statistics (IDS)
may underestimate China’s financing to the region. The reason is that Chinese loans could not be
reflected in the previous figures, as the country is not part of the Development Assistant Committee
(DAC) group of donors. New databases (Gallagher & Myers, 2020) look at the recent bilateral lending
flows from China. Table 4 compares China’s finance to Latin America with multilateral commitments
during the period 2009-2019.
In those ten years, China, through its policy banks (China Development Bank and China Export-
Import Bank), granted more than $131 billion to LAC governments and state-owned enterprises. More
than 90% of these loans were allocated to four countries. In particular, in Venezuela and Ecuador, the
amounts granted by Chinese policy banks were higher (in Venezuela, almost nine times, and for the
biggest four countries, almost 30% more) than multilateral commitments during the same period.
Overall, China’s loans were equivalent to almost 60% of total commitments from MDBs to the region.
Chinese lending piked in 2015-2016 and subsided after that. In fact, less than $10 billion have been
approved in the last three years.ECLAC - Studies and Perspectives series-Washington, D.C. No. 21 Multilateral development banks in... 22
Map 1
Multilateral Debt as a Percentage of Total Public and Publicly Guaranteed Debt
Source: Compiled by authors based on International Debt Statistics.
Note: Excluding High-Income Countries.
The boundaries and names shown on this map do not imply official endorsement or acceptance by the United Nations.
Table 4
China’s Finance to Latin America and Multilateral Commitments 2009-2019
(In millions of dollars and percentage of multilateral commitments)
Percentage
SG multilateral
Country Loans from China China/Multilateral
commitments
(percentages)
Venezuela (Bolivarian Republic of) 58 200 6 713 867
Brazil 27 794 43 243 64
Ecuador 18 400 15 424 119
Argentina 17 070 29 958 57
Bolivia (Plurinational State of) 3 400 10 230 33
Jamaica 2 100 3 540 59
Subtotal 126 964 109 108 116
Rest of LAC 4 934 113 848 4
Total 131 898 222 956 59
Source: Compiled by authors based on International Debt Statistics and (Gallagher & Myers, 2020).
Note: SG multilateral commitments correspond to PPG commitments to LAC, excluding high-income countries.You can also read