Universal Basic Income and Inclusive Capitalism: Consequences for Sustainability - MDPI
←
→
Page content transcription
If your browser does not render page correctly, please read the page content below
sustainability

Article
Universal Basic Income and Inclusive Capitalism:
Consequences for Sustainability
Ralph P. Hall 1, * , Robert Ashford 2 , Nicholas A. Ashford 3 and Johan Arango-Quiroga 4
 1    School of Public and International Affairs, Virginia Tech, Blacksburg, VA 24061, USA
 2    College of Law, Syracuse University, Syracuse, NY 13244, USA
 3    Technology and Law Program, Massachusetts Institute of Technology, Cambridge, MA 02139, USA
 4    Sustainability Program, Harvard University, Extension School, Cambridge, MA 02138, USA
 *    Correspondence: rphall@vt.edu

 Received: 20 June 2019; Accepted: 12 August 2019; Published: 19 August 2019

 Abstract: Over the past forty years, income growth for the middle and lower classes has stagnated,
 while the economy (and with it, economic inequality) has grown significantly. Early automation,
 the decline of labor unions, changes in corporate taxation, the financialization and globalization
 of the economy, deindustrialization in the U.S. and many OECD countries, and trade have
 contributed to these trends. However, the transformative roles of more recent automation and
 digital technologies/artificial intelligence (AI) are now considered by many as additional and
 potentially more potent forces undermining the ability of workers to maintain their foothold in
 the economy. These drivers of change are intensifying the extent to which advancing technology
 imbedded in increasingly productive real capital is driving productivity. To compound the problem,
 many solutions presented by industrialized nations to environmental problems rely on hyper-efficient
 technologies, which if fully implemented, could further advance the displacement of well-paid job
 opportunities for many. While there are numerous ways to address economic inequality, there is
 growing interest in using some form of universal basic income (UBI) to enhance income and provide
 economic stability. However, these approaches rarely consider the potential environmental impact
 from the likely increase in aggregate demand for goods and services or consider ways to focus this
 demand on more sustainable forms of consumption. Based on the premise that the problems of
 income distribution and environmental sustainability must be addressed in an integrated and holistic
 way, this paper considers how a range of approaches to financing a UBI system, and a complementary
 market solution based on an ownership-broadening approach to inclusive capitalism, might advance
 or undermine strategies to improve environmental sustainability.

 Keywords: universal basic income (UBI); effective demand; inequality; environment; sustainability;
 inclusive capitalism; binary economics; capital ownership; fuller employment; worker ownership

1. Introduction

1.1. The Inequality Challenge
     Until the 1980s, growth in U.S. labor productivity, private employment, median family income,
and real GDP per capita grew in tandem (Figure 1) [1]. Since then, growth in private employment and
median family income has lagged behind economic growth, and during the 2000s was largely stagnant.
These trends reveal that compared to the rest of the population, the top 10 percent and, especially, the
top 1 and 0.1 percent of the U.S. population measured by real annual earnings, have experienced by
far the greatest financial gains (Figure 2). Since the 1970s, when compared with the 90th percentile,
median family wealth in the U.S. has been flat, revealing that the U.S. middle class, and especially

Sustainability 2019, 11, 4481; doi:10.3390/su11164481                     www.mdpi.com/journal/sustainability
Sustainability 11, 4481
2019,2019,
Sustainability 11, x FOR PEER REVIEW 2 of229
of 30
Sustainability 2019, 11, x FOR PEER REVIEW 2 of 30
productivity and economic growth [2]. Further, since 2000, wages as a percentage of GDP have fallen
minority/disadvantaged
sharply (dropping populations,
below 60% for are
theno longer
first timebenefiting
around from gains
2005), in labor productivity and to
productivity and economic growth [2]. Further, since 2000, wages as awhile the
percentage share of GDP
of GDP going
have fallen
economic growth
corporate [2]. Further,
profitsbelow
has been since 2000,
increasing wages
[1]. One as a percentage of GDP have fallen sharply (dropping
sharply (dropping 60% for the first timeoutcome
around from
2005),these trends
while the is that of
share younger generations
GDP going to
below
are 60% for the
finding first difficult
it more time around 2005), while
to accumulate the share of GDP
3) [3].going to corporate profits has been
corporate profits has been increasing [1]. One wealth
outcome (Figure
from these trends is that younger generations
increasing [1]. One outcome from these trends is that younger generations are finding it more difficult
are finding it more difficult to accumulate wealth (Figure 3) [3].
to accumulate wealth (Figure 3) [3].
380
Labor Productivity
380
RealProductivity
Labor GDP per Capita
330
Private
Real Employment
GDP per Capita
330
Median
Private Family Income
Employment
280
Median Family Income
280
230
230
180
180
130
130
80
1953 1960 1965 1970 1975 1980 1985 1990 1995 2000 2005 2010 2014 2018
80
1953 1960 1965 1970 1975 1980 1985 1990 1995 2000 2005 2010 2014 2018
Figure 1. Key economic, productivity, and private employment trends, 1953–2018. Note: Index 1953
Figure 1. Key economic, productivity, and private employment trends, 1953–2018. Note: Index
= 100.
Figure Source:
1. Key Federalproductivity,
economic, Reserve Bankand
of St. Louis.employment
private Adapted andtrends,
updated from Reference
1953–2018. [1]. 1953
Note: Index
1953 = 100. Source: Federal Reserve Bank of St. Louis. Adapted and updated from Reference [1].
= 100. Source: Federal Reserve Bank of St. Louis. Adapted and updated from Reference [1].
400%
400%
350%
Top 0.1%
350%
300% TopTop
0.1%
1%
300% TopBottom
1% 90%
250%
Bottom 90%
250%
200%
200%
150%
150%
100%
100%
50%
50%
0%
0%
-50%
-50% 1979 1984 1989 1994 1999 2004 2009 2014
1979 1984 1989 1994 1999 2004 2009 2014
Figure 2. Cumulative percent change in real annual earnings (by earnings group), 1979–2017. Note:
Figure 2. Cumulative percent change in real annual earnings (by earnings group), 1979–2017. Note:
Index 1979 = 0%. Sources: Adapted from Reference [4] and U.S. Social Security Administration
Index
Figure 1979 = 0%. Sources:
2. Cumulative percentAdapted
change infrom
realReference [4] and (by
annual earnings U.S.earnings
Social Security
group),Administration wage
1979–2017. Note:
wage statistics.
statistics.
Index 1979 = 0%. Sources: Adapted from Reference [4] and U.S. Social Security Administration wage
statistics.
If these trends are considered alongside changes in the cost of living (Figure 4), it can be seen
that growing healthcare and education expenses are most likely to impact the young and poor [5–7].
In contrast, the reduction in the price of tradeable goods and services such as communication has likely
somewhat softened the impact of stagnant wages for the majority of workers.
Given the above, a critical question is “why have workers (through wages) failed to maintain
their share of GDP?” Earlier automation, the decline of labor unions, changes in corporate taxation,
the financialization and globalization of the economy, deindustrialization in the U.S. and many OECD
countries, and trade have surely played a role [8,9]. However, the transformative roles of more recentSustainability 2019, 11, 4481 3 of 29
automation and digital technologies/artificial intelligence (AI) are now considered by many as the
emerging forces undermining the ability of workers to maintain their foothold in the economy [8,10,11].
Automation is likely to impact 1.2 billion jobs globally (representing $14.6 trillion in wages) and
60.6 million jobs in the United States (equivalent to $2.3 trillion in wages) [12]. Jobs with highly
predictable physical work are more likely to be automated with existing technological capabilities.
Some of these jobs include, but are not limited to, food preparation and serving tasks in accommodation
and food service businesses, aircraft assemblers, first-line supervisors in the resource extraction
industry, and transportation and warehousing jobs [12]. The disruption caused by AI and automation
Sustainability 2019, 11, x FOR PEER REVIEW 3 of 30
technologies is likely to only continue to increase as their capabilities improve and costs decline.
70%
1989 2007 2010 2013 2016
50%
30%
17%
10% 4% 4%
-10%
-11%
-30% -18%
-34%
-50%
1930-1939 1940-1949 1950-1959 1960-1969 1970-1979 1980-1989
Birth Cohort
Figure 3. Deviation of median wealth from predicted value. Note: Deviation of 2016 wealth from
Figure 3. Deviation of median wealth from predicted value. Note: Deviation of 2016 wealth from
predicted values based on life cycle wealth trajectories. Source: Adapted from Reference [3].
predicted values based on life cycle wealth trajectories. Source: Adapted from Reference [3].
These drivers of change are intensifying the extent to which increasingly productive real capital is
If these trends are considered alongside changes in the cost of living (Figure 4), it can be seen
driving productivity and simultaneously hollowing out the middle class (Figure 5) [14]. The polarization
that growing healthcare and education expenses are most likely to impact the young and poor [5–7].
of the workforce is increasing the skills needed to engage in the high-skilled/high-earning jobs, making
In contrast, the reduction in the price of tradeable goods and services such as communication has
them unattainable for many. From 1980 to 2015, the number of workers in jobs that require average
likely somewhat softened the impact of stagnant wages for the majority of workers.
or above-average education, training, and experience increased by 68 percent, whereas employment
Given the above, a critical question is “why have workers (through wages) failed to maintain
in lower-skill jobs had a weaker growth of 31 percent [15]. These lower-skill jobs do not provide
their share of GDP?” Earlier automation, the decline of labor unions, changes in corporate taxation,
the same income status that middle-income jobs used to provide and have a higher likelihood of
the financialization and globalization of the economy, deindustrialization in the U.S. and many
becoming automated in the future [16]. Female workers may also bear the brunt of technological
OECD countries, and trade have surely played a role [8,9]. However, the transformative roles of more
displacement, worsening the gender gap [17,18]. As middle-income jobs hollow out, the majority of
recent automation and digital technologies/artificial intelligence (AI) are now considered by many as
workers find themselves searching for employment in the service sector. In fact, over 90 percent of net
the emerging forces undermining the ability of workers to maintain their foothold in the economy
employment growth in the U.S. from 2005 and 2015 appears to have occurred in the service sector
[8,10,11]. Automation is likely to impact 1.2 billion jobs globally (representing $14.6 trillion in wages)
(in independent freelance/contract work, temporary work, etc.), with conventional full-time jobs in
and 60.6 million jobs in the United States (equivalent to $2.3 trillion in wages) [12]. Jobs with highly
decline [19]. The polarization of the workforce is not just a U.S. phenomenon; it is also occurring in
predictable physical work are more likely to be automated with existing technological capabilities.
the majority of European countries [14,16]. In the OECD, over the past three decades an average of
Some of these jobs include, but are not limited to, food preparation and serving tasks in
1% of the population each decade has ceased to be middle income—defined as “households earning
accommodation and food service businesses, aircraft assemblers, first-line supervisors in the resource
between 75% and 200% of the median national income” [16] (p. 13)—with one third moving into the
extraction industry, and transportation and warehousing jobs [12]. The disruption caused by AI and
upper-income category and two thirds moving into the lower income category.
automation technologies is likely to only continue to increase as their capabilities improve and costs
decline.Sustainability 2019, 11, 4481 4 of 29
Sustainability 2019, 11, x FOR PEER REVIEW 4 of 30
225%
Hospital services
Educational textbooks
175% Tuition, school fees,
and childcare
MORE
125% Medical care services
EXPENSIVE TV and radio services
Overall inflation from Wages
75% 1997 to 2019 is 60.18% Housing
Food and beverages
25%
New cars
Apparel
Telephone services
-25%
Computer software
-75% Toys
Personal computers
MORE Televisions
AFFORDABLE
-125%
1998 2008 2018
Figure 4. Price changes 1997 to 2018. Note: The black lines indicate prices (of non-tradeable goods and
Figure 4. Price changes 1997 to 2018. Note: The black lines indicate prices (of non-tradeable goods and
services) that are typically not subject to market forces. The green lines indicate the prices (of tradable
services) that are typically not subject to market forces. The green lines indicate the prices (of tradable
goods and
Sustainability services)
2019, that
11, x FOR areREVIEW
PEER subject to competition/market forces. The dotted line represents wages. 5 of 30
goods and services) that are subject to competition/market forces. The dotted line represents wages.
Source: Federal Reserve Bank of St. Louis. Adapted and updated from Reference [13].
Source: Federal Reserve Bank of St. Louis. Adapted and updated from Reference [13].
50
These drivers of change
Low-skilled / are intensifying the extent to which increasingly
Middle-skilled productive
High-skilled / real capital
40
is driving productivity
Service and simultaneously hollowing out the middle class (Figure 5) [14]. The
Highly-paid
100 x log Change in
polarization
30 of the workforce is increasing the skills needed to engage in the high-skilled/high-
Employment
earning jobs, making them unattainable for many. From 1980 to 2015, the number of workers in jobs
20 require average or above-average education, training, and experience increased by 68 percent,
that
whereas
10 employment in lower-skill jobs had a weaker growth of 31 percent [15]. These lower-skill
jobs do not provide the same income status that middle-income jobs used to provide and have a
0 likelihood of becoming automated in the future [16]. Female workers may also bear the brunt
higher
of-10
technological displacement, worsening the gender gap [17,18]. As middle-income jobs hollow out,
the majority of workers find themselves searching for employment in the service sector. In fact, over
-20percent of net employment growth in the U.S. from 2005 and 2015 appears to have occurred in the
90
service sector (in independent freelance/contract work, temporary work, etc.), with conventional full-
time jobs in decline [19]. The polarization of the workforce is not just a U.S. phenomenon; it is also
occurring in the majority of European countries [14,16]. In the OECD, over the past three decades an
average of 1%1979-1989
of the population each decade has
1989-1999 ceased to be 2007-2012
1999-2007 middle income—defined as
“households earning between 75% and 200% of the median national income” [16] (p. 13)—with one
Figure Changeinto
third5.moving in employment by majorcategory
the upper-income occupational
andcategory, 1979–2012.
two thirds movingNote: Thislower
into the figureincome
plots category.
percentage point changes
Figure 5. Change in employment
in employment by major(more precisely,
occupational the figure
category, plots 100Note:
1979–2012. timesThis
logfigure
changes in
plots
employment, whichchanges
percentage point is close to
inequivalent
employmentto percentage points the
(more precisely, for small
figurechanges)
plots 100bytimes
decade
logfor the years
changes in
1979–2012 for ten
employment, major
which is occupational groups
close to equivalent to encompassing all of
percentage points forU.S. nonagricultural
small employment.
changes) by decade for the
Agricultural occupations comprise no more than 2.2 percent of employment in this
years 1979–2012 for ten major occupational groups encompassing all of U.S. nonagricultural time interval, so
this omission has a negligible effect. Source: Adapted from Reference [14].
employment. Agricultural occupations comprise no more than 2.2 percent of employment in this time
interval, so this omission has a negligible effect. Source: Adapted from Reference [14].
The trends above paint a challenging picture that is increasingly apparent to growing numbers of
people,The
buttrends
it is not new.paint
above In thea mid-1960s,
challengingthe Rev. Dr.
picture thatMartin Luther King,
is increasingly Jr. identified
apparent thenumbers
to growing problem
of people, but it is not new. In the mid-1960s, the Rev. Dr. Martin Luther King, Jr. identified the
problem through his work on civil rights and the Poor People’s campaign. In his final book, “Where
Do We Go From Here? Community or Chaos”, Dr. King, Jr. made the following statement:
“Automation is imperceptibly but inexorably producing dislocations, skimming off
unskilled labor from the industrial force. The displaced are flowing into proliferating
service occupations. These enterprises are traditionally unorganized and provide low wageSustainability 2019, 11, 4481 5 of 29
through his work on civil rights and the Poor People’s campaign. In his final book, “Where Do We Go
From Here? Community or Chaos”, Dr. King, Jr. made the following statement:
“Automation is imperceptibly but inexorably producing dislocations, skimming off unskilled
labor from the industrial force. The displaced are flowing into proliferating service
occupations. These enterprises are traditionally unorganized and provide low wage scales
with longer hours”. [20] (p. 149)
Given the challenges presented above, two critical questions are (1) how to shape the economy so
that it directly addresses current trends in income and wealth inequality and works for everyone [21],
and (2) how to accomplish this in a way that is environmentally sustainable [22].
1.2. The Environmental Challenge
A corollary concern to inequality is the environmental challenge. There are four general areas of
environmental concern that have emerged over the past fifty years [8]: (1) ecosystem integrity and the
loss of biodiversity; (2) resource depletion; (3) toxic pollution; and (4) climate change.
Concerns about the disruption of ecosystems, the loss of biological diversity, and the indirect
effects these have on human health and well-being were initially raised in the early 1960s, when
industrial processes and the use of pesticides were revealed to have led to environmental degradation
and a loss of wildlife [23]. Three decades later, public concern began to focus on endocrine disrupters
that affect reproductive health in all species [24,25]. More recent concerns have been raised about the
impacts of the loss of biodiversity on mental health, nutrition, and increased exposure to infectious
diseases [26]. While significant technological progress has been made in improving industrial and
agricultural practices, the negative impacts of these sectors still present a problem [27].
The second environmental concern relates to the world’s finite resources and energy supplies
and asks whether there are sufficient resources to provide continuing economic growth—i.e., are there
limits to growth [28–31]? A connected concern is what the environmental impact will be from using a
significant proportion of the existing resources.
The third concern is toxic pollution that directly adversely affects human health and the health of
other species [24,27,32–37]. As scientists began to understand how ecosystems, humans, and other
organisms were affected by industrial and agricultural processes, the issue of how toxic chemicals
interact with biological systems gained prominence. In the same way, the understanding of how
communities of color in the U.S. suffer as a result of the disproportionate exposure to toxic pollutants
that they themselves do not generate is gaining greater recognition [38–41].
The final, more recent, concern is that greenhouse gases from anthropocentric (human-driven)
sources are leading to a disruption of the global climate [42]. Scientists predict (with high confidence)
that relative to 1850–1900, these gases will cause the globally averaged surface air temperature to
increase by at least 1.5 ◦ C by the end of the 21st century (2081–2100) [42]. The 2015 Paris Climate
Agreement (COP21) focuses on limiting a rise in global average temperature “to well below 2 ◦ C above
pre-industrial levels,” with an aspirational target of limiting the increase to 1.5 ◦ C [43] (p. 3). Achieving
the target of 1.5 ◦ C of warming above pre-industrial levels will be extremely difficult without massive
and targeted investment in low-carbon technology, and even if the 1.5 ◦ C target is achieved, low-lying
regions and the poor/vulnerable will still be adversely impacted [44]. At the other end of the continuum
where predictions put the warming of the planet around 4 ◦ C by the end of the century [45], the costs
of doing little or nothing (i.e., business as usual) are catastrophic [46].
The first, third, and fourth environmental concerns are connected with the unintended effects
of growing human production and consumption systems, while the second deals with increasing
shortages of resources needed to fuel these systems.
Today, the 2015 Sustainable Development Goals (SDGs) provide a comprehensive statement on
the tenets of sustainable development. The SDGs also continue to advance a technologically optimistic
and growth-oriented approach to development that has its roots in the Brundtland formulation ofSustainability 2019, 11, 4481 6 of 29
sustainable development. For example, SDG 9 calls for “inclusive and sustainable industrialization”
supported by “innovation,” and SDG 8 for “sustained, inclusive, and sustainable economic growth,
full and productive employment, and decent work for all.” The challenge is that an innovation-fueled
“green” growth agenda (SDG 9) is unlikely to realize the latter employment goals if technology
continues to displace routine (physical and cognitive) tasks [10,47–49]. Thus, while environmental
improvements may occur, the goal of addressing inequality via “full and productive employment” is
unlikely to be achieved.
1.3. Moving Beyond Green Growth
While the notion of “green growth” [50] is an important step beyond the current growth paradigm,
going green is not enough to handle the income/wealth disparities that have been developing [48,49].
Further, there is no empirical evidence that green growth has, or will in the near future, decouple the
economy from its environmental impacts [51], highlighting the need for a fundamentally different
approach to how we advance economic development and sustainability.
A more plausible outcome from innovation-fueled “green” growth might be that as production
becomes more capital (i.e., technology) intensive, the ability to distribute wealth via wages will decline,
revealing an urgent need for capital-based mechanisms for income/wealth distribution. Expressed in
more general terms, as production becomes more capital intensive, there is an urgent need for income
distribution to also become more capital intensive. This framing has important implications for the
financing of a UBI designed to address income inequality. Further, as the comparative analysis in
this paper reveals, while some UBI approaches do incorporate environmental concerns; many do not.
Thus, selecting or developing a UBI approach that combines the earnings of capital ownership with a
robust environmental protection regime, presents a unique opportunity to move beyond the green
growth agenda.
1.4. The EKC Hypothesis
Given the core argument of this paper that any strategy to advance a UBI must be integrated with
mechanisms to protect the environment, there may be some who might respond that the Environmental
Kuznets Curve (EKC) hypothesis means the focus need only be on increasing income/wealth. The EKC
hypothesis postulates that the relationship between a specific environmental pollutant (such as sulfur
dioxide) and per capita income follows an inverted-U shape. This relationship implies that as a nation’s
GDP per capita increases, environmental degradation will first increase up to a turning point that
varies by pollutant [52–54], after which it will begin to fall. The EKC hypothesis challenges the need
to consider UBIs from an environmental perspective, because if the relationship holds, the increased
income could enable people to demand and pay for environmental improvements.
However, the EKC hypothesis is a somewhat academic idea that on balance is not supported by
the empirical evidence [55–59]. While EKCs have been found in relation to local air pollutants, they do
not hold for long-lived measures such as carbon dioxide (CO2 ), municipal waste, and persistent toxic
chemicals, which increase monotonically with per capita income [60–63]. Studies focusing on the EKC
hypothesis also do not consider the total impact of economic growth on the environment and whether
this may (in some cases) be irreversible [61].
If a UBI is implemented without any consideration of the environmental impacts caused by a surge
in consumption from a sudden increase in aggregate demand, it is highly likely that environmental
problems will worsen and that—without an innovative regulatory regime that protects critical
ecological systems and promotes disruptive technological change [8]—these may not decline over
time. A similar concern was raised in the context of adopting a four-day workweek to allegedly reduce
consumption [64,65].
The following section reviews a broad range of approaches to financing a UBI and highlights how
these approaches (1) frame the driving forces of growing income/wealth inequality and (2) consider
the impact that the proposed UBI might have on the environment.Sustainability 2019, 11, 4481 7 of 29
2. Strategies to Provide a Universal Basic Income (UBI)
In response to growing trends in inequality across the world, the idea of a universal basic income
(UBI) is increasingly gaining traction not only in academic circles, but also in policy arenas. Indeed,
“[t]he idea of assured [guaranteed/basic] income is in the policy and political air” [9] (p. 10). Those
advocating for a UBI tend to do so on the grounds of social justice, individual liberty, and financial
security [66,67]. Some advocates argue that policies that more broadly distribute or redistribute income
will promote fuller employment and per-capita growth [68,69].
Those opposing a UBI tend to raise questions about its affordability, the need to raise taxes in
ways likely to suppress growth-enhancing investment and employment, and the possibility that a UBI
would reduce people’s incentive to work. Indeed, labor work plays a role not only in financial stability,
but also in psychological well-being and social integration; and a UBI could constitute, in some cases,
a disincentive to find a job. This debate has been going for some time in EU countries, where there are
typically systems in place covering shortfalls in earning capacity, with the state providing allowances
for underprivileged households and/or unemployment compensations. A “solution” has consisted of
making unemployment benefits temporary and dependent on the amount of days previously worked,
so that beneficiaries have incentives to find a job. However, this arrangement is proving insufficient in
cases (increasingly frequent) of the longtime unemployed who often find themselves unable to secure
a job, lacking marketable skills, and without unemployment benefits.
Although the approaches may vary, there are only five ways to legitimately increase the funds
available to people to cover their consumer needs and wants: (1) labor (wages); (2) capital (dividends,
interest, and rent); (3) government redistribution of income and capital; (4) private charity; and
(5) consumer debt. Because consumer debt without the future repayment ability is unsustainable,
private charity has proven systemically inadequate, and capital acquisition based on mainstream
market principles has produced an increasing concentration (rather than a broadening) of capital
ownership, most approaches to enhancing income for poor and middle class people are based on
increasing wages and/or government redistribution of income or capital.
As will be discussed below, there is an alternative approach to broadening capital ownership that
is based on binary economics. This approach maintains that it is the increasing productiveness of
capital enhanced by technological advance (not labor) that is doing an ever greater share of the work,
creating more of the wealth, and is driving economic growth and inequality [70]. When understood
through this lens, the mechanism of how a UBI is financed matters.
As automation and AI do an increasing share of work relative to labor, financing a UBI in a way
that directly links income to the work being done, and wealth created, by capital is critical. When
framed this way, people could receive an income from their labor and from the work that the capital
they may own does for them. Thus, the understanding of work and its distributive consequences needs
to be viewed not only as the work done by labor, but also the work increasingly done by capital. A key
question raised by this approach is how people can acquire a capital ownership stake without using
labor earnings (which for growing numbers of people are already insufficient to support their needs
without being supplemented by growing consumer debt). A second and equally important question is
how the ownership-broadening capital acquisition can be structured to advance sustainable, rather
than destructive, production and consumption. These questions are addressed below and in Section 3.
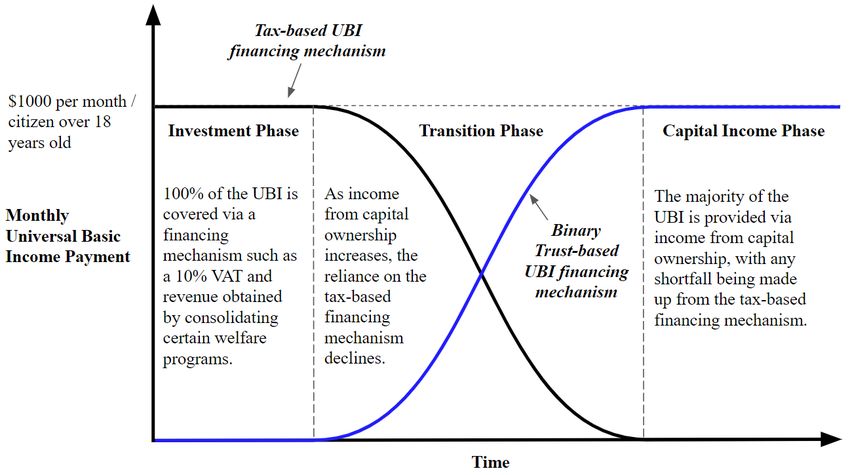
A UBI could be provided through either a redistributive or distributive approach, or some
combination of the two (as proposed in Section 3). The redistributive approach would finance a
UBI by redistributing wealth through taxes on earned income/accumulated wealth. The distributive
approach, would finance a UBI by profitable, credit-worthy enhanced growth prospects that can
rationally be expected to result from a broader distribution of capital acquisition and future capital
income. This approach would cause a broader future distribution, rather than a current redistribution,
of wealth and income.
Regardless of the rationale for providing a basic income, the idea is now attracting support
from many quarters [71]. This interest has prompted the launch of a number of basic income pilotSustainability 2019, 11, 4481 8 of 29
projects around the world (Box 1). While these pilots seem structured to help deepen knowledge
regarding the impact of different forms of a UBI on the recipients of the income, a number of proposals
exist for implementing a basic income for all citizens/residents of a country/region. Table 1 provides
a summary of several economy-wide approaches to providing a UBI (or guaranteed employment)
and highlights their financing mechanism, whether the approach has an employment requirement,
the income received (if known) and by whom, and whether a connection exists between the approach
and sustainable development. A more detailed description of each program is provided in Table A1 in
Appendix A.
Box 1. Examples of basic income pilot projects.
Finland: Finland ran a pilot project from 1 January 2017, to 31 December 2018 [72]. The pilot consisted of
granting €560 as a tax-free monthly unconditional benefit to 2000 randomly selected unemployed people for two
years. The amount was not reduced if they earned an income, and they were not obliged to search for jobs.
Kenya: In Kenya, a charity called Give Directly launched in October 2016 a pilot UBI experiment, consisting
of giving a number of villages different amounts of money (from $22.50 to several hundred dollars) during
different periods of time (between two and 12 years) and observing the results [73].
California: In Oakland, California, Silicon Valley’s largest startup accelerator, Y Combinator, announced in
2017 it would be paying $1000 per month for three to five years to 1000 randomly selected people (from a sample
population of 3000 people) across two states [74].
In Stockton, California, the Stockton Economic Empowerment Demonstration (SEED) project has been
disbursing $500 per month to 130 recipients. This pilot project started in February, 2019, and will run for
18 months. In order to be eligible, recipients had to be over 18 years old and reside in a neighborhood where the
median income was equal or below $46,003. The payments are made to recipients regardless of their employment
status [75].
Canada: In Ontario, Canada, the Ontario basic income pilot (which began in June 2017) was designed to
provide up to CA $16,989 for a qualifying low-income single person and $24,027 for a couple (less 50 percent
of any earned income) for up to three years [75]. However, the pilot was cancelled by a new conservative
government and the 4000 recipients received their final payments on 31 March 2019 [76].
Germany: In Germany, a new program will be launched in 2019 where 250 qualifying citizens will be
“sanction free” for three years under the Hartz IV social security system, enabling them to retain their benefits
(income) while trying to search for employment [77].
India: In India, two basic income experiments in the state of Madhya Pradesh were undertaken in 2010,
in which more than 6000 people received small monthly payments for 18 months. The state of Sikkim now plans
to provide a universal basic income to more than 611,000 inhabitants, making it the largest pilot program in the
world [78].
Namibia: In Otjivero–Omitara, Namibia, a pilot project ran from January 2008 to December 2009. It provided
a monthly income of N$100 per person. The payments were made to residents who were under 60 years old
regardless of their employment status [79].
Mississippi: In Jackson, Mississippi, The Magnolia Mother’s Trust will be giving 15 low-income families
headed by Africa American females $1000 per month for one year as part of a pilot project, more than doubling
the annual income of these households [80].
Spain: In Barcelona, the City and collaborating partners have been providing payments to 1000 households
since October 2017. The pilot will be running until September 2019. The monthly payments can be up to €403 to
cover basic needs and up to €260 to cover main dwelling expenditures [81].
Uganda: In Uganda, starting in 2017 the nonprofit Eight began providing unconditional weekly cash transfers
(through mobile payments) to 56 adults (USD ~$16) and 88 children (USD ~$8) in a rural village [82].
United Kingdom: Provided that Labour is in control of the government, the political party has promised to
run a pilot project that provides weekly payments of £100 to every citizen, and an additional £50 for every child
in the household, regardless of income or wealth. The trials would be tested in Liverpool, Sheffield, and in some
locations in the Midlands [83,84].
United States: Since 1996, and with now nearly 13,000 members enrolled, the Eastern Cherokee Reservation
has disbursed two annual payments from the profits generated by a casino. Recipients must finish high-school
to start collecting payments at age 18. Otherwise, the disbursements are postponed until members turn 21.
The average per capita payment is approximately $4000 per year [85]. However, the largest disbursement took
place in December 2018 with a payment of $7007 before taxes [86].Sustainability 2019, 11, 4481 9 of 29
Table 1. Summary of strategies to address income inequality.
Environmental/Sustainability
Scheme/Program Principal Financing Mechanism(s) Work Req.? Amount Received? By Whom?
Aspects?
A Negative Income Tax (NIT)
Taxation combined with the removal of Citizens/residents
(inspired by Milton Yes Varies based on income None
welfare assistance programs who file a tax return
Friedman [87])
Single people earning less than
Modernization of the Earned Income Tax $50,000 a year would receive $4000 All workers age 18+,
Cost of Living Refund [88] Credit (EITC) (also known as the Yes annually; married couples earning including “childless” None
Working Families Tax Credit) less than $90,000 a year would workers
receive $8000 annually
Compensation from the work
program would be comparable to Funded projects should be
Federal Job Guarantee
public sector employees Participants enrolled carried out “in a manner that is
Program (H.R. 1000—Jobs for A National Full Employment Trust
Yes undertaking similar work; in a work or training as ecologically sustainable as is
All Act—submitted to the Fund (NFETF)
job-training program participants program reasonably possible”
116th U.S. Congress)
would be eligible for a (Sec. 304(10))
cost-of-living stipend
UK Labour—Inclusive Workers in a firm
Inclusive Ownership Fund (IOF) Yes Up to £500 per month None
Ownership Fund (IOF) [89] with an IOF
Lansley and Reed’s [90] The elimination of child benefit Varies based on age and marital
Partial Basic Income (PBI) payments and state pensions, and No status; ranges from £2080 to £10,400 Every British citizen None
Proposal in the UK reductions in means-tested benefits annually
Lansley and Reed’s [90] Fuller Varies based on age and marital
Same as PBI (above) with the addition of
Basic Income (FBI) Proposal No status; ranges from £2600 to £13,520 Every British citizen None
a Citizen’s Wealth Fund
in the UK annually
Elimination of 126 welfare programs;
reduction in government tax
Potentially—if a common
expenditures/spending; a 5%–10% value
wealth fund is created based on
Andy Stern’s [91] Universal added tax (VAT) on goods and services; a Every U.S. citizen
No $1000 a month the principles underlying
Basic Income (UBI) Proposal financial transaction tax (FTT); a between 18 and 64
Common Wealth Trusts (CWTs)
“common wealth” fund; a 1.5 percent
(see below)
wealth (or net worth) tax on personal
assets over $1 million
A 10% value added tax (VAT) on the
production of goods or services a
Andrew Yang’s [11] Universal Every U.S. citizen
business produces; certain welfare No $1000 a month None
Basic Income (UBI) Proposal over the age of 18
programs (unspecified) would
be consolidatedSustainability 2019, 11, 4481 10 of 29
Table 1. Cont.
Environmental/Sustainability
Scheme/Program Principal Financing Mechanism(s) Work Req.? Amount Received? By Whom?
Aspects?
A trust fund managed by the Social
Children (0–17) would receive
Security Administration (SSA), with
$100–$200 per month; working age
revenue from a range of potential options If designed well, the carbon
adults (18–64) would receive
Assured Income [9] including a value added tax (VAT), taxes No Every U.S. citizen dioxide tax could incentivize
$200–$400 per month; older
on unearned income, a carbon dioxide low-carbon investments
individuals (64+) would receive
tax, and small transaction fees on the
$100–$200 per month
trading of securities and derivatives
Every working adult
Chris Hughes’ [92]
A tax on annual incomes of $250,000 in a household with
Guaranteed Income for Yes $500 a month None
or more an annual income of
Working People
less than $50,000
In 2012, the program was providing
Iran’s Cash Transfer Removal of price subsidies on fuel monthly payments of 455,000 rials
No Iranian citizens None
Program [93,94] and food (worth USD $40 in 2012 and around
$11 today)
Annual dividend payments
The Alaska Permanent Fund
The Alaska Permanent Fund (APF) No typically range between Alaska residents None
(APF) [95]
$1000–$2000.
Not specified; The Universal Basic ASF’s assets could exclude
American Solidarity Fund Dividend (UBD) payment would companies if they violate
The American Solidarity Fund (ASF) No U.S. citizens
(ASF) [96] depend on the size of the ASF and human rights or cause
its five-year performance environmental destruction
The CWTs would be legally
accountable to future
generations and would have
Peter Barnes’ [97] Common
Common Wealth Trusts (CWTs) No Not specified Citizens the authority to limit the use of
Wealth Trusts
threatened ecosystems and
charge for the use of
public resources
Unlike income enhancement via a
Ownership-broadening trusts
UBI, no absolute amount of income
could invest in common stock
Robert Ashford’s [98,99] is prescribed; the amounts paid in Citizens, employees,
Inclusive capitalism based on the voluntarily issued by
Inclusive Capitalism (based No dividends to beneficiaries consumers, and/or
principle of “binary growth” companies that are advancing
on binary economics) according to this approach depends welfare recipients
inherently sustainable forms
on the earning capacity of the
of growth
capital acquired
Note: See Table A1 in Appendix A for a more detailed description of each scheme/program included in this table.Sustainability 2019, 11, 4481 11 of 29
The proposals listed in Table 1 provide a range of ways in which a version of more broadly
distributed income via a UBI or a guaranteed job program could be used to address income needs and
inequality, to different extents and in different ways.
The Negative Income Tax (NIT) proposal can be implemented in a variety of ways. It is based
on the principle that people who work receive more income than those who do not, which, in theory,
incentivizes work. While the NIT has a strong employment focus, it is not concerned with the potential
technological displacement of work and has no explicit environmental considerations.
The Cost of Living Refund [88] proposal is a form of NIT and focuses on modernizing the Earned
Income Tax Credit (EITC). The proposal broadens the eligibility requirements to all workers over 18
and includes childless workers, caregivers, and low-income students. The proposal does not have any
explicit environmental considerations.
The Federal Job Guarantee Program focuses on achieving full labor employment by providing a job
to any individual willing to work at a specified wage. While there is a rich debate between the proponents
of this type of “workfare” program [100,101] and the opponents who prefer a UBI [71,102,103], the focus
here is on the scale of each program and its potential impact on inequality and the environment.
When compared with a nation-wide UBI program, the targeted impact of the Jobs for All Act makes
it considerably smaller (perhaps serving up to 10% of a developed economy’s labor force during a
recession). This reduced scale would limit the environmental impact of the program, which does
have an explicit focus on creating jobs with a minimal ecological impact. With regards to inequality,
the program’s focus on creating employment opportunities in the areas of health, housing, education,
and public infrastructure has the potential to reduce local inequalities but is unlikely to address the
larger economy-wide polarization of the workforce and decline of meaningful middle-income jobs.
The program also ignores unpaid reproductive and social roles and values people by their ability to
earn a living through work [104].
UK Labour’s Inclusive Ownership Fund (IOF) is based on the argument that the financialization
of the economy and concentration of corporate/economic ownership has led to the exclusion of workers
(financially and politically) from the economy. The proposed plan is intended to provide both workers
and society with a direct stake and say in the economy by reshaping the understanding of the firm
under a “more pluralistic and inclusive vision” [105]. The Labour Party’s plan has no explicit concern
for its potential impact on the environment from increased aggregate demand/consumption. Whereas
Labour’s IOF proposal places workers first, the Citizen’s Wealth Fund at the center of Lansley and
Reed’s [90] Fuller Basic Income (FBI) program would provide all British citizens with a direct ownership
stake in, and income from, the fund. However, like Labour’s plan, the FBI program has no explicit
components that target environmentally-sound investments or consumer spending. The idea of an
IOF has also gained traction across the Atlantic, where Bernie Sanders is backing the approach as a
way for workers to obtain a greater ownership stake and voice in companies, but the details of his
proposal have yet to be articulated [106].
While Yang’s [11] proposal is based on the need to financially support workers because of
technological (capital) displacement, the UBI financing mechanism is not linked to capital ownership.
Due to its proven record outside of the U.S., a 10% value added tax (VAT) is considered to be an
efficient mechanism to avoid corporate tax aversion. Yang’s [11] proposal has no explicit link between
the growing aggregate demand it would likely generate and the environmental impacts of increased
consumption. While Yang’s proposal built on Stern’s [91] earlier work, Stern’s UBI proposal presents a
broader range of options to fund the basic income, including the idea of developing a common wealth
fund based on Peter Barnes’ [97] UBI proposal (discussed below). If such a fund were to be established,
it would link at least a portion of the UBI to an effort to protect ecosystems in the U.S.
The Assured Income [9] approach also includes a VAT as a potential revenue stream, along with
taxes on unearned income, a carbon dioxide tax, and transaction fees on the trading of securities and
derivatives. The monthly payments would be managed by the Social Security Administration (SSA).Sustainability 2019, 11, 4481 12 of 29
If a well-designed carbon dioxide tax is implemented, it could incentivize low-carbon investments,
directly addressing the fourth environmental concern discussed previously.
Hughes’s [92] UBI proposal is financed using a tax on high-income earners that would be
redistributed among adults earning less than $50,000 a year. The approach is based on the rationale
that work (and its incentivization) is essential, but it does not consider the possible implications of
technology-displaced employment or consider the environmental implications of increasing aggregate
demand. Like the NIT, it is a redistribution approach to addressing income needs and inequality.
The Alaska Permanent Fund (APF), the American Solidarity Fund (ASF), and the Common
Wealth Trust (CWT) proposals provide a useful array of options for financing national funds/trusts.
These range from taxing non-renewable resources (APF), to voluntary contributions (combined with a
range of other financing options) (ASF), to protecting critical ecosystems by levying fees on corporations
for the sustainable use of renewable/non-renewable environmental resources (CWT). When viewed
through an environmental lens, it is important to assess both the way the funds/trusts are (1) financed
and (2) how the principal of the funds/trusts is invested/managed. In general, it is the profits from the
managed investments that will finance a UBI via dividend payments.
With regards to the financing of the funds/trusts, the APF and CWT provide two different options
that aim to address unsustainable economic activities and promote sustainability. The APF levies a
25% tax on mineral leasing rentals that provides a revenue stream for the fund, which is combined
with income generated by the fund’s investments. The fund’s principal may not be spent without
approval from Alaskan residents, but its reserve (the realized earnings from investments) can be spent.
The financing approach aligns with Herman Daly’s proposal for “taxing the bads, rather than the
goods,” and can be used to influence the rate of non-renewable resource extraction. However, there
is no explicit consideration of the finite nature of mineral resources or how these could be managed
for future generations. In contrast, the CWT proposal addresses these shortcomings. Barnes [97]
(p. 2) claims that organized common wealth “can help fix the two greatest flaws in contemporary
capitalism—its relentless destruction of nature and its equally relentless widening of inequality—while
preserving the benefits markets can provide.” By putting critical ecosystems and resources under the
management of CWTs, the managers of the funds would be required to protect their assets for future
generations and to share current income obtained from their sustainable use. Since no CWTs have
been created, specific questions on how these funds would be established and managed have yet to be
answered. In addition, since citizens would be free to spend their income as they choose, the CWT
proposal would not impact environmental/social problems related to the production and delivery of
goods/services from outside of U.S. borders.
It can be argued that similar goals (preserving the life-sustaining capacity of the planet and
addressing the widening wealth gap) can be achieved by taxing the use of public commons (i.e.,
the APF approach). Barnes [97] (p. 6), however, favors the creation of trust-administered property
rights over redistributive taxation on the grounds that property rights tend to endure, whereas fiscal
policies can fluctuate with the whims of politics.
With regards to investing the principal of the funds/trusts, the APF, ASF, and CWT present three
approaches—(1) maximizing the return with no explicit concern for sustainable development (e.g.,
the APF); (2) maximizing the return, but without investing in firms engaged in human rights violations
or environmental destruction (e.g., the ASF); and (3) maximizing the return, but with investments that
focus on the sustainable use of resources for present and future generations (e.g., the CWT). The second
approach is used by Norway to guide its sovereign wealth fund investments. The third approach has
the potential to significantly advance the sustainable management of resources, but it is not clear how
the principal of the CWT would be invested.
The final approach listed in Table 1 is based on Robert Ashford’s approach to inclusive capitalism.
This approach to addressing inequality and advancing sustainability has similarities with several of
the other approaches, but it also has significant differences. (1) Whereas the other strategies are based
on what might be called the range of mainstream economic theories of growth, efficiency, and fullerSustainability 2019, 11, 4481 13 of 29
employment, the inclusive capitalism approach is based on binary economics, which presently is
not widely reflected in mainstream economics. As explained more fully below, binary economics
adds a more nuanced understanding of growth, efficiency, and fuller employment by focusing on
the distribution of capital acquisition with the future earnings of capital. (2) Consequently, only the
inclusive capitalism approach recognizes the principle of binary growth (discussed below). (3) All
of the other approaches require either redistribution from (or dilution of) existing wealth (including
claims acquisition) or the distribution of public wealth (as in the case of the APF); whereas the more
broadly distributed capital income associated with binary growth does not require redistribution.
(4) As a further consequence, these other solutions compete with one another for the resources needed
to supplement existing labor and welfare claims. In contrast, because it is premised on additional
wealth creation incentivized by the broader distribution of capital acquisition, the inclusive capitalism
approach does not require redistribution of existing wealth or distribution of public wealth, and is
therefore an add-on, not a competitive alternative, to the other approaches. Rather than subtracting
from the growth in wealth available for the other approaches, it adds to it.
The principle of binary growth distinguishes binary economics as a distinct paradigm for
understanding market economics. The principle provides a theoretical foundation for structuring
a private-property system that will tend to broaden rather than concentrate capital ownership and
thereby produce enhanced earning capacity for poor and middle class people, greater and more broadly
shared prosperity, and enhanced levels of sustainable growth [107] (p. 26).
To explain the fuller employment and per-capita growth potential of broadening capital acquisition
with the earnings of capital, binary economists focus on the distinction between productivity and
productiveness. Productivity is a ratio of all factors of production divided by one factor, usually labor;
whereas, retroactively productiveness means “work done” and prospectively means “productive
capacity” [98].
Although most people believe that the primary role of capital in contributing to per-capita
economic growth is to increase labor productivity, there is another (binary) way to understand the
primary role of capital: to do an increasing portion of the total work done. According to the widely
shared perception, per-capita growth might be understood by considering the work of moving products
(food, consumer goods, etc.) between points A to B. For illustration purposes, consider the ability of
one person to move one unit of product between points A and B in a day, 100 units with the help of a
horse, and 10,000 units with a truck. From a binary perspective, the horse and truck are doing more
than enabling the person to do more work; they are doing more of the total work (the same can be
said for any capital employed in production). Thus, per-capita growth can be understood as capital
increasing labor productivity (mainstream view), or as capital doing an ever-increasing portion of the
total work done (binary economics view). Through the lens of productiveness, binary economists
believe that in a modern industrialized economy (1) capital, not labor, is doing most of the additional
work and is thereby creating most of the additional wealth and (2) capital ownership (if broadly
acquired) is capable of distributing much more income than can be achieved through wages alone.
Now consider what happens in the above example if an automated truck (with no driver) moves
the product from point A to B. In this case, all of the physical work of moving the product is being done
by capital. In this scenario, many (if not most) economists typically point to (1) the creation of new jobs
(e.g., those in the automated vehicle management center, the jobs for software programmers needed to
continually update/advance the automated-driving software, etc.), and (2) the additional jobs that may
be created as a consequence of the economy-wide increase in productivity. However, this argument
fails to address what is really happening at the task level. With driverless trucks, the physical work of
moving a product from point A to B is being done entirely by capital. While such a transformation will
certainly create some new jobs in the automated transportation and robotics industries, focusing on
these new jobs (that have different task categories) ignores that the specific task of moving a product
from point A to B is no longer linked to income from wages. Instead, the only way income can be
distributed from this task without redistribution is via a capital ownership stake in the automatedSustainability 2019, 11, 4481 14 of 29
truck. Note also that the typical “new-jobs” and “more jobs” response fails to address the income
distribution consequences that flow from the fact that labor’s contribution to total production has
decreased and capital’s contribution has increased. Now consider what happens if this simple example
is extrapolated to specific routine manual and cognitive tasks across the entire economy that have or
could be displaced by capital. Consider also the fact that the number of jobs displaced from specific
tasks (e.g., driving trucks, providing services at truck service stations, etc.) are rarely replaced by an
equivalent number of new jobs (e.g., in the automated truck sector). There is also the critical question
of whether a displaced worker can transition into any of the new jobs that may become available in an
increasingly-polarized workforce.
The binary economics view of economic growth has profound implications regarding how people
can most efficiently participate and share in economic growth. Conventional economists assume that
the gains for most people must come via more jobs and higher wages, lower prices for goods and
services, and welfare redistribution—all functions of labor productivity. Binary economists see far
greater potential for most people via the broader distribution of capital acquisition with the future
earnings of capital. They argue that if the effect of technological innovation is to both replace and
vastly supplement the work of labor with increasingly productive capital, and thereby reduce the
contribution of labor to production while increasing the contribution of capital, then the preservation
and enhancement of individual earning capacity and optimization of growth in a market economy
requires practical market mechanisms that enable all people to acquire a share of this growing capital
productiveness [107] (p. 34). Like well-capitalized people, everyone needs the competitive opportunity
to acquire capital, not merely with the earnings of labor, but also increasingly with the earnings of
capital. According to Robert Ashford, a widespread understanding of the principle of binary growth
will enable market participants, by way of non-redistributive, voluntary transactions, to do exactly that.
If the basic premise of binary economics—that a broader distribution of capital acquisition
provides the rational expectation of more broadly distributed capital income (and consumer demand)
in future years and therefore greater market incentives for the fuller employment of labor and capital
(and economic growth) in earlier years—is valid, it has implications that either do not follow from
conventional economic analysis or may significantly vary from it. Several of these implications are that
this premise provides:
1. an additional approach to fuller employment and per-capita growth;
2. an additional approach to enhancing the earnings of poor and middle-class people in the age of
automation/AI beyond minimum wage legislation, government jobs programs, and guaranteed
minimum income (financed via redistribution mechanisms);
3. a means to reduce the need for welfare distribution;
4. an additional approach to environmental sustainability by (a) making greener technologies and
regulations more affordable and politically achievable and (b) targeting ownership-broadening
financing so as to promote the production of inherently sustainable goods and services;
5. an additional approach to development and foreign assistance;
6. an additional approach to globalization;
7. an additional approach to privatization; and
8. a means to reduce the need for economic immigration.
The present market approach to capital acquisition (which limits capital acquisition primarily
in proportion to the existing distribution of wealth) constitutes a major obstacle to sustainability for
several reasons, including the following: (1) market prices and the regulatory system do not sufficiently
internalize the negative externalities of unsustainable production and consumption nor the positive
effects of sustainable ones, especially in the long run; (2) limiting capital acquisition of increasingly
capital intensive production primarily to people in proportion to the existing distribution of wealth
needlessly deprives most people the competitive opportunity to acquire capital earning capacity
thereby making greener technologies less affordable; and (3) conversely, broadening capital acquisitionYou can also read