Anna Karenina and the subgingival microbiome associated with periodontitis
←
→
Page content transcription
If your browser does not render page correctly, please read the page content below
Altabtbaei et al. Microbiome     (2021) 9:97
https://doi.org/10.1186/s40168-021-01056-3

 RESEARCH                                                                                                                                            Open Access

Anna Karenina and the subgingival
microbiome associated with periodontitis
Khaled Altabtbaei1,2, Pooja Maney3, Sukirth M. Ganesan1,4, Shareef M. Dabdoub1, Haikady N. Nagaraja5 and
Purnima S. Kumar1,6*

  Abstract
  Background: Although localized aggressive periodontitis (LAP), generalized aggressive periodontitis (GAP), and
  chronic periodontitis (CP) are microbially driven diseases, our inability to separate disease-specific associations from
  those common to all three forms of periodontitis has hampered biomarker discovery. Therefore, we aimed to map
  the genomic content of, and the biological pathways encoded by, the microbiomes associated with these clinical
  phenotypes. We also estimated the extent to which these biomes are governed by the Anna Karenina principle
  (AKP), which states that eubiotic communities are similar between individuals while disease-associated communities
  are highly individualized.
  Methods: We collected subgingival plaque from 25 periodontally healthy individuals and diseased sites of 59
  subjects with stage 3 periodontitis and used shotgun metagenomics to characterize the aggregate of bacterial
  genes.
  Results: Beta-dispersion metrics demonstrated that AKP was most evident in CP, followed by GAP and LAP. We
  discovered broad dysbiotic signatures spanning the three phenotypes, with over-representation of pathways that
  facilitate life in an oxygen-poor, protein- and heme-rich, pro-oxidant environment and enhance capacity for
  attachment and biofilm formation. Phenotype-specific indicators were more readily evident in LAP microbiome
  than GAP or CP. Genes that enable acetate-scavenging lifestyle, utilization of alternative nutritional sources,
  oxidative and nitrosative stress responses, and siderophore production were unique to LAP. An attenuation of
  virulence-related functionalities and stress response from LAP to GAP to CP was apparent. We also discovered that
  clinical phenotypes of disease resolved variance in the microbiome with greater clarity than the newly established
  grading system. Importantly, we observed that one third of the metagenome of LAP is unique to this phenotype
  while GAP shares significant functional and taxonomic features with both LAP and CP, suggesting either
  attenuation of an aggressive disease or an early-onset chronic disease.
  (Continued on next page)

* Correspondence: kumar.83@osu.edu
1
 Division of Periodontology, College of Dentistry, The Ohio State University,
3180 Postle Hall, 305 W 12th Avenue, Columbus, OH 43210, USA
6
 Division of Periodontology, College of Dentistry, James Cancer Institute, The
Ohio State University, 4111 Postle Hall, 305 W 12th Avenue, Columbus, OH
43210, USA
Full list of author information is available at the end of the article

                                         © The Author(s). 2021 Open Access This article is licensed under a Creative Commons Attribution 4.0 International License,
                                         which permits use, sharing, adaptation, distribution and reproduction in any medium or format, as long as you give
                                         appropriate credit to the original author(s) and the source, provide a link to the Creative Commons licence, and indicate if
                                         changes were made. The images or other third party material in this article are included in the article's Creative Commons
                                         licence, unless indicated otherwise in a credit line to the material. If material is not included in the article's Creative Commons
                                         licence and your intended use is not permitted by statutory regulation or exceeds the permitted use, you will need to obtain
                                         permission directly from the copyright holder. To view a copy of this licence, visit http://creativecommons.org/licenses/by/4.0/.
                                         The Creative Commons Public Domain Dedication waiver (http://creativecommons.org/publicdomain/zero/1.0/) applies to the
                                         data made available in this article, unless otherwise stated in a credit line to the data.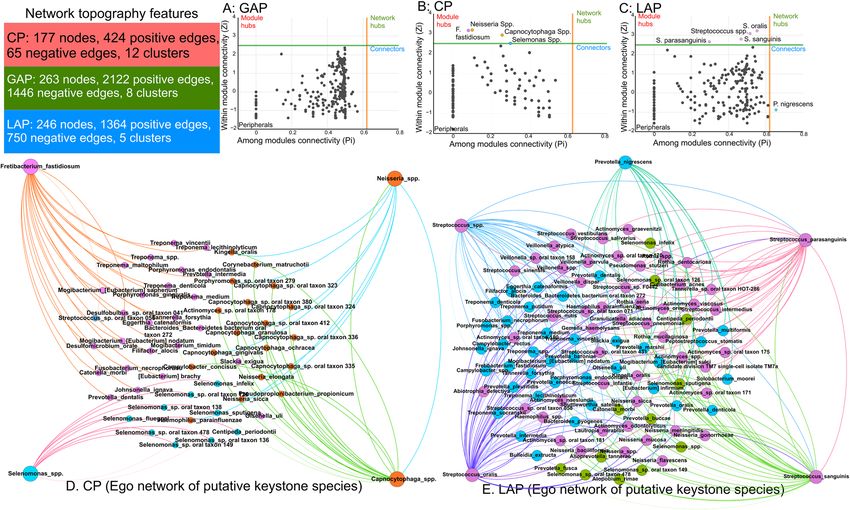
Altabtbaei et al. Microbiome      (2021) 9:97                                                                   Page 2 of 15

 (Continued from previous page)
 Conclusion: Within the limitations of a small sample size and a cross-sectional study design, the distinctive features
 of the microbiomes associated with LAP and CP strongly persuade us that these are discrete disease entities, while
 calling into question whether GAP is a separate disease, or an artifact induced by cross-sectional study designs.
 Further studies on phenotype-specific microbial genes are warranted to explicate their role in disease etiology.
 Keywords: Microbiome, Chronic periodontitis, Generalized aggressive periodontitis, Comparative metagenomics,
 Localized aggressive periodontitis

Introduction                                                  [13–15], their functional roles can only be inferred.
Periodontitis, an infection-mediated disease that destroys    Moreover, most studies are comparisons of only one dis-
tooth-supporting structures, is the sixth most prevalent      ease phenotype to healthy controls [7, 16], limiting our
disease in the world, affecting over 700 million adults       ability to separate phenotype-specific associations from
worldwide [1]. The consequences of untreated disease          those that are common to all clinical presentations of
are tooth loss, poor nutritional status, loss of speech,      periodontitis. It is not surprising that we have not been
and masticatory function. With the annual cost of peri-       able to use microbiomics to develop a robust under-
odontal treatment exceeding 15 billion dollars in the         standing of how the microbiome contributes to a specific
USA alone, this disease poses a significant health burden     disease phenotype.
that is comparable to outpatient treatment of cardiac            High-throughput whole genome sequencing has pro-
and metabolic diseases [2–4]. Additionally, emerging evi-     vided us with an unprecedented view of the genetic
dence implicates periodontitis in the pathogenetic path-      composition and functional behaviors of complex bi-
ways of several potentially life-threatening diseases         omes that can never be fully characterized by cultivation
including coronary heart disease, pre-term births, dia-       alone [17]. For example, metagenomic studies of the gut
betes, and cerebrovascular accidents [5], and therefore,      microbiome have revealed that eubiotic communities are
the consequences of untreated periodontitis extend be-        similar between individuals but respond in a stochastic
yond the oral cavity.                                         or random manner to stresses, resulting in dysbiotic
   Three clinical phenotypes have been most commonly          communities that vary from person to person. This is
described based on the rate of progression and the pat-       called the Anna Karenina principle (AKP) after the
tern of disease within the dentition: chronic periodontitis   opening line from Tolstoy’s book: “All happy families
(CP), localized aggressive periodontitis (LAP), and gener-    look alike; each unhappy family is unhappy in its own
alized aggressive periodontitis (GAP) [6]. Although it is     way” [18]. In the present study, we aimed to investigate
established that all three phenotypes have a microbially      what the microbiome is capable of doing and how this
driven etiology, our current understanding of the micro-      functional capacity relates to periodontal health status,
biota associated with these phenotypes is not sufficient      in order to develop testable hypotheses about the role of
to explain the clinical differences. For example, the pre-    the subgingival microbiome in maintaining health and
vailing paradigm that similar bacteria are found in CP        causing disease. Here, we present the first functional
and GAP [7] does not explain the rapid disease progres-       catalog of the subgingival microbiome in the three most
sion seen in GAP, nor does the presence of specific bac-      common phenotypes of periodontitis. Using a metage-
teria in GAP and LAP [8–10] explain the involvement of        nomic approach to characterize the aggregate of bacter-
specific teeth in LAP.                                        ial genes in the subgingival microenvironment, we also
   Our knowledge of the microbiome associated with            highlight how each differs from periodontal health. As a
chronic and aggressive periodontitis is largely based on      tertiary aim, we examined the 1999 (based on disease
phylogenetic characterizations of subgingival communi-        phenotype) and the 2017 (based on disease extent, sever-
ties or investigations of specific bacteria (notably, Por-    ity, and risk) classifications of periodontitis [6, 19] in the
phyromonas gingivalis, Treponema denticola, and               context of the subgingival microbiome.
Tannerella forsythia, (popularly known as the “red com-
plex” bacteria) and Aggregatibacter actinomycetemcomi-
tans) within these ecosystems [10–12]. However, these         Methods
individual species are part of complex communities and        Study population
their role in disease causation or perpetuation can be        This study was approved by the institutional review
fully understood only when studied in an ecological con-      boards of The Ohio State University and Louisiana State
text. While phylogenetic approaches such as 16S sequen-       University (OSU IRB 2014H0020, LSUHS-NO 8796).
cing place these organisms in an ecological framework         Thirty-four nonsmoking, normoglycemic individuals
                                                              with stage 3 periodontitis as defined by the 2017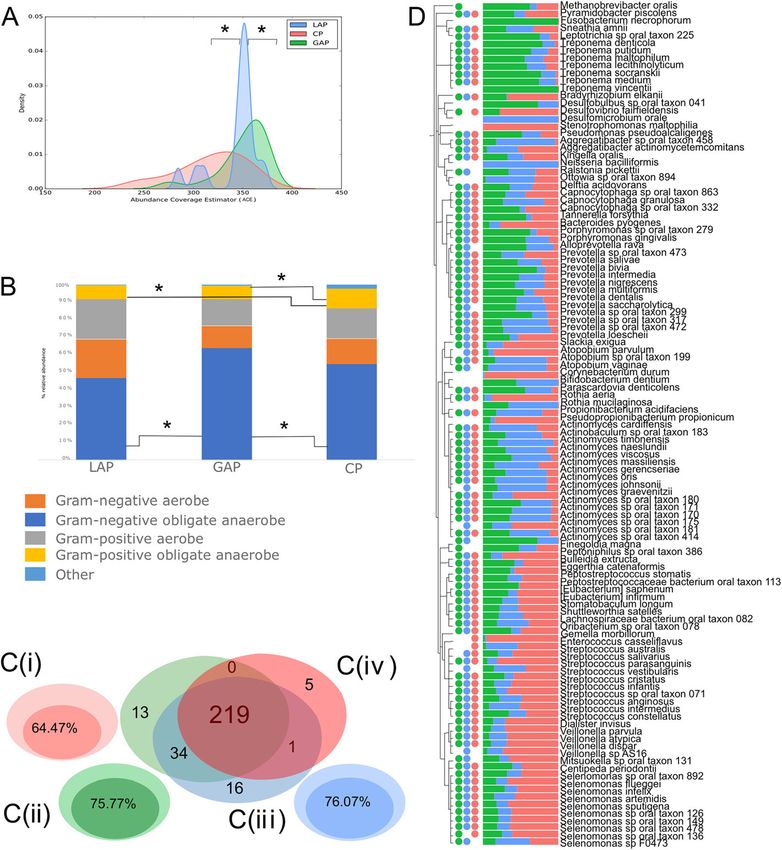
Altabtbaei et al. Microbiome   (2021) 9:97                                                                    Page 3 of 15

classification [19] were recruited and informed consent        visit. This strategy was adopted to minimize the effects
or assent with parental approval was obtained as appro-        of bacterial translocation due to periodontal probing.
priate. Additionally, sequences from 25 stage 3 peri-          Samples collected by inserting sterile endodontic paper
odontitis and 25 periodontally healthy controls from a         points (Caulk-Dentsply, Milford, DE, USA) to the depth
previous study [20] were reanalyzed. Periodontal health        of the periodontal pocket for 30 s. From periodontally
was defined as clinical attachment loss (CAL) ≤ 1 mm,          healthy subjects, samples were similarly collected and
probing pocket depths (PD) ≤ 3 mm, and mean gingival           pooled from 15 non-contiguous interproximal sites.
index < 1. Periodontitis was classified based on both          Paper points were immediately placed in 100 μL of
phenotype [6] and disease stage and grade [19] for com-        RNALater, temporarily stored in ice, and were trans-
parison. Stage 3 grade A (S3gA) was defined as bone loss       ferred to − 20 °C until analysis.
to age ratio (BL/age) < 0.25, mean plaque index (PI) >
1.5, and mean gingival index (GI) > 1.5; stage 3 grade B       DNA isolation and sequencing
(S3gB) as 0.25 < BL/age < 1, PI > 1.5, and GI > 1.5; and       Bacterial DNA was isolated from paper points, using
stage 3 grade C (S3gC) BL/age > 1, PI ≤ 1, and GI ≤ 1.         Qiagen DNA MiniAmp kit (Qiagen, Valencia, CA, USA)
Chronic periodontitis (CP) was defined as interproximal        and quantified using Qubit fluorometer. Fifty nanograms
attachment loss affecting at least 30% of the sites in indi-   of DNA was used to generate libraries with an Illumina
viduals between 40 and 80 years of age. CP was diag-           TruSeq kit according to the manufacturer’s instructions.
nosed based on at least two periodontal assessments            Quantified and pooled libraries were clustered on the
over at least 2 years. Localized aggressive periodontitis      Illumina HiSeq 4000 system (Illumina, Inc., San Diego,
(LAP) was defined as interproximal attachment loss af-         CA, USA) and 150 bp paired-end sequencing performed.
fecting first molars and incisors (and no more than 2          Sequences for all 59 samples are deposited in the Se-
other teeth) in systemically healthy individuals below 40      quence Read Archives under the project ID
years of age. An additional requirement was a contribu-        PRJNA552294 and PRJNA508385.
tory family history (of early tooth loss). Generalized ag-
gressive periodontitis (GAP) was defined as rapid              Statistical analysis
progressing interproximal attachment loss in systemic-         Trimmed and filtered sequences were uploaded to the
ally healthy individuals below 40 years of age that did        MG-RAST metagenomics analysis pipeline (version
not follow the patterns of distribution in the dentition       3.3.6) [21, 22] (Argonne National Laboratory) for quality
described for LAP. Exclusion criteria included age below       processing and basic functional analysis. The MG-RAST
8 years, current pregnancy, requirement for antibiotic         API [23] and the custom Python library we developed to
prophylaxis prior to dental therapy, HIV infection, long-      access it and analyze/visualize results were used
term (greater than 3 months) use of medications known          throughout the analysis process to download relevant
to cause gingival changes (e.g., immunosuppressants,           data and pipeline results (available for download at
phenytoin, calcium channel blockers, aspirin, NSAIDS,          http://github.com/smdabdoub/PyMGRAST).
bisphosphonates, or steroids), antibiotic therapy within 3       The phylogenetic profile of each group was deter-
months of sample collection, and history of previous           mined using Kraken v1.1 [24] with a database con-
subgingival periodontal therapy.                               structed from a list of complete genomes from the
  Sample size was estimated based on the probability of        Human Oral Microbiome Database [HOMD], as of Sep-
least an 80% chance of detecting individual genes that         tember 19, 2017 (GenBank IDs available in Supplement).
differed in abundance by at least 0.01% between any two        Although Kraken provides data at all levels of taxonomy,
groups.                                                        analysis was performed at the genus and species levels,
                                                               showing high levels of specificity, accuracy, and cover-
Clinical procedure                                             age. Only taxa present in at least 20% of subjects in each
Patients were recruited after an initial screening and         group and constituting ≥ 0.000005% of the relative abun-
diagnosis visit when periodontal health related metrics        dance were retained. Annotations with Kraken were
(clinical attachment loss (CAL), probe depths (PD),            done using the Ohio Supercomputer facilities (www.osc.
bleeding on probing (BOP), gingival index (GI), and            edu). Knowledge-based assignments were made for gram
plaque index (PI)) were recorded. Since a common clin-         staining and oxygen tolerance characteristics of the
ical presentation in all three disease phenotypes is that      OTUs (Python script available on https://github.com/
only some sites are affected by disease, 3 non-                akshayparopkari/kadambari). As-yet-uncultivated phylo-
contiguous sites with clinical attachment loss (CAL) > 5       types were annotated based on the characteristics of
mm and probing depth (PD) ≥ 6 mm on 3 different                their cultivated phylogenetic neighbors. The taxonomic
teeth were selected in subjects with periodontitis. Sam-       attribution of each function was resolved by matching
ples were collected 1 week following the initial screening     the unique ID of each annotated sequence using the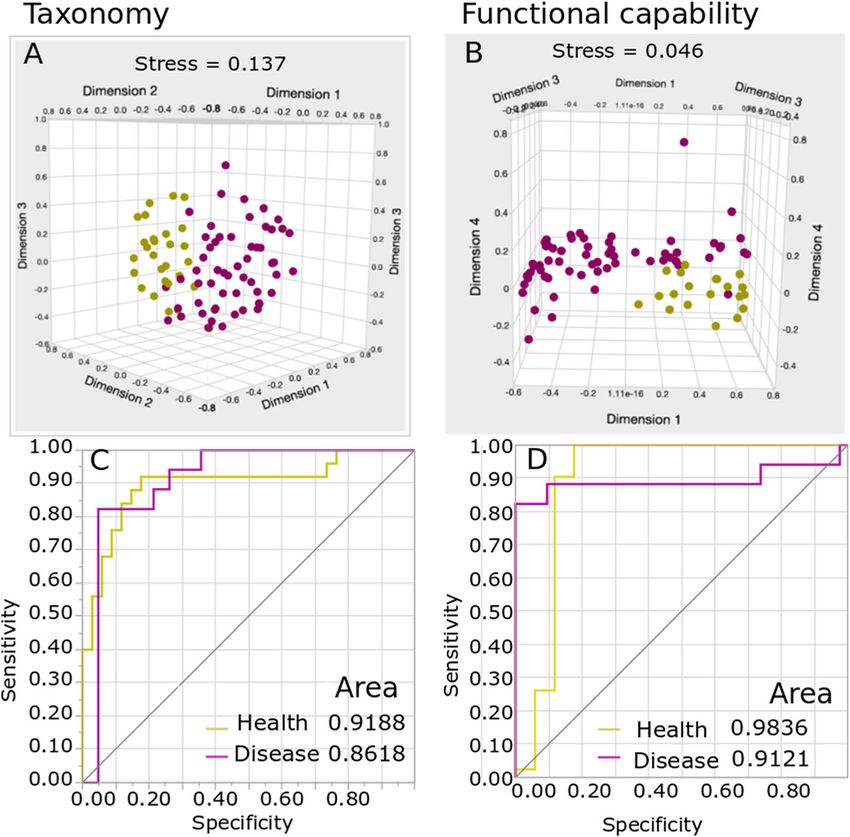
Altabtbaei et al. Microbiome   (2021) 9:97                                                                       Page 4 of 15

SQLite3 database (Version 3.28.0). Briefly, functionally       [33] ontological hierarchies. Presence/absence of the fea-
annotated sequences were matched with the primary              tures was interrogated using Fisher’s exact test and odds
output of Kraken using SQLite3. The full SEED func-            ratios calculated with the R packages Questionr and
tional ontology of these sequences was obtained by             DescTools.
matching their accession IDs to a reference database of          Core features were calculated based on presence of the
the SEED subsystem.                                            feature in at least 80% of patients with the particular
  Species diversity and richness were interrogated using       condition. The SparCC package in python was used to
the Chao 1 diversity index and abundance coverage esti-        construct network dependencies between features [34].
mator (ACE), and group-wise significance interrogated          To decrease the occurrence of spurious associations due
with rank-based nonparametric tests (Wilcoxon rank-            to rare taxa, co-occurrence networks were computed
sum test and Kruskall-Wallis test (using PhyloToAST            only on the core taxa [35]. Correlation was estimated on
diversity.py [25])). Dissimilarity between samples was         log-transformed abundances of the core features, and p-
calculated using Bray-Curtis metrics to estimate beta di-      values computed following 99 bootstraps. Significant co-
versity. Nonmetric multidimensional scaling (NMDS) of          occurrences (rho ≥ 0.6 and p < 0.05) were used to create
Bray-Curtis distances was performed using the R pack-          the graph structures. Gephi v0.9.1 [36] was used to
age Vegan [24], and the R package Plotly used for              visualize the resultant networks. The Zi-Pi plot calcula-
visualization [26]. Significance of clustering was interro-    tions were done using the formula of Guimerà and
gated using adonis function, (QIIME implementation of          Nunes Amaral and graphed using the simplified method
vegan package in R) with 999 permutations. Similarity          of Olesen [37, 38].
percentage analysis (SIMPER) of Bray-Curtis distances            The ability of genes to discriminate between groups
was used to determine the drivers of separation [27].          was examined using a machine-learning algorithm (Ran-
  k-means clustering was used to estimate the variance         domForest package in R). Two thirds of the dataset was
in the disease-associated microbiome. Bray-Curtis dis-         used to train the classifier, which was tested on the
similarity (computed from the relative abundances of           remaining data (1000 trees/10-fold cross validation). For
genes and species in subjects with disease) was used as        all iterations of the test a “confusion table” was created
input and silhouette width used to estimate the number         for each of the exposures based on the number of cor-
of clusters [27]. A silhouette was created for each cluster    rectly classified and misclassified samples, and this data
based on the closeness of the members and separation           was used to compute sensitivity and specificity. The ro-
from others. The silhouettes were then combined onto a         bustness of the classifier was evaluated using ROC
single plot, providing an evaluation of the validity of the    curves (ROCR package in R).
number of clusters. Factors that contributed to variance
in the microbiome were identified using a between-class        Results
analysis method. Briefly, relative abundances of genes         Our primary aim was to characterize the functional and
and species in subjects with disease were input into a         phylogenetic profiles of the subgingival microbiome in indi-
principal coordinate analysis, and the eigenvectors that       viduals with periodontitis. To do this, we obtained 72 mil-
explained 75% of the variance in the microbiome were           lion classifiable sequences from deep periodontal pockets of
inducted into a linear discriminant analysis. Linear dis-      59 systemically healthy subjects with periodontitis, and 31
criminant analysis (LDA) for dimensionality reduction of       million sequences from 25 periodontally healthy individ-
CSS-normalized s-OTU counts was performed using                uals. All subjects with periodontitis were classified as stage
scikit-learn v0.18.0 [28] and plots were visualized using      3 based on disease severity and complexity (Table 1), with
PhyloToAST. MANOVA/Wilks lambda was used to test               17 patients demonstrating the molar-incisor phenotype
for significance of LDA clustering.                            (equivalent to LAP phenotype). Four subjects were classi-
  Between-group differences in abundances and preva-           fied as stage 3 grade A (S3gA), 22 as S3gB, and 33 as S3gC.
lence were estimated for both phylogenetic and func-           Twenty-five subjects were classified as chronic periodontitis
tional data. Statistical testing for differences in relative   (CP; age range, 56–61 years), 17 as generalized aggressive
abundances was performed using the DESeq2 package              periodontitis (GAP; age range, 24–32 years), and 17 as lo-
with Bayesian shrinkage of estimators (R package               calized aggressive periodontitis (LAP; age range, 15–19
apeglm) [29, 30]. p-values were adjusted for multiple          years). Their sequences represented 8336 functionally an-
testing (FDR < 0.1, FDR-adjusted Wald test). Barycentric       notated microbial genes and 454 taxa.
plots based on the functions that passed DESeq2 adjust-
ments were graphed using the ggtern package in R [31].         Subgingival microbiomes follow the Anna Karenina
Comparisons of functional potential between groups             principle
were made in the context of the KEGG (Kyoto                    We began our analysis by creating a catalog of disease-
Encyclopedia of Genes and Genomes) [32] and the SEED           and health-associated genes. In all three disease
Altabtbaei et al. Microbiome (2021) 9:97 Page 5 of 15
Table 1 Clinical and demographic characteristics of the study population
Demographic and clinical criteria CP (N = GAP (N = LAP (N =
25) 17) 17)
Age (range, median) 56–61, 59 24–32, 26 15–19, 17
Gender (% male) 72 52 54
Ethnicity (number of Caucasian to African American to Hispanic to Asian) 17:5:2:1 8:5:3:2 0:17:0:0
% bone loss/age at most affected site (range) 0.73–3.1 0.86–3.57 0.9–2.8
Probe depth at deepest site (range, median) 6–9, 6 5–8, 6 7–10, 7
Number of teeth with furcation involvement (range, median) 0–6, 2 1–3, 2 1–2, 2
Clinical attachment loss at deepest site (range, median) 7–10, 7 6–9, 7 7–10, 8
Bleeding on probing (% sites) (range, median) 20–100, 80 20–80, 65 10–40,
Molar-Incisor pattern (number of subjects) 0 0 17
Mean plaque index (Loe and Silness) (range) 1.2–2.3 1.1–2.1 0.5–0.7
Mean gingival index (Loe and Silness) (range) 1.3–2.5 0.9–2.2 0.6–0.9
Number of individuals with tooth loss 6 3 3
Number of individuals with known history of tooth loss due to periodontitis 5 2 3
Number of teeth lost/individual (excluding third molars, orthodontic reasons and congenitally missing) 0–5 0–3 0–1
(range)
Number of teeth known to be lost to periodontitis/individual (range) 0–2 0–3 1
phenotypes, 73.8% of 454 taxa and 60% of 8336 genes Disease phenotype explains microbiome variance better
were identified in 2 or more individuals within each than disease grade
group. Disease-associated microbiomes demonstrated Having established that periodontitis differed signifi-
greater beta-dispersion [39], with only 47% of disease- cantly from health both taxonomically and functionally,
associated metagenome being shared by 80% or more we next investigated if differences could be discerned
of individuals with periodontitis (common core meta- within the periodontitis-associated microbiome using
genome). On the other hand, over 73% of genes were unsupervised cluster analysis (k-means clustering). Bray-
identified in the common core of periodontal health, Curtis dissimilarity distances (computed from the rela-
indicating that periodontitis-associated microbiomes tive abundances of genes and species in subjects with
follow the Anna Karenina principle (AKP). However, disease) were used as input and silhouette width used to
AKP was most evident in chronic periodontitis (34% estimate number of clusters. We identified three distinct
of transcripts contributing to common core metagen- clusters taxonomically and functionally (p = 0.0008 and
ome), followed by generalized aggressive periodontitis 0.001 respectively, ADONIS test of Bray-Curtis Dissimi-
(51%) and localized aggressive periodontitis (62%). larity Index, Fig. 2a, b). We then investigated the factors
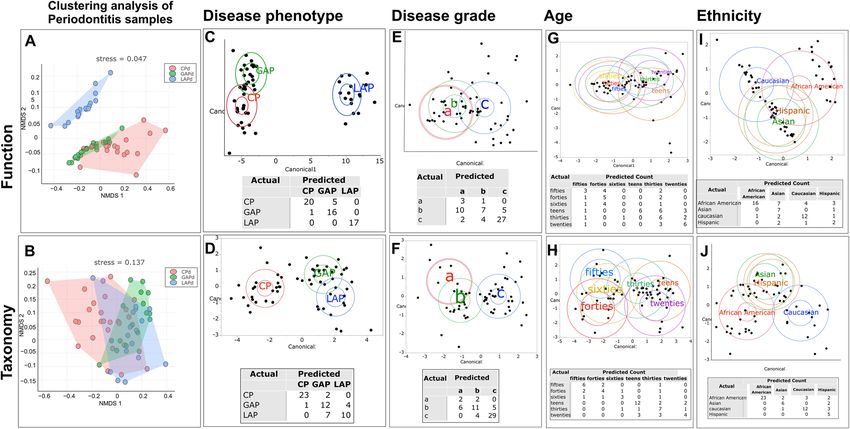
We then queried whether AKP would preclude ro- that drove these differences using a between-class ana-
bust differentiation between health and disease. To lysis method that combines principal coordinates ana-
do this, we computed a “consensus disease profile” lysis with linear discriminant analysis (Fig. 2c–j).
based on genes and taxa found in all 59 patients and Relative abundances of genes and species in subjects
compared this to health using nonmetric multidi- with disease were used as input. Disease phenotype, eth-
mensional scaling of Bray-Curtis pairwise dissimilar- nicity, and age emerged as the strongest drivers of clus-
ities. The difference between health and disease was tering. Disease phenotype yielded the lowest degree of
significantly greater than differences between any misclassification both taxonomically and functionally
two individuals with disease (Fig. 1a, b, p < 0.001, while significant misclassification was evident when
PERMANOVA). A Random Forest Classifier (Ran- using disease grade as a discriminant. Furthermore, dis-
domForest package in R) classifier was able to pre- ease phenotype explained the strong ethnicity and age-
dict disease with 87% sensitivity and 91% specificity based clustering, since most of the younger individuals
based on functional profiles and with 72% sensitivity and those of African American ethnicity belonged to the
and 78% specificity when using phylogenetic metrics LAP group (Fig. 2i).
(Fig. 1c, d). Overall, 28% of genes were uniquely ob-
served in disease, and 12% were unique to health, Same players, different teams
while 26% exhibited significant differential abun- Since targeted microbial investigations have previously
dances in health and disease. suggested that localized aggressive periodontitis has aAltabtbaei et al. Microbiome (2021) 9:97 Page 6 of 15 Fig. 1 Between-class analysis of phylogenetic and functional profiles in health and disease. Nonmetric multidimensional scaling (NMDS) and receiver operating characteristic (ROC) curves shown. The first three dimensions of species-level (a) and gene-level (b) Bray-Curtis distances are shown (p-value < 0.001 for a and b). Each purple circle represents one of 59 subjects with periodontitis and each yellow circle represents one of 25 periodontally healthy individuals. The ability of disease-specific and health-specific indicators to predict each state is shown in c (phylogenetic metrics) and d (functional metrics) distinct microbial profile while the microbiota of chronic groups also demonstrated significant differences in beta and generalized aggressive periodontitis are similar [40], diversity. While all 3 diseases were dominated by gram- we tested the hypothesis that GAP and CP are micro- negative anaerobic bacteria, (representing 56.8%, 62.5%, bially similar while LAP is a taxonomically distinct en- and 47.9% of the abundance in CP, GAP, and LAP, re- tity. NMDS revealed significant class separation between spectively (Fig. 3b)), the abundances of these groups the 3 diseases (p < 0.001, PERMANOVA of Bray-Curtis were significantly greater in GAP when compared to Dissimilarity Index, Fig. 2b). We then investigated LAP (p = 0.03, Wilcoxon nonparametric test). By con- whether GAP and CP are microbially more similar than trast, gram-positive anaerobic bacteria were significantly GAP and LAP by computing pairwise dissimilarities higher in CP when compared to either GAP or LAP (p < (Bray-Curtis) between each GAP and CP subject, as well 0.04, Wilcoxon). as each GAP and LAP subject. Taxonomically, GAP was Interestingly, 349 out of 416 species were identified in more similar to LAP than to CP (p < 0.001, Dunn’s test all the three diseases, and only 28 species were unique for multiple comparisons). to any one of the three diseases. Collectively, the unique Since the NMDS indicated that these three diseases species constituted less than 0.03% of the abundance in were microbially discrete entities, we examined the taxo- each group. Each disease condition had core taxa that nomic features that contributed to class separation. LAP constitute more than 50% of the identified taxa in the exhibited significantly lower species richness (as mea- condition (Fig. 3c (i–iii)). When core taxa of each condi- sured by the ACE and Chao 1 indices) than the other tion were compared, most species were present in the groups (p < 0.05, Dunn’s test, Fig. 3a), and the three cores of all 3 conditions (Fig. 3c (iv)). 138 OTUs were
Altabtbaei et al. Microbiome      (2021) 9:97                                                                                           Page 7 of 15

 Fig. 2 Factors that explain variance in the subgingival microbiome. k-means clustering of Bray-Curtis distances revealed three clusters (LAP blue,
 CP red, GAP green) based on function (a, p-value < 0.001) and taxa (b, p-value < 0.001). The ellipses represent the centroids of each cluster.
 Linear discriminant analysis of relative abundances of function (top panels) and phylogeny (bottom panels) revealed that disease phenotype (c,
 d), but not disease grade (e, f), was able to discriminate between subjects with disease. The differences based on age-decade (g, h) and ethnicity
 (i, j) were explained by the disease phenotype. In each cluster, the larger ellipse indicates the 95% confidence region to contain the true mean
 for the group, and the smaller (inner) ellipse represents the region estimated to contain 50% of the population for the group. The
 misclassification rates of each variable are shown within each panel

found to be significantly differentially abundant between                   underlying rationale for this analysis is that taxa with the
any two disease states (p < 0.05, FDR-adjusted Wald test                    strongest connections demonstrate superior adaptation
— Fig. 3d and Supplementary Table 1). Using similarity                      to their niche. As a corollary, diseases that present simi-
percentages (SIMPER) analysis, we identified OTUs that                      lar microenvironments will demonstrate greater co-
explained 70% or more of the class separation. Several                      dependency between member species than diseases that
OTUs which significantly contributed to the separation                      are different. The network topography is summarized in
were also common core taxa, demonstrating that the                          Supplemental Table 2. While GAP and LAP demon-
diseases differ in the ratios of their predominant shared                   strated robust hubs with 3568 and 2114 edges, CP pre-
taxa. One hundred and seven OTUs were significant                           sented a sparse topography, with only 489 connections,
contributors to the separation between GAP and LAP;                         attesting to its phylogenetically idiosyncratic presenta-
of these, 65 were part of the common core species of                        tion (Fig. 4). Zi-Pi plots of both CP and LAP demon-
GAP and 63 formed the common core of LAP (Fig. 3d,                          strated expansive nodes with several putative keystone
supplementary Table 1). Similarly, 50 species, 39 of                        species in the network topography, while the node distri-
which were members of the core microbiomes of GAP                           bution in GAP was equitable (preventing us from creat-
and CP, contributed to the separation between GAP and                       ing a Zi-Pi plot) and did not demonstrate any candidate
CP. The separation between CP and GAP was driven by                         keystone species. Together, the data suggest that patients
Aggregatibacter actinomycetemcomitans, Fusobacterium                        with GAP and LAP have a more homogeneous subgingi-
nucleatum, Treponema socranskii, and several members                        val microenvironment than those with CP, which may
of the genera Actinomyces, Campylobacter, Prevotella,                       explain the taxonomic heterogeneity observed in CP.
and Capnocytophaga. The separation between LAP and                          Based on the clinical observation that 35% of untreated
GAP was mainly driven through Porphyromonas gingiva-                        cases of LAP progress to GAP [41], we hypothesize that
lis and members of the genera Neisseria and                                 loss of the influential key players found in LAP creates a
Actinomyces.                                                                state of flux that, when observed cross-sectionally, gives
   Since inter-bacterial interactions play a large role in                  rise to the observation that GAP is a distinct disease
influencing microbial assemblages, we used graph theo-                      phenotype. This theory is further supported by observa-
retics to assess connectivity between species. The                          tions that individuals with GAP demonstrate low serum
Altabtbaei et al. Microbiome       (2021) 9:97                                                                                            Page 8 of 15

 Fig. 3 Disease-specific taxonomical indicators. Density curves of alpha diversity (ACE) are shown in a. The peak indicates the median values for
 each group, and the x-axis shows the data range. LAP exhibited significantly lower alpha diversity than the other 2 groups (p < 0.0001, Dunn’s
 test). Distribution of species-level taxa by gram staining characteristics and oxygen requirements in is shown in b. GAP patients demonstrated
 significantly greater gram-negative anaerobic bacteria and lower gram-negative aerobic bacteria when compared to the other two groups (p <
 0.01, Dunn’s test for multiple comparisons). Percent of the microbiome that is shared by 80% or more of individuals (common core microbiome)
 with CP, GAP, and LAP are graphically indicated by the Euler graphs c (i–iii), as well as the number of core species shared by all three diseases is
 shown in c (iv). Phylogenetic tree of species that were significantly different between groups (p < 0.05, FDR-adjusted Wald test) are shown in 3D.
 Bars represent normalized mean relative abundances, while the solid circles indicate species that belong to the common disease core. Data
 supporting this figure can be found in Supplemental Table 1

antibody response to the microbial constituents, leading                     evident based on functional capabilities than on taxo-
to its continuous periodontal destruction [40]. This is                      nomic profiles (p < 0.0001, PERMANOVA of Bray-
unlike the other two phenotypes which can self-arrest                        Curtis Dissimilarity, Fig. 5a). 20.61% of the LAP meta-
with time.                                                                   genome (1278/6200 genes) was unique, in that, these
                                                                             genes were not present in either GAP or CP (Fig. 5b and
The LAP microbiome is functionally distinguishable from                      Supplemental Table 3). Twenty percent of these unique
CP and GAP                                                                   genes did not have functional role assignments, pointing
Since the three disease phenotypes demonstrated several                      to gaps in our knowledge of the microbiome of localized
taxa in common, we tested the hypothesis that there                          aggressive periodontitis. Forty percent of unique genes
would be significant functional overlap in their respect-                    encoded enzymes for anaerobic degradation of aromatic
ive associated microbiomes using the SEED ontology to                        compounds, methanogenesis, lysine and acetyl CoA fer-
annotate genes and the KEGG database for pathway                             mentation, and anaerobic respiratory reductases. Twenty
identification. A greater degree of class separation was                     percent of the unique genes coded for gram-negative cell
Altabtbaei et al. Microbiome (2021) 9:97 Page 9 of 15 Fig. 4 Same players, different teams. Zi-Pi plots of co-occurrence networks in generalized aggressive periodontitis (a), chronic periodontitis (b), and localized aggressive periodontitis (c). The text box illustrates the general topographical characteristics of each network. The plots show nodes with low connectivity (peripherals), and the putative keystone species, which are separated into local/module key players (module hubs), key players across different modules (connectors), and the combination of the two categories (network hubs). Network graphs of chronic periodontitis and localized aggressive periodontitis (d, e) show the ego network of species that have first-degree edges with the putative keystone species. A similar network graph was not possible for generalized aggressive periodontitis since there no keystone pathogens were identified in the Zi-Pi plot. Nodes are colored based on their modules. Thick edges represent positive correlations, and faint lines represent negative correlations. Data supporting this figure can be found in Supplemental Table 2 structures and 5% for gram-negative phages. 27.96% and biofilm formation (Autoinducer-2 transport and (2037/7286) of the LAP metagenome differed signifi- processing, biofilm adhesins, and histidine kinase cantly from that of GAP (p < 0.05, FDR-adjusted Wald sensors). test, DESeq2). The LAP microbiome demonstrated greater capacity for inositol catabolism, and Lipid A, The GAP microbiome — a functional chimera lipopolysaccharide, and peptidoglycan biosynthesis when Pairwise dissimilarity analysis revealed that the GAP compared to GAP (p < 0.05, FDR-adjusted Wald test, metagenome was intermediate between CP and LAP (p DESeq2). Additionally, the LAP biome demonstrated a = 0.91, Dunn’s multiple comparisons test on Bray-Curtis 4-fold to 144-fold greater enrichment of genes encoding distances between GAP-CP and GAP-LAP). GAP shared c-type cytochrome and molybdenum cofactor biosyn- 77% of its metagenome with CP and 64% of its metagen- thesis, iron-sulfur clusters, formate dehydrogenase, and ome with LAP. To reduce bias induced by sparse data, oxidative stress response. 27.5% (2019/7340) of the LAP we next used core genes in each group to compute these metagenome differed from CP. This was attributable to distances. Not surprisingly, we observed a lower similar- a higher representation of genes encoding acetyl CoA, ity within the common core metagenomes, but a more lactate, mixed-acid and lysine fermentation, methano- balanced difference, with 56% of genes shared by CP and genesis, anaerobic respiratory reductases, dehydroge- GAP, and 55.1% by GAP and LAP. Since severe attach- nases, dehydratases and anaerobic toluene, and ment loss in young adults in the presence of clinical in- ethylbenzene degradation. Also overrepresented in the flammation and local factors could represent either LAP metagenome were membrane transport functions early-onset chronic periodontitis, a generalized form of (type II, III, IV, V, and VI secretions systems and ABC the molar-incisor phenotype, or true de novo aggressive transporters), and functions related to quorum sensing periodontitis [41], we examined clustering of the GAP
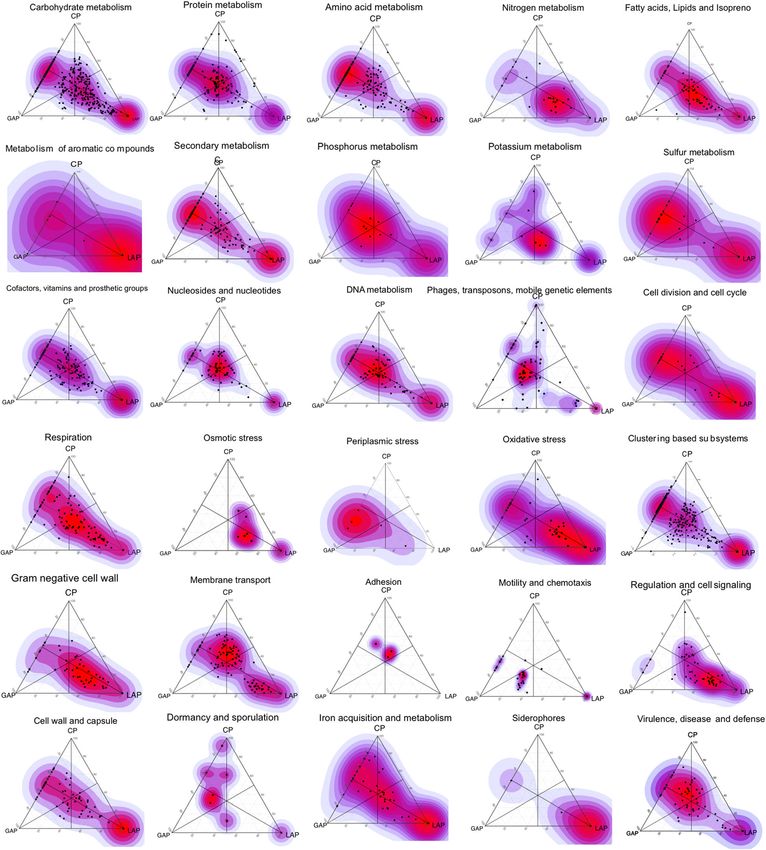
Altabtbaei et al. Microbiome      (2021) 9:97                                                                                         Page 10 of 15

 Fig. 5 Disease-specific functional indicators. Barycentric plots of significantly different virulence functions in the three groups (p < 0.05, FDR
 adjusted Wald test) are shown. Each dot represents a gene. The three groups generalized aggressive periodontitis, chronic periodontitis, and
 localized aggressive periodontitis (GAP, CP, and GAP) are used as vertices. Within each plot, the coordinates of each gene are determined by the
 weighted average of the coordinates of all genes, and the weights are given by the relative abundance of the gene in that group (LAP, GAP, and
 CP). Data supporting this figure can be found in Supplemental Table 3
Altabtbaei et al. Microbiome   (2021) 9:97                                                                   Page 11 of 15

samples alone. NMDS did not reveal significant separ-        map the genomic content of and the biological pathways
ation between the 17 samples, suggesting that this           encoded by the microbiomes associated with chronic, lo-
chimeric effect cannot be readily attributed to              calized, and generalized aggressive periodontitis, a sur-
heterogenous diseases.                                       prising picture of the three phenotypes emerged.
   Fourteen percent of the core genes shared by LAP and         Healthy microbiomes demonstrated significantly lower
GAP encoded as yet unknown functions (Supplemental           beta-dispersion than disease, similar to what has been
Table 4). Among the characterized genes, the predomin-       reported in the gut microbiome [51]. This effect has
ant shared functionalities were related to an anaerobic      been called the Anna Karenina principle and suggests
lifestyle. These included genes encoding heme- and           that healthy microbiomes operate under stricter host
hemin-dependent respiration, dehydrogenases, electron        control than do diseased ones. Subjects with periodon-
donors and acceptors other than oxygen (namely, ni-          titis were carefully selected for clinical homogeneity: all
trate, sulfate, hydrogen, and ferric iron), and fermenta-    sampled sites demonstrated similar attachment loss,
tion. Other shared functions included polyamine              pocket depths, and periodontal inflammation. Therefore,
metabolism, flagellar biosynthesis, and gram-negative        the variance in the microbiome could not be explained
cell wall components (including peptidoglycan biosyn-        by disease severity. This dispersion was more apparent
thesis), response to oxidative and osmotic stress, resist-   in taxonomy than in the functional profiles, corroborat-
ance to antibiotics and toxic compounds, phages, and         ing our earlier finding that the microbiome associated
conjugative transposons. The differences in the micro-       with periodontitis is taxonomically heterogenous but
biomes of LAP and GAP were attributable to lower             functionally congruent [20]. This was also corroborated
abundances of membrane transport functions (type II,         by identifying a set of putative periodontal pathogens
III, IV, V VI, and ABC transporters), quorum sensing         and perturbed functions common to all three diseases,
and biofilm formation in and higher levels of sporulation    suggesting that certain genes and taxa are broadly asso-
and dormancy, phages and transposable elements in            ciated with the disease process. This is not surprising,
GAP. Pathways involved in biofilm stability were also        since it has long been recognized that periodontitis is a
lower in GAP in comparison to LAP, and even lower in         microbially heterogenous disease [52], this observation
CP when compared to GAP.                                     was largely based on examination of selected species or
   The functional roles of 19% of the genes shared by CP     meta-taxonomic cross-sectional studies. However, by
and GAP were unknown. Both CP and GAP demon-                 overlaying robust clinical metrics on the genomic con-
strated a collective capacity for metabolism of amino        tent of the subgingival microbiome, we were able to
acid, organic compounds, alcohols, and glycogen. The         identify that not all clinical phenotypes of periodontitis
other shared functionalities included capsule and cell       are equally heterogenous and that the heterogeneity does
wall synthesis, response to oxidative and osmotic stress,    not extend to microbial functions. We realize, as we say
and resistance to antibiotics and toxic compounds,           this, that this is a cross-sectional study, and therefore, it
phages, and conjugative transposons. Flagellar compo-        is not designed to identify patterns in microbial commu-
nents and proteins associated with flagella biosynthesis     nity dynamics. Our findings serve to further reinforce
and assembly machinery are also exclusively enriched in      the critical need for adequately powered longitudinal
GAP as compared to CP, as were potent inflammatory           studies that combine granular clinical metadata with
triggers such as lipopolysaccharides and peptidoglycans.     open-ended explorations of gene expression patterns
Other abundant functions of GAP include dormancy             and protein-protein networks, and rigorous and im-
and sporulation, invasion and intracellular resistance,      proved modeling of stochastic events in microbiome
iron acquisition and siderophores, and multidrug antibi-     assembly.
otics efflux pumps.                                             Another observation was that most functions which
                                                             discriminated between health and disease were signifi-
Discussion                                                   cantly more abundant in disease, suggesting that the dis-
Culture-based approaches to characterizing the subgin-       ease environment is associated with expanded
gival microbiome spawned a slew of studies on individ-       functionality. Our study reveals that particular functional
ual bacteria, their responses to environmental shifts, and   capability is required for life in the anaerobic, pro-
their roles in disease causation as independent operators    oxidant, heme-rich environment of a pathologically
[42–46]. However, cultivation independent methods            deepened subgingival sulcus. For example, lipopolysac-
have revealed that polymicrobial diseases are caused by      charide biosynthesis, iron transport, stress response, fer-
the collective actions and interactions of the microbiome    mentation, and metabolism of secondary amino acids
[47, 48], and that the “invisible” members of a microbial    were uniformly enriched in all three diseases when com-
community have important contributions to these inter-       pared to health, even though some of them were more
actions [49, 50]. When we used a top-down approach to        abundant in one of the three disease phenotypes.
Altabtbaei et al. Microbiome (2021) 9:97 Page 12 of 15 We also found that species demonstrating a fitness for untreated cases of LAP progress to GAP [41]. Further- this environment are different in each individual, more, the absence of the putative keystone species in highlighting challenges associated with developing GAP could indicate an ecosystem in a state of flux, species-based biomarkers or vaccines for periodontitis. which can explain the poor immune response from the For example, flagellar proteins, potent inflammatory trig- patients, and the lack of the ability of the disease to self- gers, mapped to a variety of organisms (e.g., species be- arrest [59]. While the absence of clustering within the longing to the genera Treponema, Selenomonas, GAP samples argues against this, it is possible that our Pseudomonas, and Campylobacter), while genes encod- small sample size precluded a statistically significant ing dormancy and sporulation, invasion and intracellular clustering. Our observations lead us to question whether resistance, iron acquisition and siderophores, multidrug GAP is indeed a unique disease or represents, for some antibiotics efflux pumps were assigned to several species individuals at least, a “halfway house” between LAP and within the genera Aggregatibacter, Porphyromonas, Ato- CP. pobium, and Prevotella, among others. We noticed progressively greater beta-dispersion and Integrating data from the three most common pheno- the concomitantly smaller common core microbiomes types of periodontitis allowed for identification of when moving from LAP to GAP to CP, pointing to phenotype-specific indicators, elucidating their potential greater personalization of the disease-associated micro- role in disease causation. Disease-specific indicators were biome in older individuals with CP (CP average age in more readily evident in the LAP microbiome than GAP this cohort 58 ± 2 years old). Two possible explanations or CP. When we examined the unique and overrepre- present themselves: one is that the microbiome naturally sented suite of genes in LAP, a picture emerged of a shifts with increasing age; and the age of the microbiome community with greater fitness for an anaerobic, proteo- when dysbiosis sets in could determine the disease- lytic lifestyle, and a higher capacity for virulence than associated profile. The other is that personalization oc- CP or GAP. For example, genes that encode the “acetate curs due to the chronicity of the disease, following the switch”, permitting a transition from rapid growth to a Anna Karenina principle (AKP). slower, acetate-scavenging lifestyle [53], as well as dehy- We also noted an attenuation of virulence-related drogenases, hydratases, and anaerobic reductases were functionalities and stress response from LAP to GAP to identified only in LAP. Anaerobic glycerol phosphate-3- CP as evidenced by 4- to 144-fold lower levels of gram- hydrogenase genes, which play a critical role in utilizing negative cell wall components (including LPS and Lipid alternate nutritional sources [54] were consistently A) and fermentation, and of genes in the glutathione higher in LAP when compared to the other two. Genes pathway in GAP when compared to LAP and in CP encoding c-type cytochrome and molybdenum cofactor when compared to GAP. This serves to explain how the biosynthesis, iron-sulfur clusters, and formate dehydro- microbiome mediates the differential periodontal de- genase were also overrepresented in this cohort. Molyb- struction observed in LAP, GAP, and CP. Virulence denum cofactor is essential in bacterial respiration and genes play an important role in the creation of a dysbio- energy conversion, especially in those species that do tic ecosystem, since they allow the species expressing not have appreciable plasticity in their metabolic and re- them to overcome the colonization resistance offered by spiratory pathways [55]. Molybdenum metabolism is also the health-compatible indigenous species. However, tightly connected to iron-sulfur cluster synthesis [56]. virulence comes at an extreme fitness cost, and there- Formate is not only an important byproduct of anaer- fore, bacteria benefit by staying avirulent unless environ- obic respiration, it is also a substrate for many sulfate re- mental cues or competition dictate it. Our data suggests ducing bacteria, for example, Campylobacter and that attenuation of virulence potential might be a factor Prevotella [57]. Its synthesis is mediated by formate de- contributing to chronicity of the disease. This might ex- hydrogenase, an enzyme that contains molybdenum co- plain the random burst model of disease progression factor and iron-sulfur clusters. C-type cytochromes [60], where an increase in community virulence precedes regulate several key pathogenic processes, notably heme bursts of inflammation and loss of tooth-supporting synthesis, oxidative stress response, nitrosative stress re- structures. sponse, and siderophore production [58]. This small set of genes that were unique to LAP may provide insights Conclusions into disease etiology and development of LAP-specific In summary, a comprehensive metagenomic analysis of microbial biomarkers and deserve further investigation. the subgingival microbiomes in different disease pheno- On the other hand, the microbiome of GAP shared types reveals broad patterns of shift in microbial func- important taxonomic and functional features with both tions that span all diseases. Many of these functions LAP and CP. This “chimera”-like appearance might, in facilitate life in an oxygen-poor, protein- and heme-rich, part, explain the clinical observation that 35% of pro-oxidant environment, as well as providing an
Altabtbaei et al. Microbiome           (2021) 9:97                                                                                                    Page 13 of 15

enhanced capacity for attachment and biofilm formation.                            Declarations
However, beta-dispersion metrics demonstrate that no
                                                                                   Ethics approval and consent to participate
two individuals with disease are alike, especially older in-                       This study was approved by the institutional review boards of The Ohio
dividuals with chronic disease phenotype. Therapies fo-                            State University and Louisiana State University (OSU IRB 2014H0020, LSUHS-
cused on microbial modulation through mechanical,                                  NO 8796). Thirty-four nonsmoking, normoglycemic individuals with stage 3
                                                                                   periodontitis were recruited and informed consent or assent with parental
chemical, or other means will have to take into account                            approval was obtained as appropriate.
patient-specific parameters for efficacy. Importantly, we
observe that generalized aggressive periodontitis shares                           Competing interests
significant functional features with both localized aggres-                        The authors declare that they have no competing interests.
sive periodontitis and chronic periodontitis, suggesting
                                                                                   Author details
either attenuation of an aggressive disease or an early-                           1
                                                                                    Division of Periodontology, College of Dentistry, The Ohio State University,
onset chronic disease. We therefore question whether                               3180 Postle Hall, 305 W 12th Avenue, Columbus, OH 43210, USA. 2Present
this is a separate disease entity, or an artifact induced by                       address: Faculty of Medicine & Dentistry, University of Alberta, 5-508
                                                                                   Edmonton Clinic Health Academy, Edmonton, Canada. 3Department of
cross-sectional study designs. The present investigation                           Periodontics, Louisiana State University School of Dentistry, 1100 Florida Ave.,
also uncovers disease-specific indicators with varying                             Rm. 3111, New Orleans, LA 70119, USA. 4Present address: Department of
discriminant abilities for each phenotype. These can not                           Periodontics, The University of Iowa School of Dentistry, 311 Dental Science
                                                                                   Building N, Iowa City, IA 52242-1010, USA. 5College of Public Health, The
only serve as potential biomarkers for molecular identifi-                         Ohio State University, 400-C Cunz Hall, 1841 Neil Ave., Columbus, OH 43210,
cation of clinical phenotypes, but also clarify the role of                        USA. 6Division of Periodontology, College of Dentistry, James Cancer
the microbiome in disease pathogenesis.                                            Institute, The Ohio State University, 4111 Postle Hall, 305 W 12th Avenue,
                                                                                   Columbus, OH 43210, USA.

                                                                                   Received: 15 December 2020 Accepted: 22 March 2021
Supplementary Information
The online version contains supplementary material available at https://doi.
org/10.1186/s40168-021-01056-3.
                                                                                   References
                                                                                   1. Kassebaum NJ, Bernabe E, Dahiya M, Bhandari B, Murray CJ, Marcenes W.
 Additional file 1: Supplemental Table 1. Genus and species-level taxa
                                                                                       Global burden of severe periodontitis in 1990-2010: a systematic review and
 that differed between chronic, localized and generalized aggressive peri-
                                                                                       meta-regression. J Dent Res. 2014;93(11):1045–53. https://doi.org/10.1177/
 odontitis are shown. Differences in detection frequency (Fisher's exact
                                                                                       0022034514552491.
 test), differential abundance (DESeq2 along with log (2) fold differences,
                                                                                   2. Mohd-Dom T, Ayob R, Mohd-Nur A, Abdul-Manaf MR, Ishak N, Abdul-
 p-value, and FDR adjusted p-value (Wald’s Test), drivers of the class separ-
                                                                                       Muttalib K, et al. Cost analysis of periodontitis management in public sector
 ation (SIMPER), species that were identified in ≥ 80% of individuals (com-
                                                                                       specialist dental clinics. BMC Oral Health. 2014;14(1):56. https://doi.org/10.11
 mon core microbiome) are shown.
                                                                                       86/1472-6831-14-56.
 Additional file 2: Supplemental Table 2. Same players, different                  3. Fardal O, O'Neill C, Gjermo P, Fardal E, Sandvik L, Hansen BF, et al. The
 teams. Network statistics of co-occurrence plots are shown.                           lifetime direct cost of periodontal treatment: a case study from a
 Additional file 3: Supplemental Table 3. Periodontitis and the Anna                   Norwegian specialist practice. J Periodontol. 2012;83(12):1455–62. https://
 Karenina principle. Genes that differed between chronic, localized and                doi.org/10.1902/jop.2012.110689.
 generalized aggressive periodontitis are shown, along with log (2) fold           4. Gjermo PE, Grytten J. Cost-effectiveness of various treatment modalities for
 differences, p-value, and FDR adjusted p-value (Wald’s Test).                         adult chronic periodontitis. Periodontol. 2009;51:269–75. https://doi.org/1
                                                                                       0.1111/j.1600-0757.2009.00313.x.
 Additional file 4: Supplemental Table 4. GAP-a microbial chimera.
                                                                                   5. Kumar PS. From focal sepsis to periodontal medicine: a century of exploring
 Genes that were shared by all three diseases, as well as between general-
                                                                                       the role of the oral microbiome in systemic disease. J Physiol. 2016;595(2):
 ized and localized aggressive periodontitis and generalized aggressive
                                                                                       465–76. https://doi.org/10.1113/JP272427.
 periodontitis and chronic periodontitis.
                                                                                   6. Armitage GC. Development of a classification system for periodontal
                                                                                       diseases and conditions. Ann Periodontol. 1999;4(1):1–6. https://doi.org/10.1
                                                                                       902/annals.1999.4.1.1.
Authors’ contributions                                                             7. Demmer RT, Papapanou PN. Epidemiologic patterns of chronic and
KA: sample collection, DNA processing, bioinformatics, statistical analysis, and       aggressive periodontitis. Periodontol. 2010;53(1):28–44.
manuscript preparation. PM: sample collection and manuscript preparation.          8. Faveri M, Mayer MP, Feres M, de Figueiredo LC, Dewhirst FE, Paster BJ.
SMG: sample collection, DNA processing, bioinformatics, statistical analysis,          Microbiological diversity of generalized aggressive periodontitis by 16S
and manuscript preparation. SMD: bioinformatics, statistical analysis, and             rRNA clonal analysis. Oral Microbiol Immunol. 2008;23(2):112–8. https://doi.
manuscript preparation. HNN: statistical analysis and manuscript preparation.          org/10.1111/j.1399-302X.2007.00397.x.
PSK: overall study design, funding, sample collection, DNA processing,             9. Fine DH, Patil AG, Loos BG. Classification and diagnosis of aggressive
bioinformatics, statistical analysis, and manuscript preparation. The author(s)        periodontitis. J Clin Periodontol. 2018;45(S20):S95–S111. https://doi.org/1
read and approved the final manuscript.                                                0.1111/jcpe.12942.
                                                                                   10. Haubek D, Ennibi OK, Poulsen K, Poulsen S, Benzarti N, Kilian M. Early-onset
                                                                                       periodontitis in Morocco is associated with the highly leukotoxic clone of
Funding                                                                                Actinobacillus actinomycetemcomitans. J Dent Res. 2001;80(6):1580–3.
This study was funded by R01-DE022579 awarded to Purnima Kumar by the                  https://doi.org/10.1177/00220345010800062001.
National Institutes of Dental and Craniofacial Research.                           11. Shaddox LM, Huang H, Lin T, Hou W, Harrison PL, Aukhil I, et al.
                                                                                       Microbiological characterization in children with aggressive periodontitis. J
                                                                                       Dent Res. 2012;91(10):927–33. https://doi.org/10.1177/0022034512456039.
Availability of data and materials                                                 12. Socransky SS, Haffajee AD, Cugini MA, Smith C, Kent RL Jr. Microbial
Sequences for all 59 samples are deposited in the Sequence Read Archives               complexes in subgingival plaque. J Clin Periodontol. 1998;25(2):134–44.
under the project ID PRJNA552294 and PRJNA508385.                                      https://doi.org/10.1111/j.1600-051X.1998.tb02419.x.
Altabtbaei et al. Microbiome (2021) 9:97 Page 14 of 15
13. Abusleme L, Dupuy AK, Dutzan N, Silva N, Burleson JA, Strausbaugh LD, 35. Weiss S, Van Treuren W, Lozupone C, Faust K, Friedman J, Deng Y, et al.
et al. The subgingival microbiome in health and periodontitis and its Correlation detection strategies in microbial data sets vary widely in
relationship with community biomass and inflammation. ISME J. 2013;7(5): sensitivity and precision. Isme J. 2016;10(7):1669–81. https://doi.org/10.1038/
1016–25. https://doi.org/10.1038/ismej.2012.174. ismej.2015.235.
14. Li Y, He J, He Z, Zhou Y, Yuan M, Xu X, et al. Phylogenetic and functional 36. Bastian M, Heymann S, Jacomy M. Gephi: an open source software for
gene structure shifts of the oral microbiomes in periodontitis patients. ISME exploring and manipulating networks. ICWSM. 2009;8:361–2.
J. 2014;8(9):1879–91. https://doi.org/10.1038/ismej.2014.28. 37. Guimera R, Nunes Amaral LA. Functional cartography of complex metabolic
15. Ge X, Rodriguez R, Trinh M, Gunsolley J, Xu P. Oral microbiome of networks. Nature. 2005;433(7028):895–900. https://doi.org/10.1038/nature03288.
deep and shallow dental pockets in chronic periodontitis. PLoS ONE. 38. Olesen JM, Bascompte J, Dupont YL, Jordano P. The modularity of
2013;8(6):e65520. https://doi.org/10.1371/journal.pone.0065520. pollination networks. Proc Natl Acad Sci. 2007;104(50):19891–6. https://doi.
16. Picolos DK, Lerche-Sehm J, Abron A, Fine JB, Papapanou PN. Infection org/10.1073/pnas.0706375104.
patterns in chronic and aggressive periodontitis. J Clin Periodontol. 2005; 39. Anderson MJ. Distance-based tests for homogeneity of multivariate
32(10):1055–61. https://doi.org/10.1111/j.1600-051X.2005.00828.x. dispersions. Biometrics. 2006;62(1):245–53. https://doi.org/10.1111/j.1541-042
17. Segata N, Izard J, Waldron L, Gevers D, Miropolsky L, Garrett WS. 0.2005.00440.x.
Metagenomic biomarker discovery and explanation. Genome Biol. 2011; 40. Kononen E, Muller HP. Microbiology of aggressive periodontitis. Periodontol.
12(6):R60. https://doi.org/10.1186/gb-2011-12-6-r60. 2014;65(1):46–78. https://doi.org/10.1111/prd.12016.
18. Zaneveld JR, McMinds R, Vega TR. Stress and stability: applying the Anna 41. Brown LJ, Albandar JM, Brunelle JA, Loe H. Early-onset periodontitis:
Karenina principle to animal microbiomes. Nat Microbiol. 2017;2(9):17121. progression of attachment loss during 6 years. J Periodontol. 1996;67(10):
https://doi.org/10.1038/nmicrobiol.2017.121. 968–75. https://doi.org/10.1902/jop.1996.67.10.968.
19. Papapanou PN, Sanz M, Buduneli N, Dietrich T, Feres M, Fine DH, et al. 42. Lamont RJ, El-Sabaeny A, Park Y, Cook GS, Costerton JW, Demuth DR.
Periodontitis: consensus report of workgroup 2 of the 2017 World Role of the Streptococcus gordonii SspB protein in the development
Workshop on the Classification of Periodontal and Peri-Implant Diseases of Porphyromonas gingivalis biofilms on streptococcal substrates.
and Conditions. J Periodontol. 2018;89(Suppl 1):S173–s82. https://doi.org/1 Microbiology. 2002;148(Pt 6):1627–36.
0.1002/jper.17-0721. 43. Marsh PD, McDermid AS, McKee AS, Baskerville A. The effect of
20. Dabdoub SM, Ganesan SM, Kumar PS. Comparative metagenomics reveals growth rate and haemin on the virulence and proteolytic activity of
taxonomically idiosyncratic yet functionally congruent communities in Porphyromonas gingivalis W50. Microbiology. 1994;140(Pt 4):861–5.
periodontitis. Sci Rep. 2016;6(1):38993. https://doi.org/10.1038/srep38993. 44. Michalowicz BS, Ronderos M, Camara-Silva R, Contreras A, Slots J. Human
21. Wilke A, Bischof J, Gerlach W, Glass E, Harrison T, Keegan KP, et al. The MG- herpesviruses and Porphyromonas gingivalis are associated with juvenile
RAST metagenomics database and portal in 2015. Nucleic Acids Res. 2016; periodontitis. J Periodontol. 2000;71(6):981–8. https://doi.org/10.1902/jop.2
44(D1):D590–4. https://doi.org/10.1093/nar/gkv1322. 000.71.6.981.
22. Tang W, Wilkening J, Bischof J, Gerlach W, Wilke A, Desai N, et al. Building 45. Mikuls TR, Payne JB, Yu F, Thiele GM, Reynolds RJ, Cannon GW, et al. Periodontitis
scalable data management and analysis infrastructure for metagenomics. and Porphyromonas gingivalis in patients with rheumatoid arthritis. Arthritis
2013. Rheum. 2014;66(5):1090–100. https://doi.org/10.1002/art.38348.
23. Wilke A, Bischof J, Harrison T, Brettin T, D'Souza M, Gerlach W, et al. A 46. Pussinen PJ, Alfthan G, Jousilahti P, Paju S, Tuomilehto J. Systemic exposure
RESTful API for accessing microbial community data for MG-RAST. PLoS to Porphyromonas gingivalis predicts incident stroke. Atherosclerosis. 2007;
Comput Biol. 2015;11(1):e1004008. https://doi.org/10.1371/journal.pcbi.1004 193(1):222–8.
008. 47. Ley RE, Turnbaugh PJ, Klein S, Gordon JI. Microbial ecology: human gut
24. Oksanen J, Kindt R, Legendre P, O'Hara B, Simpson GL, Solymos P, Stevens microbes associated with obesity. Nature. 2006;444(7122):1022–3. https://
MHH, Wagner H. vegan: Community Ecology Package (R package version 1. doi.org/10.1038/4441022a.
15-1); 2008. 48. Paster BJ, Boches SK, Galvin JL, Ericson RE, Lau CN, Levanos VA, et al.
25. Dabdoub SM, Fellows ML, Paropkari AD, Mason MR, Huja SS, Tsigarida AA, Bacterial diversity in human subgingival plaque. J Bacteriol. 2001;183(12):
et al. PhyloToAST: bioinformatics tools for species-level analysis and 3770–83. https://doi.org/10.1128/JB.183.12.3770-3783.2001.
visualization of complex microbial datasets. Sci Rep. 2016;6(1):29123. https:// 49. Bernard G, Pathmanathan JS, Lannes R, Lopez P, Bapteste E. Microbial dark
doi.org/10.1038/srep29123. matter investigations: how microbial studies transform biological
26. Sievert C. Interactive web-based data visualization with R, plotly, and shiny. knowledge and empirically sketch a logic of scientific discovery. Genome
Boca Raton: CRC Press, Taylor and Francis Group; 2020. https://doi.org/10.12 Biol Evol. 2018;10(3):707–15. https://doi.org/10.1093/gbe/evy031.
01/9780429447273. 50. Solden L, Lloyd K, Wrighton K. The bright side of microbial dark
27. Rousseeuw PJ. Silhouettes: a graphical aid to the interpretation and matter: lessons learned from the uncultivated majority. Curr Opin
validation of cluster analysis. J Comput Appl Math. 1987;20:53–65 https:// Microbiol. 2016;31:217–26 https://doi.org/10.1016/j.mib.2016.04.020.
doi.org/10.1016/0377-0427(87)90125-7. 51. Armour CR, Nayfach S, Pollard KS, Sharpton TJ. A metagenomic meta-analysis
28. Pedregosa F, Ga, #235, Varoquaux L, Gramfort A, Michel V, et al. Scikit-learn: reveals functional signatures of health and disease in the human gut microbiome.
machine learning in Python. J Mach Learn Res. 2011;12:2825–30. mSystems. 2019;4(4):e00332–18. https://doi.org/10.1128/mSystems.00332-18.
29. Love MI, Huber W, Anders S. Moderated estimation of fold change and 52. Teles R, Teles F, Frias-Lopez J, Paster B, Haffajee A. Lessons learned and
dispersion for RNA-seq data with DESeq2. Genome Biol. 2014;15(12):550. unlearned in periodontal microbiology. Periodontol. 2013;62(1):95–162.
https://doi.org/10.1186/s13059-014-0550-8. https://doi.org/10.1111/prd.12010.
30. Zhu A, Ibrahim JG, Love MI. Heavy-tailed prior distributions for 53. Wolfe AJ. The acetate switch. Microbiol Mol Biol Rev. 2005;69(1):12–50.
sequence count data: removing the noise and preserving large https://doi.org/10.1128/MMBR.69.1.12-50.2005.
differences. Bioinformatics. 2018;35(12):2084–92. https://doi.org/10.1 54. Daniels JB, Scoffield J, Woolnough JL, Silo-Suh L. Impact of glycerol-3-
093/bioinformatics/bty895. phosphate dehydrogenase on virulence factor production by
31. Hamilton NE, Ferry M. ggtern: ternary diagrams using ggplot2. J Stat Softw. Pseudomonas aeruginosa. Can J Microbiol. 2014;60(12):857–63. https://
2018;87(1):1–17. doi.org/10.1139/cjm-2014-0485.
32. Kanehisa M, Goto S. KEGG: kyoto encyclopedia of genes and 55. Dhouib R, Pg Othman DSM, Essilfie A-T, Hansbro PM, Hanson JO, McEwan
genomes. Nucleic Acids Res. 2000;28(1):27–30. https://doi.org/10.1093/ AG, et al. Maturation of molybdoenzymes and its influence on the
nar/28.1.27. pathogenesis of non-typeable Haemophilus influenzae. Front Microbiol.
33. Overbeek R, Olson R, Pusch GD, Olsen GJ, Davis JJ, Disz T, et al. The SEED 2015;6(1219). https://doi.org/10.3389/fmicb.2015.01219.
and the Rapid Annotation of microbial genomes using Subsystems 56. Bittner F, Mendel RR. Molybdenum cofactor biosynthesis and cross
Technology (RAST). Nucleic Acids Res. 2014;42(Database issue):D206–14. talk with iron–sulfur. Encyclopedia of Inorganic and Bioinorganic
https://doi.org/10.1093/nar/gkt1226. Chemistry. 2013.
34. Friedman J, Alm EJ. Inferring correlation networks from genomic survey 57. Loesche WJ, Grossman NS. Periodontal disease as a specific, albeit chronic,
data. PLoS Comput Biol. 2012;8(9):e1002687. https://doi.org/10.1371/journal. infection: diagnosis and treatment. Clin Microbiol Rev. 2001;14(4):727–52,
pcbi.1002687. table of contents. https://doi.org/10.1128/CMR.14.4.727-752.2001.You can also read