Transmitting silks of maize have a complex and dynamic microbiome
←
→
Page content transcription
If your browser does not render page correctly, please read the page content below
www.nature.com/scientificreports
OPEN Transmitting silks of maize
have a complex and dynamic
microbiome
Eman M. Khalaf1,2, Anuja Shrestha1, Jeffrey Rinne1, Michael D. J. Lynch3, Charles R. Shearer1,
Victor Limay‑Rios4, Lana M. Reid5 & Manish N. Raizada1*
In corn/maize, silks emerging from cobs capture pollen, and transmit resident sperm nuclei to eggs.
There are > 20 million silks per U.S. maize acre. Fungal pathogens invade developing grain using
silk channels, including Fusarium graminearum (Fg, temperate environments) and devastating
carcinogen-producers (Africa/tropics). Fg contaminates cereal grains with mycotoxins, in particular
Deoxynivalenol (DON), known for adverse health effects on humans and livestock. Fitness selection
should promote defensive/healthy silks. Here, we report that maize silks, known as styles in other
plants, possess complex and dynamic microbiomes at the critical pollen-fungal transmission interval
(henceforth: transmitting style microbiome, TSM). Diverse maize genotypes were field-grown in two
trial years. MiSeq 16S rRNA gene sequencing of 328 open-pollinated silk samples (healthy/Fg-infected)
revealed that the TSM contains > 5000 taxa spanning the prokaryotic tree of life (47 phyla/1300
genera), including nitrogen-fixers. The TSM of silk tip tissue displayed seasonal responsiveness, but
possessed a reproducible core of 7–11 MiSeq-amplicon sequence variants (ASVs) dominated by a
single Pantoea MiSeq-taxon (15–26% of sequence-counts). Fg-infection collapsed TSM diversity and
disturbed predicted metabolic functionality, but doubled overall microbiome size/counts, primarily
by elevating 7–25 MiSeq-ASVs, suggestive of a selective microbiome response against infection. This
study establishes the maize silk as a model for fundamental/applied research of plant reproductive
microbiomes.
In both plants and humans, reproduction requires maternal exposure to the environment to facilitate sperm
entry (female reproductive tract), thereby also creating an entry point for p athogens1,2. In humans, disruptions in
the microbiomes of the vaginal-cervical-uterine-Fallopian tube tract have been associated with disease, infertil-
ity and pre-term b irth3,4. In plants, the female reproductive tract includes exposed papillae (stigma), on which
pollen land and germinate, connected to a long channel (style) that terminates in an egg sac; sperm nuclei exit
the pollen, then travel to the egg within a tubular extension of the pollen (pollen tube) inside the style channel5.
There are limited reports of cultured microbes and/or microbiomes associated with the stigma and style from a
few plants, including p ear6, the wild tree Metrosideros polymorpha7, wild monkeyflowers8 and apples9.
In cultivated maize (corn, Zea mays L.), one of the world’s three most important food crops, the style is called
the silk, recognizable as the threads that emerge at the tips of corn cobs. The maize silk is one of the fastest-
growing tissues in nature (~ 1–3 mm/h)10. Due to climate change, silk health is becoming more critical to global
maize production, because drought inhibits silk growth which prevents synchronization between pollen shed
and silk receptivity and thus reduces grain yield11. Silk emergence is also susceptible to low soil nitrogen12, which
is particularly limiting in Africa where maize is a staple food crop. Silks have been used for centuries in Mexico,
China and elsewhere as herbal medicines for diseases of the urinary tract, arthritis, obesity, and for their anti-
microbial activities, associated with a diversity of phytochemicals13.
Silks are also critically important to the world’s maize farmers not only for seed establishment but also because
plant insects (including the maize earworm, Helicoverpa zea)14 and pathogens utilize silks as express entry routes
to the developing g rain2 analogous to Candida invading the v agina15. After fertilization, silks become senescent
1
Department of Plant Agriculture, University of Guelph, 50 Stone Road E, Guelph, ON N1G 2W1,
Canada. 2Department of Microbiology and Immunology, Faculty of Pharmacy, Damanhour University,
Damanhour 22511, Egypt. 3Metagenom Bio, 550 Parkside Drive, Unit A9, Waterloo, ON N2L 5V4,
Canada. 4Department of Plant Agriculture, University of Guelph, Ridgetown Campus, 120 Main Street E,
Ridgetown, ON N0P 2C0, Canada. 5Ottawa Research and Development Centre, Agriculture and Agri-Food Canada,
960 Carling Avenue, Central Experimental Farm, Ottawa, ON K1A 0C6, Canada. *email: raizada@uoguelph.ca
Scientific Reports | (2021) 11:13215 | https://doi.org/10.1038/s41598-021-92648-4 1
Vol.:(0123456789)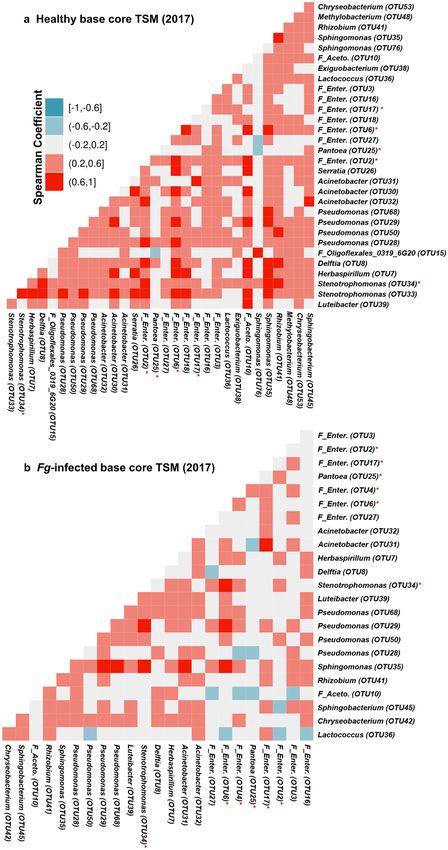
www.nature.com/scientificreports/
but remain rich in nutrients2,13, and thus this stage of silk development is particularly susceptible to grain-bound
athogens2. In tropical Africa and Latin America, silk-invaders include the mycotoxin-producing fungal patho-
p
gens Aspergillus flavus and Fusarium verticillioides that devastate tens of millions of maize farmers, where they
produce carcinogens2,16. In primarily temperate regions, silk-invading F. graminearum (Fg) infection causes
Gibberella ear r ot16. Fg produces mycotoxins, mainly type B trichothecenes [including deoxynivalenol (DON)
and nivalenol (NIV)] and zearalenone (ZEA)—reported for their toxic impacts on gastrointestinal, hematic and
reproductive systems, respectively, which impact livestock and human health16. Altered temperature, rainfall,
and humidity associated with climate change are expected to increase Fg-based mycotoxins in maize17.
Despite the importance of styles/silks to both reproduction and global grain disease, there are no reports
in the literature about the microbiome of silks. Maize silks are environmentally exposed and unusually long
(up to 30 cm)5, and hence an excellent model for style microbiome research. Silks would be an ideal habitat for
microbes, as they are rich in lipids, proteins, carbohydrates, minerals, and vitamins, and have a high moisture
content13. Endophytic microbes inhabiting other tissues in maize and its relatives have been shown to combat
Fg18–22. There may have been even stronger selection pressure to recruit protective microbes within the actual
entry/transmission point of Fg and other pathogens/pests, as well as additional microbes to protect the tissue
against environmental stress (e.g. drought, nutrients), given its critical importance to reproduction. However,
the rapid growth rate of silk tissue and its exposure to a fluctuating environment raise questions as to whether
silks/styles can establish a microbiome and whether it would be stable.
Here, we test: (1) whether maize silks at the pollen-fungal transmission interval possess core microbiomes
within the spatial tip to base gradient; (2) whether these microbiomes are stable across field spatial blocks, trial
years and diverse host genotypes; and (3) whether Fg invasion using artificial spore inoculation disrupts the
transmitting silk microbiome and/or elicits increases in potential protective microbes (Fg-indicator taxa). Here,
the microbiome was analyzed in open pollinated silks to mimic maize production in farmers’ fields after pol-
lination when Fg primarily enters. We henceforth refer to this as the transmitting style microbiome (TSM), the
microbiome associated with silks at the interval encompassing pollination and Fg transmission.
Results
Exploration of the healthy transmitting silk microbiome (TSM). To determine whether healthy
transmitting silks have a stable microbiome, 14 diverse maize genotypes (primarily exhibiting some degree of
silk resistance to Fg), spanning 7 heterotic breeding groups (Supplementary Table S1), were grown in 3 spa-
tial field blocks for 2 years (weather data: Supplementary Figs. S1, S2). Silks were harvested from 3 randomly
selected cobs per block and pooled, with husk leaf-protected silk tip and base tissues first separated (Fig. 1a–c),
resulting in 163 genomic DNA samples. After quality filtering, there were ~ 3 million 16S rRNA (V4 region) read
counts (Supplementary Table S2). Fastq files of obtained sequences were deposited in Genbank under the Bio-
Project accession no. PRJNA601168. Silk tip genomic DNA isolation was prioritized, using a DNeasy Plant Mini
kit (Qiagen, USA), which resulted in sufficient yields for MiSeq; however subsequent silk base DNA isolations
showed low yields using this method, causing us to adapt a higher-yielding CTAB protocol with more starting
tissue. When tested on the same split samples (as a control), the Qiagen kit method was observed to produce
greater microbial diversity than the CTAB method (Supplementary Fig. S3). Therefore, for this study, we have
bioinformatically analyzed and presented each tissue location (tip vs base) separately and avoided direct com-
parisons. In general, the silk base tissue results may be underestimating microbial diversity.
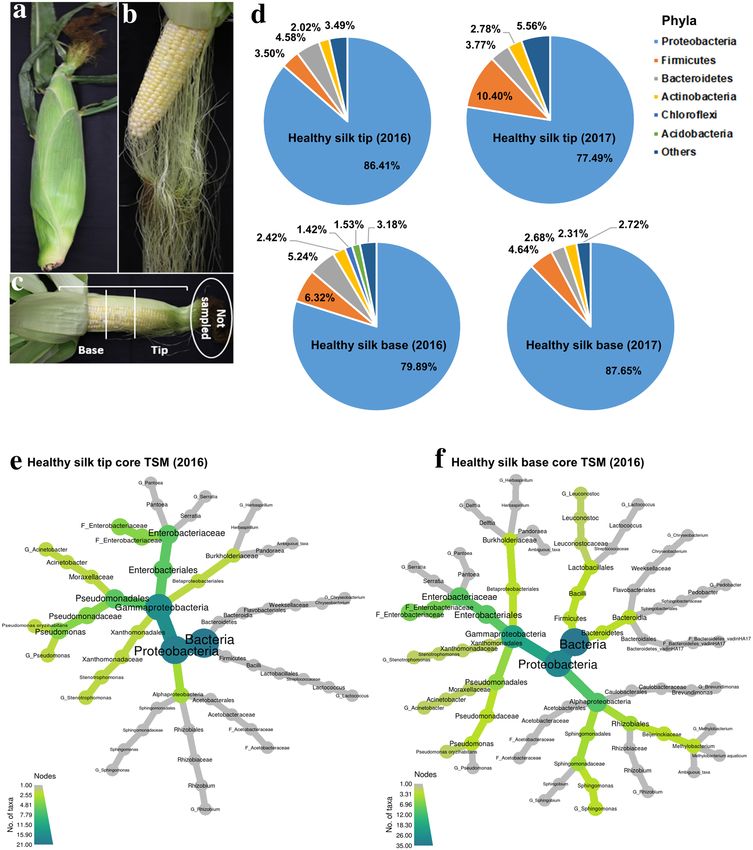
In both tip and base silk tissues, the most dominant bacterial phylum was Proteobacteria (which occu-
pied ~ 78–88% of all 16S read counts in both 2016 and 2017 based on relative abundance, RA), followed far
behind by Firmicutes, Bacteroidetes and Actinobacteria (RA > 1%) (Fig. 1d). Within the Proteobacteria, the most
dominant class, order and genus, respectively, were Gammaproteobacteria, Enterobacteriales and Pantoea (Table 1,
Supplementary Table S3a, b). Healthy silks, when combined, were inhabited by 5152 unique bacterial (99.8%)
and archaea taxa (0.2%) belonging to 1296 genera spanning the Prokaryotic Tree of Life23 (Supplementary
Fig. S4). The results showed the existence of reproducible core tip and base TSM (taxa prevalent in at least 50%
of samples) traversing the maize genotypes and field years (Fig. 1e, f; Supplementary Fig. S5c, e, Supplementary
Fig. S6). There were surprising TSM inhabitants such as widespread nitrogen-fixing bacteria including Rhizo-
bium, Herbaspirillum and Azospirillum (Table 1, Fig. 1e, f, Supplementary Fig. S6a–d).
Trial year impacts on the healthy transmitting silk microbiome. The relative abundance of the
dominant taxa was consistent across years (Table 1; Supplementary Table S3a, b; Fig. 2a, c, e, g) providing evi-
dence for the stability of dominant TSM taxa (e.g. including Pantoea and Acinetobacter OTUs). This stability
was confirmed by generally non-significant differences in estimates of alpha diversity indices across the different
spatial field blocks across 2016 and 2017, with only two exceptions for observed OTUs and Faith’s phylogenetic
diversity metric in healthy base tissues in 2017 (Supplementary Table S4). When these two independent statisti-
cal measurements are combined, they suggest that the transmitting female reproductive tract of modern maize
is inhabited by a complex microbiome from which the dominant taxa are reproducible.
Despite the reproducibility of dominant taxa, a test of beta diversity showed a significant microbiome shift
in healthy transmitting silk tips from 2016 to 2017 which could be statistically confirmed to be a trial year
effect; this conclusion was less certain for base tissues (Supplementary Table S5a). These results were based on
the PERMANOVA (permutational multivariate analysis of variance) test performed using the Bray–Curtis dis-
similarity matrix (which provides 16S read count-abundance based measurements of dissimilarity across tested
groups), unweighted UniFrac matrix [focuses on rarely shared (less abundant) taxa], and weighted UniFrac
matrix (focused on dominant taxa, incorporating both phylogenetic distances along with abundances), followed
by validation using the PERMDISP test which confirmed that the within-group dispersion of the data was not
Scientific Reports | (2021) 11:13215 | https://doi.org/10.1038/s41598-021-92648-4 2
Vol:.(1234567890)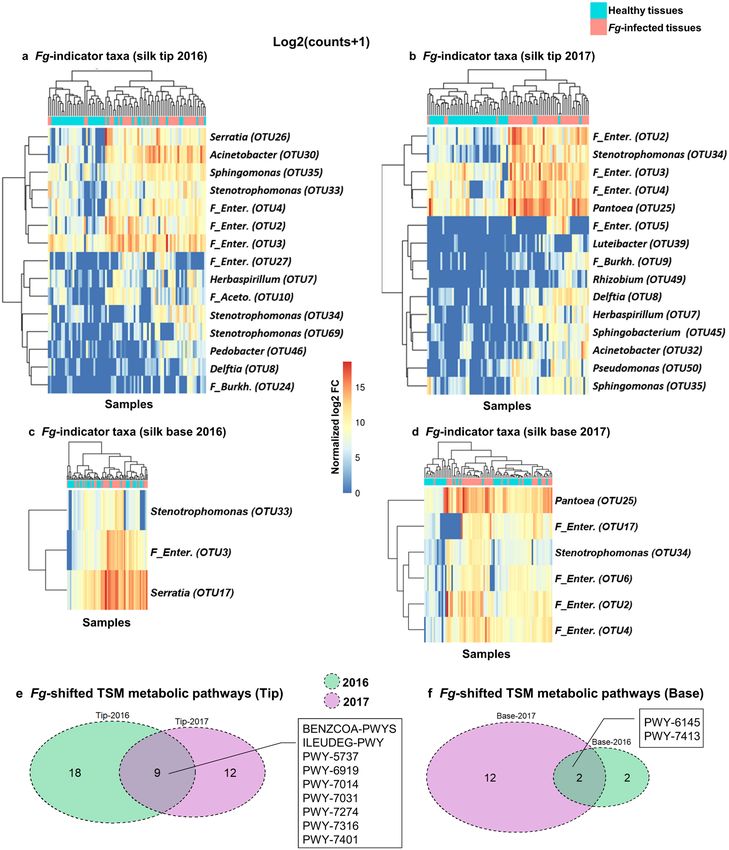
www.nature.com/scientificreports/

                                  Figure 1.  Composition of the transmissible style microbiome (TSM) of healthy maize silks. (a) Photo of
                                  maize cob with husk leaves protecting silks; (b) Peeled away husk leaves revealing/exposing silk threads; (c)
                                  Locations of base and tip silk tissues used in this study. (d) Contribution of dominant bacterial phyla in healthy
                                  TSM based on calculated relative abundance (RA) ≥ 1% using 16S read counts. (e, f) Heat tree displays of the
                                  core microbiomes of healthy transmitting silks harvested in 2016 from the (e) silk tip and (f) silk base (see
                                  Supplementary Fig. S5c, e for 2017). Core taxa (prevalent ≥ 50% of silk samples) are displayed in a hierarchal
                                  taxonomic heat tree from kingdom to species. The color depth and node size indicate the number of bacterial
                                  taxa within each taxonomic node or branch.

                                  significantly different between the years, especially for tip samples (Supplementary Table S5a). The dissimilari-
                                  ties between tested sample groups were visualized by 2D principal coordinate analysis (PCoA) plots. The PCoA
                                  plots showed a greater shift in the tip TSM between years compared to base tissues (Fig. 3a, b; Supplementary
                                  Fig. S7a–l). Consistent with this result, there was a reduction in the diversity observed in the tip core microbiome
                                  in 2017 compared to 2016 (from 21 to 11 taxa) whereas the base was more stable (from 35 to 31 taxa) (Fig. 1e,
                                  f, and Supplementary Fig. S5a–f).

                                  Global impacts of F. graminearum (Fg) infection on the transmitting silk microbiome. To
                                  determine the impacts of Fg infection on the TSM, split-plots of all healthy plots (14 maize genotypes, 3 field
                                  blocks, 2 years) were artificially inoculated with Fg spores directly onto emerged silks, and then 165 treated

Scientific Reports |   (2021) 11:13215 |               https://doi.org/10.1038/s41598-021-92648-4                                                      3

                                                                                                                                               Vol.:(0123456789)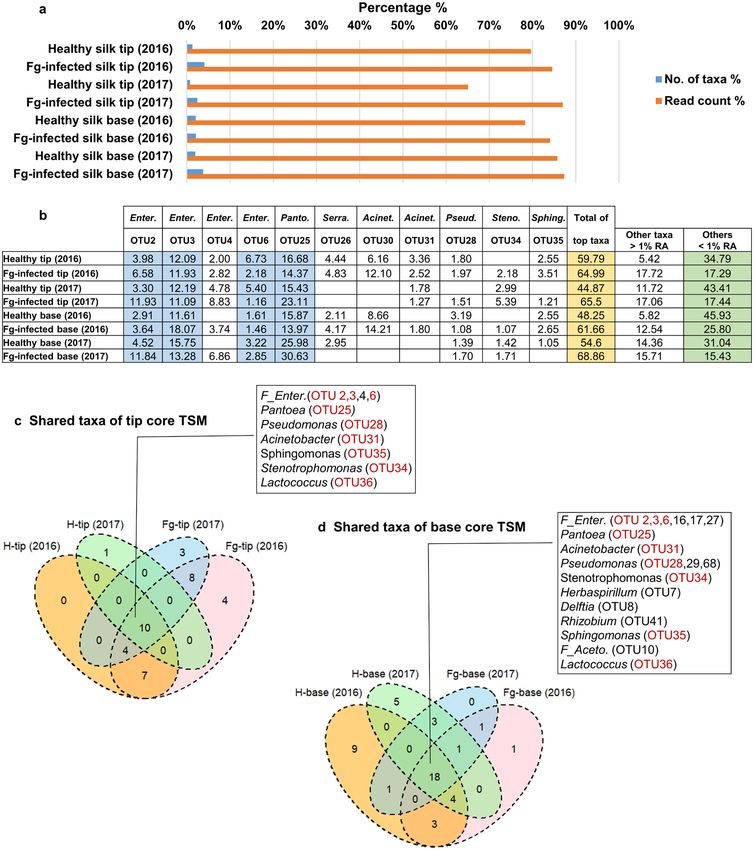
www.nature.com/scientificreports/

                                             Taxonomic level   Taxon                  Healthy tip (2016)   Fg-infected tip (2016)   Healthy tip (2017)   Fg-infected tip (2017)
                                             Genus                                    N = 455              N = 214                  N = 531              N = 311
                                                               Pantoea                24.47                21.63                    24.58                43.49
                                                               Acinetobacter          14.58                20.71                    6.63                 7.06
                                                               Pseudomonas            10.81                13.18                    9.21                 11.38
                                                               Serratia               6.09                 6.73                     < 1.0                < 1.0
                                                               Stenotrophomonas       5.81                 10.77                    5.88                 12.47
                                                               Sphingomonas           4.82                 5.98                     3.09                 2.55
                                                               Chryseobacterium       3.06                 3.34                     1.39                 1.51
                                                               Pandoraea              2.05                 2.00                     < 1.0                < 1.0
                                                               Ambiguous_taxa         1.95                 2.48                     < 1.0                < 1.0
                                                               Herbaspirillum         1.6                  2.08                     < 1.0                1.74
                                                               Lactococcus            1.26                 < 1.0                    3.36                 3.42
                                                               Sphingobacterium       1.03                 1.25                     1.09                 2.52
                                                               Leuconostoc            1.01                 < 1.0                    < 1.0                < 1.0
                                                               Acetobacter            < 1.0                1.87                     < 1.0                < 1.0
                                                               Rhizobium*             < 1.0                1.29                     < 1.0                1.63
                                                               Clostridium ss 8**     < 1.0                < 1.0                    1.04                 < 1.0
                                                               Enterococcus           < 1.0                < 1.0                    1.89                 < 1.0
                                                               Escherichia-Shigella   < 1.0                < 1.0                    1.29                 < 1.0
                                                               Exiguobacterium        < 1.0                < 1.0                    1.05                 < 1.0
                                                               Gluconobacter          < 1.0                < 1.0                    1.81                 < 1.0
                                                               Lactobacillus          < 1.0                < 1.0                    1.49                 < 1.0
                                                               Massilia               < 1.0                < 1.0                    1.27                 < 1.0
                                                               Phyllobacterium        < 1.0                < 1.0                    1.75                 < 1.0
                                                               Delftia                < 1.0                < 1.0                    < 1.0                3.31
                                             Taxa                                     N = 1580             N = 813                  N = 1466             N = 1022

                                            Table 1.  Summary of TSM taxa at genus level inhabiting silk tip tissues with mean relative abundance
                                            of > 1% in at least one of the 4 sample groups. *Allorhizobium-Neorhizobium-Pararhizobium-Rhizobium.
                                            **Clostridium sensu stricto 8.

                                            samples (tip and base) were analyzed. Surprisingly, silk Fg infection led to a large increase in 16S read counts
                                            (from ~ 3 million in healthy transmitting silks to ~ 7 million in infected silks), yet dramatic reductions in the
                                            total number of taxa (from 5152 in healthy tissues to 3074 in Fg-infected tissues) (Table S2) confirmed by alpha
                                            diversity analysis (healthy vs Fg-infected group significance) (Table S4). The reduction was primarily associ-
                                            ated with depletion of rare taxa (< 1% relative abundance) (Fig. S8). At the phyla level, Proteobacteria (espe-
                                            cially Gammaproteobacteria) significantly increased in relative abundance while the remaining dominant phyla
                                            decreased (Supplementary Figs. S8–S10; Supplementary Dataset S1). These estimates were based on calculations
                                            performed in STAMP using 2-sided White’s non-parametric t-test adjusted for 2-group comparisons with a Ben-
                                            jamini–Hochberg multiple test correction method using collapsed feature tables (Supplementary Dataset S1).
                                                The corresponding PCoA plots of UniFrac matrices confirmed the contraction in the diversity of the tip TSM
                                            upon Fg-infection [Supplementary Fig. S11, unweighted UniFrac that places equal weight on all taxa including
                                            rare taxa (defined here as RA < 1%)] and the significant increase in abundance of specific taxa primarily belonging
                                            to the phylum Proteobacteria [Supplementary Figs. S9, S10, weighted UniFrac matrix that focuses on dominant
                                            taxa (defined here as RA > 1%)]. These conclusions also were true in base tissues in both years, as confirmed
                                            using Bray–Curtis in particular (Supplementary Table S5b, Supplementary Fig. S12).
                                                In beta diversity analysis, Fg was a greater driver of TSM composition compared to other factors including
                                            host genotype (Supplementary Fig. S7m–o). PERMANOVA suggested a significant shift in TSM composition
                                            upon Fg infection (Fig. 3e–h, Supplementary Fig. S11). However, there were often significant differences in the
                                            level of dispersion between treatment groups (PERMDISP, Supplementary Table S5b), consistent with the dra-
                                            matic loss of diversity upon Fg infection, which when combined with conserved dominant taxa (Table 1; Fig. 2),
                                            caused overlap among the treatment groups in PCoA plots (Fig. 3e–h). The Fg-treated TSM was more sensitive
                                            to trial year compared to the TSM from healthy tissues (Fig. 3a–d, Supplementary Fig. S7a–l, Supplementary
                                            Table S5).
                                                Together these results show that Fg-infection dramatically reduced overall diversity of the TSM (Supplemen-
                                            tary Figs. S8, S12), yet conversely caused a reproducible proliferation of the total microbial population, associated
                                            with a small set of core dominant taxa that is resilient to Fg.

                                            Conservation and resiliency of core microbiomes. Overall, the higher-level TSM taxonomic struc-
                                            ture, dominated by the core taxa, was resilient to Fg infection across tissues and trial years (Figs. 2a–h, 3g, h;
                                            Supplementary Figs. S8, S9). Regardless of treatment, tissue location and year, and based on abundance, the

          Scientific Reports |   (2021) 11:13215 |                https://doi.org/10.1038/s41598-021-92648-4                                                                      4

Vol:.(1234567890)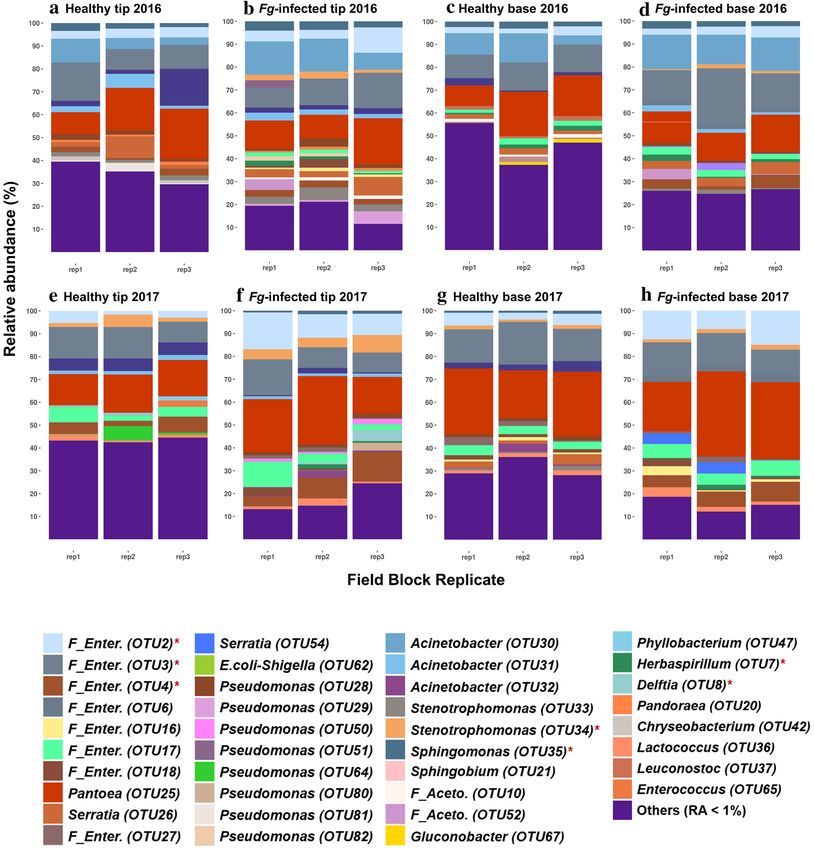
www.nature.com/scientificreports/

                                  Figure 2.  Impacts of field block location, year and Fg infection on TSM composition. (a–h) Bar charts of
                                  dominant TSM taxa (relative abundance (RA) ≥ 1%) at 3 field blocks (rep1, rep2, rep3) calculated at the OTU
                                  level for healthy transmitting silks in 2016 of (a) tip and (c) base tissues, and 2017 of (e) tip and (g) base tissues,
                                  and Fg-infected silks in 2016 of (b) tip and (d) base tissues, and 2017 of (f) tip and (h) base tissues. OTUs with
                                  RA < 1% were grouped and labeled as “Others”. Taxa tagged by a red asterisk denote consistent Fg-indicators.

                                  core taxa comprised 0.75–4% of the total taxa count but contributed 65–87% of the total read count of each
                                  microbiome (Fig. 4a). Fg infection increased the number of taxa that comprised the tip core microbiome, but
                                  decreased the diversity of the base core microbiome, compared to healthy transmitting silks (Fig. 1e, f; Sup-
                                  plementary Fig. S5). Nine abundant OTUs (defined as the shared core TSM) were highly conserved (in at least
                                  50% of the samples) in both healthy and Fg-infected silk tip and base tissues across years belonging to three
                                  bacterial classes: Gammaproteobacteria [Pantoea (OTU25), Enterobacteriaceae family (OTU2, OTU3, OTU6),
                                  Pseudomonas (OTU28), Stenotrophomonas (OTU34) and Acinetobacter (OTU31)], Alphaproteobacteria (Sphin-
                                  gomonas, OTU35) and Bacilli (Lactococcus, OTU36) (Fig. 4b–d). Of these, Pantoea (OTU25) was the most prev-
                                  alent taxon, detected in almost all healthy and infected samples (327/328 samples).

Scientific Reports |   (2021) 11:13215 |                https://doi.org/10.1038/s41598-021-92648-4                                                          5

                                                                                                                                                   Vol.:(0123456789)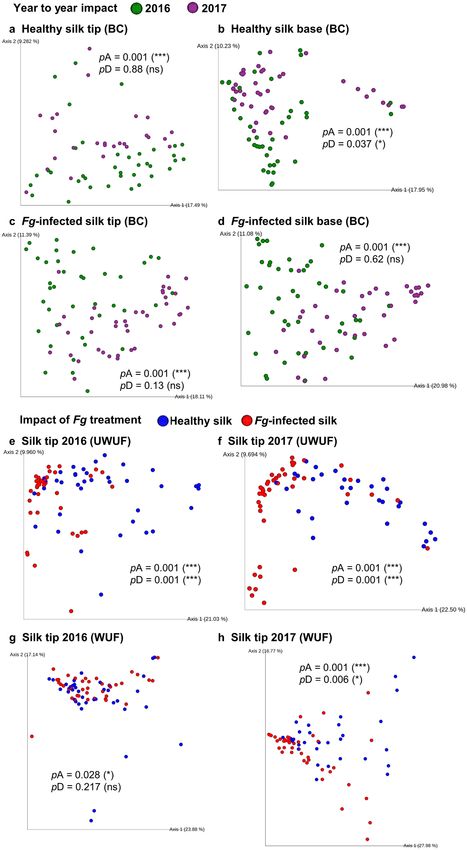
www.nature.com/scientificreports/
Figure 3. Principal Coordinate Plots (PCoA) of Beta diversity analysis. (a–d) 2D PCoA plots that display ▸
year-to-year TSM shifts using Bray–Curtis (BC) distance matrix: respectively, (a, b) represent healthy tip and
base, and (c, d) represent Fg-infected tip and base (see Supplementary Fig. S7 (a–l) for other matrices where
PCoA plots displayed as 5 principal coordinates (vertical lines) and each horizontal coloured line represents
one silk sample), (e–h) 2D PCoA plots that display TSM shifts upon Fg infection using phylogeny-based
distance matrices: (e, f) unweighted UniFrac (UWUF) that focuses on rare taxa in (e) tip tissues (2016), and (f)
tip tissues (2017), and (g, h) weighted UniFrac (WUF) that focuses on dominant taxa in (g) tip tissues (2016),
(h) tip tissues (2017) (see Supplementary Fig. S11 for other matrices and silk tissues displayed as 5 principal
coordinates). pA, and pD denote the calculated p values of PERMANOVA, and PERMDISP tests, respectively
(see Supplementary Table S5).
To identify candidate microbial networks within the core TSM, Spearman’s rank correlations were used to
identify strong co-occurring taxa (coefficient ≥ 0.6 and p-value ≤ 0.0001) (Fig. 5a, b; Supplementary Fig. S13).
In general, Fg infection weakened the co-occurrences between core taxa, especially in the silk base. While the
trial year and Fg infection affected co-occurring taxa, Sphingomonas (OTU35) was consistently the strongest
co-occurring taxa. Across tissue samples, OTU35 repeatedly associated with Pseudomonas (OTU29, OTU68),
suggestive of a consortium, and inconsistently with other core microbiome taxa (see Indicator Bacterial Taxa
section below). These results suggest that OTU35 forms the hub of the core TSM.
Identification of Fusarium‑indicator bacterial taxa. Given the overall proliferation of the TSM in
response to Fg, next we identified the specific taxa that were responsible for this proliferation, hypothesizing
that these taxa may protect the host tissue against Fg attack. We computed the log2 fold change of taxa abun-
dance using the DESeq2 R package at an adjusted p-value < 0.05 (Supplementary Information). Interestingly,
the taxa that increased consistently in both 2016 and 2017 in response to Fg infection (Supplementary Table S6)
were generally members of the core TSM (both healthy and/or diseased state), specifically Enterobacteriaceae
(OTU2, OTU3, OTU4), Herbaspirillum (OTU7), Delftia (OTU8), Stenotrophomonas (OTU34), and Sphingo-
monas (OTU35) (identified above as the microbiome hub) (Fig. 6a–d). Other taxa that increased in only a
single year included consistent core members such as Pantoea OTU25 (the most prevalent taxa in the TSM) and
Enterobacteriaceae (OTU6).
The indicator results were independently confirmed using the q2-sample-classifier, a plugin in a supervised
machine learning method (Qiime2 platform) for predicting sample characteristics based on the change in micro-
biome composition upon Fg infection. The top 20 important features/OTUs that distinguish between healthy
and Fg-infected samples were selectively visualized in heatmaps along with Area Under the Receiver Operating
Characteristics (AUROC) graphs to check the performance of the classification model (Supplementary Figs. S14,
S15). The predictions showed that tip sample groups had 14 OTUs that overlapped across trial years including
the Fusarium-indicator taxa calculated above (using the Deseq2 R package) along with other taxa, mostly part
of the shared core including Pseudomonas (OTU28) and Lactococcus (OTU36). For the silk base tissues, only 3
OTUs [F_Enterobacteriaceae (OTU4), Pseudomonas (OTU29), and Methylobacterium (OTU48)] were shared
across trial years with a lower discrimination capacity between the healthy and Fg-infected tissue samples (Sup-
plementary Fig. S15).
Some of the Fusarium-indicator taxa strongly but inconsistently co-occurred with OTU35 (coefficient ≥ 0.6
and p-value ≤ 0.0001) in Fg-infected tissues, suggestive of a silk-protecting consortium of up to 8 taxa as
candidate members, including F_Enterobacteriaceae (OTU4, OTU17), Pantoea (OTU25), and Delftia (OTU8)
(Fig. 5a, b; Supplementary Fig. S13).
Shifts in predicted metabolic pathways upon Fusarium infection. Taking into account all sample
groups, the reduction in TSM taxa upon Fg infection was associated with a reduction in 44 bacterial metabolic
pathways and an increase in only one pathway (silk base 2016; dTDP-6-deoxy-α-d-allose biosynthesis). Nine
pathways were consistent across years in the tip, and two pathways were consistent in the base tissue (Fig. 6e, f,
Supplementary Fig. S16, Supplementary Table S7). Specifically, Fg infection was predicted to cause the loss of
17 antibiotic biosynthesis pathways along with additional pathways related to macronutrient cycling (carbohy-
drates, amino acids, phospholipids) (Supplementary Fig. S16, Supplementary Table S7). These predictions were
obtained from bioinformatic metabolic pathway analysis (q2-picrust2, STAMP)24,25 using 2-sided White’s non-
parametric t-test adjusted for 2-group comparisons with a Bonferroni’s correction method.
Discussion
A healthy style is essential for plant sexual reproduction. Ancient peoples of the Americas selected for elon-
gated corn styles (silks) and understood their importance, depicting them as hairs on deity s tatues26. Today,
we estimate that there are > 4000 km of silks per U.S. acre of corn. Here we reported that the transmitting style
microbiome (TSM) of maize is dynamic and complex, spanning the prokaryotic tree of life (Supplementary
Fig. S4)23. The TSM population was observed to host 1,300 bacterial genera, but surprisingly only 7–11 taxa
accounted for ~ 45–69% of the entire microbiome based on mean relative abundance (Fig. 4b). Nine of these
were amongst the most widespread silk taxa, prevalent across diverse temperate maize genotypes, spatial field
blocks, trial year, and fungal attack (Fig. 4c, d). Six of the most abundant taxa belong to one evolutionary branch
(Enterobacteriales), including OTU25 (Pantoea) which occupied 15–26% of the healthy TSM and was prevalent
across 99% of all silk samples (Fig. 4b).
Scientific Reports | (2021) 11:13215 | https://doi.org/10.1038/s41598-021-92648-4 6
Vol:.(1234567890)www.nature.com/scientificreports/
Scientific Reports | (2021) 11:13215 | https://doi.org/10.1038/s41598-021-92648-4 7
Vol.:(0123456789)www.nature.com/scientificreports/
Figure 4. Dominance and prevalence of the core TSM. (a) Bar chart representing the percent contribution of
the core microbiomes to their corresponding microbial communities. (b) Mean relative abundance (RA) of the
most dominant and prevalent TSM taxa. (c, d) Venn diagrams of the shared taxa of core TSM: respectively, (c)
tip core TSM, and (d) base core TSM.
Taxonomic comparison to previous studies. Taxonomically, the TSM showed some similarities but
also significant differences compared to the style microbiomes of other plants. Similar to a recent elegant study
involving apple styles9, we observed that Proteobacteria dominated the TSM, in particular the Enterobacteriaceae
(Fig. 1, Table 1). However, in apple styles, whereas the only other dominant family was the Pseudomonadaceae,
here the other dominant and consistent families included not only Pseudomonadaceae, but also Moraxellaceae,
Burkholderiaceae, Sphingomonadaceae, Xanthomonadaceae, Acetobacteraceae (Table 1, Supplementary Table S3).
Perhaps this difference is explained by the narrow sampling of the apple study (9 trees of one cultivar). In the
wild Hawaiian tree, Metrosideros polymorpha, the styles and stamens of 33 individual trees were dominated
by Enterobacteriaceae, Bradyrhizobiaceae, Staphylococcaceae, Micrococcaceae, Porphyromonadaceae, Rhodobac-
teraceae, and Sphingomonadaceae7, showing some overlap but also differences to the maize TSM. In wild mon-
keyflowers (Mimulus guttatus), the stamens and styles were dominated by OTUs from the Pseudomonadales
order, with core microbes including Acinetobacter, Pseudomonas, Bacteroides and Corynebacterium8. Cultured
epiphytic bacteria from pear styles were dominanted by Pseudomonas6. Unlike the maize TSM, a hallmark of
Scientific Reports | (2021) 11:13215 | https://doi.org/10.1038/s41598-021-92648-4 8
Vol:.(1234567890)www.nature.com/scientificreports/
Figure 5. Co-occurrence of core TSM in healthy and Fg-infected states. (a, b) Co-occurrence of core taxa
displaying calculated Spearman’s rank correlation coefficients in 2017 for (a) healthy base tissues and (b) Fg-
infected base tissues (also see Supplementary Fig. S13a–f).Taxa tagged by a red asterisk denote Fg-indicators in
silk base, 2017.
Scientific Reports | (2021) 11:13215 | https://doi.org/10.1038/s41598-021-92648-4 9
Vol.:(0123456789)www.nature.com/scientificreports/
Figure 6. TSM OTUs that significantly change in abundance after exposure to Fusarium graminearum
infection. (a–d) Heatmaps of OTUs (Fg-indicator taxa) that significantly changed in abundance upon Fg
infection (Log2 fold change of 16S read counts at p value ≥ 0.05) in (a) silk tip tissues (2016), (b) silk tip tissues
(2017), (c) silk base tissues (2016), and (d) silk base tissues (2017). X-axis represents samples of silk tissues.
Impacts of Fg infection on TSM predicted metabolic pathways. (e, f) Venn diagrams displaying year-to-year
sharing of predicted TSM metabolic pathways that significantly changed upon Fg infection of (e) silk tip tissues,
and (f) silk base tissues (see Supplementary Table S7 for pathway information, and Supplementary Fig. S16 for
extended error bars).
these previous s tudies7,9 is significant variation among samples of dominant microbes, even from a narrow host
genotype9, perhaps because the stigma and style tissues sampled were all exposed to the environment unlike this
current study.
Potential functions of the transmitting style microbiome. There may have been strong long-term
selection pressure on the TSM to increase host fitness by assisting the style to achieve successful fertilization
and to reduce its vulnerability to invading pests and pathogens, well known for maize silks. Interestingly, many
Scientific Reports | (2021) 11:13215 | https://doi.org/10.1038/s41598-021-92648-4 10
Vol:.(1234567890)www.nature.com/scientificreports/
of the top 50 dominant TSM genera (based on relative abundance, Supplementary Fig. S6, Table 1, Supple-
mentary Table S3a, b) were previously reported as biocontrol agents18,27–30 including those shown to have anti-
Fusarium activity via diverse biological mechanisms31,32 (elaborated below). Specific dominant TSM genera
(Bacillus, Paenibacillus, Serratia and Pseudomonas) are known to produce volatile compounds (e.g., 2,3-butan-
ediol) that elicit the host immune r esponse33,34. Some of the dominant TSM taxa were previously reported to
secrete insecticides [e.g., Bacillus (mainly B. thuringiensis), Paenibacillus, Serratia, Pseudomonas, Burkholderia,
Streptomyces] against a variety of pests including armyworms and corn rootworms35. In terms of abiotic stress,
silk growth is impeded by low nitrogen availability, perhaps explaining the surprising presence of many well-
known nitrogen-fixing genera including Rhizobium, Bradyrhizobium, Herbaspirillum, Azospirillum, Methylo-
bacterium, Bacillus, Paenibacillus, Brevundimonas, Massilia, Achromobacter, and Novosphingobium36. Similarly,
maize silk growth is highly susceptible to drought, and the top 50 genera in silks include those previously shown
to increase in abundance under drought in the roots of 19 grasses including maize (e.g. Stenotrophomonas,
Serratia, Achromobacter, Sphingobacterium, Streptomyces, Staphylococcus, Paenibacillus, and Bacillus)37. These
and other core genera (Pantoea, Sphingomonas, Burkholderia, Enterobacter, Azospirillum) have been shown to
promote drought tolerance in plants38–40. For example, mechanistically, Azospirillum has been shown to trigger
abscisic acid p roduction38, while Rhizobium upregulates trehalose-6-phosphate s ynthase39. It is also interesting
to speculate whether the dominant genera contribute to the extraordinarily rapid growth of silks, analogous
to root-stimulating rhizobacteria, as several of these (Pseudomonas, Serratia, Stenotrophomonas, Bacillus, Pae-
nibacillus, Rhizobium, Sphingomonas) synthesize growth phytohormones such as indole-3-acetic acid (IAA),
cytokinin, and/or gibberellins41. Other core taxa may be regulating the silk response to abiotic/biotic stress by
modulating ethylene levels41. Perhaps some of the well-known silk medicinal and phytochemical compounds
used by traditional societies including in silk teas13,42 are actually associated with the silk microbiome, alone or
interacting with the host, to serve some of the host-protective or ecological functions noted above. Finally, it will
be interesting to test whether members of the TSM assist or interfere in reproduction directly, perhaps as a ves-
tige of early plant evolution. For example, some silk taxa produce compounds known to be required for pollen
tube attraction to the embryo sac, including gamma-aminobutyric acid (GABA) (Lactobacillus, Lactococcus)43,
or they may secrete enzymes implicated in pollen grain penetration into the silk (e.g. xylanase by Pantoea)44,
or polypeptides with β-expansin activity needed for stigma penetration and pollen tube growth to the egg sac
(e.g., Bacillus, Streptococcus, Streptomyces, Staphylococcus, Enterococcus, Lactobacillus, Lactococcus, Clostridium,
E. coli, Pseudomonas and Flavobacterium)45.
Interaction between the TSM and Fusarium pathogen. Fusarium graminearum silk infection
resulted in a dramatic reduction in TSM diversity (Table 1, Supplementary Table S3a, b) but also a doubling
in total 16S read counts (Supplementary Table S2). This is contradictory to apples, where exposure of stigma/
style tissue to the pathogen Erwinia amylovora resulted in a shift in the microbiome composition, but no sig-
nificant effect on microbiome community diversity compared to the water c ontrol9. There are several possible
reasons for the diversity loss observed here. First, Fg may be competing for specific nutrients. Second, Fg-derived
mycotoxins/antibiotics may be killing specific classes of bacteria or disrupting bacterial cell–cell communication
(Quorum Sensing) responsible for n etworking46,47. Indeed, upon Fg infection, there was an observable reduc-
tion in the co-occurrence of core TSM members (i.e. disruption of the core network) (Fig. 5, Supplementary
Fig. S13). Third, silk cells may be emitting damaging reactive oxygen species during the host defence response
which some bacterial taxa are sensitive to. Finally, perhaps the rare taxa provide a diverse genetic repertoire to
improve host fitness under different environmental stresses48, but upon artificial Fusarium infection only a core
protective microbiome is amplified (Fig. 6a–d, Supplementary Fig. S15). In fact, 7 taxa were consistently and
significantly responsible for the increased abundance upon infection (indicator taxa), including members of the
core microbiomes (Fig. 4c, d). We previously showed that an Enterobacter sp. could suppress Fg when sprayed
onto silk tips20, consistent with the finding here that Enterobacteriaceae species (OTU2, OTU3, OTU4) consist-
ently increased in abundance upon Fg attack in silk t ips20. Similarly, several of these taxa have previously been
reported to suppress Fusarium species including: Pseudomonas (OTU50)30; Pantoea (OTU25, the most prevalent
and abundant TSM taxa, which significantly increased in abundance in 2017) that was previously shown to
exhibit anti-Fusarium activity through a variety of mechanisms including chitinolytic activity and regulation of
Fusarium virulence/cell division g enes32, 49–51; and Delftia (OTU8) that has previously been reported to antago-
nize diverse fungal p athogens52. In apple, where abundance of an Erwinia pathogen was carefully quantified, no
strong correlation was observed between individual silk/style microbiome OTUs and Erwinia titre, leading them
to hypothesize that the microbiome regulated pathogen activity rather than its abundance, though the study suf-
fered from significant sample variation9.
It is noteworthy that of the Fg-responsive taxa, Sphingomonas, Pseudomonas sp., Acinetobacter sp., Delftia,
and Stenotrophomonas also naturally dominate the human female reproductive tract1 which serves an analo-
gous reproductive function as silks and are similarly invaded by fungal pathogens. Interestingly, Sphingomonas
(OTU35) consistently co-occurred across infected and healthy samples, with multiple taxa indicating it as a
microbiome-hub in a consortium with Pseudomonas, Acinetobacter and Stenotrophomonas (as well as Pantoea,
Rhizobium, Pedobacter, and other members of the Enterobacteriaceae family) (Fig. 5a, b; Supplementary Fig. S13).
All these co-occurring taxa were previously reported individually to antagonize Fusarium53–59. Of note, various
anti-Fg strains have additive or synergistic effects, as suggested by previous studies60. Others function by bio-
degrading and detoxifying Fusarium mycotoxins: for example, Sphingomonas and fluorescent Pseudomonads
decrease deoxynivalenol (DON) mycotoxin58,61, while a Lactococcus sp. has been shown to detoxify zearalenone
(ZEA) mycotoxin in cereal c rops62. Alternatively, some of the Fg-indicator taxa may be inducing host defence,
work as part of a consortium, or otherwise directly protect the silk host tissue.
Scientific Reports | (2021) 11:13215 | https://doi.org/10.1038/s41598-021-92648-4 11
Vol.:(0123456789)www.nature.com/scientificreports/
Metabolic pathway predictions suggested that Fg infection resulted in significant loss of TSM functionality,
including antibiotic biosynthesis pathways and nutrient recycling pathways (Supplementary Fig. S16; Supple-
mentary Table S7). It may be that Fg-induced dysbiosis depletes the genetic repertoire encoded by the TSM,
especially activities not beneficial during fungal pathogen attack (e.g. antibiotic synthesis)48, 63. This result is
consistent with the dramatic loss in rare TSM taxa following Fg inoculation.
One limitation of this study was that Agral surfactant was added to the Fusarium treatment but not the
control treatment, to help Fusarium spores attach to the silks; we cannot rule out Agral also affected the TSM.
However, the Fusarium formulation was applied only to the exposed silks, whereas the collected silk tissues were
distal (husk leaf-protected), so, the sampled tissues used for the microbiome study were not directly exposed to
Agral. Furthermore, all plants were watered every 8–10 min through installed misting systems during the entire
experiment, and thus the Agral was likely washed out immediately.
Year to year variation in the TSM. The anthesis silk interval (ASI)—the difference in timing between
silk emergence and pollen shed (synchronization)—critically impacts the success of fertilization and hence grain
yield in corn11. Silk emergence is limited by environmental stress including water and nitrogen limitation64.
In addition, climatic variability impacts the ASI, potentially causing dramatic reductions in yield64. Here, the
recorded fluctuation in climatic conditions across the two years of field trials (Supplementary Figs. S1, S2) was
associated with a significant year-to-year shift in the TSM of the silk tip, most likely attributable to shifts of the
non-overlapping taxa (Fig. 3a–d; Supplementary Fig. S7a–l, Supplementary Table S5a). These results suggest
that the external environment can impact the TSM (Supplementary Table S5a). The impact of seasonality on
the stigma/style microbiome was not examined in previous studies in other p lants7–9, however in apples, it was
shown that time after petal opening (and hence presumably environmental exposure) reduced stigma microbi-
ome diversity9. In the current study, there were year-to-year differences in candidate anti-Fg taxa that increased
in abundance upon Fg-infection (Fig. 6a–d, Supplementary Table S7). Fg disease severity (gibberella ear rot) and
DON mycotoxin levels in corn are well known to vary annually, and it has been very difficult to develop predic-
tive models65. Human/livestock health episodes have been associated with Fg-derived mycotoxins66. This is the
first study to suggest that year-to-year fluctuation of the TSM may be a contributing factor to this global threat
to human/livestock health, food security and farmer livelihoods. Testing this hypothesis is particularly urgent
given climate change.
Summary and future perspectives. In plant reproduction, healthy style tissue at the pollen nuclei trans-
mission stage is critical for successful fertilization5. The style microbiome in the world’s most important cereal
crops was not previously reported. Given its inherent advantages compared to many other plants, this study
establishes the maize silk as a model for fundamental and applied research of plant reproductive microbiomes
including from cereals. The study demonstrates that healthy transmitting maize silks possess thousands of bacte-
rial taxa, which we termed the transmitting silk microbiome (TSM). The TSM is dominated by a small but abun-
dant core microbiome that is prevalent across diverse host genotypes (heterotic groups) in modern maize. Maize
silks at the transmission stage are susceptible to pathogen invasion including from Fusarium graminearum (Fg).
Despite huge investments made over decades to combat Fg in maize globally, it remains a billion-dollar problem
during outbreak years. Here, Fg infection was associated with a dramatic decrease in TSM microbial diversity
and perturbed predicted metabolic functionality, but surprisingly a doubling of total TSM read counts, primarily
by elevating much of the core microbiome (7–25 MiSeq-ASVs), suggestive of a selective microbiome response
against Fusarium. Since the core microbiome dominated read counts, and the rarer taxa varied significantly
across samples (sample dispersion), statistically, Fg invasion was not associated with a significant change in TSM
community composition, but this masked the actual drama in the microbiome. Future studies are needed to
understand whether the elevated TSM taxa are protecting themselves, their host tissues, and/or directly combat-
ing Fusarium and its mycotoxins. Given that Fg associated disease severity is known to vary year to year, it is
noteworthy that the TSM in silk tips showed significant yearly variation under field conditions. If it is protective,
the seasonally dynamic silk microbiome may be part of the problem and solution.
Moving forward, the identification of the healthy TSM and/or a consortium of candidate anti-Fg taxa should
be considered as targets for direct selection in maize breeding programs using taxa-specific molecular markers—
a novel approach to disease resistance breeding in crops. Such a strategy could also be explored in SubSaharan
Africa where silk invading fungal pathogens such as Fusarium and Aspergillus are major sources of human
carcinogens67. In temperate regions, DON mycotoxin has been shown to disrupt human and livestock gut micro-
biomes, in part explaining its gastro-intestinal impacts and its nickname vomitoxin4. Given the results of this
study, it is interesting to hypothesize whether the DON antibiosis effect in humans/animals is the indirect byprod-
uct of Fg co-evolving in an arms race with the defensive microbiome of its native plant habitat (e.g. silks). Finally,
given the silks in this experiment were open-pollinated, it will be interesting to explore the relative maternal and
paternal contributions to the TSM. These and many other fundamental and applied questions now arise that
should be explored about the functionality and origin of the TSM as well as the style microbiomes of other plants.
Methods
Field experimental design. A total of 14 corn genotypes were included in this study: eleven were Agri-
culture and Agri-Food Canada (AAFC) maize inbred lines, provided by Dr. Lana Reid along with 3 commercial
hybrids to add relevance to the study (Supplementary Table S1). These genotypes represent a diversity of heter-
otic groups in modern maize and have a diversity of resistance to F. graminearum (Fg, Supplementary Table S1).
Seeds were grown in the summer of 2016 and 2017 in a completely randomized, split-block design with three
replicate blocks, at Ridgetown Station, University of Guelph, Canada. Each open-pollinated block consisted of
Scientific Reports | (2021) 11:13215 | https://doi.org/10.1038/s41598-021-92648-4 12
Vol:.(1234567890)www.nature.com/scientificreports/
2 rows with guard row(s) surrounding all the blocks. Each row had all the genotypes (each 2 m long, with 20
seeds, followed by a small space); in the adjacent paired row, the genotypes were randomized, and hence each
genotype had duplicate plots. One of the plots was treated with Fg, while the other was the control. No one row
was dedicated to the Fg or control treatments; rather they were randomized across the paired rows within each
block, and randomized again between blocks. For each genotype and for each of the 3 blocks, per plot, up to
16 plants (minus the outer 2 plants at each edge) were treated with Fg, while 16 in the adjacent row acted as the
control (not sprayed). Pure Fusarium inoculum was applied after silk emergence when the silks of the primary
ear presented the first visual signs of senescence (faint brown color) (Supplementary Figs. S1, S2). Approximately
2 ml of Fg inoculum (20,000 spores/ml) was sprayed directly onto the silks from a bottle held at roughly a 3 cm
distance. The inoculation date varied between blocks based on this silk maturity criterion, but ranged from
August 15–18 in 2016, and August 11–14 in 2017. Each cob was inoculated with Fg twice over 24–48 h. Plots
were irrigated using overhead misting prior to and after inoculation until harvest (an automated cycle of 30 s
on, and 8–10 min off, from 10:00 to 18:00 h). The system was operated at 206 kPa, and the nozzles delivered
approximately 0.6 L/min of water. Harvesting occurred on August 25 in 2016, and August 21 in 2017. For silk
sampling, 3 cobs from each plot (3 separate plants) were chosen randomly that were also representative of the
average cob size for that plot. In the lab, under sterile conditions, silks from all 3 cobs per plot were pooled and
frozen at − 80 °C for later DNA isolation (see Tissue harvesting and DNA isolation, below). The weather infor-
mation was obtained from the official website of Government of Canada, Environment and Natural Resources
(https://weather.gc.ca/) (Supplementary Figs. S1, S2).
Fusarium spore isolation and inoculum preparation. Three local Fg isolates were used to prepare
pure inoculum under in vitro sterile conditions: one isolate from infected corn and two from wheat from South-
ern Ontario, Canada . All three isolates produced clear disease symptoms in their respective hosts during the
previous growing season. The Fg strains were purified via serial subculturing on PDA agar plates. First, the
seeds were surface-sterilized, then plated for several days. The leading edge of the fungal growth was picked
for culturing on fresh PDA agar plates. The spores were then harvested, and diluted until single spores could
be resolved on water agar. For further purification, single spores were picked and plated individually on fresh
PDA agar plates as a pure culture per spore. To confirm the purity of spores prior to the inoculum preparation,
they were microscopically identified, then small cubes were aseptically cut from the plates and used to inoculate
flasks of autoclaved spore broth (modified Bilay’s medium)68 then incubated for 3–5 days at 25 °C under shaking.
The fungal spores from each flask were visualized under the microscope and counted using a hemocytometer
to check the purity and to adjust the spore suspension concentration. To prepare the final cocktail of Fg spores,
each of the three adjusted spore suspensions was combined equally to produce a final suspension concentration
of 20,000 spores/ml, then 1.0% v/v Agral ® 90 (Syngenta Canada Inc.) was added as a surfactant.
Tissue harvesting and DNA isolation. For every single replicate, three ears were harvested from each
subplot in the summer season (Supplementary Fig. S1). The exposed silk tissues were removed from each cob
and the length of each ear was measured to be cut into three equal portions (Fig. 1c). Then the silk tip (front
portion) tissues were pooled separately from the silk base tissues (back portion), and each was consolidated
in a single Petri dish and marked with a unique sample ID. All samples were stored at − 80 °C for DNA isola-
tion. Qiagen DNeasy Plant Mini Kit was used for DNA extraction from silk tips (100 mg of tissue according
to the kit protocol), whereas a CTAB protocol (see Supplementary Information) was used for silk base tissues
(300 mg), because the yield from the Qiagen kit from base tissues was insufficient for high throughput 16S rRNA
sequencing69. Then, DNA samples were quantified using a Qubit v1.2 fluorometer.
16S rRNA amplicon sequencing using MiSeq technology and sequences analysis. DNA sam-
ples were submitted to Metagenom Bio Inc. (Waterloo, Canada) for high throughput 16S amplicon sequenc-
ing using the Illumina MiSeq platform. Hypervariable region V4 of 16S rRNA genes were amplified using the
barcoded primer sets, 515FB: GTGYCAGCMGCCGCGGTAA, 806RB: GGACTACNVGGGTWTCTAAT70. PCR was
conducted in triplicate for each sample (25 μl each). Each reaction mixture contained 2.5 μl of 10 × standard Taq
buffer (New England Biolabs), 0.5 μl of 10 mM dNTP, 5 μl of 1 μM forward primer, 5 μl of 1 μM reverse primer,
1 μl of 25 μM pPNA, 1 μl of 25 μM m PNA71 (PNA Bio Inc, Newbury Park, CA), 2 μl DNA, 0.2 μl of BSA (20 mg/
ml), 0.2 μl of Taq DNA polymerase (5 units/μl, NEB) and 7.6 μl of PCR water. DNA was denatured at 95 °C for
5 min, followed by 35 cycles of 95 °C for 30 s, 50 °C for 30 s and 72 °C for 50 s, and then extended at 72 °C for
10 min. Each PCR product representing a correct-size amplicon was gel purified on 2% TAE agarose, quantified
using the Qubit dsDNA HS Assay Kit (Thermo Fisher Scientific Inc.), then the 3 technical replicates were pooled
in equimolar amounts. Then, the library DNA was sequenced with a MiSeq Reagent Kit v2 (2 × 250 cycles) and
FASTQ files were generated for taxonomic analysis.
Bioinformatic analysis. Generated MiSeq raw reads were assigned to their original samples and quality-
controlled using Quantitative Insights Into Microbial Ecology Qiime2 core-2019.10 (https://docs.qiime2.org/
2019.10/)72 with plugins demux (https://github.com/qiime2/q2-demux) for demultiplexing and D ADA273 to
denoise and dereplicate paired-end sequences. Given the use of 2 different DNA extraction protocols, sequences
were filtered at different quality scores; QS30 for silk tip sequences and QS25 for silk base sequences. To gener-
ate taxonomy tables, the taxonomic assignment was performed using a Naive Bayesian Classifier trained against
SILVA-v132 (https://www.arb-silva.de/documentation/release-132/). Representative sequences were aligned
and phylogenetic trees were generated using plugins alignment (MAFFT program)74 and phylogeny (FastTree)75,
Scientific Reports | (2021) 11:13215 | https://doi.org/10.1038/s41598-021-92648-4 13
Vol.:(0123456789)www.nature.com/scientificreports/
respectively. Data files were exported in QIIME2 and consolidated into a standard format (biom-format)76, then
uploaded as a phyloseq object in R for further microbiome analysis and visualization.
Phyloseq (v.1.22.3), metacoder (0.2.1.9005), vegan (v.2.5-2), ggplot2 (v.3.0), and VennDiagram R packages77–81
were used for exploring the maize silk microbiome, and visualizing the core microbiome identified at a 50%
prevalence threshold. Diversity analyses (alpha and beta diversity indices) were calculated in Qiime2 platform
using the qiime diversity core-metrics-phylogenetic plugin. Principle coordinate analysis (PCoA) was applied
on Bray–Curtis and UniFrac distance matrices to visualize the impact of seasonality along with Fg-infection on
the dynamics of the transmitting silk microbiome.
Identification of indicator taxa. Taxa that significantly increased in their read counts upon Fg treat-
ment were estimated along with the corresponding log2 fold change (log2 FC) in their abundance and adjusted
p-values (significance level, p < 0.05) for multiple testing using the DESeq2 (v.1.18.1) R package82. Taxa with less
than a total of 10 counts were excluded from the analysis. Estimations were computed for each tissue silk loca-
tion in each year, separately. The default multiple inference correction, the Benjamini–Hochberg method, was
used; the false discovery rate (FDR) was set to 0.015, and heatmaps of log2 (count + 1) of estimated indicator taxa
were constructed and visualized as in Fig. 6a–d. Independently, to confirm the results, the supervised machine
learning method in the Qiime2-2019.10 pipeline was used to estimate the top 20 significantly discriminative
features between healthy and Fg-infected samples (the most important features of the silk microbiome that
changed significantly in abundance upon treatment with Fusarium spores). Generated heatmaps of the top 20
discriminative features (OTUs) were displayed (Supplementary Fig. S15).
Correlation patterns of either healthy or Fg‑infected core microbiome. Co-occurrence patterns
of the identified core microbiome at a 50% prevalence threshold for each silk tissue location according to fungal
pathogen treatment were estimated using the microbiome R package (v.1.0.2)83, based on Spearman’s rank cor-
relation with an adjusted p value threshold of < 0.05. The computed correlation coefficients were visualized using
the GGally R package (v.1.4.0)84 as illustrated in Fig. 5, and Supplementary Fig. S13.
Functional inferences of 16S rRNA gene sequences. For metabolic profile prediction of the TSM
upon Fg treatment, the q2-picrust2 p lugin24 was used through the Qiime2-2019.10 pipeline. PICRUSt2 is a bio-
informatic tool used for metagenome inferences from the taxonomic profile of a microbial community to predict
its functional composition. The algorithm first aligns amplicon sequence variant (ASV) sequences with the refer-
ence 16S rRNA gene sequences using HMMER, then the aligned sequences are placed into a reference phyloge-
netic tree (generated from reference 16S sequences from the Integrated Microbial Genomes (IMG) database).
This phylogenetic tree is used to predict genomes and infer traits for each unknown ASV. In the q2-picrust2
plugin, the output comprises three Qiime2 artifacts: ec_metagenome.qza (predictions of enzyme commission
metagenome), ko_metagenome.qza (predictions of KEGG orthology), and pathway_abundance.qza (predic-
tions of MetaCyc pathway abundance)85. Generated pathways and their corresponding values (copy numbers)
for healthy and diseased tissues of each sample group across 2016 and 2017 (tip and base) were analyzed using
Statistical Analysis of Metagenomic Profiles (STAMP) software25. Analysis was performed using: two-group
analysis (healthy versus Fg-infected samples), two-sided, White’s non-parametric t-test (statistical hypothesis
test), Bonferroni (multiple test correction method), DP: bootstrap (confidence interval method) along with
a q-value filter > 0.05, effect size filter (ratio of proportions) < 1, and 95% confidence interval. Extended error
bar plots were used to indicate significantly affected metabolic pathways. Overlaps across identified predicted
metabolic pathways in both 2016 and 2017 for each silk tissue location (tip and base) were visualized using a
Venn-diagram created using the VennDiagram R package. All calculated metabolic pathways were listed in Sup-
plementary Table S7, including their detailed descriptions.
Statistical analysis. For the mean relative abundance calculations, they were estimated by calculating the
relative abundance of a taxon at a specific taxonomic level in each sample, then by calculating the mean relative
abundance of that taxon across samples within the same group (Figs. 1d, 4b, Supplementary Fig. S9). For esti-
mating taxa at each taxonomic level (5 levels from the phylum to genus level) that significantly changed in abun-
dance upon Fg infection, feature tables with taxonomy of each sample group were collapsed in Qiime2-2019.10
using the qiime taxa collapse function, then uploaded along with their corresponding metadata files in STAMP
for statistical analyses using a two-group analysis (healthy versus Fg infected samples), two-sided, White’s non-
parametric t-test (statistical hypothesis test), Benjamini-Hochberg (multiple test correction method), DP: boot-
strap (confidence interval method) along with a q-value filter > 0.05, effect size filter (difference between pro-
portions) < 1, and 95% confidence interval. Extended error bar plots (Supplementary Fig. S10) were used to
display the taxa that significantly changed upon Fg infection. For alpha diversity analyses, estimation of richness
(observed OTUs), diversity (Shannon), evenness (Pielou), and Faith’s Phylogenetic Diversity (FPD) metrics/
indices were performed on OTU-tables, and Wilcoxon/Kruskal–Wallis tests were used at p value < 0.05. Esti-
mates are available in Supplementary Table S4. For beta diversity analyses, data were normalized using a rarefy-
ing method (even sampling depth) for each tested group as illustrated in Supplementary Table S5 to estimate
the variation in TSM composition across groups of samples. In the Qiime2-2019.10 platform, a permutational
multivariate analysis of variance (PERMANOVA) test was applied to Bray–Curtis, unweighted UniFrac and
weighted UniFrac distance matrices with 999 permutations, and the results were confirmed by testing for homo-
geneity of dispersions through a PERMDISP test. For statistical significance testing, p values of < 0.05 were con-
sidered significant. To visualize how similar or dissimilar the samples (healthy vs Fg-infected) were, 2D Principal
Coordinate (PCoA) plots were generated from the calculated matrices. Additional ordination plots were con-
Scientific Reports | (2021) 11:13215 | https://doi.org/10.1038/s41598-021-92648-4 14
Vol:.(1234567890)You can also read


