SOLID: A SHORT BASELINE REACTOR NEUTRINO EXPERIMENT
←
→
Page content transcription
If your browser does not render page correctly, please read the page content below
Prepared for submission to JINST

                                                   SoLid: A short baseline reactor neutrino experiment

                                                   The SoLid Collaboration
                                                   Y. Abreu,a Y. Amhis,i L. Arnold,b G. Barber,g W. Beaumont,a S. Binet,n I. Bolognino,h
                                                   M. Bongrand,i J. Borg,g D. Boursette,i V. Buridon,d B. C. Castle, j H. Chanal,n K. Clark,b
                                                   B. Coupé,k P. Crochet,n D. Cussans,b A. De Roeck,a,e D. Durand,d T. Durkin,l M. Fallot,h
                                                   L. Ghys,k L. Giot,h K. Graves,g B. Guillon,d D. Henaff,h B. Hosseini,g S. Jenzer,i
arXiv:2002.05914v2 [physics.ins-det] 30 Mar 2020

                                                   S. Kalcheva,k L.N. Kalousis,c M. Labare, f G. Lehaut,d S. Manley,b L. Manzanillas,i
                                                   J. Mermans,k I. Michiels, f S. Monteil,n C. Moortgat, f ,k D. Newbold,b,l V. Pestel,d
                                                   K. Petridis,b I. Piñera,a L. Popescu,k N. Roy,i D. Ryckbosch, f N. Ryder, j D. Saunders,g
                                                   M.-H. Schune,i M. Settimo,h H. Rejeb Sfar,a L. Simard,i,m A. Vacheret,g
                                                   G. Vandierendonck, f S. Van Dyck,k P. Van Mulders,c N. van Remortel,a S. Vercaemer,a,c
                                                   M. Verstraeten,a B. Viaud,h A. Weber j,l and F. Yermia.h
                                                   a
                                                      Universiteit Antwerpen, Antwerpen, Belgium
                                                   b
                                                      University of Bristol, Bristol, UK
                                                   c
                                                      Vrije Universiteit Brussel, Brussel, Belgium
                                                   d
                                                      Normandie Univ, ENSICAEN, UNICAEN, CNRS/IN2P3, LPC Caen, 14000 Caen, France
                                                   e
                                                      CERN, 1211 Geneva 23, Switzerland
                                                   f
                                                      Universiteit Gent, Gent, Belgium
                                                   g
                                                      Imperial College London, Department of Physics, London, United Kingdom
                                                   h
                                                      SUBATECH, CNRS/IN2P3, Université de Nantes, Ecole des Mines de Nantes, Nantes, France
                                                    i
                                                      LAL, Univ Paris-Sud, CNRS/IN2P3, Université Paris-Saclay, Orsay, France
                                                    j
                                                      University of Oxford, Oxford, UK
                                                   k
                                                      SCK-CEN, Belgian Nuclear Research Centre, Mol, Belgium
                                                    l
                                                      STFC, Rutherford Appleton Laboratory, Harwell Oxford, and Daresbury Laboratory, Warrington, United
                                                      Kingdom
                                                   m
                                                      Institut Universitaire de France, F-75005 Paris, France
                                                   n
                                                      Université Clermont Auvergne, CNRS/IN2P3, LPC, Clermont-Ferrand, France
                                                       E-mail: nick.vanremortel@uantwerpen.be, guillon@in2p3.fr

                                                   Abstract: The SoLid experiment, short for Search for Oscillations with a Lithium 6 detector,
                                                   is a new generation neutrino experiment which addresses the key challenges for high precision
                                                   reactor neutrino measurements at very short distances and with little or no overburden. The
                                                   primary goal of the SoLid experiment is to search for very short distance neutrino oscillations
                                                   as a probe of eV-scale sterile neutrinos. This paper describes the SoLid detection principle, the
                                                   mechanical design and the construction of the detector. It then reports on the installation and
                                                   commissioning on site near the BR2 reactor, Belgium, and finally highlights its performance in
                                                   terms of detector response and calibration.
                                                   Keywords: Neutrino detectors; Calorimeters; Neutron detectors (cold, thermal, fast neutrons);
                                                   Particle identification methods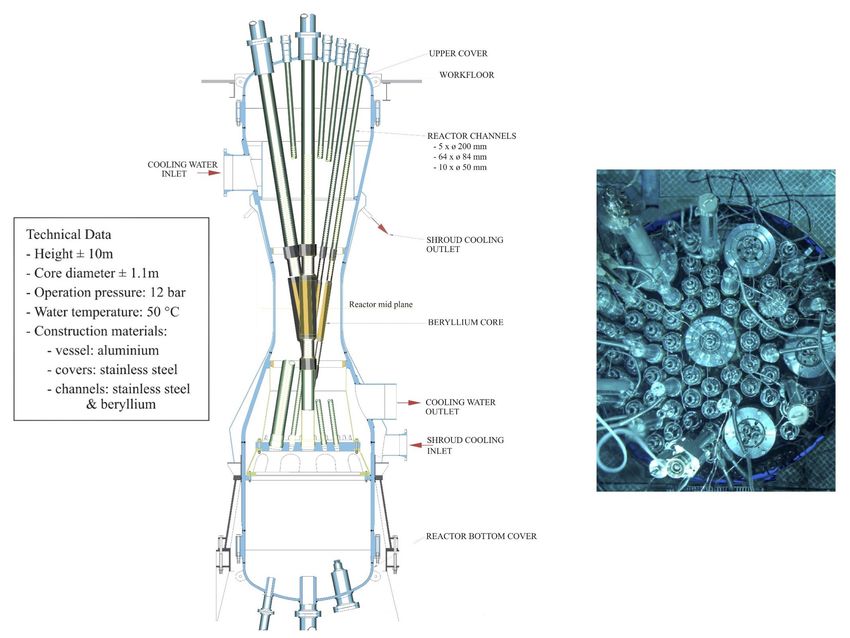
Contents

1 Introduction                                         2

2 Detector layout and design                            2
  2.1 Detection principle                               2
  2.2 Mechanical design                                 3
  2.3 Detector construction                             6
  2.4 Quality assurance                                 7
  2.5 Container integration                             8
  2.6 CROSS calibration system                          9

3 Data Acquisition system                              10
  3.1 Readout system design                            10
  3.2 Online triggers and data reduction               12

4 The BR2 reactor at SCK⋅CEN                           13
  4.1 The BR2 reactor                                  13
  4.2 Detector integration on site                     14
  4.3 Neutrino flux modeling                           16
  4.4 Backgrounds                                      17

5 Detector operation and data monitoring               19
  5.1 Channel characterization and equalization        19
  5.2 Detector operation and data quality monitoring   20

6 Simulation                                           22
  6.1 Geant4 model                                     22
  6.2 Readout simulation                               24

7 Data taking and calibration                          25
  7.1 Neutron calibration                              25
  7.2 Energy scale                                     27

8 Conclusion                                           29

9 Acknowledgements                                     30

                                           –1–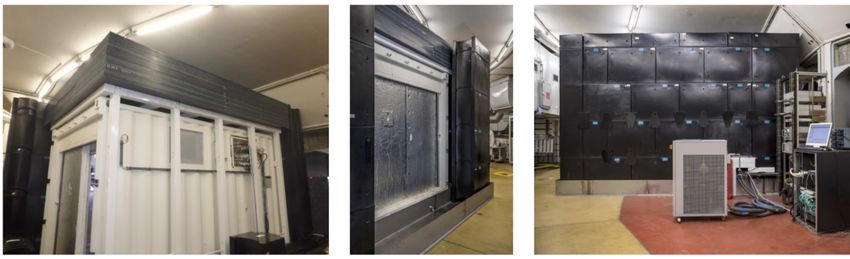
1     Introduction

SoLid, or Search for oscillations with a Lithium 6 detector, is a very short baseline neutrino os-
cillation experiment, located near the BR2 reactor of the SCK CEN in Belgium. Its main purpose
                                                               ⋅
is to perform a precise measurement of the electron antineutrino energy spectrum and flux as a
function of the distance travelled by antineutrinos between the reactor core and their interaction
in the detector. These measurements will be primarily used to search for the existence of one or
more sterile neutrinos corresponding to mass eigenstates of order ∆m2 ∼ 1 eV2 . Secondarily, the
shape of the energy spectrum will serve as a reference measurement for electron antineutrinos
originating from the fission of 235 U. In order to achieve these goals, the SoLid experiment aims to
detect electron antineutrinos
                  √            with an average efficiency of 30%, reconstruct their energy with a
resolution of 14%/ E(MeV), and obtain an overall Signal to Background ratio (S/B) of order unity.

      Operating very close to the reactor core and at sea level, where large cosmic and reactor
backgrounds are produced, combined with small installation spaces, represents new challenges
in terms of background rejection capabilities. Compared to the contemporary very-short baseline
neutrino experiments near reactors [1–5], the SoLid detector has some unique features, which are
described extensively in [6]. It uses a finely 3D segmented plastic scintillator, combined with scin-
tillation screens that contain 6 Li. The high segmentation and the pulse shape discrimination allow
to actively identify and reduce all categories of background, limiting the need for large passive
shielding. Moreover, the materials used, the robustness and compactness are also attractive for
future reactor monitoring applications.

     After demonstrating the applicability of the composite scintillator technology, a full-scale
prototype module, SM1, with a fiducial mass of 288 kg was operated near the BR2 reactor in 2015.
Based on the performance of the prototype module [7], improvements were made to the original
detector design before proceeding to the construction of a 1.6 ton detector in 2016-2017. The
SoLid detector installation was completed in February 2018 and was successfully commissioned
near the BR2 reactor in spring 2018. In this paper, we will first give a complete description of
the SoLid detector: its detection principle, its mechanical design, the construction phase and the
quality assurance process. We will then describe the dedicated front-end electronics and the data
acquisition system. In the third part, we will present the BR2 reactor core near which the SoLid
experiment operates. Finally, we will present the data taking operation and describe how the
detector response is simulated and how the experiment is calibrated in-situ.

2     Detector layout and design

2.1    Detection principle
The SoLid detector is designed to be a highly 3D segmented detector (8000 voxels/m3 ) based on a
dual scintillation technology. Electron antineutrinos will interact primarily in the active detector
volume via inverse beta decay (IBD) on hydrogen nuclei, producing a positron and a neutron in
the final state: ν̄e + p → e+ + n. Experimental approaches use the coincidence technique, which
consists of detecting both the positron and the neutron, within a short time window, typically up

                                               –2–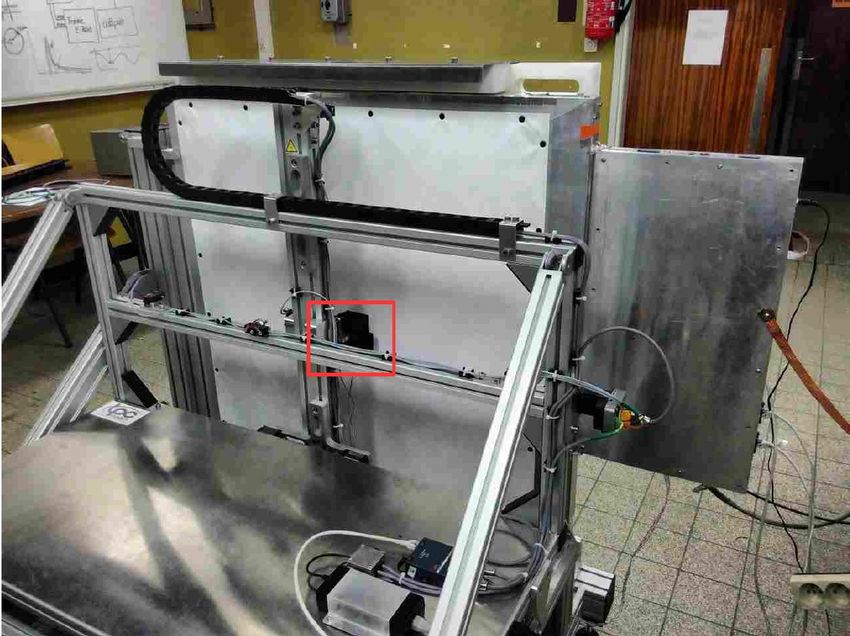
to hundreds of microseconds [8]. The neutron generally thermalizes via elastic collisions in the
detector, after which it can be captured by nuclei with a high neutron capture cross section. As
such it typically induces a scintillation signal that is delayed in time with respect to the scintil-
lation light caused by the positron and its corresponding annihilation gamma-ray photons. The
time delay between the two signals can be tuned by the choice of neutron capture elements and
their concentration and distribution in the detector. Neutrino oscillation experiments typically
vary in their choice of scintillator, the neutron capture element, and the way these are incorpo-
rated in the scintillator.

     SoLid opted for a combination of two scintillators. One is polyvinyl toluene (PVT), a relatively
cheap plastic scintillator that is generally easy to machine in any desired shape or geometry, and
the other is ZnS(Ag) used together with 6 LiF to capture thermal neutrons via the reaction:

                                   3 Li + n   → 31 H + α (4.78 MeV),                            (2.1)
                                   6

for which the decay products in turn induce scintillation in the ZnS(Ag) scintillator. The PVT-
based scintillator is of the type EJ-200 produced by ELJEN Technology. It is a general purpose
plastic scintillator that emits on average 10 000 photons per MeV of energy deposited by elec-
trons of 1 MeV in the blue-violet wavelength band with a peak emission wavelength of 425 nm.
The choice of PVT is mainly motivated by its good light yield and its linear energy response
over a wide range of energies ranging from 100 keV to several MeV. It combines a long optical
attenuation length with a scintillation pulse decay time of 2.1 ns. The 6 LiF:ZnS(Ag) scintillator
for neutron detection is produced by SCINTACOR, in the form of thin screens. These so-called
neutron detection screens, emit photons at a peak emission wavelength of 450 nm. The nature of
the neutron capture reaction and the longer scintillation decay time of 10 microseconds for the
6
  LiF:ZnS(Ag) scintillator allows for a pulse shape discrimination between signals induced in the
neutron detection screens via nuclear interaction, hereafter denoted as NS, and signals induced
via electromagnetic processes in the PVT, denoted as ES.

     The detection technology, the materials and the geometrical arrangement of the main com-
ponents of the SoLid detector are the same as for the SM1 prototype and are outlined in an earlier
paper [7]. Based on the performance of this full-scale prototype and on studies with a dedicated
test bench, described in [9], several design improvements were made to optimize the uniformity
of the detector response and to maximise the light collection efficiency. These improvements are
outlined below.

2.2     Mechanical design
2.2.1    Detection cell
The basic detection cell consists of a 5x5x5 cm3 PVT cube, of which two faces are covered with
neutron detection screens. Positrons with an energy of 10 MeV travel less than 48 mm in PVT,
which implies that the majority of the IBD positrons will be stopped in the same cell as in which
they are produced. In order to extract the scintillation photons produced in the PVT or in the
neutron detection screens, 4 grooves with a 5×5 mm2 square cross section are machined in four

                                                  –3–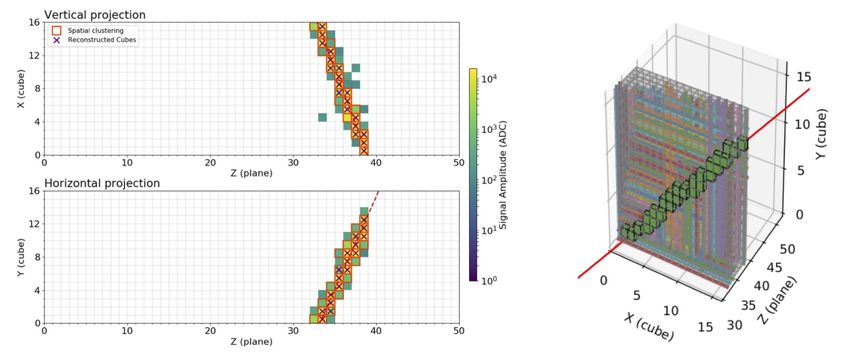
different faces of each cube. Each groove accommodates an optical fibre with a square cross
section of 3×3 mm2 that guides the light to an optical sensor at the edge of the detector. All
detection cells are optically isolated via a DuPont Tyvek wrapping of type 1082D, whose thickness
has been increased from 205 to 270 µm to reduce the optical transparency.

Figure 1: (Left) A schematic view of the PVT detection cell, including the two neutron detection screens
and its Tyvek wrapping. All cells are arranged such that the face labeled as "plain Li" (dark blue) faces the
BR2 reactor. (Right) Four wavelength shifting fibres cross each detection cell, with alternating positions of
MPPCs and mirrors. Dimensions are in mm.

     The neutron detection screens are cut into squares of 5×5 cm2 and positioned, using no glues
or optical gels, on two adjacent faces of the PVT cube. The two cube faces that are covered with
neutron detection screens are the one that faces the reactor core, perpendicular to the Z-axis, and
the one that is perpendicular to the X-axis, facing the electronic readout boxes that are mounted
on one detector side. A schematic view of a detection cell together with the coordinate system and
the position of the neutron detection screens is shown in Fig. 1. The scintillation light produced in
the neutron detection screens is optically coupled to the PVT cube via the air trapped in between
the two surfaces. The bulk of the neutron detection screens have a 225 µm thick MELINEX-339
reflective backing. The addition of this backing on the neutron detection screens with respect to
the prototype module, combined with the overall improved light detection in the cells increases
the amplitude of the NS signals and improves the NS-ES waveform discrimination. By doubling
the amount of neutron detection screens per cell, the capture efficiency for thermal neutrons in
the SoLid detector is increased by a factor 1.3 and the capture time is reduced from 102 to 65
microseconds, compared to the SM1 prototype [7].

2.2.2   Light collection
The scintillation photons produced in each detection cell are extracted and guided by 92 cm long
double clad wavelength shifting fibres, of type BCF-91A, produced by St.Gobain. One end of

                                                   –4–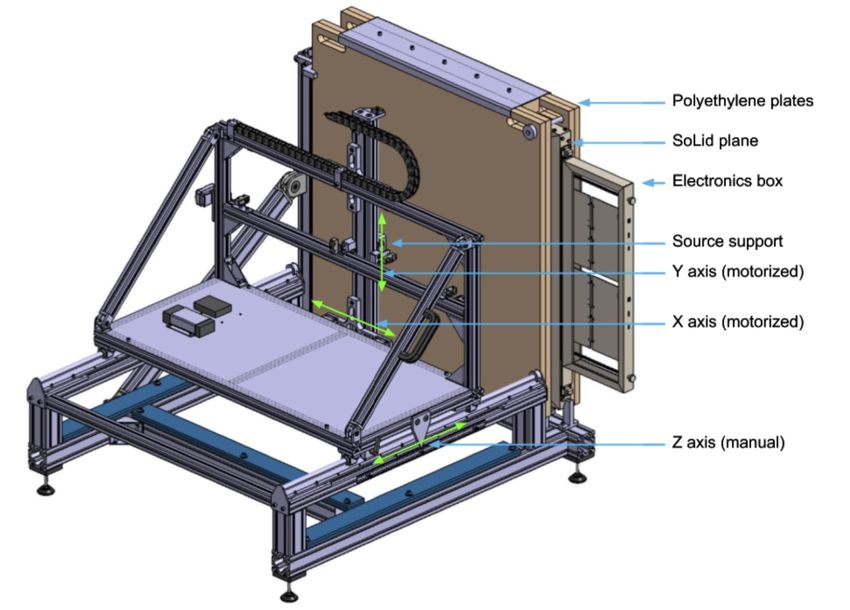
each optical fibre is covered by a Mylar foil with a reflective aluminium coating, and the other
end is coupled to a Hamamatsu type S12572-050P multi-pixel photon counter (MPPC), contain-
ing 3600 pixels, arranged in a 3×3 mm2 matrix. The position of the MPPC and mirror alternates
between the parallel fibres to mitigate the attenuation of light in the fibres and to ensure a more
uniform light response throughout the detector (see Fig. 1). The detection cells are arranged into
a detection plane of 16×16 cells, where each row and column of cells is read out by the same set of
two optical fibres, accounting for a total of 64 optical fibres per detector plane, as shown in Fig. 2.

2.2.3   Plane & module design
The detection planes, with a cross sectional surface of 0.8×0.8 m2 , are surrounded by a lining of
white high-density polyethylene (HDPE) with a thickness of 46.0 and 46.8 mm, respectively in
the vertical and horizontal directions (see Fig. 2). The HDPE bars act as reflectors for neutrons
that would otherwise escape the detector. Each plane is structurally supported by a hollow frame
of extruded aluminium that has been chrome coated to act as a Faraday cage for the MPPCs and
their wirings. Each fibre protrudes through the HDPE lining and the frame where it is capped off
on each end with two different plastic 3D printed caps. One cap holds an MPPC sensor, while the
other end holds the aluminized Mylar mirror (see Fig. 1). Optical contact with both the mirror
and the MPPC is ensured with a drop of optical gel. The MPPC bias voltage and signal is carried
on twisted pair ribbon cables that are routed through the hollow frame and are terminated on
one of the frame sides in four insulation displacement connectors (IDCs) each grouping 16 MPPC
channels. The front-end electronics, which is described in section 3, is self-contained in an alu-
minium encasing mounted on one side of each detection plane. Each detection plane is finally
covered with two square Tyvek sheets on each of its light sensitive faces to further ensure optical
isolation from its neighbouring planes.

Figure 2: (Left) Exploded view of a detection plane. (Right) Sketch and dimensions of a 10 planes detector
module mounted on its trolley (blue).

    Frames and their attached readout electronics are grouped together by 10 units to form a
detector module, mounted on a trolley (see Fig. 2). Each module can be operated as a standalone

                                                  –5–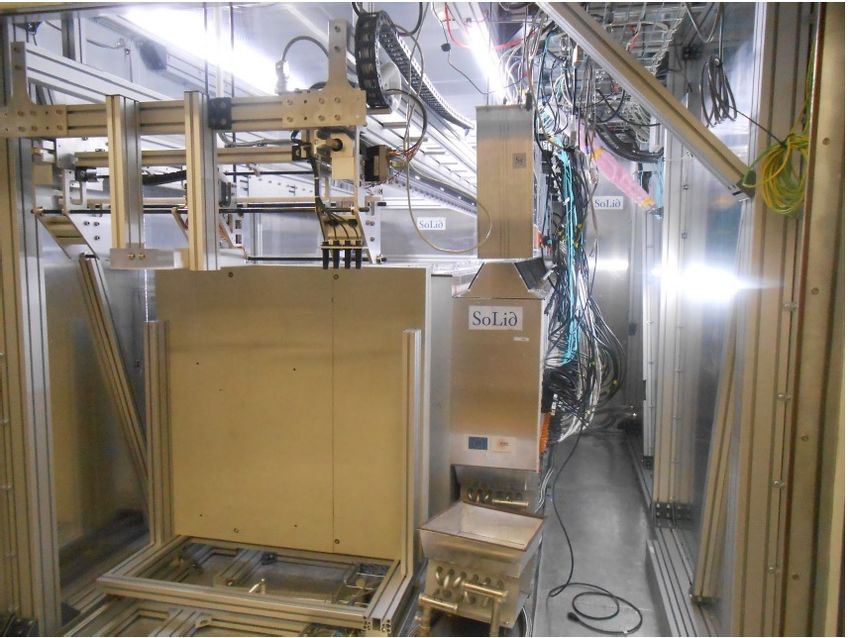
detector and has its own power supply and trigger electronics mounted on an overhead rail (see
section 3). The SoLid detector currently includes a total of 5 detector modules, accounting for
a total of 50 detector planes and corresponding to a fiducial mass of 1.6 ton. The front and back
planes of the detector are capped with a HDPE reflective shielding with a thickness of 9 cm. Under
normal detector operations all modules are closely grouped together with an average spacing of
0.5 mm between two modules.

2.3     Detector construction
2.3.1         Cell production and assembly
The construction of the SoLid detector started in December 2016 and took roughly 14 months. The
progress of the detection cells (wrapped cubes) production and plane assembly is shown in Fig. 3.
The PVT cubes were extracted from 104×52×6.3 cm3 PVT slabs and individually machined by an
industrial partner in Flanders using CNC milling machines, with 0.2 mm tolerance on the cube
and groove dimensions. After milling, all cubes were visually inspected for mechanical damage
before being transported to the integration site at Universiteit Gent. There all cubes were washed
with a light soap detergent to remove lubricant from the milling process and dried overnight.
During frame production, two types of neutron detection screens were used. The cells contained
in the bulk of the detector are all equipped with neutron detection screens that have a backing
with a thickness of 225 µm, while all cells located at the outer edge of each frame received neutron
detection screens without reflective backing material.

              14000
                           Full detector                                                   50
              12000
              10000                                                                        40
                                                                                             Detection planes
              8000                                                                         30
      Cubes

              6000
                                                                                           20
              4000                                                 Wrapped cubes
                                                                   Instrumented planes      10
              2000                                                 Qualified planes
                                                                   Planes integrated at BR2
                 0                                                                          0
                      Jan 2017 Mar 2017 May 2017 Jul 2017 Sep 2017 Nov 2017 Jan 2018

                      Figure 3: Time evolution of the SoLid detector construction phase.

     Each cube was weighed with a digital scale with a precision of 1 mg, before and after being
equipped with neutron detection screens and wrapped with Tyvek. The two neutron detection
screens for each detection cell were also individually weighted. Each detection cell was marked
with a bar code sticker that allows for tracking of the production history in a dedicated SQL
database. This database includes the bare and wrapped weights of each cell. During a period
of 8 months a total of 13228 cubes were washed, inspected, wrapped and catalogued. Only 3%

                                                    –6–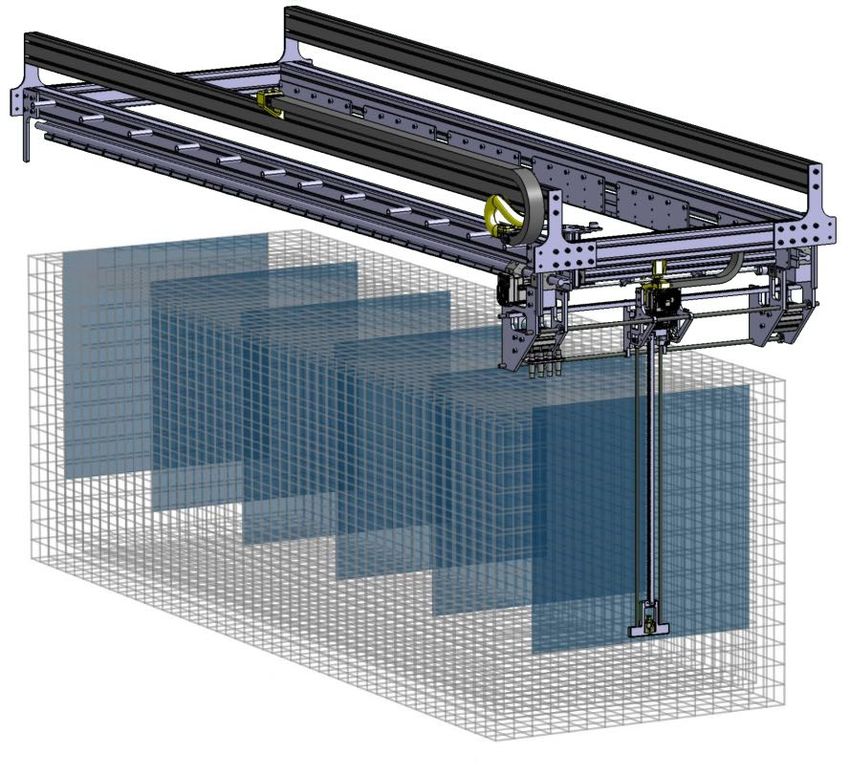
of all produced PVT cubes were rejected due to quality issues. The accuracy of the weights,
combined with the tracking of the production batches revealed a small shift in cell mass during
the production process, which falls well within the tolerances used in the cell quality control.
The mass distributions of the PVT and neutron detection screens of the 50 detection planes are
shown in Fig. 4. The mean weight of all PVT cubes equals 119.7 g with an RMS of 0.1 g, which
allows to control at per mille level the proton content. The difference in mass between the neutron
detection screens with and without reflective backing can be observed in Fig. 4. Each of the 50
detection planes was assembled and equipped by hand in its aluminium frame. The position of
each MPPC in the detector is stored in the construction database, together with its breakdown
voltage.

                     5                                                           102
                                                                                       2000          Mean : 2.52g
 Neutron detection

                                                                                                     RMS : 0.11g
  screen mass [g]

                     4                                                                 1500          Mean : 4.10g
                                                                                 101                 RMS : 0.11g
                                                                                       1000
                     3
                                                                                        500
                     2                                                           100      0
                          1   5   10   15   20    25   30   35    40   45   50                 2        3          4         5
                                                 Plane                                        Neutron detection screen mass [g]
                    121                                                          102 3000 Mean : 119.7g
PVT cube mass [g]

                                                                                          RMS : 0.1g
                    120
                                                                                     2000
                                                                                 101
                    119                                                              1000
                    118                                                          100     0
                          1   5   10   15   20    25   30   35    40   45   50                118      119      120        121
                                                 Plane                                               PVT cube mass [g]

Figure 4: Distribution of the masses for the 2 types of neutron detection screens (top) and for the PVT
cubes (bottom).

2.4                   Quality assurance
Before being integrated in a detection module, each detection plane was tested on the so-called
Calipso test bench, shown in Fig. 5 and described in detail in [10]. This test bench consists of a
robot that can position a calibration source in front of a SoLid plane with millimetre accuracy.
A polyethylene (PE) neutron collimator is added when performing NS calibration in order to in-
crease the neutron capture rate. In addition, a dedicated 22 Na self-triggering calibration head was
designed for the ES calibration. The Calipso test bench served primarily as an automated qual-
ity control system. As such it provided an early detection of typical construction quality issues
such as missing neutron detection screens, bad fibre connections, malfunctioning MPPCs and
wrong cabling which were all resolved before integration in a detector module. It also allowed
to perform an initial test of the electronics and DAQ system before mass production. As a result,
for a nominal bias of 1.5 V above each MPPC breakdown voltage, an average gain of about 22
Analogue-to-Digital Conversion units (ADC) per pixel avalanche (PA) was determined with an
RMS of 3%. This was further refined with in-situ equalizations during detector commissioning at

                                                                 –7–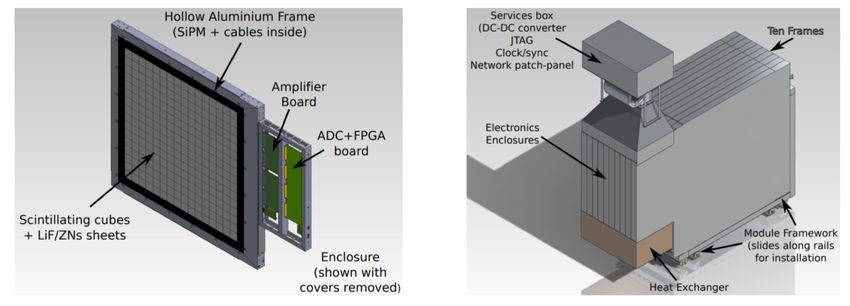
the reactor site to achieve a gain equalized to 1.4% across the whole detector (see section 5).
Figure 5: (Left) Mechanical design of the Calipso test bench. (Right) Picture of Calipso with a SoLid
detection plane to be calibrated. The source is located in the black box in the red square. The electronic
box is on the right of the plane.
The quality assurance campaign with Calipso allowed to have a preliminary calibration of all
the detection cells. Calipso measured the light yield by using a 22 Na gamma source in coincidence
with an external trigger to remove background. The measured Compton edges caused by the
interaction of the 1270 keV gamma rays are used to extract the light yield using two consistent
methods based on an analytical fit and a template method described in [10]. The average light yield
was observed to be larger than 70 PA/MeV/cell corresponding to a stochastic energy resolution of
12% which is consistent with the SoLid physics requirements [9]. The response of the detector to
neutrons was also evaluated using a 252 Cf source emitting neutrons with a mean energy of 2 MeV
in order to determine the relative difference in neutron response across the detector and to validate
the neutron trigger settings as described in [11]. Because of the dependence on moderation and
detector geometry, the absolute neutron capture and reconstruction efficiency is determined in-
situ, as will be detailed in the section 7. Combining the capture and reconstruction efficiency, the
total relative dispersion of this efficiency across the detection cells is 5%.
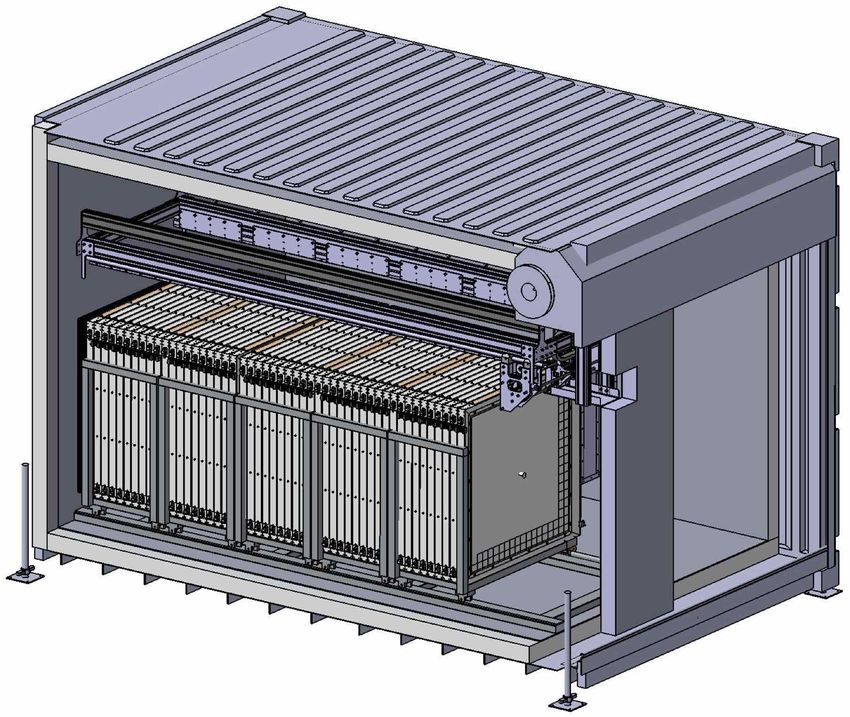
2.5 Container integration
The detector and its electronics are installed in a cooled cargo container with dimensions of
2.4×2.6×3.8 m3 as shown in Fig. 6 and 7. The container is further customized for thermal in-
sulation and feed through of cooling lines. A dedicated patch panel, located on the side of the
container, bundles all the connectors needed for the electronics (power supply, readout), the con-
tainer instrumentation and the ethernet communication. The 5 detector modules are positioned
off-center in the container in order to allow for access and service space (see Fig. 6, 7 and 12). They
are mounted on a rail system, that allows for an accurate and robust positioning and alignment
(see CROSS calibration system in section 2.6). The electronics are cooled by a chiller system which
is described later in section 3.1. Due to the dimensioning of the chiller system and its radiators it
is possible to cool down and control the ambient air temperature in the container to a precision
–8–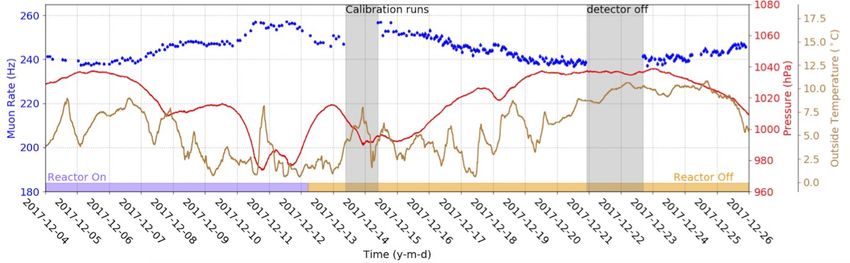
of 0.2 degrees Celsius. Under normal data taking circumstances, the ambient temperature of the
SoLid detector is kept at a fixed value of 11 degrees Celsius. In order to keep the relative humidity
of the air inside the detector at acceptable levels the container is permanently flushed with dry
air that enters the container at a low flow rate of 5 m3 /hour. Environmental observables such as
pressure, temperature and humidity in the container are constantly monitored by means of a cus-
tom sensor network that is controlled and readout by a Raspberry-Pi device. This specific readout
is interfaced with the data acquisition of the experiment. During nominal data taking, the gamma
background is monitored by a NaI scintillator (PMT coupled) located inside the container and the
airborne radon concentration is monitored by a radon detector.

Figure 6: Photograph of the SoLid detector in its cargo container prior to the installation of the last
detection module.

2.6   CROSS calibration system
In order to perform in-situ calibrations of the electromagnetic energy response and of the neutron
capture efficiency, a calibration robot, CROSS, is mounted on top of the SoLid detector inside the
container, as shown in Fig. 7. First, each of the modules is mounted on a trolley, which is itself
mechanically connected by a pivot link to a linear actuator (SKF - CAHB10). This actuator allows
to move the module carriage on the rails by a few centimeters, which is needed to insert small
radioactive sources between modules during calibration. These displacements are monitored to
an accuracy of better than 5 mm by mechanical position sensors mounted on the ground rail of
the detector. As such a total of six calibration air gaps of 30 ± 5 mm can be created sequentially

                                                –9–
on both sides of each module.
The calibration robot that straddles the whole detector along its longitudinal axis is equipped
with a holder for radioactive calibration sources as well as four capacitive sensors (BCS M18BBH1-
PSC15H-EP02). Each module contains aluminium reference pins and stainless steel screws located
on its top. Three capacitive sensors allow to monitor the longitudinal position of the robot by
detecting the module reference pins. The fourth capacitive sensor ensures that the air gap is suf-
ficiently large by measuring the distance between the stainless steel screws. Once the calibration
robot is positioned between two modules, the source holder can further be moved along the X-
and Y-axes. As such it can scan an area of 6 cells on the left and right sides of the plane center and
6 and 4 cells respectively above and below the plane center, covering nearly half of the detection
plane’s surface (see Fig. 7). The radioactive source is installed manually on the calibration arm
from the outside of the container and the shielding.
Figure 7: (Left) Sketch of the CROSS calibration robot and its ground rail system inside the container.
(Right) Sketch of the radioactive source holder and the area it can access within an open gap indicated by
the blue squares.
3 Data Acquisition system
3.1 Readout system design
The readout system is custom-made and based on a combination of analogue/digital front-end
electronics and Field-Programmable Gate Array chips (FPGA). It brings together compactness,
low power consumption (< 1 kW), flexibility and high reliability for unattended operation on re-
stricted access. All MPPC signals are equalized, synchronized (< 1 ns) and continuously digitized
at 40 Msample/s. The use of zero suppression techniques (ZS), combined with pulse shape trigger
algorithms, results in a data reduction factor of around 10 k, down to 20 Mb/s, with negligible
dead time (see Tab. 1).
– 10 –The readout system operates on three levels: plane, module and full detector. Each of the 50
single detection planes has its own readout system, mounted directly on its side within a dedicated
aluminium enclosure (see Fig. 8). It contains all the front-end electronics to run in autonomous
mode, as described below. Each detector module is equipped with a heat exchanger and a services
box that contains a DC-DC voltage converter to power the module, clock and synchronization dis-
tribution board, network patch panel and Minnow JTAG programming system. The module clock
board (master/slave mode) provides a common clock fan-out to synchronise the ten associated
digital boards. A master clock-board allows to run the five detector modules synchronously.
Figure 8: (Left) CAD rendering of a detector plane and its aluminium electronics enclosure. The 64
MPPCs are connected via an interface place using twisted-pair ribbon cables that terminate into insulation
displacement connectors. (Right) Diagram of a ten planes detector module with its services box and its
heat exchanger, placed below to take off heat generated by the electronics [11].
The front-end electronics of a single detection plane consists of two 32-channel analogue
boards, a 64-channel digital board, together with a power distribution system and an Inter-Integrated
Circuit module that reads out four environmental sensors mounted inside the hollow frame. These
environmental sensors monitor temperature and humidity levels throughout the detector. The
two analogue boards are connected to the cathodes of the 64 MPPCs of the plane. They provide
a common 70 V power supply, as well as individual trim bias voltages (0-4 V) used to equalize the
amplitude response of each MPPC individually (see section 5.1). Before being sent to the digital
boards and in order to perform more accurate time stamp and amplitude measurements, the fast
MPPC pulses (a few ns) are read out in differential AC coupled mode, amplified, band-pass filtered
and shaped by a charge integrating operational amplifier to stretch the signal over several digital
samples of 25 ns each.
The two analogue boards are connected to a 64-channel digital board for digitisation and
trigger. Each digital board has eight 8-channel ADCs, operating at a rate of 40 MHz with 14 bit
resolution. Digital boards are controlled and read out over a 1 Gbit/s optical Ethernet connection.
A Phase-Locked Loop is included, which allows the digital boards to operate in standalone mode
using an internally generated clock, or run synchronised to an external clock signal. Triggers
and readout logic are implemented in a Xilinx Artix-7 (XC7A200) based FPGA device. JTAG con-
– 11 –nectors are included for remote firmware programming. Trigger signals from each digital board
are propagated to all other detector planes by using two duplex 2.5 Gbit links (copper cables). A
complete description of the detector electronics is given in [11].
The entire readout electronics is coupled very close to the detector, within aluminium enclo-
sures, inside the chilled container. Both act as a Faraday cage, providing shielding from outside
electronics noise. The top and bottom sides of these enclosures have openings to allow air flow
cooling. The electronics are cooled by six fans mounted between the services box and the plane
electronics enclosures, pushing air downwards towards a heat exchanger which is capable of re-
moving the 200 W of heat generated by each module (see Fig. 8). The radiator unit is based on
circulating water containing 18% propylene glycol, connected to a chiller that operates nominally
at a temperature of 5 degrees Celsius. It also acts as an overall cooling source to lower the ambient
temperature inside the insulated detector container. As the environment temperature inside the
container is maintained to 11 degrees Celsius, MPPC responses are stabilized at 1.4% level and the
MPPC dark count rate is reduced by a factor of three compared to operation at room temperature.
3.2 Online triggers and data reduction
Multiple triggers and data reduction techniques have been implemented at the FPGA level [12].
The trigger strategy for neutrinos relies solely on triggering on a NS signal. As the NS scintillation
process is characterized by a set of sporadic pulses emitted over several microseconds (see sec-
tion 2), the NS trigger algorithm involves tracking the time density of peaks in the waveform [11].
All algorithm parameters have been optimized during deployment: the amplitude threshold on
waveform local maxima to be counted as a peak is set to 0.5 PA, the size of the rolling time win-
dow is fixed at 256 waveform samples (6.4 µs) and the number of peaks, required in the window,
is set to 17 (see Fig. 9). These default values correspond to a trigger efficiency of 75% and a purity
of 20% during nominal reactor ON periods. The 80% non-neutron triggers are mostly muon sig-
nals, which can be distinguished using an offline identification (see section 5.2 and 7). For each
NS trigger, a large space-time region is read out in order to encapsulate all signals from the IBD
interaction. Three planes are read out on either side of the triggered plane, with a large time
window of 500 µs before the trigger and 200 µs after the trigger. The NS trigger rate, which does
not change significantly depending on reactor operation, fluctuates around 80 Hz corresponding
to a data-rate of 15 MB/s (see Tab. 1).
Two additional triggers are also implemented to measure background and to survey the de-
tector stability. A threshold trigger has been implemented to record high amplitude ES signals,
such as muons. The default physics mode threshold is 2 MeV with a X-Y coincidence imposed.
This gives a trigger rate of about 2.1 kHz and data-rate of 2 MB/s during nominal reactor ON pe-
riods. It decreases by around 10% during reactor OFF periods (see Tab.1 and Fig. 18). A periodic
trigger has also been implemented in order to monitor continuously the stability of the MPPCs, as
well as any noise contributions. The entire detector is read out for a time window of 512 samples
without zero suppression, with a default trigger rate of 1.2 Hz, giving a data rate of 3.9 MB/s (see
Tab. 1). The three triggers include storing MPPC waveforms for offline analysis. A zero suppres-
sion value at 1.5 PA, respectively 0.5 PA in NS mode, allows to remove the pedestal contribution,
– 12 –whilst retaining all MPPC signals. It results in a waveform compression factor of around 50 (resp.
500) [11]. Table 1 summarizes the different trigger parameters and their associated data rates.
Figure 9: Example of NS waveform (black). The dashed lines show the zero suppression threshold. The
value of the NS trigger variable, i.e number of peaks in the rolling time window, is shown in blue [11].
Trigger ZS Condition Readout Region Trigger rate Data rate
Type Threshold Space Time (µs) (Hz) (MB/s)
Periodic Disabled Random 1.2 Hz Whole detector 12.8 1.2 3.9 (19%)
Threshold 1.5 PA Waveform sample > 50 PA Triggered plane 6.4 2100 2 (10%)
NS 0.5 PA Npeak ≥ 17 peaks Triggered plane [-500,+200] 80 15 (71%)
( Width = 6.4 µs , Tpeak = 0.5 PA ) ± 3 planes
Table 1: Summary of trigger settings and associated data rates during reactor ON physics data [11].
The readout software runs on a disk server, located very close to the detector. It provides
50 TB of local storage, that is split into two data partitions, which are periodically swapped and
cleared. All the data are first transferred to the Brussels HEP Tier 2 data centre, then subsequently
backed up at CC-IN2P3 in France [13] and at Imperial College in the UK using GRID tools, which
are used for offline processing and simulation production.
4 The BR2 reactor at SCK⋅CEN
4.1 The BR2 reactor
The BR2 reactor (Belgian Reactor 2) is a materials testing reactor operated by the nuclear research
center SCK CEN in Mol (Belgium). Since its start-up in 1963, it is one of the most powerful re-
⋅
search reactors in the world and thus plays an important role in nuclear material and fuel R&D.
It is also widely used for production of medical isotopes and neutron transmutation doped sil-
icon [14]. The BR2 reactor is a pressurized "tank-in-pool" type reactor, cooled with water and
moderated by its beryllium structure and water (see Fig. 10). It has a unique twisted design with
inclined channels to obtain a compact core (50 cm effective diameter, 90 cm height). The BR2 re-
actor uses highly enriched uranium fuel (HEU: 93.5% 235 U) at powers varying between 40 and
100 MWth . It thus produces a very high neutron flux, up to 1015 n/cm2 /s, and provides an intense
source of antineutrinos up to about 2⋅1019 ν̄e /s.
– 13 –Figure 10: (Left) Design and technical data of the BR2 reactor core. It consists of a beryllium matrix
composed of 79 hexagonal channels containing the nuclear fuel elements, the control rods and the experi-
mental channels. The beryllium core (yellow) is confined in an aluminium vessel (blue), that is completely
under water. (Right) Picture of the upper cover of the reactor vessel [14].
At the end of the SM1 prototype physics run, the BR2 reactor was shut down for a period of
one year and a half, and has undergone a thorough overhaul. The BR2 operation was restarted
in July 2016. In practice, the reactor operates at a nominal power of about 65 MWth , for 160 to
210 days per year, during cycles of about three to four weeks (ON period). There are on average
6 cycles of reactor ON periods per year, that alternate with interim maintenance periods of the
same duration (OFF period). The Solid experiment takes advantage of the OFF periods to perform
calibration campaigns and background measurements.
4.2 Detector integration on site
The SoLid detector is located at level 3 of the BR2 containment building in direct line-of-sight
of the nominal reactor core center. This is the third detector installed at this location by the
collaboration, after the two prototypes, NEMENIX [6] and SM1[7]. The 50 detector planes are
oriented perpendicularly to the detector-reactor axis, and as close as possible to the reactor core.
As such, the sensitive volume of the SoLid detector covers a baseline of [6300 mm − 8938 mm]
away from the nominal center of the BR2 reactor core (see Fig. 11 and Fig. 12). As the aluminium
reactor vessel is totally immersed in water, its radiation is properly shielded. Moreover, at this
– 14 –floor of the containment building, no other experiments surround the detector and all neigh-
bouring beam ports have been shielded with 20 cm thickness of lead. It thus ensures stable and
low reactor induced background conditions. Nevertheless, in order to mitigate the atmospheric
and cosmic backgrounds, which were determined experimentally with SM1 and compared with a
full-chain Geant4-based Monte-Carlo simulation [15], a passive shielding surrounds the detector
(see Fig. 12 and Fig. 13). The top of the detector is shielded with a 50 cm PE layer made of 2.5 cm
thick PE slabs that are staggered to avoid gaps. The PE slabs are supported by a steel scaffolding
straddling the container and surrounded by a 50 cm thick water wall on the four sides of the con-
tainer. In order to capture remaining thermalized neutrons, thin cadmium sheets with a thickness
of 2 mm are sandwiched between the passive shielding and the container.
Figure 11: 3D representation of the BR2 geometry model and positioning of the SoLid detector as im-
plemented in SoLidSim (see section 6). The SoLid position system is based on three Cartesian coordinates
along perpendicular axes in a right-handed system. The Z-axis is perpendicular to the detector planes
and its direction points away from the nominal center of the BR2 reactor core. The Y-axis points upward
towards the zenith, and the X-axis points to the right side of the detector, when facing the reactor.
The environment of the BR2 containment building is continuously monitored and registered
by the BR2 Integrated Data Acquisition System for Survey and Experiments (BIDASSE). During
SoLid operation, environmental parameters, such as temperature, humidity and pressure, outside
and inside the containment building, are constantly monitored. Also the background radiation is
monitored using gamma and beta detectors placed in the vicinity of the SoLid container. So far,
these variables are used as a cross check of the data coming from the container instrumentation,
i.e. environmental sensors, NaI scintillator and airborne radon detector mentionnd in section 2.2.
Finally, the thermal power is continuously monitored by two methods (thermal balance measure-
ment and ionization of nitrogen in the cooling water), which allow its determination with 5%
absolute uncertainty.
– 15 –Figure 12: A vertical projection of the detector geometry and its positioning in the containment building
(Geant4 based). It shows the reactor core (red) submerged in water (blue) and the detector geometry
including the detector module placement (yellow and blue rectangles) inside the cargo container, the rail
system (dark grey rectangle), container insulation (purple) and passive water shielding (dark green).
Figure 13: Pictures of the detector during its integration at BR2: cooled container (white) and passive
shielding (black).
4.3 Neutrino flux modeling
For each cycle, i.e. for a given fuel loading map and operation history, detailed simulations of
the BR2 reactor core are performed to calculate the emitted antineutrino spectrum. In addition,
the computation of the spatial fission distribution, combined with a dedicated tracking algorithm,
allows to obtain the detector acceptance, defined as the fraction of emitted antineutrinos that
pass through the detector. The geometrical acceptance, which is about 0.11%, depends slightly
on the fuel loading map. The emitted antineutrino spectrum is computed using the conversion
and summation methods [16]. The conversion method is based on the prediction of the fission
rates as a function of time using a MCNPX (or MCNP6) 3D model of the reactor core interfaced
with the evolution code CINDER90 and combined with the converted β− spectra, measured at
ILL reactor in Grenoble, France (see Fig. 14). In addition, the MURE code [17] allows to compute
– 16 –the off-equilibrium effects to adapt the converted spectra to the irradiation time of the antineu-
trino experiment. The summation method uses the same MCNPX/CINDER90 software combined
with the amount of in-core β− emitters and consists in summing all the individual beta branches
composing the total spectrum weighted by the beta decay activities [18] (see Fig. 14). Systematic
effects coming from the thermal power uncertainty, modeling uncertainty as well as nuclear data,
will also be estimated. The current calculations indicate that at typical power settings of BR2,
the SoLid experiment is subjected to IBD interaction rates between 11.5 and 14.5 mHz (1000-1250
events per day).
Figure 14: (Left) Evolution of the fission rates during cycle 03/2018A. (Right) Emitted antineutrino spec-
trum calculated with MCNP/CINDER90 fission rates and using the summation method. The different colors
correspond to different time steps before reaching equilibrium, from 0 to 28 days of irradiation time.[16].
4.4 Backgrounds
The SoLid detector is also subjected to various background processes that contaminate the IBD
samples for final analysis. Because the primary physics trigger is set to detect thermal neutrons
interacting in the neutron detection screens, most backgrounds are related to either the produc-
tion of neutrons via processes other than IBD interactions, or processes that excite the ZnS(Ag)
scintillator embedded in the neutron detection screens. Some background processes exhibit a
clear time structure between the triggered NS time and preceding ES signals, while others have
a random time structure and are called accidental. Reactor independent backgrounds dominate
our data sample and can be extracted from data collected during reactor OFF periods validated by
dedicated simulation models. Reactor dependent backgrounds are very scarce and are monitored
using a dedicated NaI gamma ray detector and with dedicated control samples that are depleted of
IBD events, such as samples of triggered NS signals prior to detected ES signals. In all cases we try
to validate the background composition and the influence of selection criteria by using dedicated
Monte Carlo simulations, wherever they are available. A detailed description and treatment of
these models falls beyond the scope of this paper. Instead we summarize the main background
processes and their origin below.
A first source of neutrons to which the detector is constantly exposed is of atmospheric ori-
gin. These neutrons are produced by cosmic ray spallation when high energy primaries collide
– 17 –with atmospheric nuclei. Neutrons can penetrate much further into our atmosphere than the
electromagnetic component and are shown to produce a complex energy spectrum [19] ranging
from sub-eV to multi-GeV. The flux of atmospheric neutrons is simulated using the Gordon model
as described in [19], scaled to the BR2 reactor site elevation and latitude, and cross-checked with
the more general purpose CRY generator [20]. The flux contains slow and fast neutrons that
induce a different response in the SoLid detector. Slow neutrons that enter our detector can, in
combination with an accidental coincidence of an ES signal such as those induced by gamma rays,
produce signals similar to IBD events. The detector timing and spatial segmentation with corre-
sponding topological selections can largely suppress this background. The passive water shield of
50 cm surrounding the experiment, combined with the Cd sheets placed on the outer walls of the
container help to thermalize and capture some of the epithermal neutrons. The fast neutron com-
ponent is able to penetrate the detector and can induce highly energetic proton recoils resulting
in ES signals. If the neutron further thermalizes inside the detector it can be captured and induce
a NS trigger. As such it introduces a time correlated background that dominates the selected IBD
events samples for ES signals with energy above 5 MeV. This background is mainly suppressed by
timing and ES signal multiplicity requirements.
Cosmic ray muons are also known to induce spallation reactions in materials near or inside
the SoLid detector that produce neutrons or radioisotopes. The rate of neutron production in-
creases with muon energy and with material density. The rate and spectrum is modelled using
the CRY generator [20] by simulating cosmic ray showers on a surface that lies 30 m above the
BR2 building and by tracking all shower components through the building and detector geometry.
Roughly one third of the spallation neutrons are produced inside the detector, while the rest is
created in surrounding structures. The techniques to mitigate the corresponding accidental and
time correlated background are similar to those to reduce the atmospheric neutron background.
Cosmic muons themselves are used as a calibration tool, as they generally leave a reconstructed
track in the detector. In some cases, however, muons can clip the detector edges, leaving an iso-
lated energy deposit that can contribute to the accidental backgrounds in the detector. Muons can
also decay in the detector, resulting in the detection of the Michel electron or positron with a char-
acteristic delay corresponding to the muon life time. The rate and spectrum of cosmic ray muons
are modelled using CRY, but are cross-checked by other models by Guan [21] and Reyna [22].
Intrinsic radioactivity of detector materials or airborne isotopes are another source of back-
grounds. The airborne isotope of 222 Rn can produce several alpha and beta particles along its
decay chain. Its presence inside the detector container is therefore monitored by a dedicated
Rn detector based on the RADONLITE and RADONPIX technology [23], developed at CERN.
Another source of intrinsic radioactivity are trace fractions of Bi isotopes contained in detector
materials, in particular the neutron detection screens. The 214 Bi isotope is the most troublesome
and is part of the long 238 U decay chain. It decays to 214 Po via β− emission with a half-life of
roughly 20 minutes and a Qβ of 3 MeV. The resulting Po isotope has a half life of 164 µs and emits
an energetic alpha particle that can cause a scintillation of the ZnS(Ag) scintillator of the neutron
detection screens. The half life of 214 Po is very similar to the thermalization and capture time of
fast neutrons in the SoLid detector. This background, referred to as BiPo, dominates at prompt
– 18 –energies below 3 MeV and is difficult to mitigate. This BiPo background is modelled by generating
random decay vertices in the neutron detection screens throughout the detector, followed by the
subsequent decays with corresponding half lifes and energies. The use of cube and fibre topology
information allows to localize the spatial origin of the alpha particle, while timing and energy can
be used to tag the ES signal. In addition, also the integrated energy of the NS signal can be used
to discriminate neutrons and alphas from the 214 Po decay.
Other backgrounds can be broadly categorized as accidentals and consist of random coin-
cidences of ES signals that are typically induced by gamma rays and thermal neutrons in the
surroundings of the detector. The accidental distribution can vary with reactor power, but can
be easily extracted from data itself, using negative time differences between the ES and the NS
signals. Accidentals contribute only marginally to the selected IBD events sample.
5 Detector operation and data monitoring
5.1 Channel characterization and equalization
During nominal operations, the gain of the MPPCs is set to around 31 ADC counts per PA, which
corresponds to a mean over-voltage of 1.8 V above the avalanche breakdown value of each sen-
sor. This over-voltage setting was optimized for neutron efficiency during the commissioning
of the detector at BR2. It is a compromise between photon detection efficiency, pixel cross talk
and thermal dark count rate. The amplitude response of the sensors is equalized by an automatic
procedure that first consist of finding the individual break down voltage of each MPPC, which
is spread with a standard deviation of around 2 V over all the sensors. For a given channel, the
linear relationship between gain and voltage is determined by performing a voltage scan. This
procedure allows to equalize the gain of all the channels with a spread around 1.4%, where the
dominant uncertainty is the precision of the gain-finder itself (see Fig. 15).
Figure 15: (Left) Spectrum of ADC samples for a typical detector channel, with and without a local
maxima filter applied. The first pixel avalanche peak can be parametrized using a Gaussian curve, and the
Gaussian mean value is used as the channel gain measurement. (Right) Spread of gain values across all
operational MPPCs after the final iteration of the equalization procedure [11].
– 19 –MPPC sensors typically have a high dark count rate, which is the main reason why the detec-
tor is cooled inside an insulated container. The rate also strongly depends on the over-voltages
applied. Under nominal running conditions, i.e. at a mean over-voltage of 1.8 V and at a tem-
perature of 11○ C, the mean dark count rate is 110 kHz per channel, which is uniform across the
detector. The MPPC pixel cross talk, which corresponds to the probability that a pixel avalanche
triggers an avalanche in a neighbouring pixel, also depends on the bias voltage and amounts to
20% for an over-voltage of 1.8 V [11]. Long term trends of the MPPC response are highly stable,
as shown on Fig. 16.
Figure 16: Weekly trends of the MPPCs response. Day-night variations are observed with temperature
which changes of up to 0.5○ C inside the container. The small increase in average temperature over the
period of data taking increases the dark count rate, causing the baseline values to change by up to 2%
relative to the gain [11].
5.2 Detector operation and data quality monitoring
Run operations are controlled via a dedicated Python-driven web application, the "SoLid Data
Quality Monitor" (SDQM). It automatically processes a small fraction of each run (first GB) using
the SoLid reconstruction and analysis software. Output measurements and distributions of the
detector as well as in-situ environmental sensors are read out periodically, as show in Fig. 17 and
stored in an online database and is continuously inspected via a web application.
Figure 17: Time evolution of some relevant environmental parameters, measured by sensors placed in or
near the SoLid detector.
– 20 –The rates obtained from the monitoring database are shown in Fig. 18. The NS trigger rate
stays stable irrespective to the reactor operation. Once the muons contamination has been re-
moved, the NS rate is around 18 Hz and is strongly correlated to the airborne radon concentration
which is monitored by a Rn detector (see section 2). The transition between the reactor ON and
OFF periods can only be seen by the relatively small change in the threshold trigger rate, which
is strongly correlated to the gamma rate measured by the NaI detector.
Figure 18: (Top) Long term trends of the NS rate after muons contamination removal (blue) and the
airbone radon detector rate (orange). (Bottom) Long term trends of the threshold trigger rate (blue) and
the NaI detector rate (orange). Reactor ON periods are displayed by vertical grey bands.
The SoLid detector segmentation provides a powerful tool for identifying cosmic muons
crossing the detector. Muons deposit their energy in a large number of cells along their path.
Their offline reconstruction thus relies on a spatial clustering that groups all signals from neigh-
bouring fibres, an energy requirement to reject low energetic secondary signals, and finally, a
requirement on the fibre multiplicity. An example of a reconstructed muon track inside the de-
tector is displayed in Fig. 19.
The reconstructed muon rate, which is about 250 Hz, can be used as a standard observable,
providing uniformity maps of the detector response and an effective tool to control the stability
over time. As expected, we observe a linear relationship between the muon rate and the atmo-
spheric pressure (see Fig. 20). The tracking algorithm also computes the muon path length in each
cell by fitting the dE/dx distributions. It is then possible to continuously monitor the stability of
the detector response during physics mode. As shown in Fig. 21, the variation of the energy scale
– 21 –Figure 19: An example of a reconstructed muon track inside the detector (red lines). Red squares indicate
which channels are used for the track reconstruction, the purple crosses shows through which cells the
reconstructed track goes.
is below 2% over a data taking period of two months. Lastly, the muon reconstruction also allows
to verify the time synchronisation of the detector channels. Indeed, the time in which a muon
crosses the detector is negligible compared to the DAQ sampling time and the deposited energy in
each cell has to be detected simultaneously. As shown on Fig. 20, the channels are synchronized
within 5.908 ± 0.002 ns.
6 Simulation
The simulation of the SoLid detector is divided in two parts: one part models the energy loss and
scattering of particles, including neutrons, in the SoLid detector and the reactor hall, while the
second stage models the optical system of the detector, including the scintillator response, the
optical transport, the photon collection by the MPPCs and the electronics response.
6.1 Geant4 model
The first part, SoLidSim, is implemented using the Geant4 simulation library [24]. In order to
accurately model the scattering of fast neutrons, the propagation of cosmic showers through the
detector and the creation of spallation products in high-Z materials surrounding the detector, a
detailed geometry model of the detector surroundings is made. This model, as graphically shown
in Fig. 11, is based extensively on detailed blueprints of the reactor building and survey mea-
surements performed prior to detector installation and includes as main features the majority of
the concrete and steel structures of the BR2 containment building, including the cylindrical con-
tainment building inner and outer walls and dome cap, the concrete floors of level 3, where the
detector is located, level 2 below the detector and levels 4 to 7 situated above the detector. Spe-
cific features such as staircases, elevator shafts, crane passways, and access holes are included as
well. Special care is taken to model in detail the reactor fuel tank, the water pool and its concrete
walls with beam ports including concrete and steel plugs, the 20 cm thick lead shielding wall in
between the SoLid detector and the radial beam port facing the reactor core. The inclusion of
– 22 –Figure 20: (Top) Evolution of the reconstructed muons rate (blue), the atmospheric pressure (red), and the
outside temperature (brown). (Bottom left) Linear correlation between the reconstructed muons rate and
the atmospheric pressure. (Bottom right) Distribution of the time difference between all energy deposits
originating from the same muon for a large sample of muons, in units of the DAQ timestamps in blue, and
after interpolation in orange.
Figure 21: Evolution of the relative energy scale determined by the muon calibration, corrected for gain
and baseline variations, and averaged over all channels. The error bars on the points represent the statistical
uncertainty, the blue band represents the total uncertainty (stat. + syst.).
these structures can be switched off in the tracking of particles through the detector to save time
and computing power for simulations of IBD events or background processes occurring inside
– 23 –the detector. The geometry of the detector includes besides the sensitive volume of the detec-
tor, all HDPE neutron reflectors, all metal structures surrounding the sensitive volume, including
the electronics housing, the CROSS system, all mounting rails, the container insulation and steel
walls, the passive water and PE shielding surrounding the detector and its support scaffolding.
6.2 Readout simulation
After modelling the energy deposits or the creation of secondary particles in the detector and its
surroundings with SoLidSim, the energies deposited in the sensitive volume of the detector are
translated in detected pixel avalanches in the MPPCs connected to fibres surrounding the energy
deposit. This is modelled in a standalone readout software library, ROSim, which is specific to
SoLid. For the optical part, it includes the modelling of the scintillation photon production in the
PVT and in the ZnS scintillator of the neutron detection screens, in particular the non-linearity
corrections to the energy response using Birks’ law, the loss of scintillation photons due to scat-
tering and absorption in the PVT cubes, the neutron detection screens and the wrapping material,
the attenuation of the wavelength shifted photons in the optical fibres, the reflectivity and absorp-
tion losses in the mirrored fibre ends. The Birks constant values for PVT and ZnS are based on
the literature values for these materials and are respectively 0.15 mm/MeV and 0.001 mm/MeV.
The reflectivity of the mirrors on the fibre ends is taken to be 80%. The attenuation lengths of
each fibre have been accurately measured during in-situ calibration campaigns with CROSS and
vary between 90 cm and 115 cm. The current simulation model includes the in-situ measured
attenuation length of each fibre. The final number of photons is fluctuated according to Poisson
statistics and distributed exponentially in time with time constants corresponding to the PVT and
ZnS scintillator decay constants.
The number of photons arriving at the MPPCs are scaled to the values measured with cali-
bration campaigns using gamma sources, taking into account the photon detection efficiencies of
the MPPCs. The photons arriving at the MPPCs are converted into pixel avalanches with an effi-
ciency depending on the photon wavelength and the over-voltage and are of the order of 30±5%.
The readout simulation also takes into account the measured dark-count rate, which is generated
uniformly across the detector at a rate of 110 kHz per channel. The probability of cross-talk in a
neighbouring pixel, of about 20%, is also considered. After an avalanche is triggered in an MPPC,
the pixel is insensitive for incoming photons for a short time period. This pixel recovery is mod-
elled by an exponential recovery of the pixel bias voltage with a time constant of 24 ns.
The last stage of the simulation takes into account the shaping and amplification of the MPPC
signals, and adds a small amount of white noise. This noise is modelled as a random walk in the
ADC sample amplitudes around the nominal baseline. The RMS of the noise corresponds to the
values measured in data and equals 2 ADC, compared to the amplitude of a single pixel avalanche
which is 32 ADC for an MPPC bias of 1.8 V above its breakdown voltage. The pulses are finally
sampled with the same frequency and resolution as the SoLid ADCs and the data is stored in the
same format as real data for processing by the reconstruction software. An example of an IBD
event generated with the SoLidSim software and processed by the readout simulation is shown
in Fig. 22 and compared to an observed IBD candidate.
– 24 –You can also read