Why exercise builds muscles: Titin mechanosensing controls skeletal muscle growth under load
←
→
Page content transcription
If your browser does not render page correctly, please read the page content below
Why exercise builds muscles: Titin mechanosensing controls skeletal muscle growth under load

                                                                                              Neil Ibata and Eugene M. Terentjev∗
                                                                                                       (Dated: February 2, 2021)
                                                               Muscles sense internally generated and externally applied forces, responding to these in a coordinated hier-
                                                            archical manner at different time scales. The center of the basic unit of the muscle, the sarcomeric M-band, is
                                                            perfectly placed to sense the different types of load to which the muscle is subjected. In particular, the kinase
                                                            domain (TK) of titin located at the M-band is a known candidate for mechanical signaling. Here, we develop
                                                            the quantitative mathematical model that describes the kinetics of TK-based mechanosensitive signaling, and
                                                            predicts trophic changes in response to exercise and rehabilitation regimes. First, we build the kinetic model
                                                            for TK conformational changes under force: opening, phosphorylation, signaling and autoinhibition. We find
                                                            that TK opens as a metastable mechanosensitive switch, which naturally produces a much greater signal after
                                                            high-load resistance exercise than an equally energetically costly endurance effort. Next, in order for the model
                                                            to be stable, give coherent predictions, in particular the lag following the onset of an exercise regime, we have
arXiv:2102.00836v1 [q-bio.TO] 1 Feb 2021

                                                            to account for the associated kinetics of phosphate (carried by ATP), and for the non-linear dependence of pro-
                                                            tein synthesis rates on muscle fibre size. We suggest that the latter effect may occur via the steric inhibition
                                                            of ribosome diffusion through the sieve-like myofilament lattice. The full model yields a steady-state solution
                                                            (homeostasis) for muscle cross-sectional area and tension, and a quantitatively plausible hypertrophic response
                                                            to training as well as atrophy following an extended reduction in tension.

                                                                   I.   INTRODUCTION                                      How the muscle cell keeps track of the history of its load
                                                                                                                       and stress inputs within a number of intracellular output sig-
                                              Why does exercise build skeletal muscles, whereas long pe-               nals (which then go on to stimulate or inhibit muscle protein
                                           riods of immobility lead to muscle atrophy? The anecdotal                   synthesis), is inherently an incredibly complex biochemical
                                           evidence is clear, and the sports and rehabilitation medicine               question. With the help of recent theoretical insights into the
                                           community has amassed a large amount of empirical knowl-                    folding and unfolding rates of mechanosensor proteins un-
                                           edge on this topic. But the community has not as yet ad-                    der force, we hope to gain insights into the first part of this
                                           dressed and understood two key phenomena which underly                      puzzle for the specific case of muscle hypertrophy. To make
                                           hypertrophy and atrophy: how does the muscle ‘know’ that it                 progress, we use a simple model for force-induced transitions
                                           is being exercised (when it is certainly not the tactile sense,             between the different conformations of the titin kinase (TK)
                                           processed via the nervous system, that is at play in this), and             mechanosensor. If the conformational change helps create
                                           how does it signal to provoke a morphological response to an                an intracellular signal, we can model the signal’s strength in
                                           increase or a lack of applied load? Here we develop a quanti-               terms of the duration and intensity of the mechanical inputs
                                           tative theoretical model which seeks to explain both of these               (external force on the TK domain in our case).
                                           processes. In order to be useful, the model must build on the
                                           relevant knowledge accumulated from studies of the anatomy
                                           and physiology of muscles, as well as the biological physics                                            Force chain
                                           of molecular interactions and forces.
                                              Muscles, their constituent cells, and the structure of their                The individual sub-cellular, cellular and super-cellular
                                           molecular filament mesh must respond mechanosensitively –                   components of a muscle act in concert to scale up a vast num-
                                           i.e. in a manner which depends on the changes in the magni-                 ber of molecular force-generating events into a macroscopic
                                           tude of the forces and stresses that arise during the contraction           force. The hierarchical structure of the muscle (see Fig. 1)
                                           and extension of the muscle – at many different timescales.                 allows the macroscopic and microscopic responses to mirror
                                           At the fastest time scales (tens or hundreds of milliseconds),              each other [9].
                                           skeletal muscles can produce near maximal force for jump-                      The sarcomere is the elementary unit of the muscle cell
                                           ing or for the fight-or-flight response. Most muscles also go               and the basic building block of the sliding filament hypoth-
                                           through cycles of shortening and lengthening with a period                  esis [10, 11]. Its regular and conserved structure, sketched in
                                           of the order of a second in the vast majority of sprint or en-              Fig. 2 for the vertebrate striated muscle, allows for a series
                                           durance exercise (running, climbing, etc.) At a much longer                 transmission of tension over the whole length of the muscle.
                                           timescale of many days, a muscle must also be able to mea-                  In vertebrates, six titin molecules are wrapped around each
                                           sure changes in its overall use in order to effect adaptive mus-            thick filament [12, 13] on either side of the midpoint of the
                                           cle hypertrophy/atrophy – ultimately helping to prevent injury              sarcomere: the M-line.
                                           on the scale of months and years.                                              During active muscle contraction, myosin heads (motors)
                                                                                                                       bind to actin and ‘walk’ in an ATP-controlled sequence of
                                                                                                                       steps [14] along the thin filaments. When a resistance is ap-
                                                                                                                       plied, the myosin motor exerts a force against it. During slow
                                           ∗   Cavendish Laboratory, University of Cambridge, J.J. Thomson Avenue,     resistance training in both concentric and eccentric motions,
                                               Cambridge, CB3 0HE, U.K.; emt1000@cam.ac.uk                             tension is passed along the sarcomere primarily through the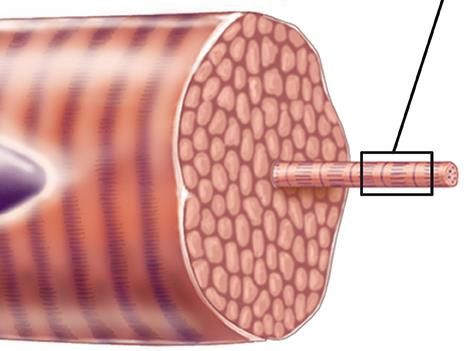
2
muscle fibre Z-disk A-band M-band Z-disk
(muscle cell)
Nm
myofibril
thick filament
(myosin bundle)
...
F Nc .......
..... Titin f f
f Open TK can be
sarcomere PEVK
phosphorylated
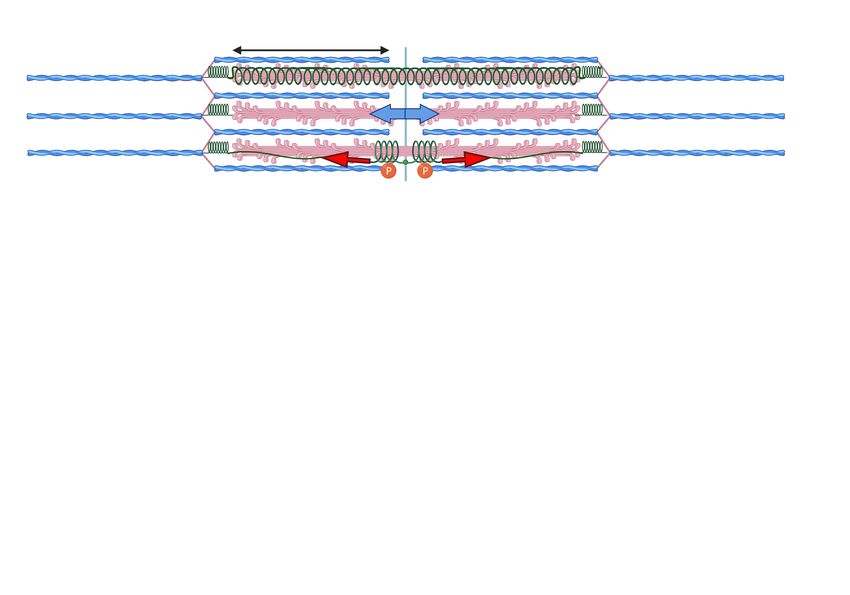
FIG. 1. The ‘textbook’ hierarchy in the anatomy of skeletal muscle. FIG. 2. A sketch of the mechanically active elements of sarcomere.
The overall muscle is characterised by its cross-section area (CSA), The thick filaments are crosslinked across the M-line, with six titin
which contains a certain number (Nc ) of mucle fibers (the muscle molecules bonded to these filaments, on each side of the M-line. The
cells with multiple nuclei, or multinucleate myocytes). A given mus- full filament is under the measurable microscopic force identified in
cle has a nearly fixed number of myocytes: between Nc ≈ 1000 for Fig. 1, shown by the blue arrow in the middle filament. At the molec-
the tensor tympani, and Nc > 1,000,000 for large muscles: gastroc- ular level, the force is borne by the individual titin and myosin fila-
nemius, temporalis, etc. [1]. Muscle cells contain a variable num- ments. If we assume that the thick filament and titin extend by the
ber (Nm ) of parallel myofibrils (organelles), each of which can be same amount during muscle contraction, then the graphical relation-
divided into repeated mechanical elements called sarcomeres. The ship between titin force and force in the thick filament is illustrated
typical length of a sarcomere is ca. 2µm, so there are ca. 105 of in Figure 3 in the Supplementary Material. This figure illustrates an
these elements in series along a fiber in a typical large muscle [2]. additional possibility: if titin wraps around the thick filament (top),
Each sarcomere contains a number of parallel thick filaments (heli- then TK can lengthen substantially more than we consider in this
cal bundles of myosin, red) whose constituent myosins pull on the work, for titin extending with the thick filament (bottom). The force
actin polymers in the thin filaments (F-actin, blue) to generate force. in TK would be much higher, making TK bear more load and create
Within the myofibrils, the spacing between neighbouring myosin fil- a greater mechanosensitive signal.
aments is ca. 0.046 µm at rest [3, 4]. The typical cross-sectional
area of a single muscle fibre substantially varies between individu-
als and muscle types, but is of the order of 4000 µm2 [5]. Together,
this means that a typical muscle fibre has some ca. 2,000,000 par- mentary Part A.2 and A.3). We divide the force in the entire
allel filaments across, between which the macroscopic force F must muscle by the number of active myofilaments (see Fig. 1) to
be divided. Rather than using this awkward number, we will express find a large variation in force per filament in untrained individ-
our results in terms of the single muscle fibre CSA. A chemically uals (150 − 500pN) [6]. Muscle fibre neuronal and molecular
activated muscle fibre with a CSA of 4000µm2 shows a force in activation increases with training [7, 8], so the higher forces
the vicinity of 300-1000µN for untrained individuals (with a very are more likely representative of filament forces in trained in-
large individual variation) [6], which translates to an average fila- dividuals. The maximum filament forces extrapolated from
ment force of 150-500pN (see Supplementary A.6). Training can X-ray diffraction studies [21] are higher at ≈ 600pN, possi-
increase the neural activation level [7] as well as the number of ac-
bly because the actin only partially binds to myosin in normal
tive myosin heads and the maximum voluntary contraction force per
filament (e.g. by stretch activation [8]). Because of this, we would
contractions, maximum forces do not last very long, and be-
expect resistance training to lead the filament forces to tend towards cause the muscle does not coordinate perfectly as a whole. In
the upper end of the range (≈ 500pN). Supplementary Part A.4, we graphically find an approximate
relation between titin and thick filament force. In particular, it
suggests that the force per titin be close to 25pN at the maxi-
thin filament, myosin heads [15, 16], the thick filament, and mum voluntary contraction force.
into the cross-bridge region of the sarcomere where thick fila- In Section A.1 of the Supplementary Material, we discuss
ments are crosslinked with their associated M-band proteins. different candidates of mechanosensitive signaling in the sar-
The load in each of the sarcomere components ultimately comere, and highlight the reasons why titin kinase is a par-
depends on the relative compliance of elements. The relative ticularly good candidate for this role, and why we have not
load on the thick filament and the M-band segments of titin considered some of these other candidates here.
when the filament is either under internal (contracting) or ex-
ternal (extending) load is discussed in Supplementary A.4. It
is well-known that titin is under load when the sarcomere is TK is a mechanosensor of the ‘second kind’
extended [17, 18]. Recent X-ray diffraction experiments [19]
suggest that that the thick filament may be more compliant Cells sense and respond to the mechanical properties of
than originally thought; if so, M-line titin is likely substan- their environment using two main classes of force receptors.
tially extended and loaded titin when the muscle actively gen- The first type of mechanosensor responds immediately under
erates force. Others disagree [20] and attribute the change in force [22, 23]. Mechanosensitive ion channels are the archety-
line spacing in diffusion experiments to a mechanosensitive pal example of such a sensor and have been proposed to play
activation of the entire thick filament at low forces. Either a role in tactile signaling (transforming a mechanical signal
way, M-band titin is under some tension during active muscle into chemical) [22, 24]. However, the ions which they use
contraction. This situation is sketched in Fig. 2. in signaling are rapidly depleted, making it difficult for these
We estimate the force in each filament both macroscopi- sensors to signal in response to a sustained force.
cally and microscopically (see the full discussion in Supple- The other type of mechanosensor, dubbed of the ‘2nd kind’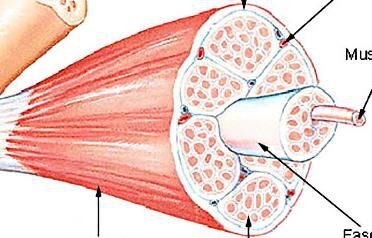
3

by Cockerill et al. [25], can either indirectly ‘measure’            observed for the Ig domains. In particular, AFM experi-
the response coefficients, or time-integrate an external force       ments [28] show that the presence of ATP (an energy supply)
acting on the molecule. The focal adhesion kinase (FAK)              changes the conformational energy landscape of the molecule
mechanosensor [26, 27] is a good example: it can sense sub-          as it is stretched. This shows that the molecule possesses a
strate stiffness by measuring the tension in the integrin-talin-     long-lasting denatured conformation, in which it can accom-
actin force chain, which binds a cell to its extracellular ma-       modate the recruitment of signaling molecules upstream of a
trix (ECM). FAK and the TK domain both unfold under force,           mechanosensitive signaling pathway. Being the largest known
can be phosphorylated, and appear pivotal to mechanosensi-           molecule in vertebrates, titin interacts with an unsurprisingly
tive signalling, they also has many structural similarities. TK      large number of molecules [39]; Linke et al. [40] summa-
has already been suggested to act as mechanosensor [28–30],          rized this knowledge in a protein-protein interaction network
and although recent experimental work has focussed mainly            (PPIN), shown in their Figure 2, where in particular the nbr1
on other regions of the titin molecule, we believe that it is        and MuRF pathway (localized in M-band) is shuttled into the
worth returning to the TK domain to examine it as a time-            nucleus, leading to SRF and transcription of new actin.
integrating mechanosensor. In the Results section below, we
see that the metastability of the TK open state, when the mus-
cle is under steady-state passive tension, can indeed allow for                        Methods used in modelling
the TK domain to help produce increased signal levels long
after the end of an exercise session.
                                                                         We model a resistance training repetition as a piecewise
                                                                     function for force. During the loading phase (start at t = 0),
                 TK domain opens under force
                                                                     the force increases from the initial force f (t = 0) and asymp-
                                                                     totically approaches the maximal force per filament fmax dur-
                                                                     ing the repetition, with a rate k f ≈ 30s−1 . The full-muscle
   Many signaling pathways use a molecular switch to ini-            rate of force development is substantially lower, at ca. 5s−1
tiate a signaling cascade. One of the most common post-              [84], but we assume that there is a lag due to the macroscopic
translational modifications of proteins involves the reversible      muscle providing some slack before macroscopic force de-
addition of a phosphate group to some amino acids (mainly            velopment. It therefore seems likely that the molecular rate
tyrosine); this addition alters the local polarity of the target     of sarcomere force development (which impacts the rate of
protein, allowing it to change its shape and to bind a new sub-      titin being placed under force) is closer to the much faster rate
strate [31]. Phosphorylation can form the basis for signaling        of force increase during muscle tetani. During the unloading
if an input changes the protein’s conformation, from a native        phase, the muscle force decreases with a fast rate (same rate
folded conformation which cannot bind to a phosphate group           as force development for tetani, a bit slower for twitches, but
(often called ‘autoinhibited’), to an ‘open’ conformation in         ultimately insignificant relative to the timescales of a muscle
which the geometry of the molecule allows phosphate groups           repetition). The force per titin as well as the muscle opening
to be donated to the phosphorylation site [26]. The phospho-         and closing rates k− and k+ are calculated at every time step.
rylated protein can then bind to a third substrate molecule, and     Because the TK conformations quickly change during exer-
can either directly catalytically affect or indirectly activate a    cise, the next time step of the numerical integration is adap-
signaling pathway.                                                   tively calculated at each time step as a fraction of the greatest
   Protein unfolding under force has been analysed exten-            fractional change in all of the molecular species in the model.
sively, beginning with studies of in the titin Ig domain [32,        Several repetitions make up a set, and several sets make up an
33]. These experiments show characteristic force-extension           exercise session. The exercise regime is assumed to be adap-
curves, which can help deduce the transition energies between        tive, such that the repetition force on TK remains constant as
conformations for the molecules in question. We note that            the muscle CSA increases.
the Ig domains unfold under quite a high force [32, 34, 35]
and could initially appear to be candidates for mechanosen-
sors. However, very few phosphorylation sites have been
found on the Ig domains, compared with the remainder of the                                II.   THE MODEL
molecule [36], suggesting that they do not contribute to force-
induced signaling, but rather help control the length of the titin     Here we explain why we believe that the kinetic processes
molecule and avoid immediate sarcomere damage under high             schematically shown in Fig. 3 are the necessary elements for
load.                                                                any TK-based treatment of mechanosensing of the second
   Titin kinase was initially thought to be the only catalytic       kind and of subsequent mechanosensitive intracellular signal-
domain on titin [37]. Bogomolovas et al. [38] suggest that TK        ing. Our model can be divided into three parts:
acts as a pseudokinase, simply scaffolding the aggregation of
a protein complex when it is phosphorylated, and allowing                • The opening and phosphorylation of the TK domain.
for another protein to be allosterically phosphorylated. Com-              This stage is highly non-linear because TK opens as a
putational and experimental studies of TK have shown that                  mechanosensitive switch and because the mechanosen-
its force-length response also follows a characteristic step-              sitive complex binds allosterically. The open state is
wise unfolding pattern, but with much smaller steps than those             metastable if the muscle is under a steady-state load.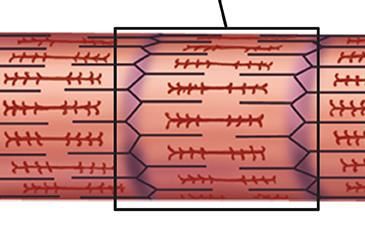
4

    • The creation and degradation of signaling molecules, of         Closed                                    Open
                                                                                                                                      Titin      Phosphate            Glucose
                                                                                                                                                                       (slow)
                                                                                                                                                                                          Creatine
                                                                                                                                                                                         phosphate
                                                                                           k+ (f )
      new ribosomes, and of structural proteins. All of these               nc                                 no                    Kinase       Transfer                                    (fast)
                                                                                      k− (f )                                p+                                           k ATP   → CP
                                                                                                                                                                 kO 2
      rates can be approximated as linear, apart from a size                                              kr        kp
                                                                                                                                                                                          CP
                                                                                 k+ (f )                                 +
      feedback term, which arises because ribosomal diffu-            k− (f )
                                                                                       Phosphorylated
                                                                                                        np = ( no · p )
                                                                                                                                  nbr1
                                                                                                                                                                  ATP

      sion is sterically hindered in large cells (see discussion      Open
                                                                                                   ks
                                                                                                kdn s
                                                                                                                                                                            k CP → ATP
                                                                            no                              n s = (n p · nbr1 α )                        p+
      below).                                                                                                                                                   GDP               GTP
                                                                                                     Signal

    • Exercise can only be so hard before the muscle depletes                                                                             Nucleus
      its short-term energy supplies. The balance between en-               ∅          k ds
                                                                                                            SRF                                                                 Actin
                                                                                                                                   k sr                                   ka             k da   ∅
      ergy generation from oxidative phosphorylation and the                      ∅         k dr
                                                                                                                                          Ribosome biogenesis                     a
      depletion of short-term energy stores has to be consid-
      ered to correctly model the dynamic response.                 FIG. 3. Sketch of the kinetic processes which link titin kinase open-
                                                                    ing and phosphorylation, mechanosensing complex formation, signal
                                                                    activation, ribosome biogenesis and the increased synthesis of struc-
       A.   Opening and phosphorylation of TK domain                tural proteins (of these, only actin is listed for simplicity).

   The energy barrier for the transition between the ‘closed’
native domain conformation, and the ‘open’ conformation
which supports ATP-binding and phosphorylation is the key           examined in Supplementary Information, Part A.6 where they
determinant of the kinetic transition rates between the two TK      are shown to adequately reproduce the phosphorylation kinet-
states. AFM data collected by Puchner et al. [28] is essential      ics of TK measured by Puchner et al. [28], providing an a
here; we match the relevant TK conformations to their data          posteriori justification for their use.
and explain how to extract several important model parame-
ters in Parts A.4 and A.5 of the Supplementary Information.
   In the absence of any signaling, the concentration of total
(free+bound) ATP is constant, and the transitions from closed
to open to phosphorylated TK domain conformations are sim-
ple and reversible:                                                                   B.         Signal generation from phosphorylated TK
    • Closed ↔ Open: TK can open under force with a force-
      dependent rate constant k+ ( f ) and likewise close with
                                                                      The phosphorylated TK domain can bind the zinc fin-
      a force-dependent rate constant k− ( f ). Here we use the
                                                                    ger domain protein nbr1 [41], and begin to form an aggre-
      framework of [27] to derive these two rate constants.
                                                                    gate; the concentration of the signaling complexes ns must
      The concentrations of the closed and open conforma-
                                                                    be introduced with a new separate kinetic equation. The
      tions are nc and no , respectively, cf. Fig. 3.
                                                                    mechanosensing complex identified in the most general for-
    • Open ↔ Phosphorylated: the open state of TK can be            mulation by Lange [41] is a multispecies aggregate, which we
      phosphorylated with a rate constant k p , the total rate of   consider in more detail in Supplementary Part A.7.
      this process depends on both the concentration of ATP            SRF, the mechanosensitive signaling molecule in the Lange
      and of the open TK: [ATP] and no . The phosphory-             model, is known to undergo activation by phosphorylation
      lated state with the concentration np can also sponta-        [42, 43]. There are many phosphorylation sites on nbr1, p62
      neously de-phosphorylate with a rate constant kr , but        and some on MuRF [44], which suggests that SRF could be
      cannot spontaneoulsy close until then.                        activated by phosphate transfer originating from TK. An acti-
This cyclic reaction, illustrated in the TK section of Fig. 3 is    vation would most likely irreversibly alter the conformation
described by the kinetic equations for the evolution of nc , no ,   of the signaling complex, and result in the disassembly of
and np :                                                            the complex every time a new signaling molecule was acti-
                                                                    vated. Assuming that the complete mechanosensing complex
            dnc                                                     has a time-independent probability to disassemble, with a rate
                 = −k+ nc + k− no                            (1)    kdns ns , we estimate the corresponding rate constant kdns from
             dt
            dno                                                     experiments [45] that show the increase in phospho-SRF (ac-
                 = k+ nc − k− no − k p no [ATP] + kr np      (2)    tivated signal) after exercise. They find that the level of acti-
             dt
                                                                    vated SRF binding to DNA increases by a factor of 2 an hour
            dnp
                 = k p no [ATP] − kr np                      (3)    after skeletal muscle cell contraction, and reaches half of its
             dt                                                     maximum increase after 10 minutes of exercise. This means
            nc + no + np = ntitin (constraint) ,             (4)    that the degradation rate of the mechanosensing complex oc-
                                                                    curs with a half-life of ca. 10 minutes (kdns ≈ 1/600 s−1 ).
where the last condition encodes the total concentration of TK
units; this is equal to the concentration of titin and remains         We can now rewrite our kinetic equations to add the forma-
constant on the time-scale of signaling. These equations are        tion and degradation rates of the signaling complex as well as
5
the activation of the SRF signal: temporary increase in mRNA transcript number) which allows
for this ‘time integration’ of the signal. Its effect would be to
dnc suppress fluctuations in the concentration of TK conforma-
= −k+ nc + k− no (1)
dt tions or signaling molecules, smoothly increasing the concen-
dno tration of the structural muscle proteins over the time similar
= k+ nc − k− no − k p no [ATP] + kr np + kdns ns (2b)
dt to the half-life of ribosomes. We suggest that this effect could
dnp help explain the delay of a few weeks between starting re-
= k p no [ATP] − kr np − ks np (3b) sistance exercise and the first detection of measurable muscle
dt
dns growth, as noted by trainers and rehabilitation specialists.
= ks np − kdns ns (5)
dt New experiments show that sarcomeric proteins are synthe-
nc + no + (np + ns ) = ntitin (constraint) (4b) sised in situ at the sarcomeric Z-line and M-band [50]. As far
dnSRF as we are aware, ribosomal subunits can only move by diffu-
= kdns ns − kds nSRF . (6) sion, whereas mRNA can be actively transported to the syn-
dt
thesis site. The inhibition of the diffusion of ribosomal sub-
The concentration of ATP is expressed in number per titin: to- units by the myofilament lattice [51] could reduce the synthe-
tal phosphate is assumed to scale proportionately to the size sis of new sarcomeric proteins by a sizeable amount (5−10%)
of the myofibril and the number of titin molecules. In Supple- in adult myocytes. The fractional reduction in titin synthesis
mentary Part C, we also track the kinetics of ATP depletion can be written in the form −αntitin , where the coefficient α
during intense exercise. The additional equations are mathe- depends on the ribosome diffusion constant, the lattice spac-
matically more complicated, and do not help understand the ing and the rate of lysosomal degradation. This term has sev-
full model, but are included in the numerical simulations in eral important consequences: it provides a bound on muscle
the Results section. growth or shrinkage, and it affects the speed of muscle size
These are the core equations which describe the relatively adaptations. We examine this point in more detail in Supple-
fast activation of a signaling molecule during muscle load- mentary part B.4.
ing. We show in the Results section below that they display
We use the number of titin molecules ntitin in the muscle fi-
a very pronounced switching behavior: in other words, small
bre cross-section as a proxy for the muscle fibre CSA, because
changes in tension result in large changes to the signal concen-
the hierarchical sarcomere structure is well-conserved in most
tration. We also find that these equations support an increase
muscles at rest. When necessary, one can convert from one to
in the concentration of signal (possibly SRF) for a substantial
the other as in Fig. 1. The above equations are combined as
time of the order of a couple of days, which could help account
follows (more details in Supplementary Part B):
for the immediate increase in protein synthesis post-exercise.
But we shall see in the next section that a simple one-step sig-
nal cannot by itself account for the observed time-dependence dnc
of hypertrophy. = −k+ ( f )nc + k− no (1)
dt
dno
= k+ nc − k− no − k p no [ATP] + kr np + kdns ns (2b)
C. Muscle protein synthesis after mechanosensor signaling dt
dnp
= k p no [ATP] − kr np − ks np (3b)
The constituent molecules of most signaling pathways have dt
dns
a short lifetime relative to that of the structural proteins. It is = ks np − kdns ns (5)
also well documented that a few bouts of exercise do not have dt
a tangible effect on muscle volume, and that muscle takes at nc + no + (np + ns ) = ntitin (4b)
least a few of weeks to begin to show visible hypertrophic dnSRF
adaptations. The debate on whether true hypertrophy is soon = kdns ns − kds nSRF (6)
dt
detected, or whether initial post-exercise changes in muscle dnrRNA
CSA are the signs of muscle micro-damage, is a rather fraught = ksr nSRF − kdr nrRNA (7)
dt
one [46–49]. Three weeks of resistance training appears to dntitin
be a consensus time, after which true hypertrophy is actu- = kst nrRNA (1 − αntitin ) − kdt ntitin (8)
dt
ally detected. This means that there has to be a way of ‘in-
tegrating’ the signal over such a long period of time – be-
yond the scope of the simple force-integration supported by In the Supplementary Part E, we consider the possibility that
a metastable open state of TK. Here we combine the above the force produced by the muscle does not scale linearly with
model of mechanosensitive signaling with a simple model of muscle size. It is unclear exactly how much active muscle
protein synthesis from a signaling molecule, and propose a force scales with muscle size. Krivickas et al. [6] find that
mechanism by which this integration may occur. force increases slower at larger muscle CSA, whereas Akagi
Based on a review and discussion of the current literature et al. [52] do not see a substantial non-linearity between force
in the Supplementary Information, Part B.2, we conclude that and myofibre volume. So in the main body of this paper we
it is likely an increase in ribosome biogenesis (rather than the proceed with the simplest assumption of the linear scaling.6
30
TABLE I. Values of rate constants, directly obtained in experiments 6
or simulations or extrapolated from the data presented. 2
28 4
Constant Value (s−1 ) Source
kp 0.07 M−1 [28]
kr 6 [28]
u max (nm)
26
ks 10−8 − 10−6 [53]
kdns 0.002 [41, 45] 8
kds 10−5 [54] 24
kst 10−5 [57–59] 5
3
kdt 4 · 10−6 [60]
22
ksr 0.1 [61] 7
kdr ca. 9 · 10−7 [62, 63] 9
10
20
25 30 35 40 45 50 55 60
III. RESULTS G 0
The steady-state load required for the muscle to maintain FIG. 4. Steady-state force (expressed in pN, labelled in contour lines)
homeostasis can be obtained analytically. Once we have ‘ze- from (9) as a function of the TK activation energy ∆G0 and the open-
ing distance of the mechanosensor umax . ∆G0 is expressed in di-
roed’ our problem by checking that this value makes sense in
mensionless units scaled by the thermal energy β = 1/kB T , with
terms of steady-state tension (muscle tone), in sections B and T = 310K. The values of rate constants are given in Table I, and
C, we consider the dynamics of equations (1-5) for TK only, the following typical concentrations were used: p+ = 2000 per titin,
to show that it does indeed open as a metastable mechanosen- nbr1st = 0.1 per titin, σ = 0.5, these are from the appendix and will
sitive switch. Following that, we will proceed to study what confuse the reader. The circle marks the ‘sweet spot’ where the likely
effects different types of resistance exercise have on muscle values of umax and ∆G0 should be.
fibre CSA, and compare them with reports from the literature.
Combining supplementary part A.2, A.3 (maximum thick
A. Steady State filament force) and A.4 (titin force in terms of thick filament
force), we estimate the force per titin during a contraction at
The steady-state solution to equations (1-8) is obtained in the maximum voluntary contraction (MVC) to be ≈ 25pN. In
Supplementary Part D. We find the following tension per in- the low-load regime, there is very little active muscle force
dividual TK domain: (otherwise known as muscle tone), perhaps only 1-2% of the
∆G0 kB T (kr + ks ) MVC force [64] (only at most ca. 1-2pN per TK if titins were
f= + ln k k +k (9) to bear most of the load), which matches well with the relative
umax umax k p [ATP] ζ − 1 − kdns − k r[ATP]
s
s p oxygen consumption in resting muscle [65]. When sarcom-
eres operate at their optimal length, a non-negligible passive
where the shorthand ζ is the ratio of synthesis to degradation tension is developed by – amongst other effects – the exten-
coefficients: sion of titin [66]. In this regime, most of the load originates
kst (1 − αntitin )ks ksr from this baseline stretch in the sarcomeres: indeed, White-
ζ= . (10) head et al. [67] found that passive tension at the optimal sar-
kdt kdr kds
comere length was of the order of 5-10% of the MVC force.
The first key result here is that the force on the TK domain, The passive tension value is much more consistent with our
which maintains a steady state muscle fibre CSA, is deter- estimate for the resting tension per titin in the steady-state (see
mined almost exclusively by two parameters: the energy bar- Fig. 4).
rier ∆G0 between the closed and open conformations of the Note that the passive force in the resting sarcomere can be
TK domain, and the unfolding distance umax . It is clear that substantially dialled by changing the stiffness of titin: the in-
changing any of the coefficients in the logarithm in (9) would creased tension of the resting muscle would allow it to adjust
only have a minor effect on the steady-state force. The typical to resistance training much more readily. The titin stiffness
resting muscle forces are plotted in Fig. 4 as a function of ∆G0 slowly diminishes after exercise, but the temporary increase
and umax (illustrated in Fig. 5 of the Supplementary Material). in stiffness could also contribute to the ‘time-integration’ of
The typical homeostatic force experienced by a TK domain is the mechanosensitive signal. This complication is beyond the
of the order of 2-10pN. scope of our model.
The other key point is that a small change in the muscle
steady-state force (perhaps supported by an increase in ten-
don tension, which lengthens the sarcomeres) can maintain B. Titin kinase as a metastable mechanosensitive switch
a large change in muscle size. The fractional change in the
steady state muscle tone as a function of the fractional change In Fig. 6, we see that TK obeys switching kinetics: above
in muscle size is plotted in Fig. 5. a critical load, its closed conformation is no longer favoured.7
Δ fst / fst n i /n titin no
}
G0=20 1 nc
np
0.010 30 0.001
6 ns
40 10
0.005 50
60 10 9
70
0 10 12
0 1 2 3
Δ n titin / n titin 10 15
-0.005 G lower G higher f titin (pN)
2 4 6 8 10
FIG. 5. Fractional change in steady state muscle force (vertical axis)
vs fractional change in muscle size (horizontal axis), from (9). Note FIG. 6. Log-plot of the steady-state concentration of the TK confor-
that ∆ntitin = −ntitin (the left limit of the axis) represents a complete mations (blue - closed, red - open, orange - phosphorylated, green
degradation of the muscle. The values of opening energy ∆G0 are - bound to the mechanosensor complex) as a function of the steady
labelled on the plot. The values of rate constants are given in Table I, state force per titin, from (9). As the steady-state force increases,
and the following typical concentrations were used: p+ = 2000 per the preferred conformation of TK switches from closed to a fixed
titin, nbr1st = 0.002 per titin, σ = 0.5. The maximum opening dis- ratio of open, phosphorylated and signaling complex-bound. This
tance of TK was taken as umax = 27 nm. The values for ∆G0 and umax plot is for ∆G0 = 35kB T . Note that the molecule switches from
were estimated from AFM data and molecular dynamics simulations being preferably closed to preferably open/phosphorylated/signaling
conducted by Puchner et al. [28] in Supplementary Part A.5. slightly above the steady-state force of a few pN. But even though the
steady-state conformation may be favoured at forces even slightly
above the resting muscle tension, titin takes a long time to open
However, the low TK opening and closing rates k+ and k− enough to actually signal in large numbers, because the opening rate
plotted in Fig. 7 do not allow TK to quickly change between k+ is much less than 1 s−1 at low- and medium forces (see Fig. 7 for
an illustration of this behaviour).
its conformations at physiological loads. If resistance exer-
cise increases the number of open TKs, their number will
remain elevated up to days after exercise; in other words, k ± ( s-1) G0=20
1 25 30
the TK open/phosphorylated/signalling complex-bound state 35
is metastable. We use numerical simulations to explore this 0 .0 0 1 40
point further in the next section. 45
TK signaling increases linearly with exercise duration (bar- 1 0 6
ring the effects of fatigue), whereas opening rates (and sig- 1 0 9
nalling) increase exponentially with force in TK. While TK
force scales roughly linearly with myosin force (see Fig. 3 1 0 1 2
in the Supplementary Material), this allows mechanosensitive f titin ( p N )
1 0 1 5
signaling to increase much faster than the corresponding en- 0 20 40 60 80 100
ergetic cost at high exercise force. At very high forces, how-
ever, it appears that TK force increases much more slowly FIG. 7. Log-plot of the closing rate k− (brown), and opening rates k+
than myosin force, leading to a plateau in the efficiency of for different values of activation barrier ∆G0 , as labelled on the plot.
mechanosensitive signalling (Fig. 4 in the Supplementary Ma- Even when TK opening is favoured, at k+ > k− , the opening rates are
terial). Excluding mechanosensitive signalling at the steady- much less than 1 s−1 , meaning that TK opens linearly with increasing
time under load, and exponentially with increasing force. We suggest
state force (which is efficient because thick filament force is
that this behaviour is the basis for high intensity resistance training:
low, but does not do much to change muscle CSA), signal- doubling the force increases mechanosensitive signaling by several
ing in response to resistance training is always more effec- orders of magnitude.
tive as the load increases until at least about ≈ 70% of the
MVC force. Our current model does not extend to how mus-
cle fatigue induces changes in muscle stiffness [68, 69], which
sessions with 8-12 repetitions to failure over 3 sets). Choos-
could alter TK signaling kinetics at high forces as well.
ing a specific value of repetition force is not straightforward
because while most force studies consider MVC force, most
hypertrophy programs compare the training load to the single-
C. Long-term mechanosensitive signaling and response repetition maximum load for a given exercise. The muscle
force during one full repetition is necessarily smaller than the
In order to compare with experimental data in the literature, instantaneous force. Determining the corresponding force per
we consider a ‘typical’ resistance exercise session consisting TK might be further complicated because titin is under more
of 3 sets of 10 repetitions (more details in the Methods section load when the muscle is stretched (passive force) than when it
below). This mimics a common resistance training program is actively contracting. Nevertheless, our choice of 20 pN per
(see e.g. DeFreitas et al. [46], who set up resistance training titin seems to be supported by several factors discussed here8
0.003 25
20
Fraction of open TK, n o
20
15 0.002
Force (pN)
Force (pN)
15
10
10
0.001
5
5
(a) 0
-2 0 2 4 6 8 10 12 14 0 0
0 0.5 1 1.5 2 2.5 3 3.5
Time (min)
0.004 Time (min)
Fraction of open, phosphorylated TK
no+n p+n s FIG. 9. The first set of 10 ten-second repetitions from Fig. 8. Note
0.003 that the repetitions become shorter as ATP runs out during the period
np of high load: as the ATP level falls below a critical value (which
we set to a half of the homeostatic level), the muscle can no longer
0.002 sustain the load and the only possibility is to drop the weight and
return to the steady-state force. So the period of loading becomes
shorter than the prescribed period, shon in dashed line in the plot and
0.001 arrows marking the prescribed period.
no
0
-2 0 2 4 6 8 10 12 14 sis in the two days following exercise, specifically resistance
(b)
Time (min) training [70, 71].
The important aspect of exercise, naturally reflected in our
FIG. 8. Simulation of an exercise session involving three sets of 10 model, is the effect of fatigue. To make it more clear, we
ten-second repetitions. (a) All repetitions are performed at the same plot the same data as in Fig. 8, zooming in to just one (the
force per titin, but their duration is cut short upon reaching exhaus- first) set of repetitions in Fig. 9. Both myosin motors increase
tion. As the number of titins increases, we assume that the training their ATP consumption under the high load, and the freshly
regime adapts by proportionately increasing the repetition force. (b)
open TK domains require ATP for phosphorylation. During
The depletion of ATP leads to a temporary drop in phosphorylated
TK during exercise. However, the sum of open, phosphorylated and the high-intensity loading, the level of ATP could drop be-
signaling complex-bound TK steadily increases during the exercise. low a critical value, after which the muscle would no longer
Since the closing rate of TK is quite low (of the order of 10−5 s−1 , de- be able to maintain the force: the only option is to drop the
pending on the number of attempts at crossing the energy barrier and weight and return to the steady-state force recovery stage. We
the barrier height ∆G0 ), the baseline concentrations of phosphory- see that this effect of fatigue occurs after a few repetions in
lated and signaling TK conformations remain elevated after exercise. Fig. 9. We also find, in this simulation of model exercise, that
subsequent sets of repetitions have this fatigue-driven cutoff
of the later loading periods becoming less pronounced, be-
and in the Supplementary Information. cause the overall level of ATP marginally increases during the
We simulate a typical exercise session as a fixed number session.
of repetitions at a given force, grouped into a fixed number In Figs. 10 and 11, and afterwards, we return to measuring
of sets, as shown in Fig. 8(a) (more details in the Methods the muscle ‘size’ directly by the CSA of a fibre (by converting
section). During each repetition, the opening rate k+ of TK to that from the measure of titin molecules, which is equiva-
becomes much greater than its closing rate, which decreases lent but carries less intuitive appeal). Since the volume of a
the proportion of closed TK and increases its propensity to myonuclear domain is close to 16000 µm3 , and remains con-
signal. Because the muscle is under a combination of passive served in a developed adult muscle [72], and the density of
and active tension at rest, the closing rate of titin is small after titins is also an approximate constant (ca. 3000 per µm3 ), see
exercise, even though it is greater than the opening rate (see Fig. 1 – or in an alternative equivalent estimate: the density of
Fig. 7). This allows TK to revert to its steady-state confor- titins across the unit area of CSA (ca. 6000 per µm2 ) – allows
mation after a time of the order of hours to days, in a manner quantitative measure of CSA as our output.
which depends on the number of attempts at crossing the en- Also note, that since in this test we are applying a constant
ergy barrier between the closed and open conformations (see force per titin, and the CSA increases with time, this means
Supplementary Part A.5), as well as the height of the activa- that the actual exercise load to the whole muscle must be in-
tion barrier ∆G0 . The metastability of the open state at steady- creasing proportionally (in our current simplified model the
state tension would then naturally allow the muscle to produce relation between CSA and ntitin is linear) to achieve the opti-
a mechanosensitive signal long after the end of exercise. This mal growth.
might account for the increase in myofibrillar protein synthe- In Fig. 10 we test the long-term consequences of a regu-9
5.4 28
Muscle fibre CSA (1000 m 2 )
Muscle fibre CSA (1000 m 2 )
30
5.2 35 8
5 7
4.8
G0=40 6
4.6
5 tex=2 days
4.4
tex=3 days
4.2 4 tex=4 days
tex=6 days
4 tex=12 days
0 200 400 600 800 1000 3
(a) Time (days) 0 500 1000 1500
(a) Time (days)
Muscle fibre CSA (1000 m 2 )
G0=28
8 tex=2 days
30
Muscle fibre CSA (1000 m 2 )
4.20 tex=3 days
7 tex=4 days
35 tex=6 days
4.15 tex=12 days
6 40
42
5 4.10
4 4.05
3 4.00
0 500 1000 1500 2000 2500 3000 3500
(b) Time (days) 3.95
0 5 10 15 20 25 30 35 40
FIG. 10. Time course of muscle growth in response to a regular re- (b) Time (days)
sistance training program (exercise of Fig. 8, every 3 days). (a) The
total muscle load F is kept constant, so the force per titin f effec- FIG. 11. Time course of muscle response for different exercise fre-
tively diminishes as the CSA increases. (b) The force per titin f is quencies. Here we take β ∆G0 = 35 (see Fig. 10), and a representative
maintained constant (20 pN, as discussed before), which effectively value of ribosome diffusion inhibition αntitin = 0.1 (see discussion
implies that the total muscle load F increases in proportion with CSA in Fig. 12 for further details). (a) Full duration of the simulation:
(vertical axis). Several curves for different values of the energy bar- the muscle CSA asymptotically tends to a steady-state after a few
rier ∆G0 are labelled on the plot. As might be expected, muscle years. (b) The onset of muscle hypertrophy lags the start of the ex-
CSA changes are faster and greater in magnitude if the energy bar- ercise regime by about a week, because TK opening rates are slow,
rier ∆G0 is smaller (i.e. TK opens faster during exercise, and signals and because the signal is ‘integrated’ by a combination of SRF and
to a greater extent). We overlay the predictions of our model with ribosomes. The initial rate of change of the muscle CSA can be com-
measurements of fractional changes in muscle CSA over an 8-week pared with experiments, which show ≈ 1% CSA changes per week
period, measured by De Freitas et al. [46] (red crosses, same values in response to high intensity resistance exercise [74]. This simula-
in both prlots). An initial force per titin of 20 pN matches well with tion shows a similar rate of CSA change, which means that a TK
real data, showing a ca. 1% growth per week. maximum force of ≈ 20 pN during high-intensity resistance exercise
could produce an adequate signal for muscle hypertrophy to occur.
Because of the switch-like nature of TK, it is unlikely that this max-
imum load on TK be too different from 20 pN. This force value is
lar resistance training program (the standard model exercise consistent with a picture where the myosins bear most of the load
as in Fig. 8(a) repeated every 3 days). Several curves are pre- during active muscle contraction and titin acts as a parallel stretch
sented, showing the final homeostatic saturation level, and the sensor.
time to reach it, dependent on the key model parameter: the
energy barrier ∆G0 for TK opening. The earlier discussion
based on the data obtained by Puchner et al. [28], and the crease is about 30% (assuming ∆G0 = 30kB T ). In the adaptive
structural analogy between TK and FAK [26, 73], suggest that exercise, the final saturation is reached much slower, but the
∆G0 could be around 30kB T (or ca. 75 kJ/mol). total CSA increase is about 88%: almost doubles the muscle
The comparison between plots (a) and (b) in Fig. 10 is im- volume in about 2 years time. It is reassuring that the experi-
portant. As our model relies on the value of force per titin mental measurement of De Freitas et al. [46] of CSA growth
f , the total load on the muscle is distributed across filaments over a period of 8 weeks, in a similar exercise regime, quanti-
in parallel across CSA. So if one maintains the same exercise tatively agrees with our prediction of ca. 1% CSA increase a
load, the effective force per titin diminishes in proportion to week in the initial period.
the growing CSA, the result of which is shown in plot (a). In The regularity of the exercise has a strong effect: the long-
contrast, one might modify the exercise by increasing the to- term magnitude of hypertrophy predicted by the model is af-
tal load in proportion with CSA – plot (b) shows the result fected by what happens on the daily basis. Fig. 11(a) com-
of such an adaptive regime. In the non-adaptive case, the fi- pares the long-term results when the interval between the
nal saturation is reached in about a year and the total CSA in- model exercise ∆tex varies from frequent, to very sparse bouts10
(the ∆tex =3 days case is Fig. 10). We find that the extent initial
Muscle fibre CSA (1000 m 2 )
of muscle hypertrophy is roughly linearly dependent on the 9 n titin=0.05
n titin=0.1
exercise frequency. 8 n titin=0.15
We have seen that the TK mechanosensor can increase the n titin=0.2
rate of signal activation for an extended period of time af- 7 n titin=0.25
ter exercise. But this signal does not directly correlate with n titin=0.3
6
protein synthesis in the immediate aftermath of exercise. In
particular, there is a known lag between the start of an exer- 5
cise regime and the detection of muscle hypertrophy [48, 49]. 4
This lag can be accounted for in our model if ribosomes are
the main factor limiting an increase in protein synthesis, and 3
0 1000 2000 3000 4000
must be made more abundant before hypertrophy can occur, Time (days)
see Fig. 11(b). The remainder of the results section uses the
full model which includes SRF (signaling), ribosomes and FIG. 12. Time course of muscle growth and loss (starting after 600
titin number. days of hypertrophy) in response to a regular resistance training pro-
gram (every 3 days) with 3 sets of 10 repetitions at 20 pN per titin
(our estimate of ≈ 70% 1RM), followed by detraining. The diffusive
D. Adaptations to resistance training exercise feedback depends on the degree of sarcoplasmic titin degradation,
which in turn increases with myonuclear domain size and lysosomal
activity. Slow detraining may combine with an initial fast loss due
We showed in section 2.A above that constant titin kinase to atrophic conditions (see below). In this case a 5 − 10% ribosome
mechanosensing at the steady state muscle tension allows the degradation en-route to the titin synthesis sites (0.05 < αntitin < 0.1)
muscle to maintain its size. In order to consider dynamic appears to support training and detraining at the correct rates, see
changes in muscle size, we must first assure ourselves that [7, 46, 75, 76].
it reaches a new steady-state; secondly, that it predicts that
muscles grow with the correct time-dependence; and finally,
we must check whether the model predictions for the mag- E. Atrophy and recovery from bedrest or microgravity
nitude of change in muscle size are in the reasonable range,
given that we have no free parameters (all rate constants and When the body is subjected to bed-rest, microgravity [79],
concentrations are independently known). famine [80], or as the consequence of several pathologies [81],
In Fig. 12, we see that both muscle growth during the ex- muscle size can very rapidly decrease. Any mechanism which
ercise program, and muscle detraining after exercise program increases degradation rates (SRF, ribosomes, titin degradation
ends, are strongly dependent on the feedback from the slow rates in our model, see Table I) will necessarily cause atrophy,
diffusion of ribosomes across the large and sterically hindered and our model confirms this (see Supplementary Part E for
sarcoplasm. Greater muscle fibre CSA at the start of train- detail).
ing implies more ribosomal diffusion blocking, hence a higher Extended periods of bed-rest and microgravity are the more
hindrance term αntitin – resulting in a faster, lower magnitude interesting atrophy-inducing conditions to study in the context
response to the same training load. This behaviour is qualita- of mechanosensing, as it is the sudden lack of tension, which
tively observed in the literature: strength trained athletes re- promotes muscle degradation. In other words, the steady-state
spond to a much lesser degree to a resistance training regime, force applied to the muscle (the homeostatic tone) is suddenly
see e.g. [74]. decreased, and the muscle metabolism responds. We find a
After stopping a resistance training programme, muscle quick decrease in muscle CSA after a series of drastic param-
CSA slowly decreases, eventually returning to its pre-trained eter changes at the start of our simulations, but it is the kinet-
homeostatic value. The time course of detraining is harder ics of muscle recovery after atrophy which appear to be more
to investigate. Low values of two months [7, 75] for skeletal dependent on the type of feedback in the model. In practice,
muscle, to several years for recovering hypertrophic cardiac muscle is seen to recover relatively rapidly after very substan-
muscle [76], have been reported. In our model, we observe tial atrophy, with most of the recovery occurring over a 1-2
reasonable time-courses which match this range for detrain- week period [82]. Fig. 13(a) shows our model predictions
ing for a 5-10% degradation of ribosomes before they arrive with the simplifying assumption that there was no feedback
at the sarcomere, or for very low force feedback in the range relationship between muscle force per fibre and the CSA in
of 0.001 < µ < 0.005 (see Fig. 12). the case of hypertrophy. The curves show a response to a very
There are some exceptions to this: career athletes main- small decrease of steady-state tone (maximum 0.5% in black
tain significantly higher muscle CSA a long time after retiring curve), and recopvery when fst returns to its value prescribed
[77], and the body maintains a memory of prior resistance by the (9) after 120 days. A very slow recovery of homeostatic
training events [78] by changing its methylome. It seems muscle CSA is found, not in agreement with observations.
likely that the body can develop and maintain a higher resting However, once we include the feedback, when the force
muscle tone if chronic resistance training changes the molec- per filament decreases with an increasing CSA, the rate of re-
ular architecture of the muscle. This complication is beyond sponse becomes much more realistic, see Fig. 13(b). Here a
the scope of our model. much greater force increase is applied (up to 5% in the black11
4.5 IV. DISCUSSION
Muscle fibre CSA (1000 m 2 )
4
In this work, we developed a kinetic model combining the
intracellular mechanosensor of the 2nd kind, the signalling
3.5
chain pathway (admittedly one of several). with the riboso-
mal kinetics of post-transcription synthesis – to examine how
3 fst 0.9999f st muscles sense and respond to external load. The important
fst 0.9995f st factor of limitations to ATP supply, which affects both the
fst 0.999f st
2.5 MVC level due to myosin activation and the signalling due
fst 0.998f st
fst 0.995f st to phosphorylation, is included in the background (see Fig. 3
2 and Supplementary Part A). The primary marker of morpho-
0 100 200 300 400 500
(a) logical response for us is the cross-section area (CSA) of an
average muscle fibre, which is directly and linearly mapped
6 onto the number of titin molecules per fibre. We suggest that
the titin kinase (TK) domain has the right characteristics to
Muscle fibre CSA (1000 m 2 )
5 play the role of the primary mechanosensor within the muscle
cell. By looking at how TK unfolds under force, we found that
4 it acts as a metastable switch, by opening rapidly only at high
forces, but opening and closing slowly within a range of phys-
3 iological forces. The muscle is known to apply a low-level
fst 0.999f st
fst 0.995f st tensile force, and be under a steady-state passive tension at
2
fst 0.99f st rest, which we compare with the steady-state force predicted
1 fst 0.98f st by our model. We find that the two forces are of the same mag-
fst 0.95f st nitude, which suggests that long-term muscle stability is due a
0 combination of the active muscle tone and the passive muscle
0 100 200 300 400 load stored in elastic sarcomere proteins – notably titin. We
(b)
Time (days) find that small changes in the steady-state force allow the mus-
cle to maintain its size after the end of a resistance training
FIG. 13. Time course of muscle atrophy as the steady state force fst programme, and we suggest that this change in steady-state
(discussed in (9) and Fig. 4) is suddenly diminished from the steady muscle tension might account for some of the ‘memory’ that
state value to a lower value. In this simulation, after 120 days, the muscle develops after long-term training [77, 78].
force is brought up to its steady state value again. The recovery speed
depends on exactly how the muscle force scales with muscle CSA Given the switch-like nature of TK, it seems likely that
during atrophy, the ‘force feedback’ discussed in Supplementary Part different individuals will have slightly different predisposi-
B.4. (a) The case of negligible force feedback (µ = 0.005) leads to tions towards applying somewhat more or less muscle tone in
an unphysiologically slow rates of atrophy and recovery, over sev- homeostasis, and therefore can maintain muscle mass much
eral months. (b) Higher force feedback (µ = 0.02) leads to a much more or much less easily. This low-level steady-state tensile
more reasonable recovery rates, which we consider close to clinical force will crucially depend on the number of available myosin
observations. heads and on the steady-state ATP concentration in the cell, as
well as sarcomere and tendon stiffness.
Our model shows qualitatively reasonable time courses for
hypertrophy, developing during a regular exercise regime, fol-
lowed by detraining as well a muscle atrophy followed by re-
covery. Although it is not explicitly included in the current
curve), and we see both the atrophy onset and the recovery
model, long-term changes in muscle architecture (slightly in-
reaching the saturated steady state values within 60 days. This
creasing the muscle tone with the same CSA), as well as in-
suggests that a reasonable force feedback scale (with the pa-
creases in myonuclear number after chronic hypertrophy (in-
rameter µ ∼ 0.02 or even higher, see Supplementary Part E
creasing the synthesis rates in the model), could cooperate to
for detail) is a required feature of our model, if quantitative
increase the steady-state muscle CSA. This could then provide
predictions are to be obtained.
a rationale for the observed permanent increase in muscle size
after just one bout of resistance training in the past [83]. The
An unexpected feature of plots in Fig. 13(b) is the muscle model uses no free-fitting parameters, since all its constants
‘overshoot’ during the fast recovery after atrophy. It seems are independently measurable (indeed, Table I gives examples
likely that the several intrinsic processes have low rate but of such measurements). Obviously, there would be a large
high sensitivity, resulting in muscle keeping a memory of its individual variation between these parameter values, and so
previous architecture during atrophy, much like the career- applying the quantitative model predictions to an individual is
trained athletes whose muscle CSA remains higher than nor- probably optimistic. However, we are excited to offer a soft-
mal after retirement. This would translate into a correspond- ware to implement the model and make specific predictions
ing increase in the muscle force at smaller muscle CSA. in response to any chosen ‘exercise regime’, which could beYou can also read


