The Galactic center chimneys: The base of the multiphase outflow of the Milky Way
←
→
Page content transcription
If your browser does not render page correctly, please read the page content below
Astronomy & Astrophysics manuscript no. Radio-to-X-rayChimneys                                                                     ©ESO 2021
                                               January 15, 2021

                                                                          The Galactic center chimneys:
                                                                The base of the multiphase outflow of the Milky Way
                                                                        G. Ponti1, 2 , M. R. Morris3 , E. Churazov4, 5 , I. Heywood6, 7, 8 , and R. P. Fender6

                                                     1
                                                         INAF-Osservatorio Astronomico di Brera, Via E. Bianchi 46, I-23807 Merate (LC), Italy
                                                         e-mail: gabriele.ponti@inaf.it
                                                     2
                                                         Max-Planck-Institut für Extraterrestrische Physik, Giessenbachstrasse, D-85748, Garching, Germany
                                                     3
                                                         Department of Physics and Astronomy, University of California, Los Angeles, CA 90095-1547, USA
                                                     4
                                                         Max-Planck-Institut fur Astrophysik, Karl-Schwarzschild-Str. 1, D-85748, Garching, Germany
                                                     5
                                                         Space Research Institute (IKI), Profsoyuznaya 84/32, Moscow 117997, Russia
arXiv:2101.05284v1 [astro-ph.GA] 13 Jan 2021

                                                     6
                                                         Astrophysics, Department of Physics, University of Oxford, Keble Road, Oxford OX1 3RH, UK
                                                     7
                                                         Department of Physics and Electronics, Rhodes University, PO Box 94, Makhanda, 6140, South Africa
                                                     8
                                                         South African Radio Astronomy Observatory, 2 Fir Street, Black River Park, Observatory, Cape Town, 7925, South Africa

                                                    Received October 9, 2020; accepted December 25, 2020

                                                                                                                ABSTRACT

                                                    Context. Outflows and feedback are key ingredients of galaxy evolution. Evidence for an outflow arising from the Galactic center
                                                    (GC) – the so-called GC chimneys – has recently been discovered at radio, infrared, and X-ray bands.
                                                    Aims. We undertake a detailed examination of the spatial relationships between the emission in the different bands in order to place
                                                    constraints on the nature and history of the chimneys and to better understand their impact on the GC environment and their relation
                                                    with Galactic scale outflows.
                                                    Methods. We compare X-ray, radio, and infrared maps of the central few square degrees.
                                                    Results. The X-ray, radio, and infrared emissions are deeply interconnected, affecting one another and forming coherent features on
                                                    scales of hundreds of parsecs, therefore indicating a common physical link associated with the GC outflow. We debate the location
                                                    of the northern chimney and suggest that it might be located on the front side of the GC because of a significant tilt of the chimneys
                                                    toward us. We report the presence of strong shocks at the interface between the chimneys and the interstellar medium (ISM), which are
                                                    traced by radio and warm dust emission. We observe entrained molecular gas outflowing within the chimneys, revealing the multiphase
                                                    nature of the outflow. In particular, the molecular outflow produces a long, strong, and structured shock along the northwestern wall
                                                    of the chimney. Because of the different dynamical times of the various components of the outflow, the chimneys appear to be shaped
                                                    by directed large-scale winds launched at different epochs.
                                                    The data support the idea that the chimneys are embedded in an (often dominant) vertical magnetic field, which likely diverges with
                                                    increasing latitude. We observe that the thermal pressure associated with the hot plasma appears to be smaller than the ram pressure
                                                    of the molecular outflow and the magnetic pressure. This leaves open the possibility that either the main driver of the outflow is more
                                                    powerful than the observed hot plasma, or the chimneys represent a "relic" of past and more powerful activity.
                                                    Conclusions. These multiwavelength observations corroborate the idea that the chimneys represent the channel connecting the quasi-
                                                    continuous, but intermittent, activity at the GC with the base of the Fermi bubbles. In particular, the prominent edges and shocks
                                                    observed in the radio and mid-infrared bands testify to the most powerful, more recent outflows from the central parsecs of the Milky
                                                    Way.
                                               1. Introduction                                                           phase interstellar medium (ISM) can be launched from galactic
                                                                                                                         centers and disks into outflows that replenish galactic coronae,
                                               Outflows and feedback are vital ingredients for the forming and           haloes, or even the intergalactic medium with plasma, energy,
                                               growing of galaxies as we observe them today. Outflows are re-            metals, etc. (Naab et al. 2017). This involves understanding the
                                               quired in order to connect the activity in the cores and disks            complex physics of galaxies and their multiphase gas.
                                               of galaxies with the hot, slowly recondensing plasma in their
                                               haloes, thereby fostering the evolution of galaxy morphologies                 The detection of hints of an outflow from the Galactic cen-
                                               (White et al. 1978; 1991; Putman et al. 2012; Tumlinson et al.            ter (GC) dates back to the 1980s, when sensitive radio maps re-
                                               2017). Such feedback links the growth of the central supermas-            vealed features with an extent of a few degrees (such as the so-
                                               sive black holes with their coevolving galaxy (Ferrarese & Mer-           called expanding molecular ring and the Galactic center lobe;
                                               rit 2000; Gebhardt et al. 2000; Kauffmann et al. 2003).                   GCL), which were originally attributed to large energy releases
                                                    As a prototype for typical spiral galaxies, the Milky Way of-        from the core of the Milky Way (Kaifu et al. 1972; Scoville
                                               fers a unique opportunity to capture the important details of such        1972; Sofue 1984; 1985; 1989). Subsequently, the combination
                                               feedback all the way from sub-parsec to galactic scales. Indeed,          of X-ray (ROSAT) and mid-infrared (IRAS and MSX) observa-
                                               as the Milky Way is located at a distance of only 8.25 kpc (Grav-         tions strengthened this hypothesis, revealing a limb-brightened
                                               ity Col 2020; see also Do et al. 2019, who suggested ∼ 7.97 kpc),         bipolar structure, possibly the outcome of a large-scale bipolar
                                               we can investigate its physical processes at a resolution orders          wind from the GC (Bland-Hawthorn & Cohen 2003). This sce-
                                               of magnitudes better than in other quiescent galaxies. The most           nario was then brought to the fore by the discovery of the so-
                                               pressing outstanding question is how some portion of the multi-           called Fermi bubbles, clearly visible above ∼ 2 GeV in the Fermi
                                                                                                                                                                    Article number, page 1 of 17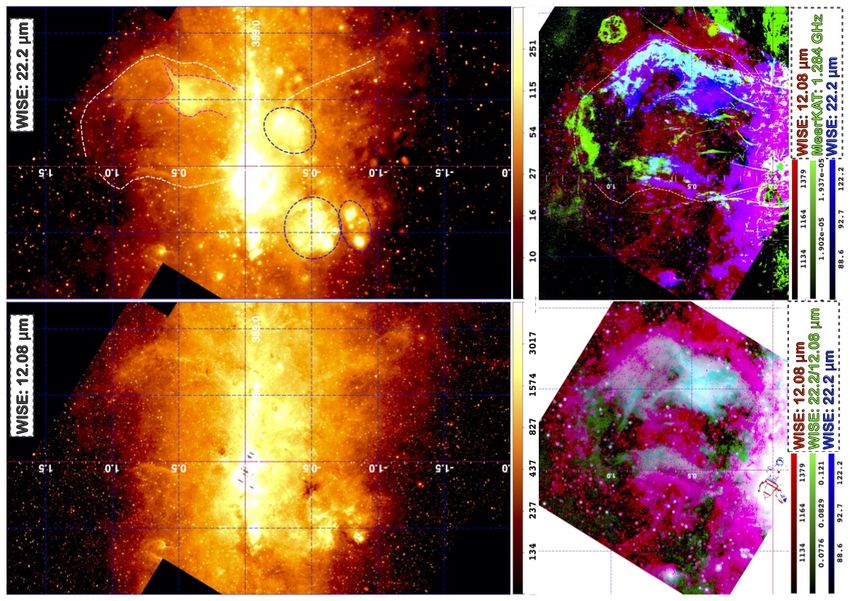
A&A proofs: manuscript no. Radio-to-X-rayChimneys
XMM: 1.5-2.6 keV
WISE: 22.2/12.08 μm
MeerKAT: 1.284 GHz
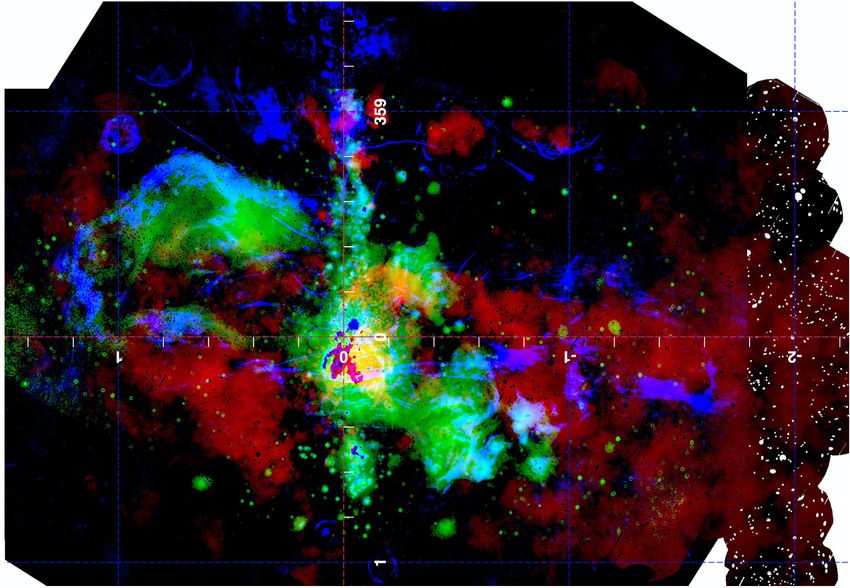
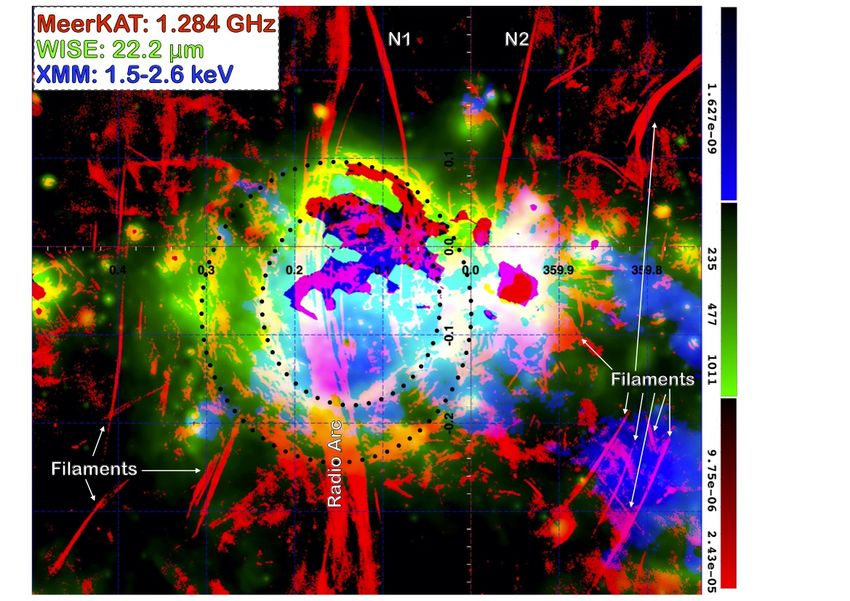
Fig. 1. Multi-phase nature of the GC chimneys. Red, green, and blue show the XMM-Newton 1.5-2.6 keV, WISE (ratio of 22.2 µm/12.08 µm
emission), and MeerKAT 1.284 GHz maps, respectively.
Article number, page 2 of 17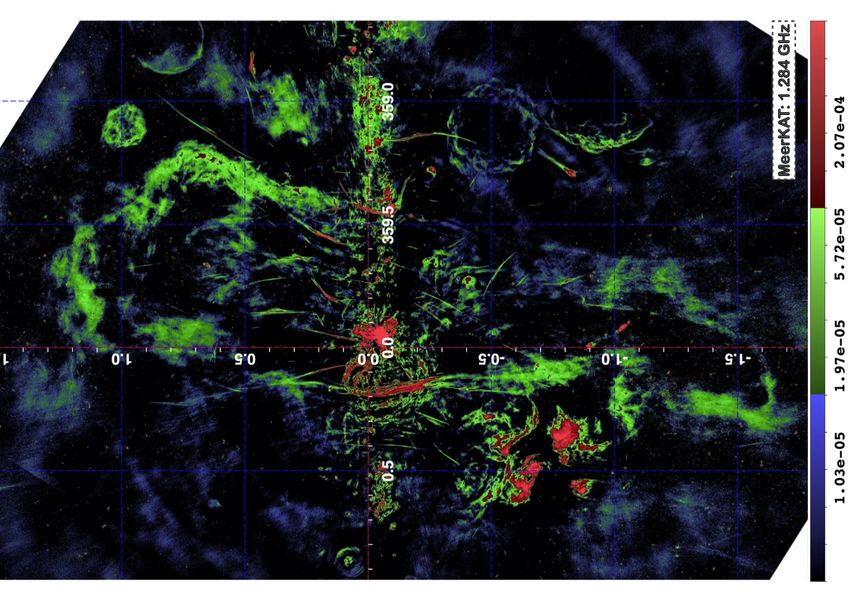
G. Ponti et al.: The Galactic center chimneys: The base of the multiphase outflow of the Milky Way
data, with a size comparable to the Milky Way itself and a total cate that the X-ray emission is also produced primarily at the
energy content of ∼ 1055 erg (Su et al. 2010; Ackermann et al. boundaries of the GC outflow, possibly in a structured shock
2014; Kataoka et al. 2018). It was also suggested that the bases with the ISM. On the contrary, the X-ray emission toward the
of the Fermi bubbles are associated with soft X-ray emission southern hemisphere peaks along the axis of the chimney, as
(Bland-Hawthorn & Cohen 2003; Su et al. 2010; Nakashima et would be expected if the X-ray emitting plasma is volume filling.
al. 2013; Crocker et al. 2015). Figure 4 shows the full dynamic range of the MeerKAT map,
Recently, we reported sensitive X-ray maps of the GC, which which displays a large array of nonthermal filaments and diffuse
led us to the discovery of two oppositely directed, 200-pc chim- radio emission. Some of these filaments are reported in Fig. 2 as
neys of hot plasma connecting the central parsecs with the base dashed gray lines.
of the Fermi bubbles (Ponti et al. 2015; 2019; Nakashima et al.
2019). Such chimneys are the smoking-gun evidence of an out-
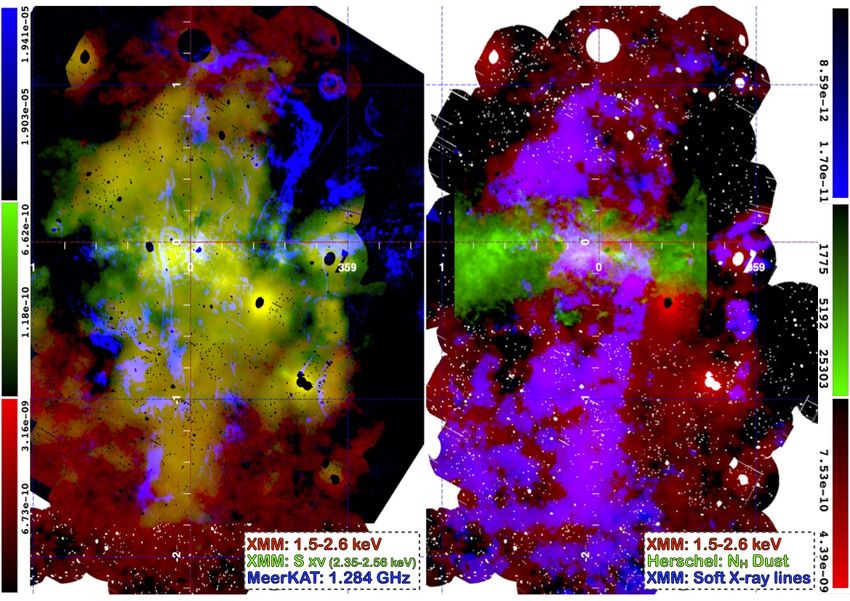
2.2. Maps of X-rays versus dense, neutral material
flow from the GC (Ponti et al. 2019). Subsequently, radio maps
revealed extended radio continuum emission defining two edge- The left panel of Fig. 5 shows in red the soft X-ray emis-
brightened lobes or bubbles, roughly tracing the edges of the X- sion map (1.5-2.6 keV), in green the S xv line emission (2.35-
ray chimneys (Heywood et al. 2019). 2.56 keV), and in blue the MeerKAT map. The S xv line emission
Here we examine the X-ray maps jointly with the radio and shows clear gradients in rough coincidence with the edges of
infrared maps. In Sect. 2, we describe the overlay of the X-ray the MeerKAT bubbles. Because of the relatively high brightness
maps with the radio and infrared ones. In Sect. 3, we discuss the and high energy emission of the S xv transition, this emission
results and then consolidate the observed complexity. Finally, line provides us with an excellent tool to trace the hot plasma
Sect. 4 proposes an emerging simplified picture and details our all the way to the Galactic plane. Indeed, it is significantly less
conclusions. affected by interstellar absorption than the soft X-ray emission
map. The right panel of Fig. 5 shows the total and continuum-
subtracted maps in the 1.5-2.6 keV band in red and blue, re-
2. Multiwavelength view of the multiphase GC spectively. The continuum subtraction efficiently removes the
outflow emission from dust scattering haloes around bright sources (e.g.,
at: (l,b) = (359.98◦ , 1.26◦ ); (359.56, -0.39); (359.30, -0.88);
The interplay between the various phases of the GC outflow is (359.08, -1.51); (359.12, -0.10); (0.67, 1.18); etc.) as well as
shown in Figure 1. The red, green, and blue colors show the nonthermal X-ray sources (e.g., pulsar wind nebulae), as is evi-
X-ray (XMM-Newton), infrared color ratio (22.2 µm/12.08 µm dent by comparing the red and blue maps. The green color shows
from WISE), and radio (MeerKAT) maps, respectively. In red, the the atomic hydrogen column density map of molecular material
continuum-subtracted 1.5-2.6 keV map is shown in logarithmic in a logarithmic scale from 1.2 to 60 × 1023 cm−2 as observed
scale (see Extended Data Fig. 3 of Ponti et al. 2019). Because by Herschel (Molinari et al. 2011). The highest concentration
the X-ray chimneys are primarily thermally emitting, they shine of molecular material occurs within a few tens of parsecs from
brightly in soft X-ray emission lines. The green shows the ratio the Galactic plane. The high column density of cold material
of infrared color defined as the 22.2 µm WISE map divided by the is likely to significantly obscure the X-ray radiation toward the
12.8 µm one (see § 2.3 for more details). In blue, the MeerKAT densest regions in the plane (i.e., the Sgr B complex).
map is shown at intensities at or above 2 × 10⁻⁵ Jy (see Fig. 1 of A clear depression is observed in the X-ray emission at
Heywood et al. 2019 and note the caveats regarding photometric b ∼ ±(0.2 − 0.3◦ ). We note that foreground absorbing clouds
accuracy in the Methods section). This outstanding color image with column densities on the order of NH ∼ 0.4 − 1 × 10²³
shows the interplay of the different phases of the GC outflow. cm−2 are present at those locations (Molinari et al. 2011), which
We also note that the MeerKAT and WISE maps show bright is sufficient to account for the observed depressions in X-ray
radio and infrared emission associated with G0.5-0.5 and G0.5- emissivities in terms of increased X-ray absorption.
0.85, two well-known foreground star formation complexes. Fig-
ure 2 shows a finding chart of the region within and just outside
of the chimneys, displaying most of the features discussed here.
2.3. The infrared (WISE) maps
2.1. Overlay of radio and X-ray maps The WISE data were downloaded from the Infrared Science
Archive1 and subsequently mosaicked, adjusting the background
Figure 3 shows an X-ray (XMM-Newton) and radio (MeerKAT) to match in the overlapping regions2 , to obtain a full coverage
overlay. The thick dashed white line indicates the location of of the chimneys. The top panels of Fig. 6 show the emission
the prominent western edge of the distribution of X-ray emitting at 12.08 and 22.2 µm as observed by WISE. As for the dense,
plasma defining the chimneys. This appears as a remarkably lin- neutral material, the highest concentration of warm dust is dis-
ear feature with an extent of ∼ 350 pc. The thin dashed white tributed along the Galactic plane, however showing a consider-
line aims at indicating a possible location of the eastern edge of ably larger latitudinal extent. Indeed, spurs of warm dust (the
the chimneys; however, its position is less well determined. most prominent of which are highlighted by white dashed lines)
We note that both the northern and southern chimneys are 1
prominent in both the X-ray and radio bands, with a striking de- https://irsa.ipac.caltech.edu/applications/wise/
2
gree of symmetry with respect to the Galactic plane. However, We stress that the constant background of each sky tile was adjusted
arbitrarily to match in the overlapping regions and to facilitate the dis-
some asymmetries are clearly evident (Fig. 3).
play of the various features. In particular, because of the arbitrary sub-
Toward the northern latitudes, the X-ray emission associ- traction of constant backgrounds and because of the unknown contribu-
ated with the GC outflow appears consistent with being edge- tion from extended foreground and background emission sources, the
brightened (i.e., lacking a ridge of emission at the center of the map made of the ratio of bands W4 (22.2 µm) to W3 (12.08 µm) is
chimney), although not as much as the radio emission (e.g., see meant only to be indicative of the trends of dust temperature, and does
Additional Data Figure 7 of Ponti et al. 2019). This might indi- not provide a quantitative measure of colour temperature.
Article number, page 3 of 17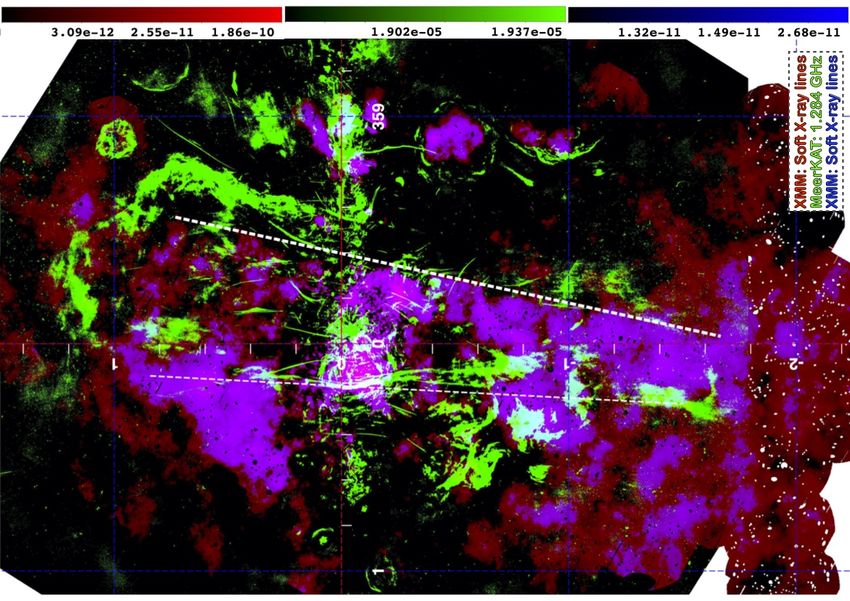
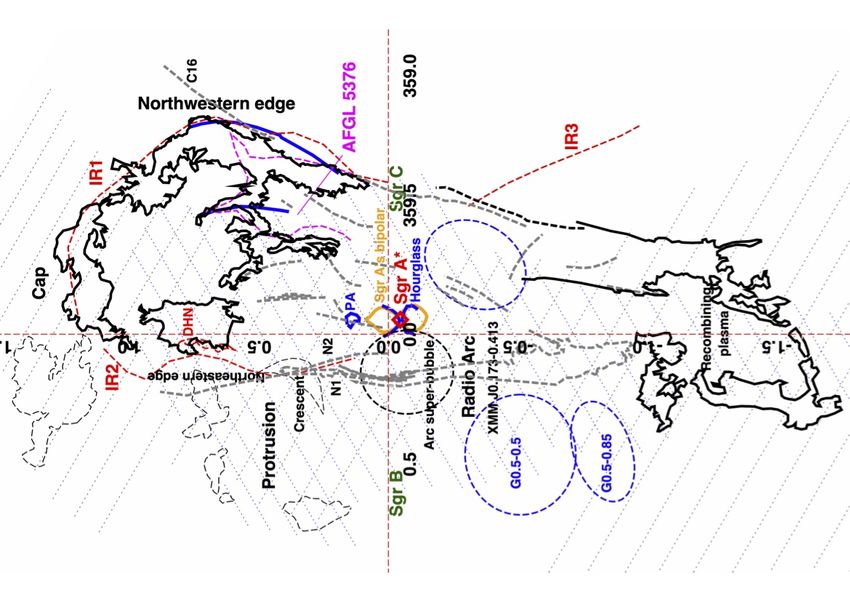
A&A proofs: manuscript no. Radio-to-X-rayChimneys

Fig. 2. Finding chart of the region within and just outside the chimneys. The thick-black solid regions show the most prominent radio emitting
features clearly associated with the chimneys. The thick dashed gray lines display the locations of the most prominent nonthermal radio filaments
(such as N1, N2, XMMJ 0.173-0.413, C16) and of the Radio Arc. The thick-red dashed lines display the location of the spurs of warm dust as
evinced from the WISE maps and the double helix nebula (DHN; Bland-Hawthorn & Cohen 2003; Enokiya et al. 2014). The magenta dashed lines
indicate the borders of the AFGL 5376 feature, as derived from the WISE 22.2 µm map (the solid blue lines at this location show the position of the
two shocks derived by Uchida et al. 1994). The slanting thin-dotted blue and gray lines show the X-ray emitting region displaying bright S xv and
soft X-ray line radiation, respectively. At high latitudes, this emission extends beyond the borders of the chimneys. The thin-black dashed regions
show the location of faint radio features appearing at the edges of the X-ray protrusion (§3.6). At the center, a red diamond shows the location of
Sgr A? , the orange solid region displays the location of Sgr A’s bipolar lobes, as derived from the XMM-Newton map, while the blue solid regions
show the location of the polar arc (PA) and of the hourglass feature (Hsieh et al. 2016). The latter runs almost perfectly on top of the lower edges of
Sgr A’s bipolar lobes. The thick-black dashed ellipse shows the location of the Arc super-bubble as it appears in the radio and mid infrared bands,
while the thick-blue dashed ellipses show the location of the three well-known foreground star forming regions. The dark green labels indicate the
position of the main molecular complexes (the Sgr A complex approximately coincides with Sgr A? ).
Article number, page 4 of 17
G. Ponti et al.: The Galactic center chimneys: The base of the multiphase outflow of the Milky Way

Fig. 3. Continuum-subtracted soft X-ray line image in red and blue (with different intensity cuts, to give a better indication of the extent of the
chimneys). In green, the MeerKAT map with intensity cut at 2 × 10⁻⁵ Jy (see Fig. 1 of Heywood et al. 2019, and note the caveats regarding
photometric accuracy in the Methods section).                                                                         Article number, page 5 of 17
A&A proofs: manuscript no. Radio-to-X-rayChimneys

Fig. 4. MeerKAT map displayed with its entire dynamical range.

Article number, page 6 of 17
G. Ponti et al.: The Galactic center chimneys: The base of the multiphase outflow of the Milky Way

Fig. 5. Multiwavelength view of the chimneys. (Left panel) Red colors show the soft X-ray emission map (1.5-2.6 keV). Green colors show the
S xv line emission (2.35-2.56 keV) and blue colors show the MeerKAT map. The S xv line emission shows clear gradients in rough coincidence
with the edges of the MeerKAT bubbles. Additionally, it is less affected by interstellar absorption than the soft X-ray emission map (indeed the
latter shows clear depressions in the emissivity of the chimneys at b ∼ 0.2◦ and b ∼ −0.4 − 0.6◦ ). (Right panel) RGB image of the GC. Red: Soft
X-ray emission map (1.5-2.6 keV). Green: Column density map of neutral material as derived from dust emission of the central molecular zone,
derived from Herschel observations (Molinari et al. 2011). The depressions of soft X-ray emission at b ∼ 0.2◦ and b ∼ −0.4 − 0.6◦ correspond
to a high column density of neutral material, probably as a result of enhanced obscuration. We point out that the protrusion at l = 0.2, b = 0.25◦
(§3.6) might be associated with a fountain originating from the Sgr B molecular complex, one of the most massive, highly obscured and highest
star formation rate locations of the Milky Way. Indeed, although the protrusion appears to be disconnected from the plane in the soft X-ray map
(it extends from b ∼ 0.2◦ to b ∼ 0.6◦ ), this might be a byproduct of strong obscuration in the Sgr B region. Blue: Continuum-subtracted soft X-ray
line emission. The continuum subtraction removes the contribution from the dust-scattering haloes around bright point sources, which otherwise
dominate the emission west of the southern chimney.

are clearly observed to emerge almost vertically from the plane.           3. Discussion
The blue dashed ellipses indicate the positions of well-known,
bright, foreground star-forming regions.                                   We start the discussion by emphasizing two points.

                                                                               First point: The overall degree of symmetry of the radio
                                                                           and X-ray emission (see Fig. 3) around the GC suggests that
    The bottom left panel of Fig. 6 displays an enlargement of             the chimneys are a single coherent feature located at the GC.
the WISE map toward the northern chimney, where in red and                 Additionally, Fig. 1 demonstrates that the X-ray, radio and
blue are shown the 12.08 and 22.2 µm emission, respectively.               infrared emission are deeply connected. Indeed, Fig. 1 shows
The green colors show the ratio of infrared color defined as the           that they form coherent features, extending for hundreds of
22.2 µm map divided by the 12.8 µm one. The bottom right panel             parsecs, that can be followed both in the X-rays, radio and the
shows in red and blue the WISE maps (as in the left panel) and             infrared bands. This demonstrates that the main players traced
in green the radio emission as observed by MeerKAT. The white              in each band, which are the hot plasma in X-rays, the warm dust
dashed lines display the location of the spurs delineated on the           in infrared and the shocks in radio, are interacting and deeply
basis of the WISE maps.                                                    affecting each other. This strengthens the idea that they are all
                                                                                                                     Article number, page 7 of 17
A&A proofs: manuscript no. Radio-to-X-rayChimneys
byproducts of a single energetic phenomenon. Simpson et al. 2007; Ponti et al. 2015). Indeed, bright mid-
infrared emission is observed along the entire limb-brightened
Second point: We note from the radio image (Fig. 3) that the perimeter of the Arc super-bubble. The radio emission runs
surface density of well-defined nonthermal filaments is highest along the circular ridge of mid-IR emission and encloses the
within ∼0.5 degrees of the Galactic plane and drops rather X-ray emission from the interior of the super-bubble. In addi-
abruptly with latitude beyond that. In some cases, the narrow tion, patches of bright radio emission can be observed also pro-
non-thermal filaments become increasingly diffuse at higher jected toward the interior of the Arc super-bubble (see the dotted
latitudes, especially above and below the Radio Arc. In addition, ellipses highlighting this emission in Fig. 7), corroborating the
at northern latitudes, the magnetic field lines delineated by the idea that the radio emission is primarily tracing ionization fronts
nonthermal filaments appear to diverge with increasing latitude. and also shocks at the interface of the super-bubble with the ISM.
We conclude from these observations that the magnetic flux A detailed description of such an array of concentric radio shells
decreases with increasing Galactic latitude (see also Morris (observed in the historical VLA 20cm data; Yusef-Zadeh & Mor-
2006b; 2015). Such a decrease would affect how the GC outflow ris 1987a,b) can be found in Sofue (2003). That work attributed
is manifested as a function of latitude. At low latitudes, the the creation of the shells to recent (∼ 106 yr) starbursts, the most
shock occurring where the outflow impacts the surrounding likely candidate being the supernovae and stellar winds from the
ISM would encounter a relatively stronger field, and it would Quintuplet cluster (Egan et al. 1998; Sofue 2003; Ponti et al.
encounter it at a steep angle, so that the shock is likely to be a 2015).
C-type shock in which the shock energy is distributed broadly Therefore, the Arc super-bubble represents a textbook exam-
over a relatively large region (c.f., Draine 2011), and without ple of a powerful outflow within the GC environment that is cur-
a velocity jump large enough to ionize the gas passing through rently still contained within the disk of the Milky Way (Fig. 7).
the shock3 . At high latitudes, however, with a weaker field and a Although the more powerful chimneys apparently succeeded in
more oblique shock, in the presence of a predominantly vertical breaking through the Galactic density gradient and in overcom-
field, the velocity jump could be sufficient to ionize the gas in ing the Galactic potential, thereby opening a channel to the halo,
the shock. The diffuse radio emission that we associate with the we expect that their multiwavelength emission maintains some
shock induced by the GC outflow as it impacts the surrounding degree of resemblance to the Arc super-bubble. Indeed, as with
medium would therefore appear most prominent at the higher the Arc super-bubble, within the chimneys we also observe in-
Galactic latitudes, as is observed. tense radio emission tracing shocks occurring primarily at their
edges and X-ray emission located primarily inside the chimneys
The following subsections will discuss the various com- as well as warm dust emission at various locations along the bor-
ponents of the chimneys. Section 3.1 considers the multi- ders of the chimneys.
wavelength emission from the Arc super-bubble, which might
be instructive for a deeper understanding of the chimneys. In 3.2. On the recent suggestion that the northwestern edge of
§3.2 we debate the proposed foreground location of part of the the chimney is a foreground feature
northern chimney. In § 3.3 we examine the northwestern edge of
the chimneys, reporting evidence for a multiphase (i.e., hot and The observation of the silhouette of the northwestern and north-
cold-molecular) and multi-epoch outflow that produces strong ern portion of perimeter of the northern chimney against low-
shocks at the edges of the chimneys. In Section 3.4 we talk about frequency radio emission (LaRosa et al. 2005; Brogan et al.
the northern "cap." In § 3.5, we discuss the eastern edge of the 2003; Hurley-Walker et al. 2019; Tsuboi et al. 2020) clearly im-
chimneys, highlighting the differences compared with the west- plies that the northern chimney is located in front of most of the
ern edge, stressing the importance of the GC magnetic field and diffuse radio continuum, which is produced primarily within the
introducing the concept of a "magnetic wall." Section 3.6 dis- inner few hundred parsecs. It is currently highly debated whether
cusses possible origins of the X-ray protrusion. Section 3.7 con- the northwestern chimney is located along the Galactic disk at a
siders the southern chimney. Section 3.8 shows that the conti- few kiloparsecs from the Sun (Nagoshi et al. 2019; Tsuboi et al.
nuity of hot plasma emission all the way to the higher latitudes, 2020; Wang 2020) or whether it is instead placed just in front
where the Fermi bubbles begin, provides evidence that the chim- of the GC. The overall morphological symmetry of the radio
neys are the multi-epoch outflows that feed the Fermi bubbles and X-ray chimneys strongly suggests that at least some por-
with energetic particles. Finally, in §3.9 we ask whether the non- tion of the northwestern edge is located at the GC. Additionally,
thermal radio filaments might be associated with the GC outflow. the association of the northwestern edge of the chimney with
the AFGL 5376 feature (see §3.3), which is characterized by a
very high positive velocity, indicates that both AFGL 5376 and
the northwestern edge of the chimney are located at the GC. We
3.1. The Arc super-bubble as a template to understand the note that, on the sky plane, the chimneys have a small overall
chimneys tilt of about 7◦ with respect to the vertical to the Galactic plane,
Figure 7 shows a radio (red), mid-infrared (green) and X-ray perhaps as a result of local pressure gradients, cloud placements,
(blue) overlay centered on the Arc super-bubble. The super- and initial injection directions. In any case, this inclination of
bubble appears brightly in all of these bands. Figure 7 fully the chimneys raises the possibility that the northern chimney is
supports the paradigm that the Arc super-bubble is filled with also inclined toward us to some extent. If the tilt is such that
hot plasma occupying an X-ray bright "cavity," surrounded by the northern chimney is inclined toward us by a few tens of de-
warm, shock-heated dust (Egan et al. 1998; Levine et al. 1999; grees, then the majority of the northern chimney would be lo-
Rodriguez-Fernandez et al. 2001; Price et al. 2001; Sofue 2003; cated in front of the bulk of the GC radio continuum, which
could account for its appearing in absorption in low-frequency
3
Indeed the shock compression of the vertical field by a C-type shock radio maps, while its southern counterpart, if the chimneys are
at the location of the Radio Arc might play a role in generating the indeed colinear, would cast no shadow on those images, as ob-
bundle of nonthermal filaments constituting the Arc. served (more detailed discussion on this topic is presented in
Article number, page 8 of 17G. Ponti et al.: The Galactic center chimneys: The base of the multiphase outflow of the Milky Way
Fig. 6. Mid-IR emission from the central degrees of the Milky Way. (Top left) Emission at 12.08 µm as observed by WISE. The highest concentration
of warm dust is distributed along the Galactic plane. Spurs of material are clearly observed to emerge vertically from the plane. (Top right) Emission
at 22.2 µm as observed by WISE. The most prominent spurs of matter are highlighted by white dashed lines. At northern latitudes both the western
and eastern spurs are clearly associated with the northern chimney and delineate a lobe clearly associated with the observed radio emission. The
magenta dashed line delineates the silhouette of AFGL 5376. The detection of similar spurs in the southern hemisphere is complicated by the
presence of well-known, bright foreground star-forming regions (highlighted by the blue ellipses). (Bottom left) Zoom-in toward the northern
chimney. Red, green, and blue show the 12.08 µm, the ratio 22.2 µm/12.08 µm, and 22.2 µm emission, respectively. Warm dust surrounds the
entire chimney. Also, the 22.2 µm emission peaks inside the location of the western shock and of the 12.08 µm emission spur. AFGL 5376 lies
inside the edge of the warm gas and traces a ∼ 90 pc long molecular shock. (Bottom right) Same as previous but substituting the ratio map with the
radio emission observed by MeerKAT. The radio emission is very well correlated with the warm dust emission. In particular, the radio emission
traces the perimeter of AFGL 5376 more tightly than the warm dust emission.
Article number, page 9 of 17A&A proofs: manuscript no. Radio-to-X-rayChimneys
§A). Therefore, hereinafter, we will assume that the northwest-
ern chimney is part of the chimneys that is rooted at the GC.
However, we warn the reader that projection effects might be
important and that a portion of the features here assumed to be
located at the GC might be foreground features unrelated with
the Galactic outflow.
3.3. Northwestern edge
3.3.1. Entrained molecular outflow producing a ∼ 0.1 kpc
long shock onto the ISM
Figure 3 shows that the western edge of the chimneys is very
well defined, both in X-rays (see thick dashed line in Fig. 3;
Ponti et al. 2019) and radio. Indeed, the radio emission runs par-
allel to the X-ray edge along its full extent of ∼ 350 pc, that is,
all the way from the northern part of the northern chimney to
the southerly tip of the southern chimney. However, the peak of
the radio emission on the western side of the chimneys is dis-
placed toward more negative longitudes by ∼ 0.2◦ (∼ 30 pc)
than the western edge of the X-ray emission. Additionally, Fig- Fig. 7. Multiwavelength view of the Arc super-bubble. Red colors show
ure 6 shows that warm dust surrounds the entire northern chim- the MeerKAT map. Green colors show WISE 22.2 µm emission and the
ney. Indeed, both the 12.08 µm and the 22.2 µm maps show blue colors show the soft X-ray emission map (1.5-2.6 keV) of the re-
a spur of material (IR1, see Fig. 2) emerging from the Galac- gion around the Arc super-bubble. The radio and mid-infrared emission
tic plane (at the location of the Sgr C molecular complex) and are edge-brightened and trace the edges of the Arc super-bubble, while
reaching a cap of material observed at high Galactic latitudes the X-ray emission appears to fill the central volume. Despite being
around b ∼ 1.1 − 1.4◦ (Fig. 3, 2, 6 and 1). Again we note that, edge-brightened, several bright stripes and arcs of radio emission, pre-
while the X-ray, radio and warm dust distributions run parallel sumably tracing shocks, are projected toward the interior of the Arc
to each other, they are significantly displaced in longitude (by super-bubble, as they are for the chimneys (some are highlighted by the
∼ 0.1 − 0.3◦ ). This is discussed further below. two black dotted ellipses). The Radio Arc as well as many narrow, non-
thermal filaments (some of which are highlighted by the white arrows)
are clearly visible (see Fig. 2 for a definition of the Radio Arc and most
3.3.2. AFGL 5376: The brightest part of a molecular shock prominent nonthermal filaments). Saturation and bright source removal
in the WISE and XMM-Newton maps produce some visible artifacts.
Almost three decades ago, Uchida et al. (1994) studied the
molecular line emission around this region and discovered two
high-velocity components of molecular material, defining a ver- more slowly moving post-shock material preceding it (Uchida et
tical rift coinciding with the vertical ridge of the mid-IR source, al. 1994).
AFGL 5376. The large velocity separation of the two molecular
components — 65 km s−1 — led Uchida et al. (1994) to suggest 3.3.3. Corroborating the shock-interpretation with fresh data
that the strong IR emission from AFGL 5376 results from the
energy deposited in a 90-pc long shock where the two molec- The data presented here corroborate this interpretation. Indeed,
ular components meet (Fig. 8). Furthermore, the large positive the WISE versus MeerKAT overlay shows intense radio emis-
velocities of both components are best explained by expansion sion downstream of the strong shock, on the western side of
motions away from the GC, so we presume that they are partici- AFGL 5376 (Figs. 6 and 1). Additionally, the current data re-
pating in the GC outflow4 . The authors hypothesize the presence veal that the entire perimeter of the AFGL 5376 feature is bright
of two shocks, represented by the thick-solid blue lines in Fig. in radio emission, supporting the idea of a structured interaction
2. The western blue arc would represent the leading edge of a between the outflow and the ISM, possibly through a secondary
strong ionizing shock with a westward velocity component, de- (or "reverse") shock between AFGL 5376 and the surrounding
lineating the location where the outflow encounters the ISM (see ISM (see Fig. 8). Such a reverse shock is consistent with being
also Fig. 8). A shock with v ≥ 65 km s−1 could dissociate CO and a dissociative shock. Indeed, the lack of radio emission running
H2 molecules and ionize hydrogen, inducing free-free emission. down the infrared ridge at the center of AFGL 5376, disfavor it
The eastern blue line, which coincides with the IR ridge, was being an ionizing shock. Additionally, the radio emission on the
suggested to represent a dissociation front, associated with the eastern perimeter of AFGL 5376 is at the interface between the
reverse shock, where the fast outflowing material encounters the X-ray emitting plasma and the molecular cloud, so that ioniza-
tion could be induced by particle impact (e.g., conduction).
4
The line of sight velocity of AFGL 5376 is consistent with the one Figure 1 reveals that almost no X-ray emission is observed
expected if such a cloud were located along the innermost non-self- between the strong and reverse shock, in agreement with the idea
intersecting X1 orbit induced by the Galactic bar of stars (see e.g., Bin- that the shocked molecular outflow, visible as warm dust, might
ney et al. 1991). If so, the velocity of AFGL 5376 would not be due
form a structured shock with the ISM, with the low-density,
to expansion, but rather to the streaming motions of gas along the bar,
characteristic of the X1 orbits. However, such a scenario leaves two shock-heated plasma radiating in the X-ray band located in the
things completely unexplained: 1) the fact that AFGL 5376 is rather internal post-shock region, inside of longitude ∼ 359.6◦ (Fig. 1;
far out of the Galactic plane, and 2) the fact that AFGL 5376 is the 8). Finally, the WISE maps (Fig. 6) clearly show the presence
site of such a strong internal shock. For these reasons, we believe that of warm dust running along the edge of the strong shock pro-
AFGL 5376 participates in the outflow from the GC region. posed by Uchida et al. (1994). We point out that it remains un-
Article number, page 10 of 17G. Ponti et al.: The Galactic center chimneys: The base of the multiphase outflow of the Milky Way
clear whether AFGL 5376 impacts the ambient ISM "head on"
or whether there is considerable shear parallel to the shock.
The extraordinary result revealed by the superposition of the
XMM-Newton, MeerKAT and WISE maps is the discovery that
such an association of X-ray, radio and mid-infrared emission
is not confined to the small region next to AFGL 5376, but it
continues to latitudes of b ∼ 1.2◦ and all the way to the cap (Fig.
1). This suggests the presence of a shock, of heated dust and
swept up material accumulating at this edge of the chimneys.
The MeerKAT map shows that the radio emission traces the
presumed location of the strong shock defining the northwestern
chimney (Figs. 3 and 1). The ratio of the 22.2 µm over the 12.08
µm emission shows that the 22.2 µm emission along most of
the northwestern edge, traces the radio emission at the location
of the shock, as expected for shock heated dust (Fig. 6 and 1).
Furthermore, the 22.2 µm emission extends for many (up to tens
of) parsecs behind the shock itself, indicating a strong interaction
between the GC outflow and the mechanism heating the dust.
Fig. 8. Schematic representation of the structure of the northwestern
3.3.4. Indications of stochastic heating of pre-shock dust edge of the chimney.
grains
Figure 6 shows that the peak of the 12.8 µm emission along most
of the northwestern edge occurs either at the presumed location
(or even outside) of the strong shock defining the northwestern has a subsonic bulk motion as high as v ∼ 500 km s−1 , the ram
edge of the chimney (Fig. 6). At first sight, this appears sur- pressure then results to be on the order of ∼ 0.5 keV cm−3 , there-
prising because the 12.08 µm emission typically traces warmer fore still requiring a long time to accelerate AFGL 5376. There-
dust than the 22.2 µm one, leading us to the paradox of having fore, this appears to disfavour models in which AFGL 5376 has
warmer dust ahead of the shock than behind it. This might be un- been accelerated by the hot plasma that we currently observe
derstood if the strong, ionizing shock acts as an efficient source within the chimneys, suggesting that an alternative agent might
of the photons that stochastically heat the small dust grains, pro- be needed to account for the outflow speed of the molecular
ducing enhanced 12.08 µm emission, even ahead of the shock cloud.
front, despite the low temperature of the larger dust grains in the
pre-shock region. After the shock, all the dust gets significantly
heated, not just the small grains, therefore enhancing the 22.2 µm 3.3.6. Origin of the AFGL 5376 feature
emission in addition to the emission at 12.08 µm. We point out
that the mean free path of the diffuse Lyman continuum is likely We note that the origin of AFGL 5376 might be connected with
too short (∼ 0.01 pc for a density of 10 cm−3 ; Draine 2011) to that of the recently discovered high-velocity HI clouds located at
contribute to such an effect5 . Therefore, we speculate that if the the base of the Galactic bulge (McClure-Griffith et al 2013; Di
Ly α emission is produced in a region with high velocities, then Teodoro et al. 2018; 2020; Lockman et al. 2020). Indeed, recent
the Lyman α line might be sufficiently Doppler shifted to be out large-scale HI surveys of the Galactic bulge led to the discov-
of the local line profile, thus reducing the optical depth consider- ery of a large population (∼ 200) of anomalous high-velocity HI
ably. In support of such a scenario, the overlay of the WISE ver- clouds extending up to ∼ 3 kpc north and south of the Galactic
sus MeerKAT maps (bottom right panel of Fig. 6) shows, along plane, in a bi-conical configuration, with a neutral cloud lifetime
the full extent of the northwestern spur (IR1) and cap, intense ra- of ∼ 4 − 10 Myr and with kinematics consistent with an out-
dio emission (tracing the shock front) peaking in the zone where flow from the GC. The neutral cloud component of the outflow
the 12.8 µm start dominating over the 22.2 µm emission, with is characterized to have an opening angle of > 140◦ , a maxi-
increasing distance from the center. mum outflow velocity of vout ∼ 330 km s−1 , a mass outflow rate
of ∼ 0.1 M yr−1 , and a kinetic luminosity of the outflow of
Lk > 3 × 1040 erg s−1 over the past 10 Myr (McClure-Griffith
3.3.5. AFGL 5376: Evidence for a multiphase outflow et al 2013; Di Teodoro et al. 2018; 2020; Lockman et al. 2020).
For a mass of AFGL 5376 of MAFGL 5376 ∼ 5 × 10⁴ M , an esti- For densities of such HI clouds in the range nH ∼ 1 − 20 cm−3
mated volume of VAFGL 5376 ∼ 182 × 7 pc3 and a relative velocity and local standard of rest velocities of the clouds in the range
to the pre-shock gas of vAFGL 5376 ∼ 65 km s−1 , we obtain a den- vLS R ∼ 100 − 360 km s−1 , the driving wind should be impos-
sity of ∼ 103 cm−3 and a ram pressure of pram ∼ 6 × 10⁻⁸ dy ing a ram pressure of ∼ 0.1 − 30 keV cm−3 to accelerate such
cm−2 , which corresponds to ∼ 40 keV cm−3 . Such pressure is clouds. The upper bound on the required pressure range is one-
about two orders of magnitude larger than the thermal pressure to-two orders of magnitude larger than the thermal pressure of
of the observed hot plasma within the chimneys, which has been the hot plasma currently observed within the chimneys and sim-
estimated to be phot ∼ 0.1 − 0.2 keV cm−3 (Ponti et al. 2019). ilar to the ram pressure needed to accelerate AFGL 5376. We
Assuming that the thermal pressure of the hot plasma is acceler- suggest that the process that accelerated the HI clouds distributed
ating AFGL 5376, we estimate that it would require > 107 years throughout a biconical volume at the base of the Fermi bubbles
to reach a speed of 65 km s−1 or more. Even if the hot plasma has also accelerated some massive clouds in directions closer to
the Galactic plane, and is thus responsible for the dynamics of
5
Even shorter mean free paths are associated with Lyman α photons. AFGL 5376.
Article number, page 11 of 17A&A proofs: manuscript no. Radio-to-X-rayChimneys
3.3.7. Further evidence for a multiphase outflow 3.4. The cap
The superposition of the radio, mid-infrared and X-ray images
Other high-velocity molecular features are observed toward the reveals the presence of a cap above the northern chimney (see
chimneys, further supporting the multiphase nature of the out- Figs. 3, 2, 6 and 1). This is clear evidence that the GC outflow
flow (Hsieh et al. 2015; 2016). The polar arc represents one to the north has swept up material, or is being at least partly
such example. The polar arc is an extra-planar molecular cloud, impeded by moderately dense material there.
located ∼ 30 pc above Sgr A? , with a high radial velocity We speculate that the different latitudinal extent and longi-
(v > +100 km s−1 ) and a positive velocity gradient perpendicular tudinal width of the northern and southern chimneys can be at-
to the Galactic plane, suggesting an accelerating and expanding tributed to a greater initial ISM mass in the northern volume,
motion off the plane (Bally et al. 1988; Hsieh et al. 2015; 2016). leading to more mass swept up to create the "northern cap" and
This cloud appears connected with an extra-planar hourglass- to a broader longitudinal extent because the enhanced confine-
shaped feature having an extent of ∼ 13 pc perpendicular to the ment to the north causes a greater pressure that leads to a greater
plane and centered on the central parsec of the Milky Way, and a expansion in the longitudinal direction. This is also consistent
dynamical timescale of ∼ 3×10⁵ yr (Hsieh et al. 2016). The hour- with the fact that the AFGL 5376 cloud and the polar arc cloud
glass feature runs along the edges of Sgr A’s bipolar lobes con- are located to the north, but no comparable clouds have been
taining hot plasma (see the remarkable agreement represented in seen near or in the volume occupied by the southern chimney.
Fig. 2 by the hourglass feature in blue and the edges of Sgr A’s
bipolar lobes in orange; Morris et al. 2003; Ponti et al. 2015). We note that the X-ray maps show a clear gradient of de-
Indeed, the observed molecular components might represent the creasing hot plasma emission (clearer in the S xv map; Fig. 5)
entrained molecular gas within the hot plasma of Sgr A’s bipolar at the location of the cap. However, intense hot plasma emission
lobes (Hsieh et al. 2016; Ponti et al. 2015; 2019). The morphol- is also observed beyond the cap (Fig. 3, 5, 1). In particular, the
ogy and kinematics of these molecular clouds within tens of par- surface brightness, temperature, density and pressure of the hot
secs of the GC are reminiscent of kpc-scale molecular outflows plasma are consistent with a rather smooth transition across the
in nearby starburst galaxies (Garcia-Burillo et al. 2001; Walter cap, suggesting that the outflow associated with the last event of
et al. 2002; Bollato et al. 2013). Indeed, they are consistent with a quasi-continuous series of intermittent energy releases is only
an origin in the Galactic plane from which the clouds have been partially impeded by the material in the cap.
lifted. As a matter of fact, they have been suggested to have or-
bital paths altered either by an explosion ∼ 105 yr ago or by 3.5. Northeastern edge
outflows from the central parsec of the Milky Way (Hsieh et al.
2015; 2016). 3.5.1. Differences between the eastern and western edges
A recent extensive survey of H+3 absorption toward bright Because of the absence of a structured shock similar to that seen
stars within the central molecular zone demonstrated the pres- at the northwestern boundary, the eastern edge of the chimneys
ence of an outflow of warm (T ∼ 200 K) diffuse (n ∼ 50 cm−3 ) is less well defined (Fig. 3). The MeerKAT map indicates an as-
gas (Oka et al. 2020). The diffuse, warm gas is observed to ex- sociation of the eastern edge of the chimneys with the Radio
pand with radial velocities of ∼ 150 km s−1 and to be as extended Arc, however it also reveals that the morphology of the eastern
as ∼ 150 pc from Sgr A? (Oka et al. 2020). The energy, mo- edge, within ∼ 0.5◦ of the plane, is dominated by bundles of fil-
mentum and timescale required to create such an outflow have aments, therefore very different from the "fuzzy" appearance of
been estimated to be ∼ 5 × 1053 erg, 5 × 10⁸ M km s−1 and the northwestern edge and cap. We also note that the filamentary
∼ (0.5 − 1) × 106 yr (Oka et al. 2020). This revives the idea of appearance of the eastern edge becomes fuzzier at higher lati-
either an expanding ring (Kaifu et al. 1972; Scoville 1972) or an tudes. This could be understood in terms of a magnetic field that
expanding bi-polar vertical cylinder with total length as great as dominates the pressure at the eastern edge of the chimneys, but
∼ 170 pc (Sofue 2017). starts to diverge beyond |b| ∼ 0.5◦ , and therefore become less
confining of the synchrotron emitting particles that occupy the
filaments.
Additionally, the radiative mechanism (synchrotron vs. free-
3.3.8. Evidence for a multi-epoch outflow
free emission) and degree of polarization are two of the major
differences between the eastern and western edges of the north-
Despite the large uncertainties (e.g., line of sight distance, 3- ern radio bubble, which implies that the northeastern edge is
d velocity, launching point, etc.), it appears that the molecu- undergoing very different physical processes compared with the
lar clouds associated with AFGL 5376 were first launched onto western edge (Fig. 3, 2, 6, 1; see also Reich et al. 1987; Haynes
their relatively high-latitude trajectories a few 106 yr ago. We et al. 1992).
note that this timescale is comparable to the one associated with Finally, the morphology of the hot plasma emission along the
the outflow of warm diffuse gas, while it is about 10 times northeastern edge represents another major difference compared
longer than that of the hourglass-shaped feature. Additionally, with the northwestern edge. Very intense X-ray emission is ob-
it is ∼ 10 − 100 times longer than the sound crossing time of served all the way from the interior of the chimney to and beyond
the chimneys (t s ∼ 3 × 10⁵ yr) and of Sgr A’s bipolar lobes the location of the Radio Arc. The X-ray emission at that loca-
(∼ 3 × 10⁴ yr) and more than ten times longer than the rela- tion is primarily thermal (with temperatures of ∼ 0.7 − 1 keV;
tively recently formed recombining plasma, with estimated age Ponti et al. 2019), therefore we exclude a major contribution
less than ∼ 105 yr (Nakashima et al. 2013). We conclude that due to synchrotron emission associated with the nonthermal fil-
these greatly different timescales indicate that the chimneys were aments, although X-ray counterparts to the filaments do make a
shaped by events occurring at widely different times, and there- minor contribution (Wang et al. 2002, 2020 preprint, Zhang et
fore they are the product of multi-epoch events. al. 2014; Ponti et al. 2015; Mori et al. 2015).
Article number, page 12 of 17G. Ponti et al.: The Galactic center chimneys: The base of the multiphase outflow of the Milky Way
3.5.2. Hints of a dominant vertical magnetic field perpendicular to the Galactic plane, therefore with the net effect
of collimating the outflow. We also note that, adding to the colli-
We note that on the eastern edge of the chimney, the radio mation by the magnetic field, the vertical density gradient in the
map offers many manifestations of a pressure-dominant mag- Galactic plane would contribute to the collimation. In this sce-
netic field, including: i) exceptionally long nonthermal radio fil- nario, an outflow would be currently flowing through the chim-
aments such as the N1, N2 and XMM J0.173-0.413 filaments, neys. Alternatively, the hot plasma emission would be the relic
running north and south of the plane; ii) the Radio Arc; and of a past major outburst at the GC, now in hydrostatic equilib-
iii) the highly polarized radio plumes running both north and rium within the gravitational potential of the Milky Way and still
south of the Galactic plane. All of these features underline the radiating because of the very long cooling time (2 × 10⁷ yr; Ponti
presence of a strong (likely dominating the ambient pressure) et al. 2019). In such a scenario, it seems plausible that the hot
magnetic field with a strength that some have estimated to be as plasma was generated and then remained at the edge of the out-
high as a few mG (Seiradakis et al. 1985; Morris & Yusef-Zadeh flow.
1985; Tsuboi et al. 1986; Yusef-Zadeh & Morris 1988; Lang et Despite its pivotal importance, this scenario fails to explain
al. 1999; Blanton 2008; Magilli et al. 2019). what is sustaining the magnetic field. Several authors have con-
Also, the mid-infrared spur (IR2, see Figs. 6 and 2) can be nected the creation of the strong (in the mG range), vertical GC
best understood in the framework of a high magnetization. We magnetic field to the accretion of plasma through the Galactic
note that, close to the Galactic plane, IR2 runs parallel to the N1 disk over the entire life of the Milky Way (Sofue et al. 1987;
filament up to b ∼ 0.4 − 0.5◦ , which is radiating synchrotron 2010; Sofue & Fujimoto 1987; Howard & Kulsrud 1997; Chan-
emission due to relativistic electrons in a highly ordered verti- dran et al. 2000). In such scenarios, the toroidal component of
cal magnetic field. Between b ∼ 0.4 and b ∼ 0.7◦ , the mid- the field would be amplified by differential rotation, and toward
infrared spur is defined by the Double Helix Nebula (DHN; top the GC, radial compression would amplify the vertical field, cre-
left panel of Fig. 6; Morris et al. 2006; Tsuboi et al. 2010). The ating a nearly vertical magnetic field because of inefficient am-
radio continuum emission in the general direction of the DHN bipolar diffusion (Chandran et al. 2000). In particular, Sofue
is observed to be highly polarized, indicating a highly ordered et al. (2010) showed that the winding of the primordial mag-
magnetic field with synchrotron-emitting relativistic electrons netic field can evolve into composite configurations, comprising
(Tsuboi et al. 2010). Molecular line surveys of this region have bisymmetric spiral, axisymmetric spiral, plane-reversed spiral,
revealed two molecular components at 0 and −35 km s−1 as- and/or sing fields in the disk, and vertical fields in the center,
sociated with the DHN, with no clear evidence of shocks and similar to what is observed in nearby spiral galaxies. We specu-
with turbulent line broadening of ∼ 3 − 5 km s−1 . The mass of late that, if the magnetic field is mass-loaded, then its more rele-
the two molecular components is estimated at ∼ 3.3 × 10⁴ and vant role on the eastern side of the GC might be associated with
∼ 0.8 × 10⁴ M , respectively (Enokiya et al. 2014; Tori et al. the larger amount of mass on the Galactic plane at positive lon-
2014). These authors, following Morris et al. (2006), propose gitudes (Fig. 5; Bally et al. 1988; Tsuboi et al. 1999; Molinari et
that the warm dust has been forced into such a double helix con- al. 2011; Jones et al. 2012). Additionally, the effect of the mag-
figuration by a strong magnetic field. netic field would appear more evident than on the northwestern
Torii et al. (2014) inferred densities of the DHN of ne ∼ side due to the fact that the ISM appears less dense above the
0.7 − 2 × 103 cm−3 . Assuming such densities and that the mat- plane on that side.
ter within the DHN is shaped into such a configuration by a
turbulent pressure that is also the source of the line broaden-
ing, we compute the turbulent pressure to be in the range of 3.6. Protrusion
∼ 0.1 − 0.5 keV cm−3 . Such a pressure would be in balance The X-ray map shows bright X-ray emission at (l, b) ∼
with the magnetic pressure for a magnetic field with a strength (0.4, 0.4◦ ), which appears as a "protrusion" from the northern
of 0.1 mG. Therefore, the vertical magnetic field with a strength lobe (Fig. 3 and 1; Ponti et al. 2019). The origin of such emis-
of ∼ 1 mG (whose presence is corroborated by the presence of sion is unclear.
the nearby Radio Arc, filaments and polarized plumes) would, The physical properties of the hot plasma (e.g., temperature,
indeed, be able to dominate the dynamics of the DHN. density, energetics) within the protrusion could be consistent
with an interloper supernova remnant (SNR). To validate this
3.5.3. A magnetic wall? hypothesis, we note that the XMM-Newton and MeerKAT maps
show at least four SNRs at Galactic latitudes comparable to or
We point out that if, as suggested, on the eastern side of the chim- higher (|b| > 0.3◦ ) than that of the protrusion, therefore con-
neys the magnetic field has a strength as high as ∼ 1 mG and a firming the high projected density of SNRs in this region. Ad-
uniform vertical configuration, then it cannot be neglected when ditionally, we note that, along the line of sight toward the Radio
considering the dynamics of the hot plasma6 . Indeed, the lon- Arc a crescent-shaped radio feature is observed at the western
gitudinal expansion of any outflow with a pressure lower than border of the protrusion, at (l,b) = (0.07◦ , 0.18◦ ), which is con-
∼ 100 keV cm−3 (corresponding to a magnetic field strength of sistent with being a radio shell (Figs. 4, 3 and 1). Furthermore,
1-2 mG) would encounter the resistance of the magnetic field, radio emission is observed around most of the remaining por-
while it would allow the flow to continue almost unperturbed tions of the protrusion, although it is weak (compare Figs. 3 and
6
4), and not definitively associated with the protrusion. Therefore,
Such a scenario has been already considered by several authors. So- the lack of a clear radio counterpart in either MeerKAT or previ-
fue (2020a), for example, considers a magnetic cylinder as the origin
ous radio surveys leaves the association of the protrusion with an
of the chimneys and nonthermal filaments. He hypothesizes that mag-
netohydrodynamic compression waves ejected from the nucleus might SNR unclear (Haynes et al. 1992; LaRosa et al. 2000; Heywood
be reflected and guided through the magnetic field, therefore appearing et al. 2019).
as the nonthermal filaments (when viewed tangentially) and produce Figure 5 shows that the S xv emission (which is less af-
feedback loops between accretion events and magnetic outflows Sofue fected by absorption than the soft X-ray emission map), ex-
(2020b). tends the emission of the protrusion all the way to the Galac-
Article number, page 13 of 17A&A proofs: manuscript no. Radio-to-X-rayChimneys
tic plane at the location of the Sgr B1 and Sgr B2 molecular and attributed to the plasma around the edges of the Fermi bub-
complexes. Indeed, the Sgr B molecular complex represents the bles (Ponti et al. 2019).
region of the Milky Way with the highest specific star forma- The physical conditions of the high-latitude hot plasma and
tion rate (SFRB2 ∼ 0.04 M yr−1 ; Armillotta et al. 2019). There- of the chimneys support the idea that the chimneys represent the
fore, based on these data, we do not exclude the possibility that channel replenishing the Fermi bubbles with energy and particles
the protrusion might represent either a super-bubble or the early and that the current detailed morphology of the chimneys reflects
phases of the formation of a Galactic fountain, which could con- the most recent episodes of energy injections.
tribute to energizing and excavating the chimneys. Forthcoming
deep radio maps of the protrusion hold the key to understanding
3.9. Apparent association of the most prominent nonthermal
the origin of such a peculiar hot plasma feature.
radio filaments with the GC outflow
Since their discovery in the eighties, it has been suggested that
3.7. Southern chimney the nonthermal radio filaments are tracers of an intense (domi-
nating), pervasive and vertical magnetic field with an intensity
The study of the southern chimney is complicated by the pres-
of ∼ 1 mG (Morris & Serabyn 1996). The nonthermal fila-
ence of well-known bright foreground star forming regions down
ments would then appear anywhere there is a source of relativis-
to latitudes of ∼ 0.5◦ and ∼ 0.7 − 0.9◦ (highlighted by the blue
tic particles that illuminate the tube of field lines in which they
ellipses; Fig. 2). Indeed, ambiguity remains regarding how much
are trapped (Morris & Serabyn 1996). The recent discovery of
of the observed radio, X-ray, and mid-infrared emission is asso-
groups of nonthermal filaments spatially organized to resemble
ciated with foreground features.
"harps," provides considerable credibility to such an interpreta-
The western side of the southern chimney appears as an im- tion (Thomas et al. 2020). Several other interesting processes
pressive extension of the northwestern edge (Figs. 1 and 3). In- have also been invoked to explain the origin of the filaments
deed a single straight line well represents the border between the (Lesch & Reich 1992; Serabyn & Morris 1994; Rosner & Bodo
hot plasma distribution and the radio emission. This morpho- 1996; Shore & LaRosa 1999; Bicknell & Li 2001; Yusef-Zadeh
logical correspondence suggests a direct link between the two 2003; 2019; Bykov et al. 2017; Sofue 2020a).
in the form of a structured shock such as its northern counter- Does the GC outflow play a role in creating the nonthermal
part, although not as clearly defined. The lack of an evident mid- filaments? We note that the overlay of the WISE and MeerKAT
infrared spur of warm dust and of shocked molecular clouds maps with the location of the strong shock suggested by Uchida
might be the consequence of its much shorter cooling time as et al. (1994) shows that the bright nonthermal filament C16
well as of smaller ISM densities present at these negative lati- might originate at this location, although it could be coincidental
tudes (c.f., discussion in §3.5.1). (Figs. 4, 3 and 1). Indeed, in theory, strong shocks are expected
The eastern side of the southern chimney is defined by the to enhance the magnetic field strength and to accelerate particles,
extension of the Radio Arc down to b ∼ −1◦ . Also here, the the two ingredients necessary to illuminate the filaments.
morphology of the Radio Arc changes from an array of thin fila- In agreement with this scenario, we note that a large fraction
ments to a fuzz of emission, consistent with a dominant magnetic of the nonthermal filaments are indeed observed either within or
field with degrading flux density away from the plane, as a con- just outside of the chimneys (Fig. 2). This raises the possibil-
sequence of the diverging magnetic field with latitude (Fig. 4 and ity that a fraction of these magnetic filaments might have been
3). produced in a strong-field (B ∼ 0.1 − 1 mG) boundary zone sur-
The entire southern chimney appears to be filled with hot rounding the chimneys, perhaps by the compression of the GC
plasma and surrounded by radio emission. This is even more ev- magnetic field at that interface by the high gas pressure asso-
ident at its southernmost extension (Figs. 3, 5 and 1). Again this ciated with the outflow. Alternatively, some filaments might be
is easily understood as the aftermath of an outflow carving its due to the (subsonic) stretching of a buoyant fluid element that
way out and accumulating ISM material at the edges. We note will stretch the magnetic field, creating adjacent field lines of
that hot X-ray emitting plasma leaks beyond the southernmost opposite polarity in its wake, which then gives rise to magnetic
radio edge. As for the northern cap, this implies that material at reconnection that accelerates particles to sufficient energies to
the edge is likely only partially impeding the observed outflow. shine via synchrotron emission in the radio band (see e.g., Chu-
Additional support for the "escaping hot plasma" scenario comes razov et al. 2013). Of course, if the nonthermal filaments are dis-
from the detection of recombination lines in its spectrum at this tributed within a cylindrical region surrounding the chimneys,
location (Nakashima et al. 2013). Those authors estimate an ex- then we should expect that some of them would be projected
pansion time-scale on the order of ∼ 8 × 10⁴ yr, with an upper toward the interior of the chimneys as is observed.
limit of ∼ 1.1 × 10⁵ yr (Nakashima et al. 2013). We note that re-
combining plasma is often associated with plasma expanding on 4. Emerging picture
a time-scale shorter than that required to reach ionization equi-
librium. Therefore, the claimed presence of recombining plasma Despite the complexity of the region –where projection effects
could be readily understood if some portion of the outflow were are certainly relevant, where several competing physical effects
unimpeded in its expansion by the radio shell. might be at play, and where obscuration limits the breadth of our
observing windows– a picture appears to emerge from this multi-
wavelength study. Indeed, the comparison of the X-ray, radio and
3.8. High-latitude hot plasma: Further evidence for a infrared emission of the chimneys demonstrates the high level of
multi-epoch outflow interconnection of the emission in these various bands. Indeed,
the same coherent features, extending for hundreds of parsecs,
We observe that both the northern and southern chimneys merge can be followed in all three bands. This demonstrates that the
at high latitudes with cooler, X-ray-emitting plasma, which is main players traced in each band, which are the hot plasma in X-
consistent with the X-ray emission observed in the ROSAT map rays, the warm dust in infrared and the shocks and nonthermal
Article number, page 14 of 17You can also read