Benthic Assemblage Composition of South Atlantic Seamounts
←
→
Page content transcription
If your browser does not render page correctly, please read the page content below
ORIGINAL RESEARCH
                                                                                                                                            published: 22 October 2021
                                                                                                                                      doi: 10.3389/fmars.2021.660648

                                            Benthic Assemblage Composition of
                                            South Atlantic Seamounts
                                            Amelia E. H. Bridges 1,2,3* , David K. A. Barnes 2 , James B. Bell 3 , Rebecca E. Ross 4 and
                                            Kerry L. Howell 1
                                            1
                                              School of Biological and Marine Sciences, University of Plymouth, Plymouth, United Kingdom, 2 British Antarctic Survey,
                                            NERC, Cambridge, United Kingdom, 3 Centre for Environment, Fisheries and Aquaculture Science, Lowestoft,
                                            United Kingdom, 4 Benthic Communities and Coastal Interactions Research Group, Institute of Marine Research (IMR),
                                            Bergen, Norway

                                            Seamounts and oceanic islands rise from the seafloor and provide suitable habitat
                                            for a diverse range of biological assemblages including Vulnerable Marine Ecosystems
                                            (VMEs). Whilst they have been the focus of some work globally, there has been little
                                            description of the biological and physical environments of seamounts in the South
                                            Atlantic Ocean. In this study, we characterized benthic assemblage composition from 13
                                            seamounts and oceanic islands spanning 8–40◦ S within the exclusive economic zones
                                            (EEZs) of Ascension Island, Saint Helena and Tristan da Cunha. Drop camera imagery
                           Edited by:
                       Caren Barceló,       was collected between 170 and 1000 m. All fauna present in images were identified and
    Office of Science and Technology,       quantified, and multivariate statistics were used to describe biological assemblages and
        NOAA Fisheries, United States
                                            identify their environmental drivers. Benthic communities of temperate regions (Tristan
                        Reviewed by:
                  Ana De La Torriente,
                                            da Cunha archipelago) were shown to be distinct from those found in the tropics, with
   Spanish Institute of Oceanography        latitude and depth identified as key environmental drivers of assemblage composition.
                          (IEO), Spain
                                            Our results are consistent with the current understanding of the biogeography of the
             Christopher Thompson,
      University of Western Australia,      South Atlantic, both in terms of the distinction between tropical and temperate regions,
                             Australia      and the influence of depth and water mass structure on assemblage distribution. Faunal
                  *Correspondence:          assemblages are similar to those observed in the North Atlantic in terms of functional
                 Amelia E. H. Bridges
      amelia.bridges@plymouth.ac.uk
                                            groups. VMEs are present within the EEZs of all three territories and are potentially
                                            protected from some threats by large marine protected areas (MPAs). Our imagery, data
                   Specialty section:       and analyses provide a baseline for south Atlantic seamounts so that future monitoring
         This article was submitted to
                  Marine Conservation
                                            can establish whether existing protected status is sufficient to conserve both unique
                     and Sustainability,    biodiversity and considerable potential for vital ecosystem services.
               a section of the journal
          Frontiers in Marine Science       Keywords: deep sea, benthic ecology, assemblage composition, oceanic island, vulnerable marine ecosystem
                                            (VME)
         Received: 29 January 2021
      Accepted: 27 September 2021
        Published: 22 October 2021
                                            INTRODUCTION
                              Citation:
           Bridges AEH, Barnes DKA,         Seamounts are features generally defined as rising more than 1000 m off the surrounding seabed
     Bell JB, Ross RE and Howell KL
                                            and are found in all ocean basins (Clark et al., 2010). Estimates of their number vary based on
          (2021) Benthic Assemblage
        Composition of South Atlantic
                                            methods of identification and detection, but recent studies propose values between 25,000 and
                          Seamounts.        35,000 (Kim and Wessel, 2011; Yesson et al., 2011). If seamounts break the surface, they are referred
            Front. Mar. Sci. 8:660648.      to as oceanic islands, many of which are very isolated. In the South Atlantic, the United Kingdom
    doi: 10.3389/fmars.2021.660648          Overseas Territory (UKOT) of Saint Helena, Ascension and Tristan da Cunha is made up of

Frontiers in Marine Science | www.frontiersin.org                                  1                                          October 2021 | Volume 8 | Article 660648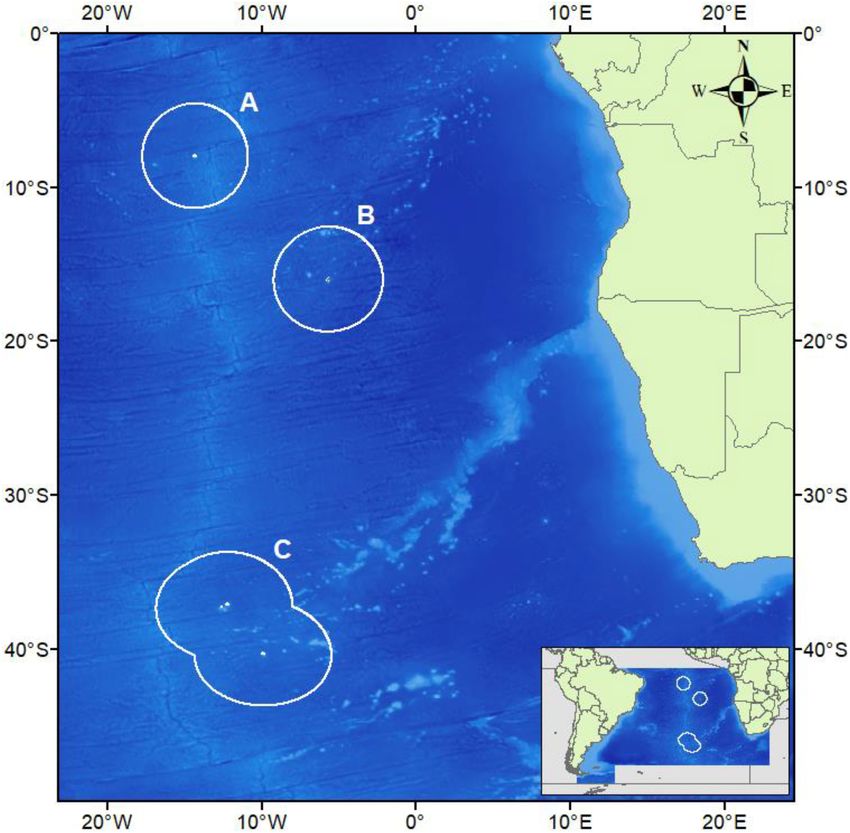
Bridges et al.                                                                                        Benthic Assemblage Composition of Seamounts

three geographically separated islands/island groups spanning              oxygen and POC as important environmental predictors of
∼8 to ∼40◦ S. These islands function similarly to seamounts                assemblage composition along the VTC. Depth, and/or covariate
in the sense that they provide a hard substrate habitat in an              environmental parameters such as temperature, are known to
otherwise largely soft substrate deep sea (Rogers, 1994), as well as       play a significant role in structuring assemblages in the deep-sea
providing benthic habitat in areas that would otherwise be pelagic         (Howell et al., 2002; McClain et al., 2010; Long and Baco, 2014).
and thus are important in sustaining populations of benthic                However, the magnitude of the effect of depth and associated
fauna, particularly when they are part of mid-ocean ridge systems          environmental variables varies, as does the effect when focusing
(Priede et al., 2013). Seamounts are also associated with increased        on specific taxa versus full assemblages. Howell et al. (2002)
production in surface waters due to the trapping of diurnally              investigated the depth-related distribution and abundance of
migrating zooplankton over the summit (Clark et al., 2010).                seastars in the Porcupine Seabight area of the North Atlantic, and
This attracts subsequent activity from organisms further up the            found that there was ∼ 20% turnover every 1000 m descended,
trophic chain, all resulting in increased carbon flux to depth,            although rate of turnover varies with depth. Focusing on broader
which facilitates higher species richness and supports increased           megafaunal community structure, McClain et al. (2010) reported
benthic biomass (Samadi et al., 2006).                                     a 50% change in assemblage composition with every ∼1500 m
   Seamount benthic macrofauna is typically dominated by                   descended on Davidson Seamount in the Northeast Pacific, whilst
sessile, filter feeding fauna (Samadi et al., 2007; Rogers, 2018),         Long and Baco (2014) reported a 93% species turnover with a
with the flank regions often home to large, fragile cold-                  depth change of ∼200 m in the Makapu’u coral bed off Hawaii.
water coral (CWC) reefs (Roberts, 2002; Rogers et al., 2007).                  Despite their importance as biodiverse ecosystems and as
Seamounts in the South Atlantic are understudied (Clark et al.,            being essential feeding hotspots for pelagic predators and seabirds
2010), particularly with regards to the structure of benthic               (Hosegood et al., 2019; Requena et al., 2020), seamounts
assemblages. The Vitória-Trindade seamount chain (VTC) found               face anthropogenic threats. Perhaps the most obvious human-
off the coast of Brazil in the southwest Atlantic has been the             induced pressure on seamounts comes in the form of fisheries,
focus of a number of studies. However, most either study the               with Clark et al. (2007) reporting that in the late 1960s, at
shallower mesophotic communities (e.g., Pereira-Filho et al.,              least 2 million metric tons of deep-sea species were trawled
2012; Meirelles et al., 2015), or only consider certain taxa               from seamounts globally. Their significance as fishing grounds is
(Leal and Bouchet, 1991; Santos et al., 2020). O’Hara et al.               somewhat due to the presence of large coral and sponge gardens
(2010) investigated the environmental drivers of assemblages               and reefs (Rogers et al., 2007) which provide essential nursery
across the VTC, but data are based on presence-absence at                  habitat for many commercial fish species (Baillon et al., 2012).
the species level and therefore cannot be used to compare                  Benthic trawling damages, or, in the worst case, removes these
biological descriptions of assemblages. They do however provide            habitats, as well as the target species within them. Although
a list of the six invertebrate phyla recorded, all of which are            particularly vulnerable to overexploitation (Watson et al., 2007),
common to seamounts.                                                       some seamount fisheries are considered to be sustainable;
   Caselle et al. (2018) carried out surveys to investigate the            typically for high-value species at low quantities (Clark, 2009).
assemblage structure at Tristan da Cunha in the southeast                  In addition to fishing pressure, many seamounts are also
Atlantic, although this largely focused on deep water vertebrates;         considered prospective deep-sea mining sites due to the high
Supplementary Material lists records of habitat forming                    concentrations of desirable metals found within the crust that
organisms in deep water including gorgonians, antipatharians               forms on seamounts (Hein et al., 2000), and exposed to increasing
and sea pens. Seamounts on the Walvis Ridge in the southeast               pollution in the form of marine plastics (Barnes et al., 2018).
Atlantic are known to contain diverse assemblages of both fish                 The vulnerability of fragile ecosystems often found in high
and benthic invertebrates including CWC reefs (FAO, 2016).                 concentration on seamounts, combined with the observed
With a subset of the data used in this study, Barnes et al.                negative impacts of bottom trawling (Clark et al., 2016) prompted
(2019) describe deep water assemblages around Ascension Island             calls from the United Nation General Assembly (UNGA) to
as often dominated by ophiuroids and corals, and assemblages               address issues surrounding the management of deep-sea fisheries,
on the surrounding seamounts being dominated by sessile                    leading to the adoption of UN resolution 61/105, and subsequent
suspension feeders.                                                        resolutions, to protect Vulnerable Marine Ecosystems (VMEs)
   There are many environmental factors that can influence                 such as CWC reefs. This resolution requires that all Regional
both the composition and distribution of benthic assemblages               Fisheries Management Organisations (RFMOs) that manage
on seamounts and oceanic islands, as well as their overall                 fisheries in Areas Beyond National Jurisdiction (ABNJ) adopt
species richness. These include, but are not limited to, depth             a precautionary principle so as to mitigate any significant
(Boschen et al., 2015), biogeographic region (McClain et al.,              adverse impacts to VMEs (including those found on seamounts).
2009), local hydrodynamic regime (Levin and Thomas, 1989),                 Although measures implemented by some RFMOs have been
surface productivity (Hernández-León et al., 2020; Bridges et al.,         effective, others require additional scientific and legal support to
in review), particulate organic carbon (POC) flux to depth                 meet this objective (Bell et al., 2019). This resolution, combined
(Morgan et al., 2019), temperature (O’Hara and Tittensor,                  with the subsequent development of the International Guidelines
2010; Woolley et al., 2016), and topography and substrate type             for the Management of Deep-sea Fisheries in the High Seas (FAO,
(Lundsten et al., 2009). In the South Atlantic, O’Hara et al.              2009), mean that in some scenarios, a level of protection is applied
(2010) identified distance from shore, temperature, dissolved              to seamounts in ABNJ.

Frontiers in Marine Science | www.frontiersin.org                      2                                    October 2021 | Volume 8 | Article 660648
Bridges et al. Benthic Assemblage Composition of Seamounts
Although the vast majority of seamounts fall in ABNJ, seamount benthic assemblage structure in the South Atlantic;
some states, particularly small-island nations and territories like (2) characterize the benthic assemblages of South Atlantic
the UKOTs, have multiple seamounts within their exclusive seamounts; and (3) identify VMEs protected by each large MPA
economic zones (EEZs) (Yesson et al., 2011), and therefore to support future spatial management.
offer a chance to significantly advance the conservation of
seamounts. Those within the EEZs of Ascension Island, Saint
Helena and Tristan da Cunha are now managed as part of MATERIALS AND METHODS
large marine protected areas (MPAs) and/or a combination of
fishing and no take zones in the South Atlantic. In order to fully Study Area
understand the conservation significance of these large MPAs Saint Helena, Ascension Island, and Tristan da Cunha
and to support future management plans, it is important to (henceforth referred to as St. Helena, Ascension and Tristan)
characterize seamounts, and understand the ecology, distribution make up a single UKOT in the South Atlantic Ocean (Figure 1).
and environmental drivers of the species and habitats in the These oceanic islands have steep, shelving sides and the seabed
region (Ardron, 2008). This will allow managers to ensure the descends into deep water (200 m+) very close to shore. Ascension
correct tools (e.g., area based management tools such as MPAs) forms part of the mid-Atlantic Ridge (MAR), St. Helena forms
are employed in the optimal locations. For example, regional part of the Guinea seamount chain, and both are located within
ecological and environmental characterization is important to the tropics. Tristan is at the most westerly point of the Walvis
ensure population connectivity is maintained (Christie et al., Ridge and is therefore temperate. In all cases, over 90% of the
2010; Sundblad et al., 2011; Ross et al., 2017; Balbar and EEZ is comprised of waters deeper than 1000 m.
Metaxas, 2019), and an understanding of species and/or habitat All three islands have implemented marine protection regimes
distribution is important in making sure representative areas in their EEZs that range in protection level.1 The Ascension
are protected as opposed to atypical ones (Rice and Houston, Island MPA covers the whole EEZ at just over 440,000 km2 and
2011; Sundblad et al., 2011). With this in mind, this paper
aims to: (1) identify the broadscale environmental drivers of 1
https://www.protectedplanet.net/en/country/SHN
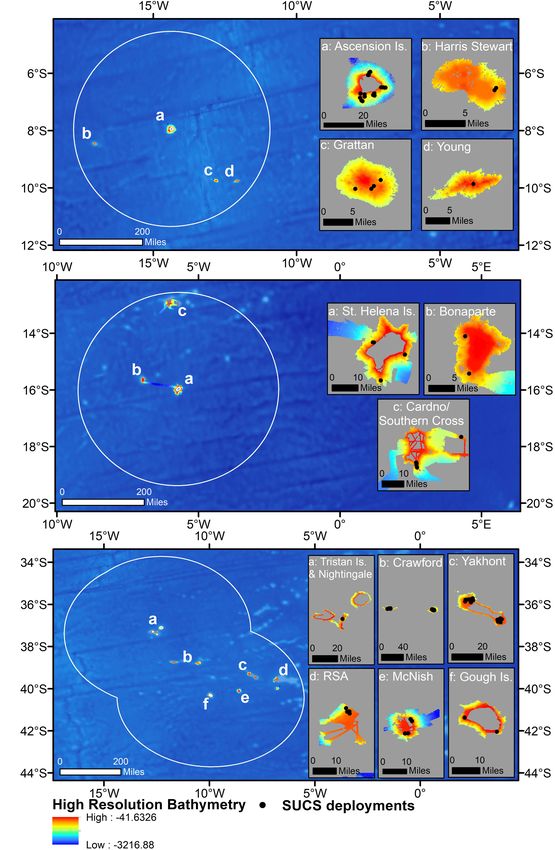
FIGURE 1 | The South-east Atlantic Ocean with the Exclusive Economic Zones of Ascension Island (A), Saint Helena (B), and Tristan da Cunha (C) are drawn in
white and correspond to Figures 3A–C. Underlying bathymetry is cropped for the region from General Bathymetric Chart of the Oceans (GEBCO_2014 Grid,
version 20150318). Map drawn in WGS84.
Frontiers in Marine Science | www.frontiersin.org 3 October 2021 | Volume 8 | Article 660648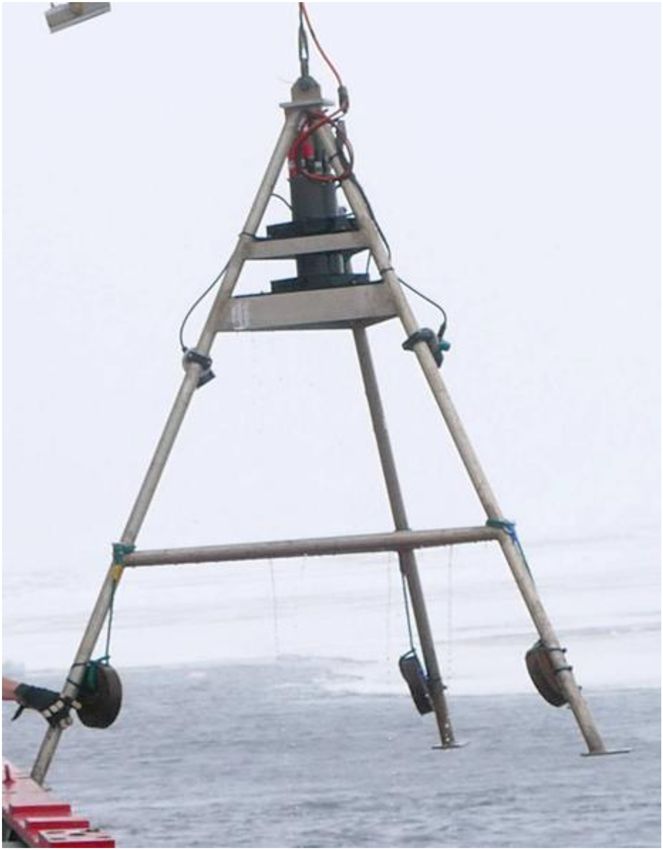
Bridges et al.                                                                                            Benthic Assemblage Composition of Seamounts

was designated in 2019; within the MPA, both commercial fishing                from a desktop computer on ship. Whilst the SUCS is appropriate
and mining are prohibited. St. Helena designated their whole                   for the collection of imagery to characterize benthic assemblages,
451,000 km2 EEZ an IUCN Category VI MPA in 2016, allowing                      some areas of extremely high slope cannot be sampled. An
for “sustainable use of natural resources.” Whilst commercial                  Ultra Short Base Line (USBL) beacon mounted on the camera
fishing is allowed on a permit basis, non-scientific bottom                    lander allowed for an accurate Global Positioning System (GPS)
trawling is prohibited throughout the whole MPA. In late 2020,                 position to be obtained.
Tristan da Cunha announced the designation of their Marine                        All data were collected during the 2013 [JR287, Barnes et al.
Protection Zone (MPZ). Unlike the other two islands, the MPZ                   (2013)], 2015 [JR864, Barnes et al. (2015)], 2017 [JR16-NG,
is sectioned into “fully protected” (i.e., no-take) and “sustainable           Barnes et al. (2019)], and 2018 [JR17-004, Morley et al. (2018)]
fishing” zones; the latter surround the two island groups and                  cruises of the RRS James Clark Ross, and a 2019 cruise on the
sections of four seamounts. Again, non-scientific bottom trawling              RRS Discovery [DY100, Whomersley et al. (2019)]. Two cruises
is banned throughout the whole EEZ.                                            visited each of Ascension and Tristan, with sampling targeted
                                                                               toward the oceanic islands themselves in 2013 and 2015, and
Sampling Methods                                                               offshore seamounts in 2017 and 2018 (Figures 3A,C). Due to a
A bespoke camera lander [Shallow Underwater Camera System                      mechanical fault with the SUCS, deployments were only made in
(SUCS), Figure 2] was used to collect image data from between                  the St. Helena EEZ in 2019 but targeted both the main island itself
170 and 1000 m in cluster transects (n = 74) across 13 different               and two offshore seamounts (Figure 3B). Transects within each
seamounts and oceanic islands. Cluster transects refer to groups               UKOT EEZ (henceforth referred to as territories) were collected
of images, haphazardly spaced between 5 and 10 m of each other,                from multiple seamounts/islands (henceforth referred to as sites).
with all images from an individual transect taken within 100 m                 A breakdown of the sampling structure is presented in Table 1
of each other to capture relevant environmental heterogeneity.                 with transect depths available in the Supplementary Material.
The SUCS tripod design allows the lander to settle perpendicular                  Multibeam seabed mapping using Kongsberg EM122 and
to the sea floor using weights to steady itself, and capture high-             EM710 multibeam echosounders allowed for characterization
resolution images (mean of 18.9 per transect, see Supplementary                of the sites prior to equipment deployments to ensure
Material for full breakdown) of 0.14 m2 area using a five                      suitability for the SUCS. Agassiz trawls were used to collect
megapixel Allied Vision Prosilica GC2450 camera, a Fujinon                     physical specimens for laboratory-based identification, and
HF12.5SA-1 lens and twin variable intensity lights, all controlled             temperature and oxygen profiles were recorded using a CTD at
                                                                               each transect.

                                                                               Image Analysis
                                                                               A total of 1,398 images were quantitatively analyzed using a
                                                                               combination of ImageJ (Schneider et al., 2012) and BIIGLE, the
                                                                               latter of which is an online platform designed for the annotation
                                                                               of images (Langenkämper et al., 2017). All organisms identified as
                                                                               distinct morphospecies were assigned an operational taxonomic
                                                                               unit (OTU). OTUs were identified to the highest taxonomic
                                                                               resolution possible, facilitated through comparison of image data
                                                                               with physical specimens collected (by mini-Agassiz trawl), and
                                                                               the Howell et al. (2017) deep-sea species image catalog. All
                                                                               individuals were counted up to 100, with some encrusting and
                                                                               reef-forming species recorded as percentage cover. For these
                                                                               OTUs values used were either 1% (as most were only present in
                                                                               very small abundances per image), or between 10 and 100% in
                                                                               10% increments.
                                                                                   Primary and secondary substrate type(s) were recorded using
                                                                               the following categories based on Wentworth (1922): bedrock,
                                                                               reef framework, live reef, cobbles, coral rubble, pebbles, coral
                                                                               gravel, gravel, and sand (Supplementary Material). Images were
                                                                               also assigned a substrate hardness score based on the types and
                                                                               proportions of each substrate observed in the image on a six point
                                                                               scale where 1 would equate to 100% sand and 6–100% bedrock.
                                                                               For example, if 50% of the image was comprised of sand and 50%
                                                                               comprised of rock, the hardness score would be 3 to weight each
                                                                               substrate appropriately.
                                                                                   The Food and Agriculture Organization (FAO) developed
  FIGURE 2 | British Antarctic Survey’s Shallow Underwater Camera System
  (SUCS). Photo credit: David Barnes.
                                                                               the International Guidelines for the Management of Deep-
                                                                               Sea Fisheries in the High Seas (FAO, 2009) which lists

Frontiers in Marine Science | www.frontiersin.org                          4                                    October 2021 | Volume 8 | Article 660648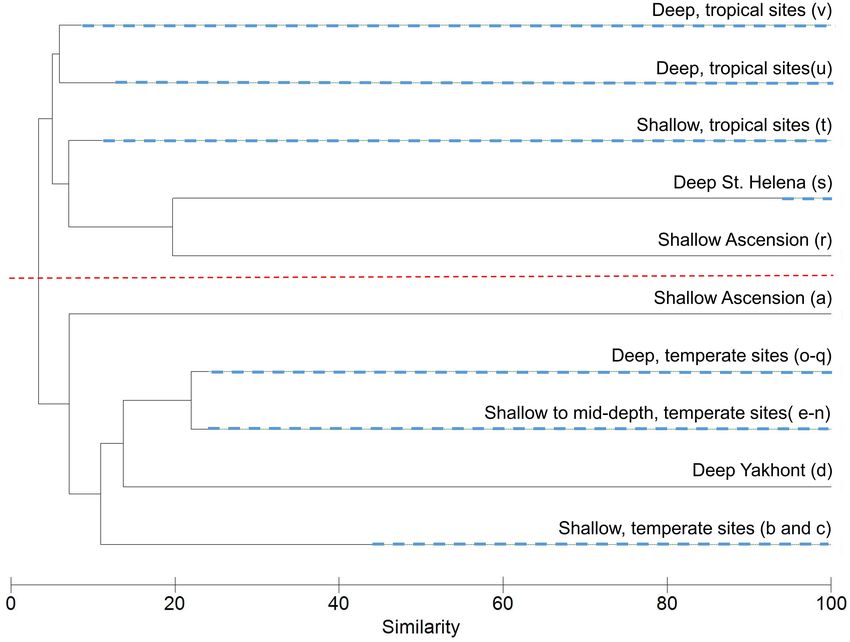
Bridges et al.                                                                                                          Benthic Assemblage Composition of Seamounts

  FIGURE 3 | Camera deployments plotted on high-resolution bathymetry across: (A) all four sites within the Ascension Island EEZ, (B) all three sites within the Saint
  Helena EEZ, and (C) all six sites within the Tristan da Cunha EEZ. Insets show each of the bathymetric features sampled in each territory. Underlying bathymetry from
  General Bathymetric Chart of the Oceans (GEBCO_2014 Grid, version 20150318). Map drawn in WGS84.

five characteristics that lead to the designation of marine                            considered them VMEs based on whether they meet any of the
ecosystems as VMEs: (1) uniqueness or rarity; (2) functional                           five criteria above, presence of the list of VME indicators provided
significance of the habitat; (3) fragility; (4) life-history traits of                 by the South East Atlantic Fisheries Organisation (SEAFO) and
component species that make recovery difficult; and (5) structural                     habitat types listed in ICES (2016). There is currently no accepted
complexity. Transects were assessed as to whether authors                              framework from which to designate VMEs from imagery,

Frontiers in Marine Science | www.frontiersin.org                                  5                                           October 2021 | Volume 8 | Article 660648
Bridges et al.                                                                                                     Benthic Assemblage Composition of Seamounts

TABLE 1 | Breakdown of transects (n = 74) per site (n = 13) and per territory.          Primer v.6 (Clarke and Gorley, 2006) for the 74 transects.
                                                                                        Similarity/dissimilarity between samples was visualized using
Territory                              Site                             Transects
                                                                                        hierarchical cluster analysis (CLUSTER) with a SIMPROF test
Ascension                       Ascension Island                            18          (at p = 0.05). Two Similarity Percentage Routines (SIMPER)
                                Grattan Seamount                             4          were performed to determine: (1) the dominant taxa driving
                            Harris-Stewart Seamount                          2          the distinction between SIMPROF clusters, and (2) the taxa
                                Young Seamount                               1          that characterize each territory. These were run using a 50%
St. Helena                    Bonaparte Seamount                             2          cumulative cut-off.
                  Cardno/Southern Cross Seamount Complex                     6             Environmental data (latitude, longitude, surface primary
                                St. Helena Island                            5          productivity, depth, rugosity, curvature, slope, FBPI, BBPI,
Tristan                        Crawford Seamount                            12          substrate hardness and POC flux to depth) were visualized using
                               Yakhont Seamount                             13          Draftsman’s Plots and rugosity was log-transformed as the raw
                                 RSA Seamount                                4          distribution was skewed. A distance-based linear model (DistLM)
                                  Gough Island                               2          from the PERMANOVA + software (Anderson et al., 2008) was
                                McNish Seamount                              4          run in Primer v.6 with all 11 variables to ascertain whether
                          Tristan and Nightingale Island                     1          they were individually significant predictors of assemblage
                                                                                        structure, requiring the analysis to also print a correlation matrix
                                                                                        (Supplementary Material). Correlations >0.7 were considered
although efforts are underway to propose both a classification                          strong and therefore one of each correlated pair was removed
and density thresholds (e.g., ICES, 2020; Rowden et al., 2020).                         for further analysis based on the ecological relevance of the
It has however been confirmed that expert opinion can often                             correlate, and their individual performance in DistLM marginal
determine VME status based on a single image, particularly when                         tests. A DistLM using the final variables was then run on the
considering coral reef structures (Baco-Taylor et al., 2020).                           assemblage composition matrix. This determined which potential
                                                                                        environmental drivers could best describe the relationship
Environmental Data Preparation                                                          between assemblage structure and the environmental data using
Raw multibeam files were cleaned, gridded at 25 m cell size in                          Akaike information criterion (AIC) as the selection criterion and
QPS Qimera v2.1.1 and projected from the native projection into                         a step-wise selection procedure, with 9,999 permutations to test
Goode Homolosine Ocean in ArcGIS v10.7. The Benthic Terrain                             significance. Distance-based redundancy analysis (dbRDA) plots
Modeler plugin (Walbridge et al., 2018) was used to derive                              were used to visualize the DistLM results in 2 dimensions.
rugosity, slope, fine-scale bathymetry position index (FBPI),
broad-scale bathymetric position index (BBPI) and curvature.
The inner and outer radii for BBPI and FBPI were 8 and 40 and                           RESULTS
1 and 8, respectively, facilitating identification of megahabitats
>1 km (e.g., banks and plateaus) and mesohabitats  ± 0.7 (surface primary
from Lutz et al. (2007) were resampled and re-projected to a                            productivity and latitude), and exploration of variable
25 m resolution in Goode Homolosine Ocean. Mean surface                                 contribution and significance using DistLM marginal tests
primary productivity data were downloaded from Bio-Oracle,                              revealed both correlates were individually significant. Latitude
an online database of environmental variables for ecologists,                           was selected over surface primary productivity for further
and also resampled and re-projected from five arcmin to 25 m                            analysis as it can be assumed a proxy for other variables.
(Assis et al., 2018). It is important to note that this resampling                      Therefore, the following 10 variables were taken forward
does not alter the resolution of the underlying data, it simply                         for analysis in the DistLM: latitude, longitude, depth, rugosity,
splits grid cells into smaller cells to allow for raster stacking in                    curvature, slope, FBPI, BBPI, substrate hardness, and POC flux to
mapping programs.                                                                       depth. The optimum solution from the DistLM routine produced
                                                                                        a model with an AIC of 603.65 and is detailed in Table 2. The
Statistical Analysis                                                                    five selected variables combined explain approximately 27% (R2
To allow for single combined analysis of OTUs, abundance                                0.268) of the variation in the assemblage structure across the
and percent cover datasets need to be brought onto the same                             three territories. Latitude was the only variable that individually
scale by dividing one dataset by a selected value so as to equal                        accounted for >5%. Substituting latitude for surface primary
the range of the other [as per Howell et al. (2010)]. The two                           productivity in the available variables list did not significantly
datasets were checked and their distributions deemed similar                            change the proportion of variance explained by the five selected
enough to combine; both also ranged from 0 to 100, therefore                            variables, although it did alter the order of longitude and FBPI
no division was required, but data were square-rooted to account                        (results available in Supplementary Material).
for high abundances of certain OTUs (namely reef-associated                                 Distance-based redundancy analysis plots allow visualization
ophiuroids). A Bray-Curtis similarity matrix was created in                             of the DistLM results for each significant environmental variable

Frontiers in Marine Science | www.frontiersin.org                                   6                                    October 2021 | Volume 8 | Article 660648
Bridges et al. Benthic Assemblage Composition of Seamounts
TABLE 2 | The primary environmental drivers of benthic assemblage structure A collapsed version of the dendrogram at 22% similarity is seen
identified by DistLM with associated metrics.
in Figure 5. After the latitudinally driven split at ∼5% similarity,
Variable SS (trace) Pseudo-F p-value % variance depth appears to become a driving factor (see Supplementary
explained (2 d.p.) Material for transect depth values). Alternative visualization
of the SIMPROF clustering is presented in the Supplementary
Latitude 45970 13.023 0.001 15.32
Material. Nine clusters (a, b, d, e, f, l, o, p, and r) contained
Depth 13276 3.9132 0.001 4.42
only one transect. Some of these were deemed outliers due to
Longitude 7621.4 2.2871 0.001 2.54
emptiness; for example, the transect listed as assemblage “r”
FBPI 6947.5 2.1182 0.001 2.31
contains very few live taxa and is unlike any other area imaged.
Slope 6760.3 2.0938 0.001 2.25
Others represent the only transect from a specific site, for
example, assemblage “b” contains the only transect from around
Nightingale Island in the Tristan EEZ but is ∼45% similar to
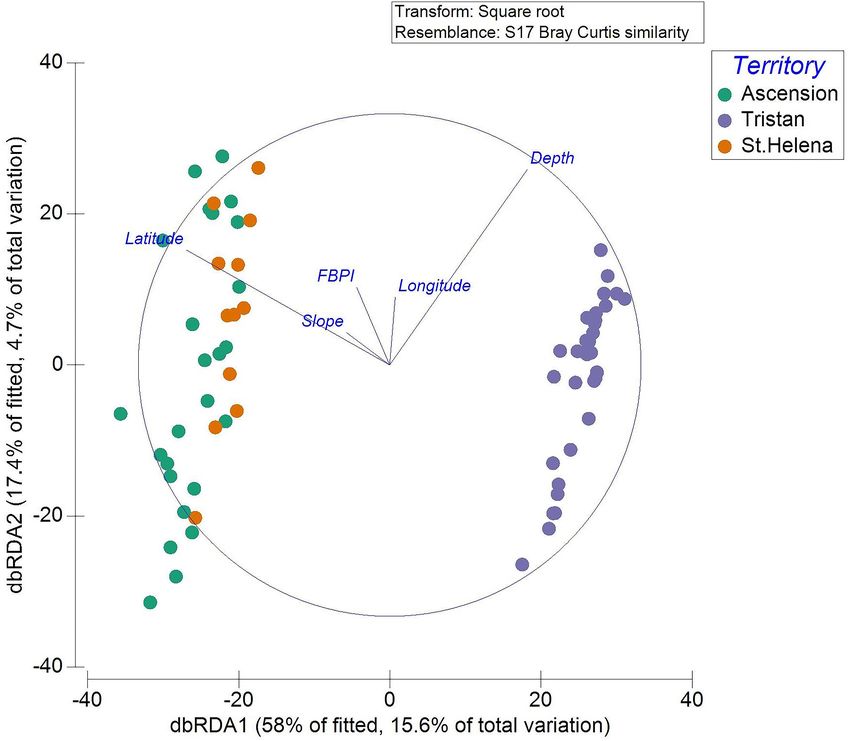
(Figure 4). Decreased latitude (poleward movement) drives the other temperate island transects (Figure 5). Full environmental
separation between Ascension and St. Helena transects and characterization for all clusters (including those containing
those from Tristan. Increased slope also appears important in only one transect) and example images can be found in the
separating the tropical from the temperate, although the variance Supplementary Material.
in the biological data that it explains was relatively minor. Depth Transects from Ascension and St. Helena split into three main
was important for structuring communities at all territories. clusters (t–v, Figure 5). Cluster t contains 14 shallower transects
The dbRDA plotted by SIMPROF clusters is available in the and is characterized by a range of substrates both hard and soft,
Supplementary Material. reflected in an average substrate hardness of 3.7/6 (Table 3).
The remaining two large clusters (u and v) have similar average
Biological Assemblages depths (Table 3), but are much more homogenous in their
A SIMPROF routine identified 22 biologically distinct substrate, with the first containing all soft substrate transects
assemblages labeled alphabetically from a to v (Supplementary and the second largely hard substrate transects, again reflected in
Material); environmental characteristics of these are presented their average substrate hardness scores (Table 3). These tropical
in Table 3. Sixteen of the assemblages comprise transects clusters contain transects from multiple seamounts across both
exclusively from Tristan, whilst the remaining six clusters territories suggesting similar assemblages across the EEZs of
contain transects from Ascension and St. Helena mixed together. Ascension and St. Helena.
FIGURE 4 | Transects are displayed on the dbRDA plot allowing visualization of the DistLM. Each individual transect is plotted with colors representing the territory in
which they occur.
Frontiers in Marine Science | www.frontiersin.org 7 October 2021 | Volume 8 | Article 660648Bridges et al. Benthic Assemblage Composition of Seamounts
TABLE 3 | Overview of environmental data, suggested VME classification and taxon composition (determined by SIMPER) of individual SIMPROF clusters.
Cluster No. of Mean Temp. Mean Depth Mean SIMPER C.% Characterizing taxa identified by VME habitat
code transects substrate range temp. range (m) depth (m) similarity SIMPER
and sites in hardness (◦ C) (◦ C) level
cluster (1–6)
Temperate clusters
b 1, 1 2.7 – 10.8 – 178 – – – HBCCF and
coral garden
c 2, 1 5.1 10.8–10.8 10.8 170–186 178 58.67 58.00 Hard-bottom Caryophyllia spp. HBCCF and
(45.95), Thouarella spp. (12.05) coral garden
d 1, 1 2.7 – 3.9 – 837 – – – –
e 1, 1 5.8 – 8.7 – 376 – – – –
f 1, 1 4.3 – 6.4 – 531 – – – –
g 2, 1 4.1 8–8.38 8.4 374–423 399 54.78 55.91 SF sponge 1 (16.3), SF sponge 2 –
(9.04), Ophiomusium sp. (8.46),
Stylasteridae 1 (7.83), Hydroid 1
(7.15), Bryozoan 1 (7.15)
h 4, 1 4.1 10.2–10.6 10.4 190–249 217 57.07 54.39 Hard-bottom Caryophyllia spp. HBCCF and
(12.65), Bivalvia 1 (12.07), EC sponge coral garden
1 (8.71), SF sponge 1 (7.18), EC
sponge 2 (7.06), EC sponge 3 (6.71)
i 3, 1 4.6 9.2–10 9.6 285–345 319 65.84 50.49 Hydroid 2 (12.38), SF sponge 1 –
(11.81), Hydroid 3 (8.46),
Ophiomusium sp. (7.24), EC sponge 1
(5.58), SF sponge 3 (5.02)
j 4, 1 3.8 9.5–10 9.8 273–323 298 58.94 50.94 Hard-bottom Caryophyllia spp. HBCCF and
(10.16), Ophiomusium sp. (6.94), SF coral garden
sponge 1 (6.09), Actiniaria 1 (5.64),
Zoantharia (5.62), Hydroid 1 (4.99), EC
sponge 1 (4.96), Hydroid 2 (3.42), EC
sponge 3 (3.12)
k 5, 1 4.1 9.3–9.7 9.5 314–338 328 52.24 52.63 Actiniaria 1 (17.93), Ophiomusium Partial CWC reef
sp. (12.7), Hydroid 1 (8.06),
Hard-bottom Caryophyllia spp.
(7.04), SF sponge 4 (6.9)
l 1, 1 3.1 – 8.6 – 386 – – – –
m 2, 1 2.5 9.7–9.8 9.8 297–307 302 67.70 50.04 SF sponge 1 (13.67), Hard-bottom –
Caryophyllia spp. (12.83),
Gastropoda 1 (9.07), Hydroid 1 (7.24),
Hormathiidae (7.24)
n 2, 1 3.5 9.6–9.9 9.7 295–318 307 67.56 52.47 Hard-bottom Caryophyllia spp. HBCCF and
(22.61), SF sponge 1 (8.37), coral garden
Bryozoan 1 (5.0), Gastropoda 1 (4.48),
Hydroid 1 (4.48), EC sponge 1 (3.88),
SF sponge 5 (3.66)
o 1, 1 4.3 – 4.7 – 703 – – – Hard bottom
coral garden
p 1, 1 3.7 – 7.7 – 434 – – – –
q 5, 1 5.1 5.5–6.2 5.8 550–624 590 47.53 52.19 SF sponge 1 (9.73), Brachiopoda CWC reef and
(8.22), Stylasteridae 1 (8.07), EC coral garden
sponge 4 (6.60), Hydroid 3 (5.69),
Galatheoidea (5.48), EC sponge 1
(4.58), Bivalvia 2 (3.82)
Tropical clusters
a 1, 1 4.0 – 13.1 – 190 – – – –
r 1, 1 2.0 – 11.5 – 218 – – – –
s 2, 1 2.0 6.1–6.1 6.1 597–597 597 94.25 71.01 Actiniaria 3 (71.01) –
t 14, 6 3.7 6.2–11 8.1 232–581 434 15.67 60.07 Reef-associated Ophiuroidea (27.12), Partial CWC reef
Cidaroida (18.35), Soft-bottom and sea pen field
Caryophyllidae (14.6)
u 7, 3 2.9 4.9–10.8 6.1 278–875 712 19.86 64.45 Gastropoda 2 (25.65), Soft-bottom –
Caryophyllidae (22.27), Actiniaria 4
(16.53)
V 13, 6 4.4 4.2–7.8 5.5 487–1011 758 12.11 52.02 Serpulidae (17.49), Reef-associated Partial CWC reef
Ophiuroidea (10.44), Decapoda (9.19),
Brachiopoda (8.52), Bryozoan 2 (6.38)
The cut off for cumulative percentage (C.%) contribution to group similarity is 50%. “SF” and “EC” refer to structure-forming and encrusting sponge morphologies,
respectively. Taxa considered VME indicators in ICES (2016) are denoted in bold. VME habitat refer to those identified in the WGDEC 2015 report on VMEs [with the
addition of hard-bottom cup coral fields (HBCCF)]; VMEs listed as partial denote clusters whereBridges et al. Benthic Assemblage Composition of Seamounts
FIGURE 5 | Cluster dendrogram from the Similarity Profile Analysis (SIMPROF) routine on the assemblage composition of each transect revealed 22 statistically
significant biological assemblages. These have been collapsed at 22% similarity into major groupings with descriptions and SIMPROF cluster labels in brackets (refer
to Supplementary Material for transect descriptions, or Table 3 for cluster descriptions). Nodes containing multiple, distinct clusters are denoted by dashed, blue
lines. The dashed red line depicts the latitudinally driven split at ∼5% with the tropical clusters positioned above the line (excluding cluster a), and the temperate
below. Supplementary Material gives an alternative visualization.
Transects from Tristan cluster in smaller groupings (b–q), also of different VME types observed at Tristan compared to the other
appearing to cluster initially by depth (Figure 5), however this two territories.
is followed by further splitting based largely on individual sites
(Table 3), suggesting a larger diversity of communities among Faunal Comparisons Between Clusters
seamounts at this location. In the tropics mid-depth transects (cluster t) were characterized
by CWC reef-associated ophiuroids, cidarid urchins and soft-
Faunal Comparisons at the Territory Level bottom cup corals (Table 3). D. pertusum reef is a VME habitat
Faunal similarity between the territories is variable. Tristan is and was observed in 6 of the 14 transects within this cluster,
the most distinct with 3.17 and 4.13% similarity with Ascension and a sea pen field was also recorded. The remaining two
and St. Helena, respectively, and is characterized by encrusting deeper tropical clusters (u and v) appear to split based on
sponges, hard-bottom Caryophyllia spp. cup corals, massive their substrate, with the hard-bottom cluster being characterized
structure-forming sponges, hydroids and non-reef-associated by serpulid worms, decapods and brachiopods, and their soft-
ophiuroids (Ophiomusium sp.). Tristan transects also share the bottom counterparts characterized by soft-bottom cup corals and
highest within-group similarity at 27.48% (Table 4). gastropods (Table 3). Solenosmilia variabilis reef (a VME habitat
The within-group similarities for Ascension and St. Helena type) was present in 2 of the 13 transects in cluster v; cluster u
transects are substantially lower at 8.68 and 9.33%, respectively. contains no VME habitat types. All three tropical clusters have
Ascension is characterized by CWC reef-associated ophiuroids, comparatively fewer characterizing taxa than temperate clusters,
soft-bottom cup corals from the Caryophyllidae family and with a higher dominance of some taxa leading to decreased
prawns; St. Helena is characterized largely by cidarid urchins diversity (Bridges et al., in review).
and CWC reef-associated ophiuroids (Table 4). A reef-building The nodes at which clusters split into distinct communities
scleractinian coral (Desmophyllum pertusum, formerly Lophelia for the Tristan groups are located at much higher values
pertusa) is also present throughout numerous transects but in along the similarity axis, suggesting differences between the
very low abundances in both territories. assemblages in temperate latitudes are more subtle. Shallower
Of the 36 transects from the Tristan EEZ, 53% were (ca. 170–300 m) communities (clusters c, h, j, m, and n)
determined as VMEs based on the habitat types listed in ICES are characterized by structure-forming and encrusting sponges
(2016) and assessment against the FAO criteria (FAO, 2009). This and hard-bottom Caryophyllia spp., with four of the five
was substantially higher than the 24 and 23% from Ascension and assemblages considered coral garden VMEs, with antipatharians,
St. Helena, respectively (Table 5). There was also a higher number stylasterids and gorgonians present. Mid-depth (ca. 330–500 m)
Frontiers in Marine Science | www.frontiersin.org 9 October 2021 | Volume 8 | Article 660648Bridges et al. Benthic Assemblage Composition of Seamounts
TABLE 4 | Taxon composition (determined by SIMPER) of territories.
Territory: within-group similarity (%) Taxa (contributing%) Cumulative (%)
Ascension: 8.68 Reef-associated Ophiuroidea (14.53), Soft-bottom Caryophyllidae 51.18
(13.45), Decapoda (12.24), Gastropoda 2 (7.84), Cidaroida (3.12)
St. Helena: 9.33 Cidaroida (22.25), Reef-associated Ophiuroidea (11.56), Actiniaria 3 51.43
(10.36), Soft-bottom Caryophyllidae (7.26)
Tristan: 27.48 SF sponge 1 (11.62), Hard-bottom Caryophyllia spp. (11.38), EC 52.21
sponge 1 (7.12), Ophiomusium sp. (6.26), Hydroid 3 (4.43), SF
sponge 3 (4.02), Gastropoda 1 (3.73), EC sponge 3 (3.64)
The cut off for cumulative percentage contribution to group similarity is 50%. “SF” = structure-forming; and EC = encrusting sponge morphologies. Taxa considered VME
indicators in ICES (2016) are denoted in bold.
communities (clusters g and k) are characterized by small water mass structure among others. Temperature is key in driving
hydroids, structure-forming sponges and often Ophiomusium sp., species distributions because it is an important regulator of
and of the five transects that constitute cluster k, one of these metabolism. It is therefore likely that some of the importance
contains D. pertusum reef. For many of the Tristan clusters, the attributed to depth in shaping benthic assemblages actually
environmental conditions are similar, except for the fact they are reflects the importance of temperature.
on different seamounts/different sides of the same seamount. In Water mass structure has been found to be a key determinant
these clusters, the characterizing taxa are often the same/similar, of faunal composition in the deep sea (Tyler and Zibrowius,
but the relative abundances are different, resulting in separate 1992; Koslow, 1993; Bett, 2001; Howell et al., 2002). In this
clustering. The deeper temperate assemblage (cluster q) is study the effect of water mass structure on driving the distinction
characterized more by sponges and brachiopods that represent and distribution of biological communities is particularly evident
the associated fauna of coral gardens and S. variabilis reef. when focusing on the clustering patterns of the Tristan transects.
Tristan da Cunha comprises four oceanic islands: three (Tristan,
Nightingale, and Inaccessible) are in the northern section of
DISCUSSION the EEZ around 37◦ S and the fourth, Gough Island, lies to the
south at ∼40◦ S. The Subtropical Convergence Front (STCF) lies
Environmental Drivers between the two island groups and refers to where the warmer,
Our observations suggest that the major large-scale drivers of temperate waters of the South Atlantic Gyre (SAG) meet the
seamount benthic assemblage structure in the South Atlantic colder waters of the Subtropical Convergence Zone (Smythe-
include latitude, depth, longitude, FBPI, and slope (Table 2). Wright et al., 1998). The exact location of the STCF fluctuates
This concurs with the current understanding that variables temporally, shifting north in the austral summer and south in
correlated with latitude and depth are strong drivers of epifaunal the austral winter. The island group in the north always falls
community composition on seamounts (McClain and Lundsten, within the SAG meaning it receives warmer, temperate waters
2015; Du Preez et al., 2016; De la Torriente et al., 2018, 2019; all year round, and Gough Island always sits in the Subtropical
Morgan et al., 2019), as well as in other deep-sea ecosystems Convergence Zone meaning it is always surrounded by cooler
(Rowe and Menzies, 1969; Rex, 1981; Billett et al., 2001; Ruhl and
Smith, 2004).
Latitude in itself is not ecologically relevant, but it acts TABLE 5 | Number of transects per territory deemed Vulnerable Marine
as a proxy for other variables. Surface primary productivity Ecosystems [as listed in ICES (2016)], some of which present as a mosaic of >1
type.
typically increases with distance from the equator; it was strongly
correlated with latitude (−0.99), and when used in the DistLM, Territory VME habitat type (ICES, No. transects identified as
yields the same results of ∼15% variation explained. Food 2016) each VME habitat type
availability has been found to strongly influence community Ascension Sea pen field 1
structure in deep-sea ecosystems (Billett et al., 2001; Ruhl and Cold-water coral reef 5
Smith, 2004; Smith et al., 2008; Leduc et al., 2014). Varying levels Total = 6/25 transects (24%)
of resource (food) availability impacts the abundance of most St. Helena Cold-water coral reef 3
groups of taxa, leading to differences in assemblage structure (this Total = 3/13 transects (23%)
is further explored in relation to specific biological assemblages Tristan Hard-bottom coral garden 4
observed in section “Biological Communities”). Hard-bottom coral 8
garden/hard-bottom cup
The orientation of depth in Figure 4, as well as the clustering
coral field*
patterns in Figure 5, show that it is heavily involved in structuring Cold-water coral reef 4
the communities within each territory. Depth is commonly Hard-bottom cup coral 3
assessed as a key driver of faunal composition in the deep sea field*
(Rex et al., 1997; Levin et al., 2001; Howell et al., 2002; Stuart and Total = 19/36 transects (53%)
Rex, 2009; Rex and Etter, 2010), but it is the correlated variables *Hard-bottom cup coral fields have been since added to the list, but are not listed
that are more ecologically relevant, including temperature and in the 2015 report.
Frontiers in Marine Science | www.frontiersin.org 10 October 2021 | Volume 8 | Article 660648Bridges et al. Benthic Assemblage Composition of Seamounts
water. Gough used to be subject to colder fronts that traveled Bergmann et al., 2011; Roy et al., 2014), and slower currents may
further north than present day, hence the presence of sub- also mean a wider range of filter feeding taxa can survive here
Antarctic bryozoans (Barnes and Griffiths, 2007). In contrast, without the risk of delicate feeding appendages being damaged
the seamounts between the island groups are subject to large by fast flows. This is evidenced by the wide range of small, filter-
variations in temperature and salinity (and therefore water feeding taxa observed in many communities at Tristan (e.g.,
mass structure) depending on the time of year. This dynamic cluster h, Tables 3, 4).
oceanographic regime means that dependent on where a feature Whilst average substrate hardness was not identified as a
is within the Tristan EEZ, it could be in one of three separate significant driver in the final DistLM, it was identified as
oceanographic systems (because the far south of the EEZ falls individually significant in the preliminary marginal tests. It
within the subantarctic frontal region), and thus support different is possible that the importance of substrate type in driving
faunal communities. In order to further explore this, temporal assemblage structure within this dataset is represented in the
monitoring of water properties at the Tristan sites would be identification of slope (steeper areas lead to more exposed hard
beneficial to map water mass movement. Contrastingly, the substrate and CWC reef communities) and FBPI (depressions
EEZs of Ascension and St. Helena are characterized by less become filled with soft substrate) as significant drivers. This
complex water mass structures, with less variability in water would concur with studies such as Serrano et al. (2017) who
mass characteristics, potentially driving less divergence in faunal identified depth and substrate type as a primary driver of soft
communities (Peterson and Stramma, 1991). substrate benthic assemblage distribution, and slope as a key
Topographic variables including slope and bathymetric determinants in the distribution of hard substrate assemblages.
position index (BPI) are, as our results support, often identified Our results report the significance of variables that Serrano et al.
as key drivers of benthic assemblages in the deep sea, both (2017) used to predict the distribution of both hard and soft
at the inter- and intra-seamount level (Boschen et al., 2015; substrate assemblages, thus suggesting our results capture the
Morgan et al., 2019). Slope and BPI can be used to infer the variability in drivers between substrates across the basin.
geomorphology of a region (Greene et al., 1999), which in turn The majority of previous studies focusing on benthic
can provide insight into the hydrodynamics, and thus substrate assemblages on seamounts investigate individual seamounts
types observed within an area (Stephens and Diesing, 2015). (McClain and Lundsten, 2015; Victorero et al., 2018; Morgan
Steeply sloping areas such as those sampled at Ascension et al., 2019). Those that have investigated assemblage structure
(and to a lesser extent St. Helena) are typically characterized and/or its drivers over multiple seamounts (Howell, 2010; O’Hara
by fast flowing bottom currents that can scour the seabed, in et al., 2010; Boschen et al., 2015; Clark and Bowden, 2015)
some cases revealing the bedrock (Stephens and Diesing, 2015). have done so from the same geological feature/ridge system, and
CWC reefs built of species such as D. pertusum (examples of therefore often only present data from a single biogeographic
which were recorded in all territories) are thought to favor region. This study compares a total of 13 seamounts/oceanic
these locations due to the increased food supply available to islands across 32 degrees of latitude, from different biogeographic
filter from the faster bottom currents. In much of our imagery regions (Zezina, 1973, 1997; Sutton et al., 2017). Despite this,
from the tropical transects, the CWC reef was dead resulting as previously detailed, the five variables identified as significant
in assemblages strongly dominated by reef-associated ophiuroids drivers of assemblage structure are similar to the results yielded
(cluster t). This link between the distinct ophiuroid-dominated in studies focusing on smaller regions or individual seamounts.
assemblages and high slope areas that were once home to live This similarity suggests that results obtained in this study are
CWC reefs may somewhat explain the identification of slope representative of reality and are not an artifact of data structure.
as a significant driver of benthic assemblage structure in the Because the five variables identified here as significant are so
South Atlantic. The wide range of FBPI values at Ascension and over the vast latitudinal range of the data, individual site-specific
St. Helena suggest the seabed is relatively “bumpy,” with parts drivers, such as small-scale local hydrographic features, have
that sit above or below surrounding areas such as gulleys and likely been overlooked because they are not representative of
reefs. These seabed depressions allow for the accumulation of the whole dataset. In this sense, we have been able to identify
sediments within them, hence the identification of some soft common variables across the basin, and therefore those that
substrate assemblages within the tropical data (e.g., cluster u), are likely to influence many seamounts (at least in tropical and
providing a link between geomorphology and substrate type. temperate areas). Whilst this represents a significant progression
However, the sampling restrictions of the SUCS under-represent in the understanding of seamounts in the South Atlantic, it is
steeper areas and cliffs, and thus potentially miss additional important to continue to assume a precautionary stance when
biodiversity (Huvenne et al., 2011). generalizing these ecosystems.
More gently sloping areas can also be found on seamounts,
typically around the summit region. These areas are generally Biological Communities
subject to slower currents that allow for the build-up of The SIMPROF test identified a large number of assemblages
sediment to create soft substrate environments, or allow for the present at Tristan (16 out of 22) in comparison to the six
accumulation of cobbles that are not swept away (as frequently clusters containing all transects from Ascension and St. Helena
observed at Tristan). These rocks increase substrate heterogeneity (Figure 5), suggesting that assemblage diversity is higher at
that has been shown to increase the macrofaunal diversity of Tristan than the other territories. Spatial and seasonal differences
an area due to required adaptations (Taylor and Wilson, 2003; in water mass structure, as outlined above, across the Tristan
Frontiers in Marine Science | www.frontiersin.org 11 October 2021 | Volume 8 | Article 660648Bridges et al. Benthic Assemblage Composition of Seamounts
EEZ likely explain why the biological data from Tristan splits bathymetric range from which the data are collected for this
into many distinct assemblages; there will be taxa acclimated study (170–1010 m). Both Bridges et al. (in review), using a
to the warmer waters around the northern island group, some subset of the data presented here, and Woolley et al. (2016)
to the cooler waters around Gough Island and a number of found that in the upper ocean (down to 1000 and 2000 m,
assemblages on the seamounts that can tolerate fluctuations respectively), variables linked to solar energy input were better
in temperature and salinity throughout the seasons. Although predictors of diversity than particulate POC flux to depth. The
increased productivity due to frontal proximity may explain high data extracted for each transect for POC flux to depth comes
numbers of assemblages in temperate latitudes, it is important from Lutz et al.’s (2007) model that uses depth as a function.
to note that six sites (i.e., seamounts and oceanic islands) were Using satellite-derived, surface primary productivity data for
sampled at Tristan in comparison to the three at St. Helena these shallower ranges, represents better productivity data than
and four at Ascension. The disparity in the number of different Lutz et al. (2007) and therefore explains why it is not a selected
sites sampled per EEZ is likely somewhat responsible for the variable in the DistLM best solution. However, another possible
higher numbers of assemblages observed at Tristan, also possibly reason may be the mismatch of scale between the biological data,
confounded by the fact that the Tristan EEZ forms a larger area and the resolution at which both surface primary productivity
than the EEZs of the other territories due to the location of the and POC flux to depth are available. Productivity datasets were
southern island group. only available at 9.2 km resolution and therefore would not
Tristan’s benthic assemblages are characterized largely by facilitate intra-site comparisons. This said, they do allow for inter-
filter-feeding taxa such as sponges (both structure-forming and site and inter-territory comparisons and ultimately represent the
encrusting) and hard-bottom Caryophyllia cup coral species. best available data.
Contrastingly, tropical benthic assemblages found at Ascension
and St. Helena are frequently dominated by scavenging and/or Vulnerable Marine Ecosystems
detritivorous taxa including CWC reef-associated Ophiuroidea Seamounts contain VMEs, and the seamounts of the South
(brittle stars) and cidarid sea urchins (Table 3). Surface primary Atlantic are no exception, with VMEs being recorded in all three
productivity is thought to drive diversity patterns in the deep territories. Significantly more, both in terms of abundance and
sea (e.g., Sun et al., 2006; Woolley et al., 2016; Bridges et al., in richness, were observed at Tristan, where 53% of transects were
review), but less work has focused on the effect it may have on considered VMEs. Whilst the epifaunal communities of the CWC
community structure. Benthic taxa inhabiting the seafloor below reefs in the South Atlantic are likely characterized by different
oligotrophic, low productivity surface waters such as those in species to those on reefs in the North Atlantic, there does seem
the tropics are likely to have developed strategies to help cope to be a strong crossover in the functional similarity and overall
with the sporadic food (energy) supply, and/or are less likely ecology of assemblages found in each basin on both D. pertusum
to have feeding strategies that heavily/solely depend on sinking and S. variabilis reefs. However, there is less similarity between
organic matter. Due to the specialist strategies employed by the coral garden and sea pen field assemblages. Descriptions of
successful species in these low productivity regions, communities each VME type are found below.
may be more likely to display high levels of dominance by fewer,
more specialist taxa that are able to thrive. This description is Cold-water coral reef
reflective of the patterns and communities observed at Ascension In our study, both D. pertusum and S. variabilis reefs were
and St. Helena. In contrast, Tristan is surrounded by high- recorded, but only the former was found in all three territories.
productivity waters and the deep-sea benthic taxa here are likely D. pertusum is a reef-building scleractinian known to have a
accustomed to relatively plentiful sinking organic matter upon ubiquitous distribution and has been recorded in reefs across the
which suspension and deposit-feeding taxa heavily rely. The South Atlantic, in both the Namibian and Brazilian EEZs (Hanz
greater food supply may, support more ecological niches, leading et al., 2019; Kitahara et al., 2020).
to communities at Tristan that: (a) are comprised of different taxa At Tristan, D. pertusum reef is recorded in one transect
to those found in lower productivity areas resulting in separate within cluster k that shows dense, living reef with a few attached,
SIMPROF clusters, and (b) have a higher species richness, with epifaunal taxa present (namely CWC reef-associated ophiuroids
less dominance by few, specialist taxa. This is evidenced by and some decapods), and multiple serranid fish (Lepidoperca
the higher number of characterizing taxa (and thus more even coatsii). Live reef is thought to support few attached epifauna
communities) counted in the 16 Tristan assemblages (Table 3), because the coral itself is successful in preventing biofouling
as well as the dominance of filter-feeding taxa (sponges, hydroids, (Freiwald et al., 2004). This transect may therefore correspond
corals etc.). Similar results linking high variability in community to the living summit region of the reef system (Mortensen
structure to surface chlorophyll-α concentration are described et al., 1995). When focusing on the mobile epifauna, this
by Clark and Bowden (2015) for a seamount chain in the Ross assemblages bears similarity with L. pertusa reefs described in
Sea, Antarctica. Although their surface productivity metric is Howell et al. (2010) in the North Atlantic that also had decapods
slightly different to the surface primary productivity data used and ophiuroids among the key epifaunal taxa. However, due to
in this study, both relate to the photosynthetic activity, and the limited images of this reef within the transect, more data is
induced productivity in surface waters above deep-sea benthic required to fully interrogate this comparison.
assemblages. Given this explanation, it is surprising that POC There is less literature describing assemblages associated with
flux to depth is not considered a significant driver of assemblage S. variabilis, but its presence is known in the South Atlantic
structure. We believe this is because of the relatively shallow [see Raddatz et al. (2020) for compiled presences]. Cluster q
Frontiers in Marine Science | www.frontiersin.org 12 October 2021 | Volume 8 | Article 660648Bridges et al. Benthic Assemblage Composition of Seamounts
contains deeper S. variabilis reef from Tristan, although much Hard-bottom cup coral fields and/or coral gardens
of the structure is dead with very few small patches of live Hard-bottom cup coral fields and coral gardens were only
coral. Frequently observed epifaunal framework taxa in our observed within the Tristan EEZ. The substrate in these areas
images consist of CWC reef-associated ophiuroids, encrusting typically consisted of cobbles and boulders, on which the corals
sponges, squat lobsters and hydroids. Davies et al. (2014) describe were growing. Clusters b, c, h and n were all identified as
an “ophiuroids and Munida sarsi associated with coral rubble” being mosaic assemblages representing both cup coral fields
biotope with which cluster q is similar to in some respects. and coral gardens dominated by gorgonians (often Thouarella
Parallels can be drawn between the strong presence of ophiuroids spp.), multiple stylasterid taxa and occasionally antipatharians.
and squat lobsters, but their study describes this assemblage as Despite their protected habitat status, there are few descriptions
corresponding to the “Lophelia rubble zone” [sensu Mortensen of the assemblages that often form coral gardens to compare
et al. (1995)]. However, if the ophiuroids and squat lobsters our findings to. Davies et al. (2015) describe multiple types of
simply require dead framework as opposed to live reef, it may not coral garden in the North Atlantic and identify high numbers
be significant as to whether the reef is intact or in rubble form. of Caryophyllia spp. cup corals and sponges in their coral
Mortensen et al. (1995) and Roberts et al. (2009) describe dead gardens; both of these are true for Tristan coral gardens also.
framework as being characterized by sponges, gorgonians and However, the North Atlantic coral gardens also appear to be
hydroids. This is similar to the epifaunal assemblage observed dominated by larger corals such as Keratoisis spp. or patches
here, although it is on a different species of reef-building of reef-building scleractinians [this is similar to coral gardens
scleractinian coral. in the Mediterranean that harbor large individuals (Bo et al.,
For Ascension and St. Helena, all the D. pertusum reef clusters 2012)]. Although they were not classed as coral gardens because
together in t, where 6 of the 14 transects within the cluster they were too sparse, Bullimore et al. (2013) do describe coral-
were deemed to be this VME, although again much of the dominated assemblages but similarly to Davies et al. (2015),
reef framework is dead with only small, infrequent patches stylasterids are not listed as a typical taxa; at Tristan, lace corals
of live coral. Coral framework is thought to facilitate higher are present in most of the coral garden clusters. The distinct
diversity than areas of the living reef (Jensen and Frederiksen, lack of large individuals and the presence of numerous small
1992), often supporting suspension feeders and other coral stylasterids in the coral gardens at Tristan is perhaps driven
species (Mortensen et al., 1995). The notion of higher diversity by the substrate in the coral gardens at Tristan being unfixed,
associated with coral framework appears to hold true for the and therefore unable to support larger (heavier) corals. Multiple
D. pertusum reef in cluster t. Frequently observed epifaunal sponge species are acknowledged as being associated with coral
taxa on the reef framework consist of a bright orange anemone, gardens in both the similar coral garden assemblages from Davies
multiple species of the sponge genus Aphrocallistes, dense mats of et al. (2015), and are considered characterizing taxa of the Tristan
ophiuroids, and small patches of live Madrepora oculata, another coral gardens (Table 3). The disparities in the morphologies of
species of reef-building scleractinian. Reef is interspersed with key taxa when comparing Tristan’s coral gardens to those found
soft sediment areas providing habitat for the same soft-bottom elsewhere suggest those found at Tristan may not be widespread
dwelling taxa (typically Cidaris sp., soft-bottom Caryophyllidae in the North Atlantic.
cup corals and often the large anemone, Actinauge richardi) as
the wider expanses on soft sediment found within the same Sea pen fields
cluster; this is likely why D. pertusum reef does not cluster Only one sea pen field was recorded in the data, located in cluster
individually. Frequent patches of soft sediment within reef t (alongside the D. pertusum reef). The fields were comprised
framework are also described in the “predominantly dead low- of two morphospecies of sea pen and appeared to be located
lying coral framework” biotope from Davies et al. (2014), as are around the edges of the D. pertusum reef in soft sediment
live patches of M. oculata. alongside cidarid urchins. Unfortunately, there has been no
Cluster v is comprised of transects found significantly deeper confirmed identification of the sea pens beyond the rank of order
than the above clusters, and is the only assemblage containing (Pennatulacea), although one appears similar to species in the
S. variabilis reef. Images show a mixture of dead framework Protoptilum genus. Despite the habitat being suitable for other
and coral rubble, suggesting this transect may represent the taxa such as cerinathids and other soft-bottom fauna, the area
transition zone between the dead framework slope and rubble appears to only support sea pens and urchins. This is unlike the
apron (Mortensen et al., 1995). Much of the dead reef and sea pen fields described by Davies et al. (2014) and Howell et al.
surrounding rubble in cluster v provides habitat for brachiopods, (2010) that both describe populations of cerinathids within sea
encrusting sponges or small ophiuroids. In areas where the pen fields. Sea pens are known to enhance the biodiversity of an
framework is more intact, there are aggregations of brisingids area by increasing habitat heterogeneity (Buhl-Mortensen et al.,
and antipatharians. This description seems to reflect parts of the 2010) however, it is not possible to record epifaunal communities
description of the epifaunal communities on dead framework on the sea pens from this dataset due to the downward facing
in Freiwald et al. (2004). The cluster also contains large areas angle of the camera. Due to the single occurrence of this VME,
of exposed bedrock that support the same/similar taxa as those and the clustering with other VMEs, it is difficult to distinguish
found on the framework. The exposed bedrock suggests the the characterizing taxa of the sea pen field itself, although
presence of reasonable currents in the area which may explain visual inspection suggests the sea pens themselves dominate and
the higher diversity of filter feeding epifauna in cluster v. potentially outcompete other taxa.
Frontiers in Marine Science | www.frontiersin.org 13 October 2021 | Volume 8 | Article 660648You can also read