Background Noise? TV Advertising Affects Real Time Investor Behavior
←
→
Page content transcription
If your browser does not render page correctly, please read the page content below
Background Noise? TV Advertising Affects Real Time
                 Investor Behavior∗
                     Jūra Liaukonytė                  Alminas Žaldokas

                                           February 2019

                                               Abstract
       Using minute-by-minute television advertising data covering approximately 326, 000
       ads, 301 firms, and $20 billion in ad spending, we study the real-time effects of TV
       advertising on investor search for online financial information and subsequent trading
       activity. Our identification strategy exploits the fact that viewers in different U.S.
       time zones are exposed to the same programming and national advertising at different
       times, allowing us to control for contemporaneous confounding events. We find that
       an average TV ad leads to a 3% increase in SEC EDGAR queries and an 8% increase
       in Google searches for financial information within 15 minutes of the airing of that
       ad. Such advertising effects spill over through horizontal and vertical product market
       links to financial information searches on closest rivals and suppliers. The ad-induced
       queries on the advertiser and its key rival lead to higher trading volumes of their
       respective stocks. For large advertisers, around 0.8% of daily trading volume can
       directly be attributed to advertising. This suggests that advertising, originally intended
       for consumers, has a sizable effect on financial markets.

Keywords: Advertising; Limited Attention; Information Acquisition; Investor Behavior

JEL Classification: G11, G12, L15, M37
   ∗
     Jūra Liaukonytė: Cornell University, jurate@cornell.edu; Alminas Žaldokas: Hong Kong University of
Science and Technology (HKUST), alminas@ust.hk. We thank our discussants Prachi Deuskar, Lisa George,
Nick Hirschey, Markus Ibert, Weikai Li, Joel Waldfogel, and James Weston. For valuable comments we
also thank Umit Gurun, Harrison Hong, Byoung-Hyoun Hwang, Ryan Israelsen, Matti Keloharju, Simas
Kučinskas, Dong Lou, Matthew McGranaghan, Abishek Nagaraj, Joel Peress, Daniel Schmidt, Brad Shapiro,
Scott Yonker, Kenneth Wilbur, and the seminar participants at Boston University, Cornell University, Uni-
versity of Texas at Dallas, HKUST, and Bank of Lithuania as well as conference participants at the Baltic
Economics Conference 2018, 16th ZEW Conference on The Economics of Information and Communication
Technologies 2018, ISB Summer Research Conference in Finance 2018, 11th Workshop on the Economics of
Advertising and Marketing 2018 (Columbia University), the 29th Conference on Financial Economics and
Accounting (Tulane University), SFS Cavalcade Asia-Pacific 2018, Tel Aviv University Finance Conference
2018, and the Paris December Finance Meeting 2018. Alminas Žaldokas gratefully acknowledges the hospi-
tality of the McCombs School of Business at The University of Texas at Austin, which hosted him during
the academic year of 2017-2018 when part of this research has been conducted.
1         Introduction

Prior research has widely recognized that investors exhibit limited attention when considering
their investment opportunities (e.g., Barber and Odean (2008); Abel et al. (2013)). However,
the empirical literature studying the causal effects of exposure to and reminders about firms
on investor behavior is scant. This may be due in part to the challenge involved in designing
or finding experimental settings that expose investors to firms, holding the larger context
(e.g., news coverage) in which a firm operates constant. In this paper, we consider that
within a sufficiently short time frame TV advertising can be interpreted as an attention
shock that puts an advertising firm on investors’ radars. Such an attention shock may
carry an informative signal about the firm’s financial position (Nelson, 1974; Kihlstrom and
Riordan, 1984) or serve simply as a non-informative reminder making advertisers more salient
to investors with limited attention (Merton, 1987).
        Using high-frequency data on TV advertising1 with real-time geography-based identifica-
tion, which allows us to control for contemporaneous news about a firm, we find a causal link
between advertising and the search for an advertiser’s financial information. Such ad-induced
searches on advertising firms are linked to the increased trading volume of their respective
equity securities. Specifically, we find that each dollar spent on advertising translates to
51.3 cents of additional trading activity for the advertiser’s stock. Ad-induced searches are
associated with positive overnight stock returns but these returns partially reverse during the
next trading day. Importantly, we show that such advertising carries both informative and
non-informative signals. Furthermore, to our knowledge, our paper is the first one to show
the causal effect of a firm’s advertising on the investor interest in the advertiser’s closest rival.
Taken together, the evidence presented in this paper suggests that the advertising effect on
investor actions is more immediate and far-reaching than has previously been documented.
    1
    TV is the dominant advertising medium by expenditure, constituting around 40% of total corporate
advertising expenses (eMarketer, 2016). In addition, TV consumption is associated with multitasking, which
allows us to capture its immediate effects. Nielsen (2010) reports that 34% of all Internet usage time occurs
simultaneously with TV consumption, whereas Council for Research Excellence (2014) finds that 69% of TV
viewers consume one or more additional media platforms concurrently.

                                                     1
Firm advertising is a good proxy for how visible a firm is to investors beyond their
participation in financial markets (Grullon et al., 2004) and thus studying advertising effects
on investment behavior can help explain how investors react to attention shocks. However,
given confounding events that might affect both investor interest and advertising (Cohen
et al., 2010; Lou, 2014; Fich et al., 2017), co-determination of profitability (and thus stock
returns) and advertising (Comanor and Wilson, 1967; Schmalensee, 1976, 1983), as well as
the dual nature of investors as consumers (Keloharju et al., 2012), discerning the causal
effect of ads on investor actions is challenging.
In this paper, we are able to overcome the aforementioned endogeneity concerns by uti-
lizing a novel quasi-experimental identification approach. We examine how real-time TV
advertising affects contemporaneous investor interest in the advertiser within a narrow time
window after their ad. We rely on minute-by-minute data at the ad insertion level represent-
ing 301 publicly listed US firms over a sample period that runs from 2015 through 2017.2
Studying the effect within a narrow time window ensures that firms cannot strategically
time their ads within that time window due to institutional constraints of TV advertisers
not being able to pick the exact timing for their ads (Wilbur et al., 2013). The use of such
high-frequency data also mitigates the concern that the effect of advertising is systematically
confounded with other actions undertaken by the firm or news about it and also enables us
to measure the immediate effect of advertising on investor behavior.
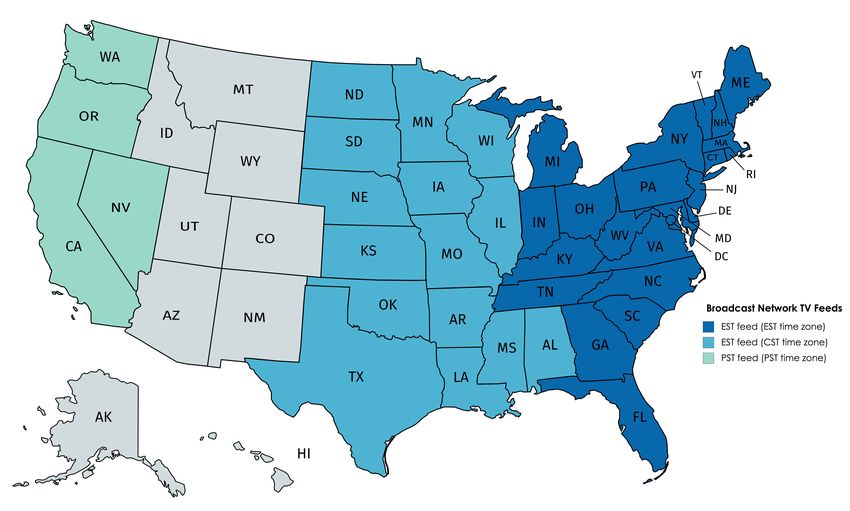
In addition to using real-time data, we also exploit a unique feature of broadcast net-
work TV programming. Most network TV programs and the associated national advertising
are first broadcast in the Eastern Standard Time (EST) and Central Standard Time (CST)
zones simultaneously, after which the signal is held and broadcast on a three-hour delay in
the Pacific Standard Time (PST) zone. Thus, when a particular advertisement is broadcast
in the easterly time zones (in EST or CST rather than in PST), we can analyze the behavior
of investors in these exposed time zones, using the behavior of investors in the contemporane-
2
Our sample includes all of the publicly listed companies that advertised during our studied time period.
These companies together represent 64% of overall TV advertising expenditures.
2ously unexposed time zone as the control. In this way, we control for any other confounding
real-time effects involving the advertiser.
In particular, we study how TV advertising affects financial information acquisition via
the SEC EDGAR database. We match the internet protocol (IP) addresses from SEC
EDGAR visitation logs to geographic locations, allowing us to identify the timezone from
which the visitation originated. We then construct a firm×time zone×15 minute interval
panel and control for fixed effects that capture contemporaneous confounding signals about
the advertising firm such as news, fixed effects that capture differences in Internet searching
or TV viewing behavior across time zones at a particular time, and fixed effects that capture
non-time-varying differences in investor information sets about an advertising firm such as
local bias based on the firm’s location of operations.
After controlling for the potential confounders, we find that, on average, a TV ad leads
to an immediate 3% increase in queries about the advertising firm on SEC EDGAR and an
8% increase in Google searches. The effect is stronger during primetime viewing hours and
for more expensive ads, and also on days of major firm financial events, in particular M&A
transactions and earnings announcements. We also find that this effect is the strongest for the
advertisers in the financial sector followed by firms in pharmaceuticals and consumer staples.
For instance, the effect rises to 11% in the case of ads of financial firms during primetime TV
hours. We do not find that our ad-related queries are influenced by automated bot traffic
and the effect disappears completely in a timing falsification test wherein we insert placebo
ads in time intervals preceding actual ads.
We further show that these advertising effects spill over through horizontal and vertical
product market links. Specifically, we find that advertising can be causally linked to real-
time financial information acquisition about an advertiser’s primary rival and major supplier,
suggesting that, as a function of an attention shock to a specific firm, investors also seek
further information to evaluate the competitive environment of that advertiser.
Zooming in on the IP addresses that follow up with SEC EDGAR searches on an ad-
3vertiser after its TV ad in a treated timezone, we find that over our sample period 164, 000
distinct, non-bot IP addresses search within 15 minutes after the airing of an ad, suggesting
a widespread effect. The IP addresses that search immediately after ads air are notably
more frequent users of the SEC EDGAR database relative to a typical SEC EDGAR user,
implying a certain degree of user sophistication.
We further reconfirm that the effects of advertising on investor information search are not
confined to queries on the SEC EDGAR database but are also present in financial information
searches on Google. Comparing ad-induced SEC EDGAR queries with ad-induced Google
financial searches, we find that the Google effect is greater in magnitude and is statistically
significant for more firms. Given a larger economic effect on Google searches, it is likely that
our estimates pertaining to SEC EDGAR searches constitute a lower bound of the TV ad
effect on investor information search behavior.
Next, we show that searching for financial information is related to trading activity.
Specifically, we show that higher ad-induced search during primetime TV hours (which
occur after trading hours) leads to higher trading volume of the advertiser’s stock during
the following day. In particular, a one-standard-deviation increase in daily real-time SEC
EDGAR searches increases the trading volume by 0.49%. This effect comes solely from the
intensive margin, i.e., high ad-induced searches, rather than the extensive margin, i.e., any
ad airing. When looking at the trading activity of an advertiser’s rivals and suppliers, we find
that ad-induced information search on the closest rival translates to higher trading volume
of the rival’s stock, but find no such effect for the advertising firm’s suppliers.
We finish by studying the heterogeneity of the effect, which allows us to investigate when
TV advertising affects investors by serving as an informative and when as a non-informative
attention signal. As a result of being exposed to an advertisement, investors might anticipate
consumer reaction3 and the subsequent effect of this reaction on firm financials. Thus, ads
3
This holds even if ads seemingly lack informative content for consumers as long as investors anticipate
that advertisements can change consumer behavior by altering their preferences (e.g., by making demand
for the advertised product less elastic).
4might send an informative signal to investors, inducing them to act promptly.4 Alternatively,
ads might have no informative content for investors but simply raise salience about the firm.5
To differentiate these informative and non-informative attention shocks, we investigate how
the effect varies with the time that elapses since the first airing of a given advertisement,
arguing that the first time a specific ad creative is shown should be the most informative. We
find that older ads are followed by smaller financial information search effects, suggesting that
there exists an informative signal that dissipates as the novelty of the advertisement wears
off. On the other hand, such a negative relationship is absent when a firm’s advertising is in
the timezone in which the firm’s headquarters are located; in these cases the non-informative
attention effect dominates.
Our study contributes to several strands of literature. We primarily relate to research on
the effects of product advertising on investor behavior and firm financial decisions (Grullon
et al., 2004; Srinivasan and Hanssens, 2009; Gurun and Butler, 2012; Lou, 2014; Madsen
and Niessner, 2016). The literature has suggested multiple reasons why advertising can be
endogenous to investor behavior.
First, firms strategically choose where, when, and how often to advertise. Advertising
campaigns have been shown to coincide with earnings announcements, product launches,
equity issuances, stock option exercises, and M&A transactions (Cohen et al., 2010; Lou,
2014; Fich et al., 2017). Firms might also strategically adjust their advertising in response to
external events that are independently correlated with investor interest. They might increase
advertising to offset negative media coverage of product recalls or corporate scandals (Gao
et al., 2015). Other confounding signals about a firm, such as news about product market
rivals can be correlated with both advertising and investor interest.
4
Recent anecdotal evidence suggests that investors increasingly rely on diverse information sources that
help them unlock potential trading signals and give them an ‘information edge’. For instance, Financial
Times (2018) writes that in the past two years investment groups have more than doubled their spending on
alternative data sources that could potentially provide information on future fundamentals. Such alternative
data sources (see, e.g., www.alternativedata.org) include social media feeds, product reviews, satellite images,
credit card sales, and geolocation data, among other data.
5
This is a similar distinction to the one discussed in DellaVigna and Gentzkow (2010) that distinguishes
between belief- and preference-based persuasion models.
5Yet another potentially confounding factor is that both higher advertising spending and
more active investor interest in a firm’s stock might be co-affected by the firm’s recent posi-
tive stock performance. Increasing stock prices might grab the attention of, say, momentum
traders, but would also simultaneously increase firm valuation, which in turn could reduce
financial constraints on marketing expenditures. Similarly, advertising and profitability are
simultaneously determined and positively related to omitted variables that induce large
markups (Comanor and Wilson, 1967; Schmalensee, 1976, 1983), thus the relationship be-
tween advertising and investor actions might simply reflect its relationship with profitability.
Finally, advertising might affect investor behavior indirectly by increasing product sales
and thus raising the probability that an investor is personally familiar with an advertised
product (Keloharju et al., 2012). In such a case, the investment decision is affected by
investor-consumer familiarity with the advertiser rather than directly by advertising.
All of the abovementioned factors complicate the study of the relationship between ad-
vertising and investor behavior. Thus, the advertising expenditure data that are aggregated
annually, monthly, or even daily are unlikely to provide satisfying evidence of the causal
effect. Meanwhile, our paper uses high frequency data, focuses on the advertising medium
with the widest reach, and relies on a quasi-experimental research design to overcome iden-
tification challenges present in prior research.
More broadly, our paper contributes to the literature on investor attention (Peng and
Xiong, 2006; Barber and Odean, 2008; Abel et al., 2013) and, in particular, we relate to
the work on investor information acquisition from media and web sources (Da et al., 2011;
Ben-Rephael et al., 2017; Loughran and McDonald, 2017). Additionally, Chen et al. (2018)
present compelling evidence that investors use the information from SEC EDGAR and show
that this information in turn has implications for portfolio choices. In a way, our estimation
approach captures a shock to investor attention and provides evidence that exogenously gen-
erated investor attention translates into searching for financial information on SEC EDGAR
and Google. We also find that such salience shocks spread to a firm’s rivals and suppliers,
6i.e., increased attention to a stock affects information collection pertaining to a given sector
more generally, thus relating to predictions in Peng and Xiong (2006).
In this respect, our paper is also related to the studies of the effects of media on investor
attention (e.g., Chan (2003); Tetlock (2007); Engelberg and Parsons (2011)). While both
advertising and media are likely to attract the attention of investors, these two attention-
grabbing channels are substantially different. For example, financial media is strongly asso-
ciated with the dissemination of information intended for investors (Fang and Peress, 2009;
Peress, 2014). On the other hand, TV advertising is directed primarily at consumers and has
indirect effects on investors. Moreover, a given company is rarely fully in control of its media
coverage, whereas advertising is a firm’s strategic choice and therefore is less influenced by
the interests and incentives of other parties such as media companies and journalists. Our
research thus provides evidence that a channel that is under a firm’s control does affect
investor actions.
2 Empirical Methodology
2.1 Institutional Details
Our identification strategy relies on different geographic locations being exposed to the same
TV commercials at different times. Five U.S. national network TV broadcast-over-the-air
channels (ABC, CBS, CW, FOX, and NBC) use only one feed for all of their affiliate local
partners scattered around the country.6 When the broadcast feed goes out, each station picks
up the signal to broadcast it immediately (EST or CST time zones) or they hold the feed
for broadcast at a later time (MST or PST time zones). For example, when New York airs
the feed live at 8pm EST, Chicago airs the same feed live at 7pm CST. Meanwhile, Denver
receives the feed at 6pm local time and broadcasts it 7pm MST and Los Angeles receives
6
These channels are also by far the most watched TV channels in the U.S. with the most expensive
advertising slots, constituting 80% of the daily TV viewership (Nielsen, 2016).
7the feed at 5pm local time and broadcasts it to their viewers at 8pm PST. We refer to these
programs and ads that are shown at different times in different time zones as time-shifted
programs and ads.7
Time-shifted programs include national TV shows broadcast in primetime TV hours
(8pm-11pm), late night shows, news shows (6:30pm-7pm), and morning shows (7am-9am).
The remaining programming is local or includes live shows such as sporting and election
events that are shown simultaneously in all time zones. We manually cross-verify all program
categories with TVGuide.com to make sure that we are not attributing live events to time-
shifted programs in our analysis.
Finally, an important institutional detail for our identification strategy is that firms can
choose what program to advertise on, but they cannot pick the exact time when to advertise.
Advertising contracts require networks to assign commercials to slots within commercial
breaks on an equitable basis, which is commonly understood to mean quasi-random (Wilbur
et al., 2013). This assertion has been verified in our advertising dataset by McGranaghan
et al. (2018) who show that the empirical distribution of average ad position placements
within advertising breaks is consistent with a random placement of ads.
Our novel double difference identification approach is more robust and more appropriate
for financial market contexts (where the primary concern is about confounding contempora-
neous effects) than the single difference identification approach used in marketing literature
by Du et al. (2017), Joo et al. (2014), and Lewis and Reiley (2013), who show that TV
commercials cause internet search spikes, and Liaukonytė et al. (2015) who show that this
search effect also extends to online sales of the advertised products.
7
Given that local stations in EST and CST broadcast the feed at the same time, in our analysis we
consider these time zones together and further refer to both EST and CST time zones as EST. Section
4.3 presents robustness tests with EST and CST time zones considered separately. In order to reduce the
possibility that some of TV viewers can observe multiple feeds, we remove MST from the analysis. Figure 1
shows the map how we assign the states into two time zones – EST and PST.
82.2 Specification
Given that only some geographic locations are treated at a given time, our identification
strategy can control for contemporaneous confounding events. At each quarter of an hour
interval8 , we record two observations for each of 301 publicly traded firms that had at
least one ad during the time-shifted programming in our sample period. One of these two
observations includes the number of searches for the firm’s filings on SEC EDGAR database
coming from the EST time zone in this 15 minute interval while the second one of these
observations records the number of searches coming from the PST time zone in the same
15 minute interval.9 Note that if a commercial is aired in the EST time zone in that 15
minute interval, only “EST observation” is treated while the “PST observation” acts as a
control, and this is reversed 3 hours later when “PST observation” becomes treated and
“EST observation” becomes a control.
Our specification is thus estimated at a firm × 15 minute interval × time zone level:
Ln(EdgarIP Searches)itk = β × Aditk + γit + κik + θtk + itk (1)
where i indexes the firms, t indexes time at a 15 minute interval, k indexes the time zones
(EST or PST). Ln(EdgarIP Searches)itk refers to the log number of times that firm’s i
filings were accessed on the SEC EDGAR database in a t 15-minute time interval from the
IP addresses that are associated with the time zone k. Aditk refers to a dummy whether at
least one broadcast channel aired a commercial of the firm i during t 15-minute time interval
in the time zone k.
We control for three sets of fixed effects. First, γit , a fixed effect constructed at a 15
8
The choice of 15 minute interval balances between providing enough response time after an ad airing
(e.g., 5 minutes might be too short, especially if an ad falls towards the end of the interval) and having
confounding effects if the interval is too long. In Section 4.3, we provide robustness by considering 10 minute
and 20 minute intervals.
9
Due to an uneven average distribution of ads within different 15 minute intervals, we define our intervals
starting at 5 minutes past each hour. Internet Appendix 1 details the rationale of this methodological choice.
In Section 4.3 we show that our results are robust to alternative interval definitions.
9minute interval × firm level, controls for what is happening nationally with the firm i in this
15 minute time interval t. That is, this effect captures any contemporaneous confounding
signal about the firm, e.g., news about the firm itself or general news that might affect the
firm. Given γit , our advertising effect can only be identified on the time-shifted commercials.
Second, κik , a fixed effect constructed at a firm × time zone level, controls for differences
in the baseline interest about the firm i across time zones k. For instance, it controls for
the differences in the non-time varying investor information set about the firm or local bias
based on the firm’s location of operations.
Third, θtk , a fixed effect constructed at a 15 minute interval × time zone level, controls
for any events happening in the time zone k at a particular time t that is unrelated to the
firm. For instance, this fixed effect would capture the differences in the time of the day
habits, or the differences in internet browsing patterns, or TV watching behavior across time
zones k at time t (e.g., baseline search differences at February 15, 2017, 9:15AM EST versus
February 15, 2017, 6:15AM PST).
3 Data
3.1 Information Acquisition
Our main measure of information acquisition is based on how often firm’s SEC filings were
accessed via SEC EDGAR database from the IP addresses associated with each time zone.
SEC EDGAR database hosts all mandatory filings by public companies such as 10-K filings,
8-K filings, as well as forms 3 and 4, and other filing documents. SEC EDGAR database
has been frequented by over 100, 000 unique daily users on average in our sample period of
2015-2017Q1.10 As suggested by Drake et al. (2017), SEC EDGAR users are more likely to
10
This financial information is also disseminated by the data providers such as Bloomberg, Morningstar,
or Thomson Reuters and thus our estimates provide a lower bound of the effect of advertising on financial
information search. See Li and Sun (2018) for the discussion on what investors might see as SEC EDGAR
advantages over other information sources. For example, other sources often condense financial statements
into pre-specified formats and thus some components of firms’ financial information may be misrepresented.
10be higher income and more educated individuals than the rest of population.
We obtain the server request records from the EDGAR Log File dataset available on
the SEC’s web servers. This dataset maintains a log file of all activity performed by users
on EDGAR such as the client IP address, timestamp of the request, and page request. IP
addresses in the dataset are partially anonymised using a static cypher (e.g., 24.145.236.jcf ).
In mapping IP addresses to the geographic locations, we consider all 256 possible IP addresses
in the anonymised range (e.g., 24.145.236.0−24.145.236.255). We then map all the addresses
in this range to the geographic locations (at a zipcode level), using Maxmind data. Maxmind
periodically tests the accuracy of the data used in their databases by checking known web
user IP address and location pairs against the data within their databases. The reported
location accuracy falling within 150 miles of the true location is 91%.11
After we perform the matching, we check whether all matched zipcodes fall within the
same continental US time zone (either EST/CST, or MST, or PST). If that is the case, we
attribute this query to that time zone. If some of the 256 possible addresses map to different
time zones, we exclude this access event from our analysis.12 We then aggregate the matched
geographic location IP searches for each time zone at the 15 minute intervals.
Following past literature (e.g., Lee et al. (2015)), we exclude IP addresses that have
performed more than 500 queries on SEC EDGAR database during a day as these are likely
to be automated searches. As we report in Section 4.3, our results are consistent if we exclude
IP addresses that have performed more than 50 queries during the day.
3.2 TV Advertising
Our TV advertising data come from Kantar Media. Kantar monitors all TV networks in
the U.S. It identifies national commercials using codes embedded in networks’ programming
Also, some accounting information such as operating leases as well as qualitative information contained in
10-K filings are not easily available in these data consolidators (Loughran and McDonald, 2011).
11
Given our broad definition of geographic areas, i.e., at the time zone level, the relevant accuracy metric
is likely to be much higher than 91%.
12
We lose fewer than 5% of observations in this step. If there remains any measurement error after these
steps, it is likely to be very small and unlikely to systematically bias our treatment effect.
11streams. We observe every commercial at the ad “insertion” level, defined as a single airing of
a particular advertisement on a particular television channel at a particular date and time.
For each such insertion, the database reports the advertised brand, the parent company
of the advertised brand, the date and start time (in hours, minutes, and seconds), and an
estimated insertion cost. The data also include the characteristics of the programming where
the ad was inserted, i.e., the channel (e.g., CBS) and the program name (e.g., “Survivor”).
We manually match the name of the ultimate owner of each advertiser to the CRSP/
Compustat and SEC CIK databases. In the rare cases of joint commercials (i.e., when
multiple firms are listed as advertisers for the same ad), we create entries for both advertising
firms. Our final sample includes 301 publicly listed firms that advertise on the five channels
in the time-shifted national programs in the years 2015-2017 Q1.
3.3 Descriptive Statistics
Table 1 provides descriptive statistics for our data. Panel A provides summary statistics for
the advertising data on the time-shifted ads of 301 publicly listed firms. Our dataset covers
326, 745 unique ad insertions with an average estimated cost of $61k and the total cost of
$20bn. As expected, primetime TV ads are more expensive, costing $87k on average. These
181, 266 primetime TV ads constitute 78.4% of total ad expenditure in our data.
Panel B reports the representation of firms in our data across different industry sectors.
We group firms into broad industry sectors, using Global Industry Classification Standard
(GICS), developed by MSCI and S&P. Most of the firms in our sample are in the consumer
discretionary sector, followed by consumer staples. We see few firms from materials, utilities,
energy, and real estate. Consumer discretionary sector constitutes the largest share of the
total advertising expense, contributing 39% of total advertising expenditure in our data.
Panel C provides the summary statistics of our sample firms’ financial information based
on Compustat, CRSP, and Thomson Reuters 13f data. We report the 2014 fiscal year data.
In Panel D we report the total number of SEC EDGAR queries for the firms in our sample
12over 2015-2017Q1. We also separately report the split of the searches coming from EST and
PST time zones. Here in column (1) we exclude IP addresses that have performed more
than 500 queries on SEC EDGAR database during the day and in column (2) we exclude IP
addresses that have performed more than 50 queries. In column (3), we provide the number
of searches for the queries related to the firm’s financial position and the annual reports
(forms 10-K, 10-Q), in column (4) – the filings on material events (form 8-K), in column
(5) – firm’s insiders and beneficial ownership (forms 3, 4), and in column (6) – other filings.
In column (7), we only look at the SEC EDGAR queries that come from the IP addresses
with more than 500 queries during the day that we call automated bot queries, which in our
sample constitute around 90% of all of the traffic on SEC EDGAR and which we further
exclude from the analysis.
Overall, we see that approximately 80% of the queries originate from EST and CST,
which is consistent with the East Coast being the main region of financial activity.
4 Main Findings
4.1 Univariate Analysis
We start with the univariate analysis. Our identification strategy relies on search variation
being present (i) in short time intervals when an ad was aired as compared to when an ad was
not aired in one time zone and (ii) such patterns being different across treated and untreated
time zones. Figure 2 illustrates an example of such variation with a specific Citigroup ad
on March 3, 2017. Panel A illustrates SEC EDGAR queries in both time zones before and
after the ad is shown in EST (but not yet in PST), whereas Panel B illustrates the pattern
when the same ad is shown 3 hours later in PST.
We look at whether such patterns exist, on average, across all ads in our sample. In
particular, we calculate the effect on SEC EDGAR queries by taking a double-difference,
where the first difference is taken between the average log of number of queries during 15
13minutes when an ad was aired and when an ad was not aired in the time zone that was
exposed to that ad (EST or PST) and the second difference is taken over the corresponding
intervals in the other time zone that has not been exposed to that ad:
AdLif tckt = [ln(EdgarIP Searchesik |ad = 1) − ln(EdgarIP Searchesik |ad = 0)]−
[ln(EdgarIP Searchesik0 |ad = 1) − ln(EdgarIP Searchesik0 |ad = 0)] (2)
where c indexes commercials of firm i, t indexes time at a 15 minute interval with (ad = 1)
or without (ad = 0) an ad. For non-treated (ad = 0) 15 minute intervals, we consider only
the hours of the day that have timeshifted ads in our sample, i.e., only the hours that have
corresponding treated 15 minute time periods (ad = 1). k refers to one of the time zones
(EST or PST) where the c is broadcast at t and k 0 refers to the other time zone where the
c is not contemporaneously broadcast. ln(EdgarIP Searchesik ) refers to the log of number
of times that firm’s i filings were accessed on the SEC EDGAR database in 15 minute time
interval from the IP addresses that are associated with the time zone k.
We thus compare the SEC EDGAR queries for the firm i during the 15 minutes when an
ad was aired and when an ad was not aired in the time zone that was exposed to the ad and
then difference out any potential confounding effect happening contemporaneously in both
time zones by subtracting a level of SEC EDGAR queries for the same firm but in the other
time zone where the commercial was not broadcast during the same 15 minute interval.
In Table 2, Panel A, we report both the first difference only, and the double difference
that controls for the contemporaneous effects. We find that the effect is much smaller
when looking at double difference relative to the single difference, further reinforcing the
importance of our identification strategy and highlighting the fact that not controlling for
contemporaneous interest in a firm might overestimate the advertising effect. When looking
at the double differences, we find that on average there has been a positive and statistically
significant effect of the commercial broadcast on SEC EDGAR searches. Column (1) shows
14results for the whole sample. In column (2), we refine the analysis by only focusing on the ads
with an estimated cost of $50k. TV commercial’s estimated cost is known to correlate with
the possible reach of TV audiences and thus these more expensive ads should command a
higher economic effect. Column (3) focuses on the commercials over primetime hours (8PM-
11PM), where we expect the largest effect due to the larger audience reach in general but
also because financial market participants are more likely to be exposed to TV during the
primetime hours than during the trading hours. While columns (1)-(3) provide the estimates
for 15 minute intervals, in columns (4) and (5) we also show that the effect is present but
smaller if it is calculated for 10 minute and 20 minute intervals.
These univariate tests reported in Table 2, Panel A are suggestive of advertising affecting
investor search, however, there might still be confounding factors remaining due to different
search intensities and patterns at any given time across the analyzed timezones. We address
this in the Section below with our full econometric model.
4.2 Baseline Regression Results
Next, we move to the regression analysis where we adopt our baseline specification (1). Here,
contrary to the univariate tests in the previous Section, we rely on the balanced panel setting
with fixed 15 minute intervals.
Table 2, Panel B, presents our results where we estimate the contemporaneous effect of
TV ads on the queries about the firm on the SEC EDGAR website. Parallel to univariate
analysis, we provide results for four specifications. In column (1), we show the effect of any
TV commercial being broadcast. In column (2), we refine the analysis by only focusing on
the ads with an estimated cost of $50k that have a wider reach. We find consistent results.
In column (3), we only look at the ads during primetime that are the most coveted ad slots
due to their broad audience reach. We find that the point estimate is larger when we consider
only primetime ads. Finally, in column (4), we look at the log value of the total estimated
cost of TV commercials of the advertising firm in a particular 15 minute interval. Here we
15see that the effect size is increasing with the estimated ad cost. This result is consistent with
the fact that ad cost is highly correlated with the audience reach.
In terms of the economic significance, our results suggest that, on average, a TV ad
leads to 2.5% more queries about the advertising firm on SEC EDGAR database in a 15
minute time window, and this number increases to 3.2% if we look only at ads during the
primetime hours of TV broadcasting. As a comparison, Madsen (2016) finds that earnings
announcements increase daily SEC EDGAR queries by 36%, while news events about the
firm increase daily searches by 20%.
4.3 Robustness
We perform a number of robustness tests where we study the sensitivity of our results to the
definition of our outcome variable and also to how we capture ad insertions, especially with
regards to their timing. We report them in Table 3.
We start with the robustness tests with respect to the definition of the outcome variable.
Our first test narrows down the definition of automated queries. In the baseline analysis, we
exclude IP addresses that have performed more than 500 queries on SEC EDGAR database
during the day. In Panel A, column (1), we report the results if we exclude IP addresses
that have performed more than 50 daily queries. We see that our effect is both statistically
and economically stronger with a stricter automated bot traffic definition.
Our second test reverses the exercise. Here we only look at the SEC EDGAR queries
that come from the IP addresses that we have flagged as automated bots in our previous
analysis. Presumably, the bots that perform automated queries should not react to the TV
ads (although one could imagine an algorithm that would condition on the TV ad insertions).
Thus, we perform a falsification test where we reverse the analysis and only look at the SEC
EDGAR access from the IP addresses that have more than 500 queries during the day. The
absence of the identified effect, as reported in column (2), suggests that our result is not
mechanical and is not driven by any correlated patterns between SEC EDGAR and Kantar
16Media databases.
In our third robustness test, we only look at the first search by each IP address for each
advertising firm. In particular, for each IP address that is searching about an advertiser
within 15 minutes of its ad, we determine whether that IP address has accessed SEC EDGAR
reports on that advertiser at any time since 2012, and only record new searches. As shown
in column (3) we find a statistically significant, albeit smaller, ad effect on such “virgin”
searches. This suggests, that advertising not only acts as a reminder to continue investigating
previously explored firms, but also induces new searches for previously unexplored firms.
The fourth and fifth robustness checks focus on narrower geographic regions. First,
in column (4) we exclude CST and only compare searches originating from the actual EST
timezone to searches from PST. Second, in column (5), we impose an even stricter geographic
definition and compare searches from the states of Connecticut and New York to searches
from California. Indeed, when we focus on regions where investors are more likely to be
located, the advertisement effect is more statistically significant and larger in magnitude.
In column (6), we report the results of the specifications where we exclude the dates
when advertising firms announced their earnings, i.e., those days that might see an increased
activity of SEC EDGAR searches. We rely on Compustat and IBES on earnings announce-
ment dates. Where these two sources disagree we take a conservative approach and exclude
both sets of dates. We find that advertising effect is not concentrated on the days when
firms announce their earnings.13
In Panel B, we report the tests with respect to the timing of the effect. First, we look
at how ad effect carries over into the future time intervals. That is, in addition to looking
at the ad effects in the same 15 minute interval, we study whether the effect persists in
the subsequent intervals. We do find a statistically significant one-period lagged effect of
an ad, as reported in column (1), but the size of the estimate is much smaller than that
of a contemporaneous effect. The effect of two-period lag is not statistically significant,
13
In additional tests, we also exclude three days before earnings announcements and three days after and
we continue to find a similar and significant effect.
17suggesting that the ad lift dies off over approximately 30 minutes.14
Further, we perform another type of falsification test, where we insert a placebo ad one
15 minute interval before the actual ad. This exercise is equivalent to checking whether a
future event (advertisement) affects current outcomes (searches). When doing so, we make
sure that there are no commercials by the same firm at least 30 minutes before this interval,
i.e., by choosing a placement of a placebo ad, we do not want to capture any spillover effects
from the previous commercials. The results are reported in column (2) and, as expected,
show that there is no effect for placebo ads.
Our next specification tests whether our results are robust to how we define the start
of our intervals. Instead of starting them at 5 minutes past the hour as in our main set of
analysis, here we start them exactly at the hour (X:00-X:14; X:15-X:29; X:30-X:44; X:45-
X:59, where X is a particular hour). As shown in column (3), as expected, based on the
ad distribution patterns provided in the Internet Appendix Figure IA1, we get consistent,
albeit marginally weaker, results.
Finally, we redefine the intervals to be constructed at 10 minute and 20 minute intervals
instead of 15 minutes that we consider in our baseline specifications. As shown in columns
(4) and (5), we find that results are slightly stronger for 10 minute interval and weaker for
20 minute interval.
In all our specifications we cluster standard errors by advertising firm. In the results,
available at request, we find that the statistical significance of the effect is virtually identical
if we double-cluster standard errors by firm and time or firm and timezone x time.
4.4 Heterogeneity
We further perform a number of descriptive heterogeneity tests. We first analyze the effects
of advertising on the type of the information that users seek on SEC EDGAR, i.e., we look
14
One other paper that studies real time TV exposure effects is Busse and Green (2002) who analyze
CNBC news show coverage on the stock market and finds that the market responds within 15 minutes to
the stock coverage, with the highest effect manifesting itself within the first 5 minutes.
18at the content of the filings that are being accessed. We group them into four categories:
(a) filings on the firm’s financial position and its annual reports (forms 10-K and 10-Q); (b)
filings on material events (form 8-K); (c) filings on firm’s ownership (forms 3 and 4); (d) all
other filings. We perform the analysis separately where our outcome variable is defined to
be queries for each of these four filing categories. As reported in Table 4, Panel A, while the
effect is statistically significant across all form types, it is the strongest for the queries related
to the firm’s financial position and the annual reports (column (1)), as opposed to the filings
on material events (column (2)), ownership (column (3)), and other filings (column (4)).
Our second set of tests studies the heterogeneous effects across different contexts. We
look at the ad effects on the days when advertising firms had major announcements. In par-
ticular, we study M&A announcement effects for both target and acquirer as well as earnings
announcement days. We draw M&A announcement days from SDC Platinum database and
earnings announcement days from Compustat and IBES. In Panel B, we report our specifi-
cations where we interact ad exposure variables with the dummies if on that particular day
it was announced that the firm will engage in an M&A transaction as either an acquirer, or
a target, or it announced its earnings. For the sake of brevity, we only report the results for
the primetime ads.
We find that the advertising effect is stronger on the earnings announcement days (column
(1)) but does not vary by the earnings surprise, estimated based on the analyst earnings
forecasts (column (2)). The effect is also stronger for the advertising target in the M&A
transaction (column (3)) but not for the acquirer (column (4)). Overall, given that the ad
effects are magnified during the significant corporate events with wider media coverage, our
results suggest that advertising might act as a reminder for investors.
Third, we look at the heterogeneity of the effect at the ad creative level. Specifically,
we investigate three ad characteristics where we uncontroversially expect a stronger effect.
In particular, we analyze how the effect varies with an advertised brand name similarity to
their parent company’s name (e.g., Wendy’s (brand) and The Wendy’s Co (parent com-
19pany) versus Taco Bell (brand) and Yum! Brands Inc (parent company)), the ad position
within an ad break, and the ad creative length. The results are reported in the Internet
Appendix Table IA1. We find that advertisements for brands that sound similar to their
parent company name lead to significantly more searches. We also find that the first ad in
an ad break leads to significantly more searches. This is consistent with the first ad receiving
the most audience attention due to attention depreciation throughout an ad break (see e.g.,
McGranaghan et al. (2018)). Finally, we also find a strong positive relationship between the
number of searches and an ad length.
Our fourth set of tests looks at how the effect varies across different industries. We report
them in the Internet Appendix Table IA2.15 As before, we estimate four separate regressions:
general effect (column (1)), more expensive ads (column (2)), primetime (column (3)), and
the log value of the total estimated ad cost (column (4)).
We find that the effect is stronger among consumer staples, financial sector, and pharma-
ceutical firms, as compared to the other sectors. The effect is the strongest for the financial
sector and during the primetime hours. One way to speculate about the reason for these
variations in the effect size is that ads for products in different sectors carry different infor-
mativeness. For instance, Nelson (1974) has argued that ads for search goods contain more
product-oriented information than do experience goods advertisements. We further discuss
informative and non-informative aspects of ads in Section 5.4.
Finally, we perform heterogeneity tests where we estimate the effect separately for each
firm. Internet Appendix 2 discusses the procedure, while Internet Appendix Tables IA3-IA4
and Figures IA3-IA4 report the results. We find that out of 301 firms in our sample, 124
firms have a statistically significant positive response to the TV advertising at a 5% level.
15
We provide the distribution of firms in different sectors in Table 1, Panel B. Given limited number
of observations in Telecommunications sector, we group it together with Information Technology sector.
Moreover, we group Real Estate and Financial sectors together. Since the vast majority of the companies in
our sample falling under the larger Healthcare GICS sector belong to Pharmaceuticals, Biotechnology & Life
Sciences sub-sector (the other sub-sector being Health Care Equipment & Services), we refer to this sector
as Pharmaceuticals. Finally, we define materials, utilities, and energy as “Other”.
204.5 Google Searches
Our SEC EDGAR results provide evidence that investors respond to the TV commercials
when searching for the firm financial information. We further look at whether our effect
extends beyond SEC EDGAR queries and whether it is also present in the search for firm
financial information in Google.
The recent literature on investor attention has used Google searches for companies’ ticker
symbols as a proxy for investor interest in that company’s securities (e.g., Da et al. (2011)).
We expand upon this approach. In particular, in addition to Google search volume on tickers,
we also collect information on related keywords that lead to the same financial information
websites as the searches for tickers. Google AdWords Keyword Planner tool provides total
search volume estimates for every keyword, as well as suggests alternative search keywords
that lead to the same type of websites. For example, Google AdWords Keyword Planner
suggests that users who search for the keyword “MSFT”, ticker symbol for Microsoft, go to
similar websites as people who search for the keywords “Microsoft Stock” or “MSFT Stock”.
We manually gather all of these related keywords for every ticker symbol in our sample. We
only include related keywords that generate at least 10k searches per month to ensure that
we do not include obscure keywords that would add noise to search volume estimates.
Given the complexity and restrictions in downloading the Google Trends data and its
sheer volume, we only focus on one month of data16 and on the most populous states: Cali-
fornia, Connecticut, Florida, Illinois, New Jersey, New York, North Carolina, Oregon, Penn-
sylvania, Texas, Virginia, and Washington. Since search volume index (SVI) is normalized
within each Google Trends query, we include a control keyword in every query and ensure
that at least one minute of the query overlaps with the subsequent query. Furthermore,
16
For the highest frequency, i.e., minute-by-minute data, Google only allows downloads in four-hour blocks
for up to five search terms. To make this exercise manageable, we thus need to limit the time period for our
analysis. We download the data for one full month for the same stocks that we use in the analysis of SEC
EDGAR queries. We pick August, 2016, as 2016 Summer Olympics were taking place in this month and
Summer Olympics are known to attract wide TV viewership. The main Olympics coverage during primetime
was time-shifted. Our sample consists of 156 publicly traded firms. The sample is smaller than before since
not all of 301 firms we use over 2015-2017Q1 advertised in the time-shifted programs in August, 2016.
21given that Google SVI data is reported at the state level and the index is normalized at this
level and thus cannot be compared across states, we do not aggregate the searches across the
time zones but we add state fixed effects to directly control for state level normalization in
Google Trends SVI algorithm. Our specification follows the one for SEC EDGAR searches
and is thus estimated in a panel, constructed at a firm × 15 minute interval × state level :
Ln(GoogleSearches)its = β × Aditk + γit + κik + θtk + ψs + its (3)
where i indexes the firms, t indexes time at a 15 minute interval, k indexes the time zones
(EST or PST), and s indexes the states. Ln(GoogleSearches)its refers to the log SVI for
firm’s i ticker and other related Google keywords in a t 15 minute time interval from the
state s in the time zone k. Aditk refers to a dummy whether at least one broadcast channel
aired a commercial of the firm i during t 15 minute time interval in the time zone k.17
The results are reported in Table 5. We find a statistically significant increase in the
searches for ticker and other related keywords after the ad is broadcast in a treated time
zone, as compared to searches in the contemporaneously non-exposed time zone. As before,
we report the general effect of the ad in column (1), focus on ads with an estimated cost
greater than $50k in column (2), primetime in column (3), and the log value of the total
estimated cost of TV ad in column (4). The estimates point in the same direction and follow
similar patters with SEC EDGAR search results: TV ads increase firm financial information
search on Google and more expensive ads lead to more Google financial information searches.
Given a higher economic effect on Google searches, these results suggest that our esti-
mate on SEC EDGAR searches constitutes a lower bound of the TV ad effect on investor
information search.18
17
We also perform an alternative specification where we control for all fixed effects at the state level rather
than time zone level, i.e., we add firm × state and 15 minute interval × state fixed effects:
Ln(GoogleSearches)its = β × Aditk + γit + κis + θts + its
The estimates are identical to those from specification (2). We report them in Internet Appendix Table IA5.
18
Since our advertising data is at the product-level, as a comparison we also evaluate the effect of ad-
vertising on Google searches for advertised product names. That is, for example, upon airing of the Apple
225 Investors and Markets
In this Section, we further discuss the implications of our main results presented above.
We start with addressing the question of whether the response comes from sophisticated
or unsophisticated investors. We then study the effect of ad-induced search on the trading
volume and stock returns. Finally, we discuss a framework that allows us to evaluate whether
ad related attention shocks can be considered as informative or non-informative, and provide
the corresponding evidence.
5.1 Investor Sophistication
Since the IP addresses provided by SEC are partially anonymized, we cannot identify the
actual investors who are affected by the TV advertising nor their professional affiliations.
These could be professional investors who look for more information about the firm after
their work hours, or retail traders.
In an attempt to understand investor sophistication, we look at the unique IP addresses
that search for the advertised firm’s financial information on SEC EDGAR immediately after
the ad airing in their timezone. We see that over 2015-2017Q1 period 164, 000 distinct users
searched for advertising firms within 15 minutes after the ad airing; 129, 000 users searched
within 10 minutes; and 89, 000 users searched within 5 minutes, out of 8.3m total number of
distinct non-bot IP addresses present in our sample.19 Absent an ad, we would expect that
average per minute distribution of searches on any company should be approximately even.
The above pattern, on the other hand, suggests that the average per minute search for firm
financial information decays after an ad and that a disproportionate number of investors
react within a very narrow time window of an ad, which is consistent with ads inducing near
IPhone commercial, we can compare the Google searches for the firm’s ticker (“AAPL”) and other financial
keywords to searches for firm’s advertised product name (“IPhone”). Such product-level analysis suggests
that the treatment effect of an ad on the financial information search constitutes 30%-40% of the effect of
an ad on the product name search.
19
These numbers provide the upper bound of the treatment effect as we do not know which of these
particular IP addresses would have searched for the firm absent its ad.
23real-time reaction of investors.
We investigate investors’ sophistication further by comparing browsing patterns of the IP
addresses that ever searched for an advertiser after an ad with the browsing patterns of an
average SEC EDGAR user. Figure 3, Panel A, depicts the distribution of overall frequency
of queries during our sample period on SEC EDGAR that come from the IP addresses
that searched within 15 minutes after an ad airing relative to the overall sample. We see
that the IP addresses that search for firm’s information after an ad airing are much more
active on SEC EDGAR in general, suggesting their relative sophistication compared to other
participants on SEC EDGAR. In Panel B we also see that the users that search within the
first 5 minutes (relative to the users who search within the second or third 5 minute interval
after an ad) are even more active SEC EDGAR users, suggesting that the most sophisticated
users of SEC EDGAR react to the ads the fastest.
We also check the time of the day activity patterns for the IP addresses that react after
the ads as compared to the average activity patterns of all IP addresses. We find that IP
addresses that react after the ads have on average 68% of their activity in the evening (6pm-
12am), as compared to 48% in the case of all IP addresses. This asymmetry is particularly
pronounced for the browsing activity during the primetime hours, i.e., 36% versus 18%,
and it suggests that a lot of ad-induced searches are happening on the devices with the IP
addresses that are primarily used during the evenings.
Given this high number of distinct IP addresses and also that we find consistent results
when we look at both SEC EDGAR and Google searches, it is likely that at least some of
this rise in search activity is driven by the sophisticated retail investors.20
5.2 Trading Volume
Additional signals coming from advertising and then later from the information collection
through SEC EDGAR are likely to generate dispersion in the opinions among investors and
20
Retail trading volume results presented in Section 5.2 are also consistent with this assertion.
24You can also read