MAHARASHTRA GATEWAY TO INDIA - BANDRA-WORLI SEA LINK, MUMBAI, MAHARASHTRA - IBEF

Page created by Bruce Wise
 
CONTINUE READING
MAHARASHTRA GATEWAY TO INDIA - BANDRA-WORLI SEA LINK, MUMBAI, MAHARASHTRA - IBEF
BANDRA-WORLI SEA LINK, MUMBAI, MAHARASHTRA

 MAHARASHTRA
 GATEWAY TO INDIA

For updated information, please visit www.ibef.org                                      March 2018
MAHARASHTRA GATEWAY TO INDIA - BANDRA-WORLI SEA LINK, MUMBAI, MAHARASHTRA - IBEF
Table of Content

  Executive Summary .…………….….…….3

  Advantage Maharashtra ………………….5

  State Vision ………………………………..6

  Maharashtra – An Introduction …….…….7

  Annual Budget 2018-19 …………...……20

  Infrastructure Status ...............................21

  Business Opportunities …….………...…39

  Doing Business in Maharashtra ………..68

  State Acts & Policies …….………........…77
MAHARASHTRA GATEWAY TO INDIA - BANDRA-WORLI SEA LINK, MUMBAI, MAHARASHTRA - IBEF
EXECUTIVE SUMMARY … (1/2)

     Highest contribution to                      Maharashtra’s GSDP at current prices was US$ 336.4 billion in 2016-17 and accounted for 14.8 per cent of
     India’s GDP                                   India’s GDP, the highest among all states.

                                                  Total FDI in the state during April 2000 to December 2017 stood at US$ 113.82 billion1, the highest among all
     Highest FDI in India                          states in India.

                                                 Jawaharlal Nehru Port is the largest port in India in terms of container traffic. During 2017-18 (up to February
      Largest Container Port
                                                  2018), the port handled 59.876 million metric tonnes of traffic.

                                                 The state’s capital, Mumbai, is the commercial capital of India and has evolved into a global financial hub.
     India’s financial and
                                                  The city is home to several global banking and financial service firms. Pune, another major city in the state,
     educational hub                              has emerged as the educational hub.

    Source: Central Statistics Office, Socio Economic Survey of Maharashtra, 2017-18, Department of Industrial Policy & Promotion, Indian Port Association, 1Including Daman & Diu and
    Dadra & Nagar Haveli

3         MAHARASHTRA                                                                                                     For updated information, please visit www.ibef.org
MAHARASHTRA GATEWAY TO INDIA - BANDRA-WORLI SEA LINK, MUMBAI, MAHARASHTRA - IBEF
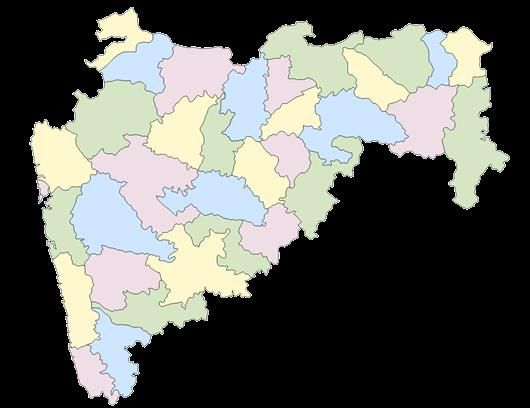
EXECUTIVE SUMMARY … (2/2)

     Significant production of                    Maharashtra is one of the largest producers of sugarcane and pomegranate in the country. Sugar production
     sugarcane and                                 is expected to reach 7.34 million tonnes in 2017-18. During 2016-17, the production of pomegranates was
     pomegranate                                   recorded to be 1.44* million tonnes.

                                                  Maharashtra is the most industrialised state in India and has maintained the leading position in the industrial
     Industrial powerhouse                         sector in the country. The state is a pioneer in small scale industries and boasts of the largest number of
                                                   special export promotion zones. The state has 19.3 per cent of overall manufacturing GSDP.

                                                 Maharashtra is among the leading producers of cotton in India. The state produced 8.9 million bales of cotton
      Strong cotton production
                                                  during 2016-17.

    Source: As per 1st advance Estimates
    Source: Ministry of Agriculture, News Articles, Economic Survey 2015-16

4         MAHARASHTRA                                                                                        For updated information, please visit www.ibef.org
MAHARASHTRA GATEWAY TO INDIA - BANDRA-WORLI SEA LINK, MUMBAI, MAHARASHTRA - IBEF
ADVANTAGE: MAHRASHTRA

        2016-17                     Trade and commerce hub of India                                            Policy incentives                              2016-17

                             The city of Mumbai is known as the trade and                    The Government of Maharashtra has several policies
                              commerce capital of India. It is also the financial centre       in place to set up the right kind of business climate.
      GSDP of the             of India.                                                       These policies aim to motivate investors to invest into       Per capita
       state was             Maharashtra has emerged as a key hub for IT and                  various sectors in the state, thereby contributing to the
                                                                                                                                                             GSDP was
       US$ 336.4              ITeS, electronics and captive business outsourcing               overall development of the economy.
                                                                                                                                                             US$ 2,802
         billion              industries.

                                                                                  Advantage
                                                                                  Maharashtra

                                        Rich pool of skilled labour                                       Facilitating infrastructure

                                                                                              The state has a well developed social, physical and
                             Maharashtra has a literacy rate of 82.3% and is home
                                                                                               industrial infrastructure. Apart from four international
                              to world class educational and IT institutions.
                                                                                               and seven domestic airports, the state has two major
                             The state has a large base of skilled and industrial             and 53 minor ports. It also has a well developed power
                              labour, making it an ideal destination for knowledge             supply grid.
                              based and manufacturing sectors.
                                                                                              Maharashtra's infrastructure sector has grown
                                                                                               significantly over the last decade, with a substantial rise
                                                                                               in the number of industrial clusters and Public Private
                                                                                               Partnership (PPP) projects.

    Source: Government of Maharashtra

5        MAHARASHTRA                                                                                             For updated information, please visit www.ibef.org
MAHARASHTRA GATEWAY TO INDIA - BANDRA-WORLI SEA LINK, MUMBAI, MAHARASHTRA - IBEF
STATE VISION

                                               Focus on growth of the manufacturing                   Establishing technical universities
                                                sector.                                                 for skill development.
                                               Creating conducive growth                              Providing scholarships to pursue
                                                environment.                                            professional courses.

                                                                       Industrial sector        Skill development
         Promoting sustainable development                                                                                                  US$ 50.6 billion allocated to
          in agriculture by integrating schemes                                                                                               accelerate economic growth by
          of water shed development, use of                                                                                                   implementing specially designed
          technology, enhancing processing                                                                                                    growth oriented policies.
          capacity and skill development.                Agriculture                  Vision                 GSDP growth

         Promotion of agri-business through
          PPP for Integrated Agricultural
          Development (PPP-IAD) and develop
          market linkages of horticulture.                               Tourism               Infrastructure

                                             Promote religious, adventure and
                                              heritage tourism.                                    6,026 km of national highway projects.
                                             Training workers in the organised                    Developing ports by investing
                                              and unorganised sectors related to                    approximately US$ 2.4 billion.
                                              tourism.

    Source: Confederation of Indian Industry

6         MAHARASHTRA                                                                                                  For updated information, please visit www.ibef.org
MAHARASHTRA FACT FILE

                                                                                         The most commonly spoken language in the state is Marathi.
                                                                                          Konkani, Hindi and English are the other prominent languages.

                                                                                        Parameters                                            Maharashtra

                                                                                        Capital                                                 Mumbai

                                                                                        Geographical area (lakh sq. km)                           3.08

                                                                                        Administrative districts (No)                              36
                                                                Source: Maps of India
                                                                                        Population density (persons per sq. km)                   365
      Maharashtra is situated in the western region of the country. The
       state shares borders with Gujarat, Madhya Pradesh, Chhattisgarh,                 Total population (million)                               118.1
       Andhra Pradesh, Karnataka, Goa and the Union Territory of Dadra
       and Nagar Haveli. On its west is the Arabian Sea.                                  Male population (million)                               61.2

      Mumbai, Pune, Nagpur, Thane, Nasik, Solapur, Kolhapur, Sangli,                                                                             56.9
                                                                                          Female population (million)
       Aurangabad, Amravati and Ratnagiri are some of the major cities of
       Maharashtra.                                                                     Sex ratio (females per 1,000 males)                       929
      India's main stock exchanges, capital market and commodity
       exchanges are located in Mumbai.                                                 Literacy rate (%)                                         82.3

    Source: National Portal of India, Economic Survey 2015-16

7        MAHARASHTRA                                                                                        For updated information, please visit www.ibef.org
MAHARASHTRA IN FIGURES … (1/2)

      Parameter                                                                Maharashtra       All states                             Source

      Economy                                                                      2015-16        2015-16

          GSDP as a percentage of all states’ GSDP                                  14.49          100.0                       Central Statistics Office

          GSDP growth rate (%)                                                        9.9           8.71                       Central Statistics Office

          Per capita GSDP (US$)                                                     2,545          1,546                       Central Statistics Office

      Physical Infrastructure

          Installed power capacity (MW)                                            42,356.85     334,146.91        Central Electricity Authority, as of February 2018

                                                                                                                     Telecom Regulatory Authority of India, as of
          Wireless subscribers (No)                                            130,136,065     1,1,151,936,422
                                                                                                                                  January 2018
                                                                                                                     Telecom Regulatory Authority of India, as of
          Internet subscribers (million)                                            58.34          445.95                       December 2017
                                                                                                                 NHAI, Roads and Building Department-Government
          National highway length (km)                                              15,436        115,435                            of India

          Major and minor ports (No)                                                2 + 53         13+187                    India Ports Association 2016

          Airports (No)                                                               11            125                       Airports Authority of India

    Note: Telecom Regulatory Authority Of India , Central Electricity Authority.

8         MAHARASHTRA                                                                                            For updated information, please visit www.ibef.org
MAHARASHTRA IN FIGURES … (2/2)

    Parameter                                                          Maharashtra              All states                                   Source

    Social Indicators

       Literacy rate (%)                                                    82.3                   73.0                                   Census, 2011

       Birth rate (per 1,000 population)                                    15.9                   20.4                         SRS Bulletin, September 2017

    Investment

                                                                                                                     Department of Industrial Policy & Promotion, April
       Cumulative FDI equity inflows (US$ billion)1                        113.82                 367.93
                                                                                                                                2000 to December 2017

    Industrial Infrastructure

                                                                                                                      DEA , Ministry of Finance, Government of India,
       Operational PPP projects (No)                                        1,144                 9,068
                                                                                                                                       February 2018
                                                                                                                     Ministry of Commerce & Industry, Department of
       Operational SEZs (No)                                                 28                    222
                                                                                                                               Commerce, December 2017

    Note: 1Combined FDI inflows for Maharashtra, Dadra & Nagar Haveli and Daman & Diu, PPP: Public-Private Partnership, SEZ: Special Economic Zone, SRS: Sample Registration
    System

9      MAHARASHTRA                                                                                                 For updated information, please visit www.ibef.org
ECONOMIC SNAPSHOT – GSDP

           GSDP of Maharashtra at current prices (in US$ billion)                                                         Per capita GSDP (US$)

         400.0                                                                                 2,900.0                                 CAGR 3.03%
                                          CAGR 4.26%
         350.0                                                                                 2,800.0

                                                                                                                                                                          2,802
                                                                            336.4
         300.0                                                                                 2,700.0

                                                                 303.5
                                                      295.4
         250.0                                                                                 2,600.0
                                           273.7
                     273.1

                                268.8

         200.0

                                                                                                                                                                2,558
                                                                                               2,500.0

                                                                                                                                                      2,520
         150.0                                                                                 2,400.0

                                                                                                             2,414

                                                                                                                                            2,362
         100.0                                                                                 2,300.0

                                                                                                                             2,347
          50.0                                                                                 2,200.0
            0.0                                                                                2,100.0
                                                                 2015-16
                     2011-12

                                2012-13

                                           2013-14

                                                      2014-15

                                                                            2016-17

                                                                                                             2011-12

                                                                                                                             2012-13

                                                                                                                                            2013-14

                                                                                                                                                      2014-15

                                                                                                                                                                2015-16

                                                                                                                                                                          2016-17
          At current prices, GSDP* of Maharashtra was US$ 336.4 billion                        The state’s per capita GSDP^ at current price was US$ 2,802
           in 2016-17.                                                                           in 2016-17.
          GSDP of the state grew at a CAGR of around 4.26% from                                The per capita GSDP of Maharashtra grew at a CAGR of
           2011-12 to 2016-17.                                                                   3.03% between 2011-12 and 2016-17.

     Note: GSDP - Gross State Domestic Product, CAGR – Compound Annual Growth Rate, GSDP* - Socio Economic Survey of Maharashtra, 2017-18, Per Capita GSDP^ - calculated
     using GSDP million US$/ Population in million
     Source: Central Statistics Office, “Advanced Estimates” provided by Directorate of Economics and Statistics of Maharashtra

10      MAHARASHTRA                                                                                                    For updated information, please visit www.ibef.org
ECONOMIC SNAPSHOT – NSDP

           NSDP of Maharashtra at current prices (in US$ billion)                                    NSDP per capita of Maharashtra at current prices (in US$)

                                                                                                                                           CAGR 3.04%
         350.00                                                                                       2,500
                                             CAGR 4.27%

                                                                                                                                                                            24.67
         300.00                                                                                       2,400

                                                                                 296.14
         250.00                                                                                       2,300

                                                                      267.53
                                                          257.93
                                               240.34
                       240.31

                                   236.09

                                                                                                                                                                  22.55
         200.00                                                                                       2,200

                                                                                                                                                        2,200
         150.00                                                                                       2,100

                                                                                                                   2,124

                                                                                                                                              2,074
                                                                                                                                 2,062
         100.00                                                                                       2,000

          50.00                                                                                       1,900
            0.00                                                                                      1,800
                       2011-12

                                   2012-13

                                               2013-14

                                                          2014-15

                                                                      2015-16

                                                                                 2016-17

                                                                                                                   2011-12

                                                                                                                                 2012-13

                                                                                                                                              2013-14

                                                                                                                                                        2014-15

                                                                                                                                                                  2015-16

                                                                                                                                                                            2016-17
          At current prices, NSDP# of Maharashtra was US$ 296.14                                      At current price, the state’s per capita NSDP was US$
           billion in 2016-17.                                                                          2,466.70 in 2016-17.
          Maharashtra’s NSDP# grew at a CAGR of around 4.27% from                                     The per capita NSDP of Maharashtra grew at a CAGR of
           2011-12 to 2016-17.                                                                          3.04% between 2011-12 and 2016-17.

     Note: NSDP - Net State Domestic Product, CAGR – Compound Annual Growth Rate, NSDP# - Geometric mean of YoY calculation from 2011-12 to 2016-17 , per capita NSDP& -
     calculated using NSDP million US$/Population in million , Socio Economic Survey of Maharashtra, 2017-18.
     Source: Central Statistics Office, Based on “Advanced Estimates” provided by Directorate of Economics and Statistics of Maharashtra

11      MAHARASHTRA                                                                                                          For updated information, please visit www.ibef.org
ECONOMIC SNAPSHOT – PERCENTAGE
                   DISTRIBUTION OF GSDP

      Over 2016-17, the tertiary sector contributed 56.04 per cent to the                                         Percentage distribution of GSDP
       state’s GSDP at current prices, followed by the secondary sector
       with a contribution of 28.63 per cent.
                                                                                                   100%                                    CAGR
      At a CAGR of 13.6 per cent, the tertiary sector has been the fastest                                              51.07%                            56.04%
       growing among the three sectors from 2011-12 to 2016-17. Growth                               90%
       was driven by trade, hotels, real estate, finance, insurance, transport,
                                                                                                     80%                                   13.6%
       communications and other services.

      The secondary sector grew at a CAGR of 9.8 per cent between                                   70%
       2011-12 and 2016-17. The growth in secondary sector was driven by
                                                                                                     60%
       growth in manufacturing, construction and electricity, gas & water
       supply industries.                                                                            50%
                                                                                                                         30.88%
      The primaryµ sector expanded at a CAGR of 7.9 per cent between                                40%                                                   28.63%
       2011-12 and 2016-17. Agriculture is the major contributor in the                                                                    9.8%
       growth of the primary sector followed by forestry and fishing.                                30%

      The World Bank in January 2017 announced that it will fund the state                          20%
       Government project named Climate Resistant Agriculture to reclaim                                                 18.05%
       500,000 hectares saline lands, spread in 1,000 villages. The World                            10%                                                   15.33%
                                                                                                                                            7.9%
       Bank will contribute US$ 416.48 million out of the US$594.97 million
                                                                                                      0%
       for the joint project.                                                                                           2011-12                            2016-17

                                                                                                             Primary Sector       Secondary Sector         Tertiary Sector

 Note: Sector-wise % share of GSDPµ -Geometric mean of YoY calculation from 2011-12 to 2016-17
 Source: Central Statistics Office, Based on “Advanced Estimates” provided by Directorate of Economics and Statistics of Maharashtra, Government of Maharashtra.

12      MAHARASHTRA                                                                                                   For updated information, please visit www.ibef.org
ECONOMIC SNAPSHOT – AGRICULTURAL
                   PRODUCTION … (1/2)
                                                                                                                                                                                                            Crop
      Sugarcane, cotton, onion, soya bean, banana, jowar (sorghum) &                                                                                                                            Annual Production (2017-18)          Kharif             Rabi
       rice are some of the key agricultural products of Maharashtra.                                                                                                                                (‘000 MT) (tentative)

      Total food grain production in the state stood at around 17.23 million                                                                                                                    Sugarcane                              67,863              -
       tonnes in 2016-17.                                                                                                                                                                        Soya bean                              3,886               -
      In July 2017, the state government extended the date to disburse an                                                                                                                       Groundnut                               260                -
       advance payment of US$ 155.21 to farmers as financial assistance
       to the needy farmers till August 31, 2017.                                                                                                                                                Sunflower                                7                 4
                                                                                                                                                                                                 Jowar                                   417              1,510
      As per the Agriculture Marketing and Farmer Friendly Reforms
       Index, the state secured the top position in pursuing farmer friendly                                                                                                                     Rice                                   2,661               -
       policies during 2016.
                                                                                                                                                                                                 Wheat                                    -               1,208

      Area (‘000 hectares) and production (‘000 MT) of horticulture                                                                                                                              Bajra                                   616                -
                         crops in Maharashtra                                                                                                                                                    Maize                                  2,977              473
       25000.0                                                                                                                                                                                   Cotton (Lint)                          6,049               -
                                                                                               24277.0
                                                                  24265.2

       20000.0                                                                                                                                                                                   Other Oilseeds                           1                 -
                                                                                                                                                         21668.7

                                                                                                                                                                                       20755.4
                                                                                                                            19719.8
                                     18378.3

       15000.0
                                                                                                                                                                                                 Other Cereals                            19                1
                                               2649.2

                                                                            2651.2
                  2380.2

                                                                                                         1673.9

       10000.0
                                                                                                                                      1726.9

                                                                                                                                                                   1522.3

                                                                                                                                                                                                 Other Pulses                             54                43
        5000.0
                                                                                                                                                                                                 Total Food grains                      8,163             5,117
            0.0
                                                                                                                                                                                                 Total Oilseeds                         4,163               24
                                                                                                                                               2016-17
                           2012-13

                                                        2013-14

                                                                                     2014-15

                                                                                                                  2015-16

                                                                                                                                                                            2017-18*

                                                                                                                                                                                                 Total Cereals                          6,784             3,193
                                                          Area                                      Production                                                                                   Total Pulses                           1,379             1,924

 Source: Socio Economic Survey of Maharashtra, 2017-18, Indian Horticulture Database

13      MAHARASHTRA                                                                                                                                                                                               For updated information, please visit www.ibef.org
ECONOMIC SNAPSHOT – AGRICULTURAL
                   PRODUCTION … (2/2)

      An amount of US$ 63.81 million has been allocated to the state for                               Sugarcane production in Maharashtra (million MT)
       2017-18, under the National Agricultural Development Scheme
       (RKVY).                                                                                     100.00
      The state government also proposed establishment of organic                                   80.00

                                                                                                                                                                       91.53
                                                                                                                                      86.73
                                                                                                                           81.90

                                                                                                                                                            75.38
       farming research & training centres across four universities related to                       60.00

                                                                                                                                                 69.65

                                                                                                                                                                                  69.23

                                                                                                                                                                                                        67.86
                                                                                                                64.16

                                                                                                                                                                                             54.24
       agriculture for the endorsement of organic farming in the state.                              40.00
                                                                                                     20.00
      During 2016-17, the state recorded production of                       5,851.30*
                                                                                                      0.00
       thousand MT of onion.

                                                                                                                2009-10

                                                                                                                           2010-11

                                                                                                                                      2011-12

                                                                                                                                                 2012-13

                                                                                                                                                            2013-14

                                                                                                                                                                       2014-15

                                                                                                                                                                                  2015-16

                                                                                                                                                                                             2016-17

                                                                                                                                                                                                        2017-18*
     Vegetable production in Maharashtra (‘000 MT)

      Vegetable           2013-14           2014-15          2015-16          2016-17#
                                                                                                             Sugar production in Maharashtra (million MT)
      Onion                5,864            5,361             6,529            5851
                                                                                                      12.0
      Potato                370               370              251              543
                                                                                                      10.0

                                                                                                                                                                       10.5
      Tomato               1,200            1,200              977              977
                                                                                                       8.0

                                                                                                                                                 8.0

                                                                                                                                                            7.7

                                                                                                                                                                                  7.7

                                                                                                                                                                                                        7.3
                                                                                                                           9.1

                                                                                                                                      9.0
                                                                                                       6.0

                                                                                                                7.0
     Production of pomegranates in Maharashtra (‘000 MT)
                                                                                                       4.0

                                                                                                                                                                                             5.0
                      2013-14                                         945
                                                                                                       2.0
                      2014-15                                         1,313
                                                                                                       0.0

                                                                                                                                                                      2014-
                                                                                                               2009-

                                                                                                                          2010-

                                                                                                                                     2011-

                                                                                                                                                2012-

                                                                                                                                                           2013-

                                                                                                                                                                                 2015-

                                                                                                                                                                                            2016-

                                                                                                                                                                                                       2017-
                      2015-16

                                                                                                                                                                                                        18F
                                                                      1,486

                                                                                                                                                                       15
                                                                                                                10

                                                                                                                           11

                                                                                                                                      12

                                                                                                                                                 13

                                                                                                                                                            14

                                                                                                                                                                                  16

                                                                                                                                                                                             17
                      2016-17*                                        1,437
 Note: # As per 1st advance estimates, F – Forecast, * 2nd advance estimates
 Source: Department of Agriculture & Co-operation, Ministry of Agriculture, Socio Economic Survey of Maharashtra, 2017-18

14      MAHARASHTRA                                                                                                       For updated information, please visit www.ibef.org
ECONOMIC SNAPSHOT – FDI INFLOWS &
                   INVESTMENTS

      According to the DIPP, cumulative FDI inflows1 in the state of                              FDI equity inflows1, 2008-09 to 2017-18 (US$ million)
       Maharashtra during April 2000 to December 2017 stood at US$
       113.82 billion.
                                                                                                 20,000
      In 2017, 354 investment intentions worth US$ 7.46 billion have been

                                                                                                                                                                                                     19,654
                                                                                                 15,000
       proposed in the state, making up 12.29% of all the proposals in India.
                                                                                                 10,000

                                                                                                            12,431

                                                                                                                                                                                                               11,541
                                                                                                                                 6,097                   6,361                  6,361

                                                                                                                                               9,553

                                                                                                                                                                                           9,511
                                                                                                                       8,249
                                                                                                  5,000                                                             3,420

                                                                                                      -

                                                                                                            2008-09

                                                                                                                       2009-10

                                                                                                                                  2010-11

                                                                                                                                               2011-12

                                                                                                                                                          2012-13

                                                                                                                                                                     2013-14

                                                                                                                                                                                 2014-15

                                                                                                                                                                                           2015-16

                                                                                                                                                                                                     2016-17

                                                                                                                                                                                                               2017-18
     Approved and commissioned industrial projects for major
     Industries (August, 1991 to December, 2017)

                  Industry                                      Approved proposals                                                               Commissioned projects

                                                        No.                    Investment (US$ billion)                                     No.                                Investments (US$ billion)

        Metallurgical                                 1,938                              15.77                                              956                                                  5.80

        Chemicals & fertilizers                       2,917                              10.58                                              1,426                                                3.93

        Textile                                       2,073                               8.67                                              974                                                  2.94

        Electrical & electronics                      1,236                               4.55                                              708                                                  1.43

        Sugar                                         1,584                               6.28                                              258                                                  1.38

        Processed food                                1,123                               4.01                                              479                                                  1.19

 Note: 1Includes Maharashtra, Dadra & Nagar Haveli and Daman & Diu
 Source: Department of Industrial Policy & Promotion, Economic, Maharashtra Socio Economic Survey 2017-18

15      MAHARASHTRA                                                                                                   For updated information, please visit www.ibef.org
ECONOMIC SNAPSHOT – MAHARASHTRA’S EXPORT
                  TRENDS…(1/2)

      In FY18(1), Maharashtra’s exports totalled to around US$ 27.9 billion.
                                                                                                           Exports trends (US$ billion)
      Major products exported from the state are gems & jewellery,
       petrochemicals, readymade garments, cotton yarn, metal & metal
                                                                                90.0
       products, agro-based products, engineering items, drugs &
       pharmaceuticals and plastic & plastic items.

                                                                                                                        84.0
                                                                                80.0
      Maharashtra is the largest producer of sugar in India. In May 2015,
       the Government of Maharashtra, approved a subsidy of US$ 16.7

                                                                                                                                                      73.9
                                                                                70.0

                                                                                                                                            72.1
       per ton (up to the extent of 800,000 tonnes) for the exports of raw

                                                                                                              67.6

                                                                                                                                                                          69.8
                                                                                                                                                                66.7
                                                                                                                                  66.6
       sugar.                                                                   60.0
      In November 2015, Maharashtra sugar mills entered into a deal with
       neighbouring markets such as Sri Lanka and Bangladesh, etc., for         50.0

                                                                                       49.15

                                                                                                 48.1
       exporting 2 lakh MT of white sugar.
                                                                                40.0
      Coca Cola, a major soft drink producing giant will be procuring
       oranges from Vidarbha, Nagpur for producing juices, that would be
                                                                                30.0
       sold worldwide. The production would take place at its Butibori plant

                                                                                                                                                                                    27.9
                                                                                20.0

                                                                                10.0

                                                                                 0.0
                                                                                       2008-09

                                                                                                 2009-10

                                                                                                              2010-11

                                                                                                                        2011-12

                                                                                                                                  2012-13

                                                                                                                                            2013-14

                                                                                                                                                      2014-15

                                                                                                                                                                2015-16

                                                                                                                                                                          2016-17

                                                                                                                                                                                    2017-18(1)
 Note: (1) up to November 2017
 Source: Socio Economic Survey of Maharashtra, 2017-18

16      MAHARASHTRA                                                                                        For updated information, please visit www.ibef.org
ECONOMIC SNAPSHOT – MAHARASHTRA’S EXPORT
                         TRENDS…(2/2)

                   Maize exports from Maharashtra (‘000 MT)                                                               Pulses exports from Maharashtra (‘000 MT)

      900
                                                                                                              300
      800
      700                                                                                                     250                                     284
                            768
      600     655                               664
                                                                                                              200
      500
                                                          526
      400                                                                                                     150                      176
                                                                                                                                                                150        157
      300                                                                                                                 142
                                                                                          322                 100
      200
      100                                                                                                      50                                                                    78
                                                                                103
        0
                                                                                                                0
               2011-12

                            2012-13

                                                2013-14

                                                           2014-15

                                                                                2015-16

                                                                                          2016-17

                                                                                                                                        2012-13
                                                                                                                           2011-12

                                                                                                                                                      2013-14

                                                                                                                                                                 2014-15

                                                                                                                                                                           2015-16

                                                                                                                                                                                     2016-17
                                                          Dairy product’s exports from Maharashtra (thousand MT)

                     50.0                                                                     39.5
                     40.0
                     30.0                                            21.8
                     20.0                                                                                     11.2                                              7.1
                                      4.7                                                                                                 6.0
                     10.0
                      0.0
                                      2011-12

                                                                      2012-13

                                                                                                    2013-14

                                                                                                                2014-15

                                                                                                                                            2015-16

                                                                                                                                                                2016-17
     Source: APEDA,

17      MAHARASHTRA                                                                                                                  For updated information, please visit www.ibef.org
STATE BUDGET 2018-19

     Department                                                    Expenditure (US$ billion)

     School Education                                                        7.96

     Urban Development                                                       4.99

     Rural Development and Water Conservation                                2.57

     Home                                                                    2.11

     Water Resources                                                         1.90

     Industries, Energy and Labour                                           1.83

     Tribal Development                                                      1.73

     Public Health                                                           1.88

     Others                                                                  1.83

 Note: Exchange rate = Converted using 1USD= Rs 64.74
 Source: PRS Maharashtra Budget 2018-19.

18      MAHARASHTRA                                     For updated information, please visit www.ibef.org
PHYSICAL INFRASTRUCTURE – ROADS … (1/2)

                                                                                 Sanctioned length under Central Road Fund in Maharashtra
      The state is well connected to its six neighbouring states and other
                                                                                                          (kms)
       parts of India through 18 national highways. The 94.5 km long
       Mumbai-Pune expressway is India's 1st 6-lane, concrete, high
                                                                                  10000
       speed, tolled expressway, which connects the state capital &
       financial hub, Mumbai, with the neighbouring industrial hub, Pune.
                                                                                   1000
      In December 2015, the state government approved an elevated road

                                                                                                                             977.87

                                                                                                                                                      1234
       project on Ghodbunder Road from Gaimukh for a proposed

                                                                                                     257
                                                                                    100
       investment of US$ 132.7 million. As of December 2017, construction
       of the road is being fast-tracked with the Thane civic body working           10
       overtime to get the basics in place.
      The state government plans to construct a new proposed 8-lane                  1

                                                                                                     2014-15

                                                                                                                             2015-16

                                                                                                                                                     2016-17
       highway, between Mumbai & Nagpur, in which concept of land
       pooling will come into play. The project is worth US$ 6.84 billion and
       would be requiring 10,000 hectares of land.
      In June 2017, the state government approved numerous projects for
       boosting the development in cities like Mumbai, Thane and Pune.
       Projects approved include Versova-Bandra Sea Link worth US$
       1.12 billion, Thane creek bridge-3 worth US$ 115.36 million,
                                                                                                                                       Road length (km)
                                                                                Road type
                                                                                                                                        (as of 2016-17)
       widening of the Mumbai-Pune Expressway to 8 lanes from the
       existing 6 lanes between Lonavala & Khalapur worth US$ 713.61            National highways                                           12,275
       million and many more.
      Moreover, The Maharashtra State Road Development Corporation             State highways                                              34,450
       (MSRDC), plans to construct a 1.8 km six-lane third bridge at Vashi
                                                                                Major district roads                                        52,637
       with a budget of Rs 777 crore (US$ 120 million).
                                                                                Other district roads                                        58,116

                                                                                Village roads                                               145,881

                                                                                          Source: Socio Economic Survey of Maharashtra, 2017-18, NHAI, News Articles

19      MAHARASHTRA                                                                                  For updated information, please visit www.ibef.org
PHYSICAL INFRASTRUCTURE – ROADS … (2/2)

      Pradhan Mantri Gram Sadak Yojana (PMGSY) was launched in                   Expenditure on road works under Pradhan Mantri Gram Sadak
       2000 with the objective of connecting eligible rural habitants. For the                Yojana in Maharashtra (US$ million)
       year 2017-18, PMGSY has set target to connect 8,808 habitations by

                                                                                                   63.6
       constructing a road length of 27,207 km. A length of 25,665 km has            70.0
       been constructed by connecting 8,584 habitations by November,                 60.0
       2017.
                                                                                     50.0
      In November 2015, the 785-meter long Vanjarpatti flyover in
                                                                                     40.0
       Bhiwandi was inaugurated and constructed over a part of extended
       Mumbai Urban Infrastructure Project (MUIP)                                    30.0

                                                                                                                                      10.5
      As per budget 2017-18, the state government proposed an outlay of             20.0

                                                                                                                                                         5.7
                                                                                                                        3.9
       US$ 15.38 million for acquisition of land, special subsidy package,           10.0
       etc. under the MIHAN project.
                                                                                      0.0
      In October 2017, the state government approved construction of

                                                                                                                                      2016-17
                                                                                                   2014-15

                                                                                                                        2015-16

                                                                                                                                                      2017-
                                                                                                                                                       18*
       10,000 km under a revamped Hybird Annuity Model. Under the
       tweaked model the state government will release 60 per cent of the
       funds in the first two years instead of the earlier 40 per cent, and the
       payment tenure for the rest amount will be 15 years instead of 10
       years.
                                                                                  Pradhan Mantri Gram Sadak Yojana (PMGSY) (up to January
                                                                                  2018)

                                                                                            Habitations connected                                 1282

                                                                                            Length completed (km)                               25,672.87

     Note: * - As of October 2017.
     Source: Socio Economic Survey of Maharashtra, 2017-18

20       MAHARASHTRA                                                                                         For updated information, please visit www.ibef.org
PHYSICAL INFRASTRUCTURE – RAILWAYS

      The rail transport system of Maharashtra is very well developed. The      The government in February 2017, has sanctioned construction of 7
       state is well-connected to other parts of the country with a railway       new railway lines & several other projects, including Chhatrapati
       network spanning 6,103 km (including 378 km of Konkan Railway).            Shivaji Terminus-Panvel fast elevated corridor, worth US$4.64
      Central Railways has introduced special superfast weekly trains to         billion.
       Shirdi from Lokmanya Tilak Terminus and Dadar stations.                  Metro/mono rail projects
      During 2015-16, the state government initiated work on the stage of                                        Project         Current status
       Phase-I     CBD       Belapur-Pendhar-Taloja      MIDC-Kalamboli-        Mumbai Metro Rail Project        cost (US$       /implementation
       Khandeshwar-Navi Mumbai International Airport corridor, which is                                           million)            period
       expected to be accomplished by 2017. Work on the 11.1 km long
                                                                                 Phase IIA : Dahisar-D.N.                             32 per cent
       Belapur-Pendhar road is under progress.                                                                      979.22
                                                                                 Nagar (18.6 km)                                      completed
      As per budget 2017-18, the state government allocated US$ 109.2
                                                                                 Phase III: Colaba-Bandra-                           Civil works in
       million for boosting the execution of Nagpur to Pune metro rail                                             3,534.37
                                                                                 SEEPZ (33.5 km)                                       progress
       project and for the further development of Mumbai Metro line.
                                                                                 Phase IV: Wadala-Ghatkopar-                       Tender process in
      A total of US$ 1.61 billion was raised for the Mumbai Urban               Thane-Kasarwadavli (32 km)
                                                                                                                   2,917.81
                                                                                                                                       progress
       Transport Project III (MUTP III) which includes development of an
       elevated link between Airoli and Kalwa, helping passengers to avoid       Phase VII: Andheri (E)-                         40 per cent civil works
                                                                                                                    948.37
       interchanging at Thane.                                                   Dahisar (E) (16.5 km)                                completed

      The government has passed resolution to form Maharashtra Railway         Nagpur & Pune Metro Rail
                                                                                Project
       Infrastructure Development Company Ltd (MRIDC), being a joint
       partnership between state government & Railway Ministry.                  Nagpur metro : North-South                          Construction
                                                                                                                    1,341
                                                                                 corridor, East-West corridor                         underway
      Under Union Budget 2018, Central Ministry allocated Rs 11,000
       crore (US$ 1.7 billion) to enhance Mumbai city’s train system and         Pune metro: Chichwad to                             Construction
                                                                                                                    1,764
       construct more 90 km of double line rail in Mumbai suburban.              Swargate, Vanaz to Ramwadi                           underway

      CIDCO is constructing the first phase of elevated Metro Rail from        Mumbai Mono Rail Project
       CBD Belapur-Pendhar, total length of 11.10 km, with overall               Wadala to Chembur & Sant                         Phase I: complete,
       estimated cost of Rs 3,063.63 crore (US $ 473 million).                   Gadge Maharaj Chowk                                Phase II: To
                                                                                                                    375.80
                                                                                 (Jacob circle) to Wadala (20                    commence in January
 Source: Socio Economic Survey of Maharashtra, 2017-18, State Budget 2016-17,
 MMRDA: Mumbai Metropolitan Region Development Authority, News Articles.         km)                                                    2018

21      MAHARASHTRA                                                                               For updated information, please visit www.ibef.org
PHYSICAL INFRASTRUCTURE – AIRPORTS … (1/2)

      There are seven domestic and four international airports functioning
       in Maharashtra. Domestic flights operate from Mumbai, Pune,
       Nagpur, Aurangabad, Kolhapur, Juhu and Nanded, whereas
       international flights operate from Mumbai, Nagpur, Pune and
       Aurangabad. Mumbai airport is one of the busiest airports in India.
      During 2015-16, the state government proposed to establish an
       additional airport through PPP, in around four phases at Navi
       Mumbai with a view to minimize overcrowding at Mumbai
       International Airport. The first phase of the project is expected to be
       executed by 2019.
      As per budget 2017-18, the state government proposed an amount of
       US$ 7.6 million for the enhancement of airports (Solapur, Shirdi,
       Chandrapur, Karhad, Akola, Amaravati, etc) under the Airport
       Development Authority of Maharashtra.
      In May 2017, the Mumbai airport received environmental clearance
       for US$ 520.6 million expansion plan, which will allow it to ferry 50
       million passengers by 2020.

                                                                                        International airport

                                                                                        Domestic airport

                                                                                                      Source: AAI (Airports Authority of India)

22      MAHARASHTRA                                                              For updated information, please visit www.ibef.org
PHYSICAL INFRASTRUCTURE – AIRPORTS … (2/2)

     Domestic
                                     Passengers (‘000 thousand)          Aircraft movement (‘000)                   Freight (‘000 MT)
     airport

                                  2014-15       2015-16     2016-17   2014-15     2015-16     2016-17      2014-15      2015-16     2016-17

     Mumbai                        252.1         300.5       327.1     195.4       220.2        224         207.7        209.0          234.9

     Pune                           40.7         51.8        65.1      32.6         38.7        44.6        27.4          31.8           34.6

     Nagpur                         13.6         15.2        17.8      13.5         12.6        14.6         5.6           6.0           6.7

     Aurangabad                      4.2          2.9         3.2       4.1         3.7          3.8         1.3           1.4           1.43

     International
                                     Passengers (l’000 thousand)         Aircraft movement (‘000)                   Freight (‘000 MT)
     airport

                                  2014-15       2015-16     2016-17   2014-15     2015-16     2016-17      2014-15      2015-16     2016-17

     Mumbai                        114.30       116.24       124.4     74.09       76.38       80.56       486.54        496.24         547.37

     Pune                           1.01         2.40        2.56      1.12         2.04        2.12          -           0.01            -

     Nagpur                         0.44         0.74        1.09      0.54         0.84         1.4        0.44          0.43           0.41

 Source: AAI (Airports Authority of India)

23     MAHARASHTRA                                                                          For updated information, please visit www.ibef.org
PHYSICAL INFRASTRUCTURE – PORTS

      Along a coast line of 720 km, there are two principal ports: Mumbai Port          Minor ports in Maharashtra
       Trust (MbPT) and Jawaharlal Nehru Port Trust (JNPT). In addition, there
                                                                                            Manori                  Harnai              Dahanu
       are 53 minor ports. During April-November 2017, total traffic handled at
       the two major ports in Maharashtra was recorded at 85.59 million tonnes,             Kalyan                  Dabhol              Tarapur
       of which JNPT accounted for 43.26 million tonnes while, Mumbai port
                                                                                            Thane                   Palshet             Nawapur
       handled around 42.33 million tonnes of port traffic.
      The non-major ports of Maharashtra collectively handled passenger traffic            Versova                 Borya               Satpati
       of around 8.2 million passengers and cargo of 15.5 million tonnes, during                                     Jaigad              Kelwa-Mahim
                                                                                            Bandra
       2016-17 (up to September 2017).
                                                                                            Trombay                 Tiwri-Varoda        Arnala
      Steps have been taken by the Government of Maharashtra for
       development of Rewas port, Vijaydurg port, Redi port, Vadhavan port,                 Ulwa-Belapur            Purnagad            Datiware
       Trombay port and Karanja port through private sector participation. 13
                                                                                            Panvel                  Jaitapur            Uttan
       port projects have been sanctioned under Sagarmala for Maharashtra.
                                                                                            Mora                    Vijaydurg           Bassein
     Operational ports statistics                                                           Mandwa                  Deogad              Bhiwandi

       For major                                                                            Karaja                  Achara              Alibag
                           2013-14        2014-15         2015-16           2016-17
       ports
                                                                                            Thal                    Malvan              Revdanda
       Traffic                                                                                                       Niwti               Borli / Mandla
                                                                                            Rewas
       handled             121.517          125.46         125.137            125.2
       (million MT)                                                                         Bankot                  Vengurla            Nandgaon

      For minor                                                                             Kelshi                  Redi                Murud-Janjira
                           2014-15        2015-16         2016-17           2017-18*
      ports                                                                                                          Kiranpani           Rajpuri
                                                                                            Sriwardhan

                                                                                            Dharamtar               Ratnagiri           Mandad
      Traffic handled
                              27.3           28.9            34.8                 22.8
       (million MT)                                                                         Kumbharu                Dighi

 Note: * : up to November 2017.
 Source: India Ports Association, Socio Economic Survey of Maharashtra, 2017-18

24      MAHARASHTRA                                                                                         For updated information, please visit www.ibef.org
PHYSICAL INFRASTRUCTURE – POWER

       As of February 2018, the state had a total installed power generation                           Installed power capacity (MW)
        capacity of 42,356.85 MW.

       Thermal power contributed 30,358.16 MW to the total installed power
                                                                                   45,000
        generation capacity, followed by renewable power, hydropower and
        nuclear power with contributions of 7,976.85 MW, 3,331.84 MW and

                                                                                                                                                                      42,357
                                                                                   40,000

                                                                                                                                                            41,410
        690 MW, respectively.

                                                                                                                                                  40,589
                                                                                                                                        38,551
       The private sector was the biggest contributor to the total installed      35,000
        thermal power generation capacity in Maharashtra with a capacity of

                                                                                                                              34,005
        13,024.00 MW, followed by 10,842.00 MW under state utilities and
                                                                                   30,000

                                                                                                                    30,354
        6,492.16 MW under central utilities.

       The state government also proposed a new scheme for improving              25,000

                                                                                                          26,142
        electricity distribution system in the state. As per the budget 2016-17,

                                                                                            22,645.00
        an investment of US$ 45.98 million has been projected by the               20,000
        government for this new scheme.

       In May 2017, the state government unveiled a new energy                    15,000
        conservation policy with the aim to save 1,000 MW of electricity and
        US$ 933 million. The emphasis of the policy is on use of renewable         10,000
        energy and switching to energy efficient methods. Also, it is expected
        to generate employment for 8,500 people.                                    5,000

                                                                                       0

                                                                                                                                                            2016-17
                                                                                            2010-11

                                                                                                          2011-12

                                                                                                                    2012-13

                                                                                                                              2013-14

                                                                                                                                                  2015-16

                                                                                                                                                                      2017-18*
                                                                                                                                        2014-15
     Note: *As of February 2018
     Source: Central Electricity Authority

25        MAHARASHTRA                                                                                   For updated information, please visit www.ibef.org
PHYSICAL INFRASTRUCTURE – TELECOM

      According to Telecom Regulatory Authority of India (TRAI),                   Telecom Infrastructure (As of January 2018)
       Maharashtra had 130.14 million wireless subscribers and 4.77
                                                                                                            1
       million wireline subscribers, as of January 2018.                            Wireless subscribers                                           130,136,065
      By the end of January 2018, 43,516,077 subscribers had submitted             Wireline subscribers
                                                                                                           1
                                                                                                                                                     4,766,039
       requests for mobile number portability in Maharashtra. Moreover, the
       tele-density in Maharashtra stood at 108.03 per cent as of January           Internet subscribers* (million)                                    58.34
       2018.
                                                                                    Post offices                                                      12,8592

                                                                                    Tele density (in %)                                                108.03

                                                                                     Source: Telecom Regulatory Authority of India, February 2015, India Post, Ministry of
                                                                                    Communications and Information Technology, *As of September 2017, 1 Figure includes
                                                                                                                                                                     Goa
     Performance status of NOFN project (as of April 2016)

     No. of GPs in Phase-I                                      12,055              Major telecom operators in Maharashtra

                                                                                       Bharat Sanchar Nigam Limited             Vodafone Essar
     Pipe laid (km)                                             14,214                  (BSNL)
                                                                                                                                 Reliance Communications
                                                                        (1)            Mahanagar Telephone Nigam
     Cable laid (km)                                           29,042                                                            Tata Teleservices
                                                                                        Limited (MTNL)
                                                                        (1)
                                                                                       Bharti Airtel                            Aircel Limited
     GPs for which cable laid                                  12,983

                                                                                       Idea Cellular
     No. of GPs Lit                                               150

                                                                                                                           Source: Telecom Regulatory Authority of India
                                                    (1) Note: As of December 2017

26      MAHARASHTRA                                                                                       For updated information, please visit www.ibef.org
DEVELOPMENT PROJECTS: URBAN & SOCIAL
                    INFRASTRUCTURE … (1/2)

      Under JNNURM, 2 schemes, namely, Basic Services to Urban Poor (BSUP) & Integrated Housing & Slum Development Programme (IHSDP)
       have been implemented by Maharashtra Housing & Area Development Authority.

      During 2017-18, the state government allocated US$ 169.2 million for “Maharashtra Suvarn Jayanti Nagrothan Mahaabhiyan”, which is being
       implemented in the state for creating basic urban amenities across various municipal councils & townships.

      In November 2015, Mahindra Life Space Developers Ltd bought a land in Maharashtra with the objective of developing a housing project aiding
       urbanisation in the state. In addition, the Maharashtra government is considering to aid the affordable housing concept with opening up of land
       parcels & plots that would lie under no development zones. For this, the government is planning to constitute Housing for all by 2022 policy for the
       urban population.

      As per Budget 2017-18, the state government has proposed an outlay of US$ 109.2 million in order to boost the development of metro rail projects
       in Nagpur, Pune and Mumbai. In Budget 2016-17, for Maharashtra Fire Safety Mission in the state, an amount of US$ 4.58 million has been
       proposed by the state government.

      Under the Accelerated Irrigation Benefit Program (AIBP), the Centre released the 2nd & the biggest instalment of US$ 111.01 million to the
       Maharashtra government, to speed up construction of 26 dams. The state is set to receive a total of US$ 51.94 million as a part of the AIBP, until
       2020.

      In March 2017, under the Prime Minister’s Irrigation Scheme, the government has allocated US$ 1.22 billion for the farmers, to start numerous
       irrigation projects while representing the Budget 2017. Out of the total amount, a partial amount of US$ 418.27 million has been allocated for water
       resources.

      Mother Dairy plans to revamp an old plant in Nagpur & set up a new plant in Bhiwandi with an investment of around US$ 22.31 million, in
       Maharashtra.

      In April 2017, the state government has decided to support small and marginal farmers by investing US$ 3.78 billion in agriculture and irrigation
       schemes. All projects undertaken in the allocated budget would be completed in 2017-18, and the irrigation potential generated would be for1.4
       million hectares of land.

     Source: Department of Environment, Government of Maharashtra, JNNURM, Ministry of Urban Development

27      MAHARASHTRA                                                                                        For updated information, please visit www.ibef.org
DEVELOPMENT PROJECTS: URBAN & SOCIAL
                    INFRASTRUCTURE … (2/2)

     Urban Infrastructure Projects under JNNURM

       Project name                                         Amount (US$ million)                           Project name                 Amount (US$ million)

     Revised in BSUP scheme for construction                                               Integrated Civic Infrastructure
     of 219 Dus in Panch Zopda and Gopal                              1.76                 Development Project (ICIDP) Phase. I,                20.04
     Nagar slums in Nagpur, Maharashtra                                                    Nagpur, Maharashtra
                                                                                           Revised DPR for "Construction of 1,694
                                                                                           Houses at four locations of Nagpur City
     BSUP scheme for construction of 279 Dus
                                                                      2.06                 for Rehabilitation of Urban/Poor under               19.36
     in Jat Tarodi slum in Nagpur,. Maharashtra
                                                                                           JNNURM - BSUP- PPP scheme -
                                                                                           Nagpur".
                                                                                           Implementation of Integrated Housing
     Revised BSUP scheme for construction of
                                                                                           Projects (788 Dus) under BSUP at
     456 Dus in 5 slums of North Nagpur in                            2.53                                                                      5.38
                                                                                           Nanded City. Dist. Nanded,
     Nagpur, Maharashtra.
                                                                                           Maharashtra.
     Revised BSUP scheme for construction of                                               Implementation of Integrated Housing
     365 Dus in Gopal Nagar and Bh. Anand                                                  projects (958 Dus) under BSUP at
                                                                      4.45                 Nanded City. Distt. Nanded,                          6.97
     Kausalyayan Nagar slums in Nagpur
     Maharashtra                                                                           Maharashtra

     Revised BSUP scheme for construction of                                               Implementation of Integrated Housing
     630 Dus in Savitribai Phule Nagar slum in                        6.21                 Projects (1183 Dus) under BSUP at                    8.87
     Nagpur, Maharashtra                                                                   Nanded city. Dist. Nanded, Maharashtra

     Revised BSUP scheme for construction of                                               Implementation of Integrated Housing
     1017 Dus in Indira Nagar, Indiramata                                                  projects (1567 Dus) under BSUP at
                                                                      9.44                 Nanded City. Distt. Nanded,                          11.84
     Nagar, Wanjara and Bokar nagar (4 slums)
     slums in Nagpur, Maharashtra                                                          Maharashtra

     Source: Department of Environment, Government of Maharashtra, JNNURM, Ministry of Urban Development

28      MAHARASHTRA                                                                                            For updated information, please visit www.ibef.org
DEVELOPMENT PROJECTS: KEY PUBLIC-PRIVATE
                    PARTNERSHIP (PPP) PROJECTS

                                                                                                                                                          Project cost
     Project name                                                        PPP type                        Sector                     Stage
                                                                                                                                                         (US$ million)

     4 laning Pune - Shirur Road                                            (BOT)                      Transport                 Completed                    16.04

     Hydro Electric Power (Waghur) Project                                  (BOT)                        Energy              Under construction               1.10

                                                                                                                              Operation and
     Hydel Power (Vajra - III) Project                                      (BOT)                        Energy                                               1.10
                                                                                                                             maintenance stage
                                                                                                                              Operation and
     Hydro Electric Power (Urmodi) Project                                  (BOT)                        Energy                                               2.20
                                                                                                                             maintenance stage

     Hydro Electric Power (Upper Vaitarna) Project                          (BOT)                        Energy              Under construction               2.20

                                                                                                Social and commercial
     School Building (Solapur) Project                                    (DBOOT)                                            Under construction               0.97
                                                                                                    infrastructure

     Hydro Electric Power (Temghar) Project                                 (BOT)                        Energy              Under construction               2.93

                                                                                                                              Operation and
     Hydro Electric Power (Parseoni) Project - Package 2                    (BOT)                        Energy                                               3.23
                                                                                                                             maintenance stage

     Hydro Electric Power (Nisare) Project                                  (BOT)                        Energy              Under construction               1.68

     Source: DEA, Ministry of Finance, Government of India, BOT: Build-Operate-Transfer, DBOOT: Design-Build-Own-Operate-Transfer, O&M: Management Contract

29      MAHARASHTRA                                                                                               For updated information, please visit www.ibef.org
DEVELOPMENT PROJECTS: SEZs … (1/3)

      Navi Mumbai Special Economic Zone (NMSEZ) is the agency                            Some of the operational SEZs in Maharashtra
       responsible for the supervision and execution of SEZs in the state.

      As of December 2017, the state had 28 exporting SEZs across                          Name/Developer                        Location      Primary Industry
       diversified sectors including textiles and apparel, food processing,
       footwear and leather products, multi-product, pharma, IT SEZs, etc.                Maharashtra Airport
       In October 2017, the state government adopted a SEZs policy in                     Development Company Ltd.              Mihan,Nagpur       Multi product
                                                                                          (MIHAN SEZ)
       which all 28 SEZs with total investment of Rs 35,024 crore (US$ 5.41
       billion) were planned on an area of 4,087 ha to generate employment                SEEPZ Special Economic                               Electronics and gems
                                                                                                                                   Mumbai
       of about 52.5 million.                                                             Zone                                                     and jewellery

      In 2017, around 12 Bio-technology – SEZs have been proposed
                                                                                          Maharashtra Industrial
       under public sector with an investment of Rs 4,733 crore (US$ 731                                                         Aurangabad        Engineering
                                                                                          Development Corporation
       million). This project is expected to generate employment
       opportunities of about 0.165 million.                                                                                                   Computer/electronic
                                                                                          Wipro Ltd.                            Maharashtra
                                                                                                                                                   software

                                                                                          Maharashtra Industrial                               Computer/electronic
                                                                                                                                     Pune
                                                                                          Development Corporation                                  software

                                                                                          Maharashtra Industrial                                   Chemicals &
                                                                                                                                   Nanded
                                                                                          Development Corporation                                pharmaceuticals

                                                                                          Khed Economic Infrastructure                            Engineering &
                                                                                                                                     Pune
                                                                                          Pvt. Ltd.                                                electronics

                                                                                          Maharashtra Industrial
                                                                                                                                    Satara         Engineering
                                                                                          Development Corporation

 Source: Ministry of Commerce & Industry, Department of Commerce, SEZ: Special Economic Zone , Socio Economic Survey of Maharashtra, 2017-18

30      MAHARASHTRA                                                                                             For updated information, please visit www.ibef.org
DEVELOPMENT PROJECTS: SEZs … (2/3)

      In addition to operational SEZs, as of December 2017, Maharashtra                 Some of the SEZs with formal approvals
       had 11 SEZs with valid in-principle approvals, 57 SEZs with formal
       approvals and 49 SEZs with notified approvals.                                      Name/Developer                     Location     Primary Industry

                                                                                           Maharashtra Industrial
                                                                                           Development Corporation Limited       Pune            IT/ITeS
                                                                                           MIDC
                                                                                           Syntel International Private
                                                                                                                                 Pune            IT/ITeS
                                                                                           Limited
                                                                                                                                           Pharmaceuticals &
                                                                                           Serum Bio-pharma Park                 Pune
                                                                                                                                             biotechnology
                                                                                           Maharashtra Industrial
                                                                                                                                 Latur      Agro-processing
                                                                                           Development Corporation
                                                                                           Maharashtra Industrial
                                                                                                                               Nanded       Pharmaceuticals
                                                                                           Development Corporation
                                                                                           Maharashtra Industrial               Auranga       Engineering &
                                                                                           Development Corporation                bad          electronics
                                                                                           Wokhardt Infrastructure              Auranga
                                                                                                                                              Pharmaceutical
                                                                                           Development Limited                    bad

                                                                                           Hiranandani Builders                 Mumbai           IT/ITeS

                                                                                           New Found Properties and
                                                                                                                                 Thane           IT/ITeS
                                                                                           Leasing Pvt. Ltd.

                                                                                           EON Kharadi Infrastructure
                                                                                                                                 Pune            IT/ITeS
                                                                                           Private Limited

 Source: Ministry of Commerce & Industry, Department of Commerce, SEZ: Special Economic Zone

31      MAHARASHTRA                                                                                          For updated information, please visit www.ibef.org
DEVELOPMENT PROJECTS: SEZs … (3/3)

     Some of the SEZs with valid in-principal approvals

      Name/Developer                                                                              Location                           Primary Industry

      Mumbai SEZ Limited                                                           Gujarat Positra Port Infrastructure Ltd              Multi-product

      Gitanjali Gems Limited                                                                Nanded, Maharashtra                      Gems and jewellery

      ISPAT Industries Limited                                                          Raigad District, Maharashtra                    Multi-product

      Gitanjali Gems Limited                                                              Aurangabad, Maharashtra                    Gems and jewellery

      Gitanjali Gems Limited                                                                 Nagpur, Maharashtra                        Multi-product

      Maharashtra Airport Development Company Limited                                        Nagpur, Maharashtra                           Power

      Gitanjali Gems Limited                                                                 Nashik, Maharashtra                        Multi-services

      Redi Port Ltd.                                                            Post Redi, district Sindhudurg, Maharashtra                FTWZ

      North Mumbai International Commodity Township Pvt. Ltd.                                Thane, Maharashtra                            FTWZ

      Wardha Sakhar Karkhana Ltd.                                                           Wardha, Maharashtra                         Biotechnology

      Worldwide Oilfield Machine Pvt Ltd                                                      Pune, Maharashtra                          Engineering

 Source: Source: Ministry of Commerce & Industry, Department of Commerce, SEZ: Special Economic Zone

32      MAHARASHTRA                                                                                          For updated information, please visit www.ibef.org
SOCIAL INFRASTRUCTURE – EDUCATION

      During 2017-18, Maharashtra’s education infrastructure comprised of
       22 universities, 106,527 primary schools, 26,879 secondary & higher                  Education infrastructure (2017-18)
       secondary schools.                                                                                                            No. of          Student
                                                                                             Institution
      Primary schools had 15,909 thousand students enrolled during the                                                           Institutions      Enrollment
       year, of which 7,450 thousand were girls, with 542 thousand                             Primary schools*                    106,527            15,909
       teachers. Secondary schools in the state had 6,648 thousand
                                                                                               Secondary and higher
       enrolled students, of which 3,042 thousand were girls, with 218                                                              26,879             6,648
                                                                                               secondary schools*
       thousand teachers. Government of Maharashtra is focusing on
                                                                                               Engineering colleges
       education of girls in the state. Various schemes such as Kasturba
                                                                                               (diploma, graduate and               1,025             151,651
       Gandhi Balika Vidyalaya, Ahilyabai Holkar Scheme & Attendance                           post-graduate)
       Allowance Scheme have been introduced for promoting girl
                                                                                               Industrial training institutes
       education in the state.                                                                                                       881              118,595
                                                                                               (ITIs)
      As per budget 2016-17, the state government allocated an amount of                      Architecture colleges
       US$ 20.99 million for the “National Secondary Education Mission”                                                               97               4,857
                                                                                               (Graduate, Post-Graduate)
       which was initiated by the central government, in association with the
                                                                                               Arts, science, commerce &
       state government, and aims at delivering quality education to all                       law colleges (Graduate,               2,341            821,931
       students undergoing secondary education. Further, the state                             Post-Graduate)
       government also decided to digitise all public libraries approved by
                                                                                               Pharmacy (diploma,
       the government, with an allocated amount of US$ 2.62 million during                     graduate and post-graduate,            576              32,572
       2016-17.                                                                                Pharma D)
      In addition, an outlay of US$ 113.04 million for Sarv Shiksha Abhiyan                Literacy rate (%) in Maharashtra, 2015-16
       has been proposed by the central & state governments, collectively.

      As of February 2017, a total of 18,225 schools had completed their                    Overall                              82.3
       self assessments, which is the 1st stage of the new accreditation                     Male                      88.4           Urban            88.7
       system Shaala Siddhi 2016, adopted by all states in India.
                                                                                             Female                    69.9           Rural             77
 Source: Socio Economic Survey of Maharashtra, 2017-18, State Budget 2016-17, Census 2011, * : Provisional

33      MAHARASHTRA                                                                                              For updated information, please visit www.ibef.org
SOCIAL INFRASTRUCTURE – HEALTH

     Health infrastructure (2017-18)(1)                                                      Health indicators of Maharashtra (As of September 2017)

       Sub-Centres
                                                                       10,580                 Doctor to patient ratio                                   1: 27,790(1)
       Primary Health Centres                                           1,814                 Registered doctors                                        148,575(1)
       Rural Hospitals (CHC)                                             360
                                                                                              Birth rate (per thousand persons)                            15.9
       Primary Health Units
                                                                         193
                                                                                              Death rate (per thousand persons)                             5.9
       Mobile Medical Units                                               40
                                                                                              Infant mortality rate (per thousand live
       Sub-district Hospitals                                                                                                                               19
                                                                                                births)
                   a) 50 beds                                             58
                   b)100 beds                                                                Life expectancy at birth (years) (2015-16)
                                                                          28
       District Hospitals                                                 23                  Male (2016-20)                                               69.9
       Hospitals having Medical Colleges                                  16                  Female (2016-20)                                             73.7
       General Hospitals (Malegaon, Khamgaon &
       Ulhasnagar 200 beds each, Malad-Malwani
                                                                                              As per budget 2017-18, an outlay of US$ 1.27 billion has been
       60 beds)                                                           4
                                                                                               proposed by the state government for Public Health Department.
       Women Hospitals                                                    13                   Moreover, for increasing the coverage of insurance being provided to
       Mental Hospitals                                                   4                    beneficiaries in the state, the state government proposed an
       Leprosy Hospitals                                                                       allocation of US$ 45.82 million during 2016-17.
                                                                          4
       TB Hospitals                                                                           In 2018, Government of India has proposed Rs. 964 crore (US$ 149
                                                                          4
                                                                                               million) to increase availability of good health services in urban and
                                                                                               rural areas of Maharashtra by implementing National Health Mission.

 Source: Ministry of Health and Family Welfare, Government of India, Socio Economic Survey of Maharashtra, 2017-18,   (1)   As on 31st December, 2017

34      MAHARASHTRA                                                                                                    For updated information, please visit www.ibef.org
CULTURAL INFRASTRUCTURE

      Cricket is the prominent sport in Maharashtra. Other popular sports are hockey & tennis.
      The state has a number of sports stadiums located in Mumbai, Pune & Nagpur. The most well-known ones are the Wankhede Stadium & the
       Brabourne Stadium in Mumbai, the Nehru Stadium in Pune & the Vidarbha Cricket Association (VCA) Stadium in Nagpur.
      The state has a number of entertainment centres & multiplexes. The most famous entertainment centres include Essel World in Thane. The state
       is also home to almost all major multiplex chains in the country, including PVR Cinemas, Big Cinemas & Fun Cinemas. The state has a number of
       religious places, including the Siddhi Vinayak temple (Mumbai), Shirdi, Nasik & Sach Khand Shri Huzur Gurdwara (Nanded).
      The Gateway of India, Ajanta Ellora caves, Daulatabad Fort & Khandala are the main tourist destinations in the state. The Sahara Stadium in
       Pune has been built with modern outlook & state-of-the-art facilities; the stadium has a seating capacity of 36,000.
      In 2016, the state government formulated a new policy- "Maharashtra Tourism Policy 2016" & allocated US$ 43.53 million for the policy in order to
       intensify basic amenities across various tourist spots in the state.
      Under the New Sports Policy 2012, the Government of Maharashtra plans to set up public gyms at district sports complexes or municipal gardens.
      In November 2016, the state played host to Global Citizen Festival India, one of the biggest musical events in the country.

 Source: Maharashtra Tourism, Government of Maharashtra

35      MAHARASHTRA                                                                                  For updated information, please visit www.ibef.org
AMRUT AND SMART CITIES

      On the basis of population and the number of statutory towns, the       Smart cities selected in Maharashtra
       Government of India shortlisted 9 cities, namely, Amravati,
       Aurangabad, Greater Mumbai, Kalyan-Dombivali, Nagpur, Nashik,
                                                                               Cities                  Population     Area (sq. km)    Literacy rate
       Navi Mumbai, Pune, Solapur & Thane under the Smart City project.
       In November 2015, the UK government selected 2 cities of
                                                                               Pune                    9,429,408          15,643          86.15%
       Maharashtra, that is, Pune & Amravati to develop as smart cities.
       The agreement is expected to boost the Indo-UK trade.                   Nagpur                   4,653,570         9,892           88.39%
      As per budget 2016-17, the state government launched a scheme for
                                                                               Nashik                   6,107,187         15,530          82.31%
       smart city for delivering eco-friendly & ecological urban life to the
       state’s citizens. Among the first selected 20 states, Pune & Solapur    Aurangabad               3,701,282         10,107          79.02%
       are also included. Moreover, the state government has also decided
       to develop other 8 smart cities in the state as well. In Budget 2017-   Solapur                   951,118          148.9           82.80%
       18, the state and central allocated a sum of US$ 246.1 million
                                                                               Thane                    1,818,872         147.00          89.41%
       towards this programme.
                                                                               Pimpri-Chinchwad         1,727,692         171.51          89.22%
                                                        Nagpur
                                                                                In Budget 2018-19, the Government of India has proposed Rs 1,316
                Nashik                                                           crore (US$ 203 million) for the year 2018-19 to develop eight smart
       Bhiwandi                                                                  cities selected under the Smart City Mission.
                         Aurangabad

       Mumbai

                Pune

36      MAHARASHTRA                                                                               For updated information, please visit www.ibef.org
KEY INDUSTRIES

      The resources, policy incentives, infrastructure and climate support                 Key Industries in Maharashtra
       investments in the state. Maharashtra Agro Industries Development                       Pharmaceuticals                                Oil & gas
       Corporation, founded in 1965, is responsible for development of
       agro-based units in the state. MIDC is responsible for the                              Biotechnology                                  Food & agro processing
       development of industrial infrastructure. Maharashtra Small Scale
                                                                                               IT and ITeS                                    Gems and jewellery
       Industries Development Corporation was formed in 1962 to provide
       new orientation and strength to the development of small-scale                          Electronics                                    Banking, financial services and
       industries in the state. Its main objective is to aid, counsel, assist,                                                                  insurance (BFSI)
                                                                                               Engineering
       finance, protect and promote interests of small industries.
                                                                                                                                               Textiles
                                                                                               Auto & auto components
      The Government of Maharashtra is promoting the development of
       several Special Economic Zones (SEZs) across Maharashtra for                         Establishment of MSME units
       sectors such as IT/ITeS, pharmaceuticals, biotechnology, textile,
       automotive & auto components, gems & jewellery and food                                                        MSME              Investment               Employment
                                                                                            Year
       processing. As of December 2017, the state has 28 exporting SEZs,                                              units            (US$ million)               (lakh)
       of which the majority share is contributed by IT/ITeS, engineering                   2007-08                   10,244                348.46                     1.39
       and electronics segment.
                                                                                            2008-09                   11,682                503.36                     1.71
      Government of Maharashtra has decided to convert Navi Mumbai’s
                                                                                            2009-10                   11,896                462.57                     1.50
       2,140 hectares of SEZs land into integrated industrial area.
                                                                                            2010-11                   14,496                849.83                     1.87
                                                                                            2011-12                   15,606                678.74                     2.07
                                                                                            2012-13                   16,136                833.33                     2.06
                                                                                            2013-14                   19,814                971.28                     2.48
                                                                                            2014-15                   36,992              1,096.85                     3.50
                                                                                                         (1)
                                                                                            2015-16                   20,220                624.81                     1.66
     Source: Economic Survey 2015-16, MAIDC - Maharashtra Agro Industries Development Corporation,   (1)Up   to September 2015, News Articles

37       MAHARASHTRA                                                                                                   For updated information, please visit www.ibef.org
FINANCIAL SECTOR … (1/7)

      At current prices, the contribution of the banking and insurance                Gross State Value Added by Financial Services at current
       sector to the GSDP of the state increased at a CAGR of 10.54%                                     prices (US$ billion)
       between 2005-06 and 2015-16.                                                      30.00
      At constant prices, the contribution of banking and insurance sector              25.00

                                                                                                                                                                                                            27.69
                                                                                                                                                                                        27.27
                                                                                                                                                                    25.41
       in the GSDP of the state increased at a CAGR of 4.57% between                     20.00

                                                                                                                                                23.24
                                                                                                                            20.04
                                                                                         15.00

                                                                                                    18.29
       2008-09 and 2014-15.
                                                                                         10.00
      Aggregate deposits and credit of scheduled commercial banks in                     5.00
       Maharashtra stood at US$ 334.2 billion and US$ 355.20 billion                      0.00

                                                                                                                                                                                        2015-16
                                                                                                    2011-12

                                                                                                                            2012-13

                                                                                                                                                2013-14

                                                                                                                                                                    2014-15

                                                                                                                                                                                                            2016-17
       respectively, in 2017-18.

     Deposits and credit of scheduled commercial banks in
     Maharashtra by bank group
                                No. of                                               Banking and insurance contribution to GSDP at constant prices
                                                  Deposits             Credit (US$
       Bank group              banking
                                                (US$ million)            million)                           (in US$ billion)
                                offices
     Rural                                                                               30.00
                                                     9,823                 7,220         25.00
                                 5,822

                                                                                                                                                          25.71

                                                                                                                                                                                                              25.12
                                                                                                                                      23.76
     Semi-urban                                                                          20.00

                                                                                                                                                                              23.12

                                                                                                                                                                                                  22.97
                                                    19,790                12,036

                                                                                                                  20.09
                                                                                                  19.21
                                                                                         15.00
     Urban/Metropolitan                                                                  10.00
                                 6,369             304,593                335,947
                                                                                          5.00
     Total                                                                                  -
                                12,191             334,207                355,202

                                                                                                                                                                                                  2013-14
                                                                                                  2008-09

                                                                                                                  2009-10

                                                                                                                                      2010-11

                                                                                                                                                          2011-12

                                                                                                                                                                              2012-13

                                                                                                                                                                                                              2014-15
     (1)Note: As of March 2017,
     Exchange rate = USD1 – Rs 64.74
     Source: Reserve Bank of India, Socio Economic Survey of Maharashtra, 2017-18

38      MAHARASHTRA                                                                                           For updated information, please visit www.ibef.org
FINANCIAL SECTOR … (2/7)

      As of December 2017, out of 221,658 ATMs in the country,                      ATMs deployed in Maharashtra, June 2017
       Maharashtra accounted for 25,662 ATMs making it the state with the
       highest number of ATMs deployed.                                     30,000

      Not only is the state home to headquarters of many financial
       companies, it also houses various financial regulatory bodies        25,000

                                                                                          25,835
       including Reserve Bank of India (RBI), Securities and Exchange
       Board of India (SEBI), Forwards Market Commission (FMC).
                                                                            20,000

                                                                            15,000                 14,260

                                                                                                                           9,424
                                                                            10,000

                                                                             5,000
                                                                                                                                                   1,729
                                                                                                                                                                       249
                                                                                -

                                                                                                     Public Sector Banks
                                                                                          Total

                                                                                                                            Private Sector Banks

                                                                                                                                                                       Foreign Banks in India
                                                                                                                                                    White Label ATMs
     Source: Reserve Bank of India

39      MAHARASHTRA                                                                         For updated information, please visit www.ibef.org
FINANCIAL SECTOR … (3/7)

     Scheduled commercial banks in Maharashtra

      Reserve Bank of India
                                         Reserve Bank of India (RBI) was founded in 1935 and is recognised as India's central banking
                                          institution. RBI also controls the monetary policy of the Indian rupee. RBI is headquartered in Mumbai,
                                          Maharashtra and has 19 regional offices and nine sub offices.
                                         Monetary authority, supervision of the financial systems, foreign exchange management and currency
                                          issuing are the major functions of the Reserve Bank of India.

           State Bank of                 Foundation year: 1956 (owned by Government of India)
               India
                                         Banking services: Credit cards, consumer banking, corporate banking, finance and insurance,
                                          investment banking, mortgage loans, private banking, wealth management
                                         Total assets: US$ 420 billion; Total income: US$ 32.75 billion (2016-17), Q3 – Total Income Rs
                                          62,887.06 crore (US$ 9,713.79 million)
                                         Headquarters & employees: Headquartered in Mumbai with over 300,000 employees
                                         Website: www.sbi.co.in

                                           Foundation year: 1906 (state owned commercial bank)
           Bank of India
                                           Banking services: Commercial banking, retail banking, private banking, asset management, mortgages,
                                            credit cards
                                           Total assets: US$ 97.21billion; Total income: US$ 7.15 billion (2016-17), Q3 – Total Income Rs
                                            10,37,603 lakh (US$ 16,027.23 million)
                                           Headquarters & infrastructure: Bank is based in Mumbai with over 4,500 branches and over 1,000
                                            ATMs all over India
                                           Website: www.bankofindia.com
     Source: Reserve Bank of India, Bank websites

40      MAHARASHTRA                                                                                    For updated information, please visit www.ibef.org
FINANCIAL SECTOR … (4/7)

     Scheduled commercial banks in Maharashtra

                                           Foundation year: 1919 (owned by Government of India)
        Union Bank of India
                                           Banking services: Consumer banking, corporate banking, finance and insurance, investment banking,
                                            mortgage loans, private banking, private equity, wealth management, agriculture loan
                                           Total assets: US$ 70.34 billion; Total income: US$ 5.94 billion (2016-17), Q3 – Total Income Rs
                                            9,133.58 crore (US$ 1,410.81 million)
                                           Headquarters & Employees: Bank is based in Mumbai with over 28,000 employees and more than
                                            4,000 ATMs
                                           Website: www.unionbankofindia.co.in

              Bank of                     Foundation year: 1935 (the bank has the largest network of branches in Maharashtra and is a public
            Maharashtra                   sector bank)
                                          Banking services: Loans, credit cards, savings, investment vehicles, insurance, investment banking,
                                          mortgage loans, private banking etc.
                                          Total assets: US$ 24.73 billion; Total income: US$ 2.11 billion (2016-17), Q3 – Total Income Rs 9,508
                                          crore (US$ 1,469 million)
                                          Headquarters & infrastructure: Based in Pune, and reaches out to 15 million customers with 2,000
                                          branches in 29 states
                                          Website: www.bankofmaharashtra.in

          Central Bank of                 Foundation year: 1911 (one of oldest commercial banks owned by the government)
               India                      Banking services: Core banking services are loans, credit cards, savings, investment vehicles, and
                                          insurance, investment banking, mortgage loans, private banking etc.
                                          Total assets: US$ 51.75 billion; Total income: US$ 4.27 billion (2016-17), Q3 – Total Income Rs 6,589.32
                                          crore (US$ 1,017.81 million)
                                          Headquarters & infrastructure: Headquartered in Mumbai with over 4,000 branches in 27 Indian states and
                                          270 extension counters
                                          Website: www.centralbankofindia.co.in

     Source: Reserve Bank of India, Bank websites

41      MAHARASHTRA                                                                                      For updated information, please visit www.ibef.org
You can also read