The impact of COVID-19 on the infrastructure-related construction sector - Te Waihanga - Deloitte
←
→
Page content transcription
If your browser does not render page correctly, please read the page content below

Contents

Construction Sector COVID-19
Recovery Study

The impact of COVID-19 on the
infrastructure-related construction
sector
Te Waihanga
January 2021
00
Contents

Contents

Glossary                                  2
Acknowledgements                          3
Executive summary                         4
About this report                         9
State of the Sector prior to COVID-19     13
COVID-19 disrupted the Sector             19
The road ahead                            32
Challenges amplified by COVID-19          39
Opportunity 1: Pipeline certainty         40
Opportunity 2: Local government funding   43
Opportunity 3: Improve procurement        45
Opportunity 4: Workforce and skills       47
Appendix A: Interviews                    49
Appendix B: Survey questions              53

1

Glossary

Glossary
Acronym      Full name
Bn           Billion
BRANZ        Building Research Association of New Zealand
COVID-19     2019 novel coronavirus
CCNZ         Civil Contractors New Zealand
GDP (E)      Gross Domestic Product (expenditure method)
GDP (P)      Gross Domestic Product (production method)
GFC          Global Financial Crisis
MBIE         Ministry of Business, Innovation and Employment
Mn           Million
NZUP         New Zealand Upgrade Programme
NZQA         New Zealand Qualifications Authority
Our Survey   C-19 Recovery Survey
RBNZ         Reserve Bank of New Zealand
RICs         Royal Institution of Chartered Surveyors
RMA          Resource Management Act
Stats NZ     Statistics New Zealand
The Sector   The infrastructure-related construction sector

2

Acknowledgements

Acknowledgements
The New Zealand Infrastructure Commission (Te Waihanga) and Deloitte gratefully
acknowledge the assistance of both public and private sector stakeholders who
contributed their insights to this report, through interviews and Te Waihanga’s
targeted COVID-19 Recovery Survey.

Te Waihanga conducted a targeted survey of the impacts of COVID-19 on the
infrastructure-related construction sector and opportunities to support recovery. The
survey data used in this report could not have been collected without the co-
operation of multiple organisations which agreed to distribute the survey on our
behalf, and those organisations which responded to the survey. These organisations
came from a broad range of sectors and service providers across the lifecycle of an
infrastructure project including:
     •    Telecommunications
     •    Energy
     •    Water
     •    Airport
     •    Transport
     •    Residential Property
     •    Social Infrastructure
     •    Engineering
     •    Architecture
     •    Building Materials
     •    Professional Advisory

We also acknowledge AECOM’s assistance in the distribution of the survey and
provision of sector specific insight.
Insights received from AECOM, the survey and stakeholder interviews were critical to
the analysis and insights presented in this report.

3
Executive summary

Executive summary
This report is based on a series of interviews with sector peak bodies
in the infrastructure-related construction sector, and a targeted
survey of individual firms to understand the impact of COVID-19 on
the Sector.
The New Zealand Infrastructure Commission (Te Waihanga) commissioned Deloitte to undertake a COVID-19
recovery study of the infrastructure-related construction sector (the Sector).

Infrastructure investment is not just being relied upon to deliver economic stimulus, it is critical to the long-term
wellbeing of New Zealanders. A strong infrastructure-related construction sector is essential to delivering New
Zealand’s infrastructure pipeline. Insights gained from this report will support Te Waihanga as it engages with the
Sector and looks to fulfil its mandate to lift infrastructure planning and delivery to a more strategic level.

This report has been informed by a new COVID-19 Recovery Sector Survey (our survey or C-19 Recovery Survey)
and interviews with key peak bodies over September to October 2020, augmented with existing research, sector
surveys and data published in November and December 2020.

The Sector encompasses horizontal, vertical and residential construction as well as related construction
activities. The focus of this report is on horizontal and vertical construction. Horizontal construction is
construction of a non-building type such as roads, bridges, utilities and other civil works. Vertical construction
comprises of building types other than residential structures, including hotels, offices, retail outlets, industrial
buildings and social infrastructure such as prisons, schools and hospitals.

State of the Sector prior to COVID-19
The Sector is a major contributor to economic activity in New Zealand, accounting for 6.9% of GDP and 10% of
total full-time equivalent jobs in 2019. Prior to COVID-19, the Sector’s growth also outpaced that of the broader
economy with vertical construction growing at an annual rate of 4.9% and horizontal construction 4.2%,
compared to average annual GDP growth of 3.5% between 2015 and 2019.

However, the Sector was not without its challenges. Access to appropriate skills and low relative productivity
have hampered historical output, along with increasing cost of materials and local council funding challenges.
The cyclical nature of Government infrastructure investment has also made it difficult for the Sector to plan and
invest.

The outlook for the Sector was relatively positive prior to COVID-19. Demand for the Sector is derived from the
pipeline for infrastructure, so this report uses this as an indicator for the outlook. In the Ministry of Business,
Innovation and Employment’s (MBIE) 2019 National Construction Pipeline forecast, horizontal infrastructure was
forecast to increase gradually from $7.6bn in 2018 to a peak of $8.3bn in 2024. Similarly, the immediate demand
for vertical infrastructure was expected to be strong and reach a peak of $9bn in 2021, before declining to
$7.2bn in 2024.

COVID-19 impacts thus far
The impact of COVID-19 has made 2020 the most turbulent year in recent history for the Sector. The COVID-19
pandemic necessitated significant public health and economic policy responses centred on addressing the
human impacts of the health crisis. Yet, measures aimed to slow the spread of the virus resulted in an
unprecedented decline in construction activity.

04
Executive summary

The restrictions associated with Alert Levels Three and Four had an immediate impact on the Sector and
exacerbated existing challenges. Construction activity declined by 27% over Q2 2020 as the Sector felt the effect
of lockdowns and restrictions. While the Sector had the highest proportion of supported jobs from the wage
subsidy, productivity, an already well-known issue in the Sector, dropped to its lowest levels in 10 years.

Liquidations have also been well below historic averages. The Sector may, however, see an uptick in insolvency
activity as the wage subsidy and other government support is wound up, albeit with a lag. Based on historic
trends, this insolvency catch-up in 2021 could be approximately 13% higher relative to 2019.

Respondents to our survey reported disruptions to their supply chains, citing challenges with importing and
distributing materials, availability of skilled resources, and the lack of certainty around the timing of future
projects. Although survey respondents and interviewees expressed many common concerns, the impact of
COVID-19 has not been uniform across the Sector. Our research and analysis indicate that the vertical
construction sector has been harder hit than horizontal construction. The table below presents a summary of key
metrics.

    Indicator                                                                          Horizontal sector   Vertical sector

    GDP- change from Q2 2020 relative to Q2 2019                                       -16%                -29%

    GDP- change from Q3 2020 relative to Q3 2019                                       5%                  -7%

    A decline of more than 10% in turnover in Q3 2020 (% of respondents)               16%                 36%

    Hours worked - change from Q1 to Q2 2020                                           -12.6%              -14.6%

    Underutilisation (Sep 2020 and Sep 2019)                                           +0.7 (4.1 to 4.8)   +0.9 (3.5 to 4.4)

    Projects delayed or stalled in Q2 2020 (% of respondents)                          71%                 79%

    Price discounting behaviour in Q2 and Q3 2020 (% of respondents)                   44%                 62%

    Decline in business capital investment due to COVID-19 (% of respondents)          44%                 50%

    Decline in training investment budgets due to COVID-19 (% of respondents)          50%                 45%

    Decline of more than 5% in Q3 in the value of 12-month forward order
                                                                                       37%                 50%
    book relative to pre COVID-19 levels (% of respondents)

    Decline in more than 5% in business activity in Q3 relative to pre
                                                                                       21%                 38%
    COVID-19 levels (% of respondents)

Source: Deloitte based on the C-19 survey and Statistics New Zealand customised data

The impact on revenue was more severe for those in the vertical construction sector. Over a third of our survey
respondents operating in vertical construction expected turnover to decline by 10% to 20% in Q3 2020. The peak
bodies interviewed noted that firms operating with a heavy reliance on local government, or vertical
construction for the retail/tourism/travel sectors, were likely to be hardest hit. Further impacting firms’ finances
was a perceived increase in price discounting in order to secure work. Reflecting this backdrop, the majority of
survey respondents confirmed projects had been delayed or stalled.

The impact of COVID-19 restrictions on the Sector also caused significant delays in many construction projects
and flow-on consequences for subcontractor’s plans and work flow. Further, local authorities as key spenders on
infrastructure experienced additional funding challenges, driving reductions or deferrals in expenditure. Many
local authorities were impacted by a fall in revenue as a result of the economic downturn. These additional
funding uncertainties and constraints have been cited in interviews as contributing to delays or cancellations in
projects and/or maintenance activities.

5
Executive summary

Firms have responded to reduced work and higher pipeline uncertainty by decreasing hours and more than 40%
of businesses surveyed expected to decrease business capital investment and training budgets. During Q2 and
Q3 2020 the majority of businesses surveyed indicated they observed price discounting behaviour to secure
work (62% in vertical construction and 44% in horizontal construction).

There are however promising signs the Sector is on a road to recovery. The Sector bounced back in Q3 2020,
with a quarterly change in GDP relative to the previous year of 5% in horizontal construction and -7% in vertical
construction. Businesses operating in the Sector also bounced back after Q2 and Q3 2020 and are now
performing well relative to pre-COVID levels. For example, in assessing the movements in the NZX for companies
in the Sector, both enterprise values and enterprise multiples show a positive change in November 2020 relative
to November 2019. Sector confidence is also improving. The ANZ commercial construction indicator moved from
-32 in August 2020 to 12.5 in November 2020, still some way below the February 2020 level of 26, but well above
overall business confidence. Leading indicators, such as steel and ready-mix concrete volumes, are also strong.
Spare capacity in the steel sector is expected to be back at pre-COVID levels by December 2021 and ready-mix
concrete volumes are rebounding strongly; already back at pre-COVID levels in Q3 2020.

The road ahead
A strong sector will be essential to the COVID-19 recovery, ranking amongst the top in its ability to boost
economic activity and create jobs. This means that the final impact it has on economic output is greater than the
initial injection of spending. A weak sector will struggle to deliver the infrastructure required.

Overall, employment weakness is expected in the coming months as the wage subsidy rolls off. The impact on
employment will differ across the lifecycle of a construction project. For example, based on stakeholder
interviews, we expect architects and engineers to be initially affected, while workers further along in the building
process will be better protected by a pre-COVID pipeline of work in the near future.

The impact of the pandemic on the Sector is far from over and will persist into the future, but we expect the
Sector to bounce back faster relative to the Global Financial Crisis (GFC). It took the Sector five years to recover
from the GFC. We expect the rebound to be faster because the impact on the Sector during the COVID-19
pandemic is being more driven by restrictions, rather than underlying demand and supply structure issues. There
are four key factors that will impact the recovery of the Sector.

Recovery factors applied to infrastructure-related construction

                                      Regulation
                                      The lifting of travel, physical distancing and gathering restrictions marked the start of
                                      infrastructure-related construction recovery. Future changes to regulations will
                                      continue to influence recovery.

                                       Public demand
                                       Stimulus will underpin the recovery of public infrastructure-related construction
                                       sector demand.

                                       Private demand
                                       Slowing population growth and reduced economic activity result in less demand
                                       for new infrastructure and uncertainty further dampens investment.

                                       Supply
                                       Integral to recovery is the financial health and operation of infrastructure-related
                                       providers across the lifecycle of an infrastructure project. Access to credit and
                                       cashflow is a key aspect to recovery.

6
Executive summary

The recovery of each sub-sector will be different. We expect the demand outlook over the next five years in
horizontal construction to exceed the 2019 National Construction Pipeline forecast. Delivery of this pipeline may
be constrained by the capacity of the Sector to deliver, particularly in key sub-sectors that are receiving the bulk
of stimulus funding, and the ability of the Sector to access required skills and labour.

The demand outlook for vertical construction has been impacted more severely by COVID-19. We expect a
dramatic drop in activity relative to the 2019 forecast before a recovery back to previously anticipated levels in
2025. Stimulus initiatives will provide some support to vertical construction but are unlikely to make-up the
shortfall in demand associated with the cancellation of private sector developments.

The demand outlook suggests capacity in horizontal construction may be constrained, while there is likely to be
excess capacity in vertical construction. Survey respondents indicated 52% of horizontal and 33% of vertical firms
can increase capacity by 10% to meet demand if there is an increase in volumes of work; only 8% of horizontal
firms can increase capacity by 30% and 14% of vertical firms. This indicates that the Sector likely has the ability to
sufficiently increase capacity to respond to the increase in demand for horizontal construction. The excess
capacity in vertical construction likely presents a risk that capability and capacity could be lost over the coming
years, potentially creating a challenge in the future.

Opportunities to address challenges amplified by COVID-19
The pandemic has revealed vulnerabilities in in the Sector that existed prior to the pandemic. The findings of this
report suggest challenges amplified by COVID-19 need to be considered as part of an action plan to capitalise on
the opportunity that the current infrastructure stimulus presents for the recovery of the economy, and the
Sector itself.

The table on the following page summarises the key challenges identified through interviews and our survey,
how the challenge existed prior to COVID-19, how the challenge was amplified by COVID-19 and Deloitte’s views
on opportunities to address the challenge.

COVID-19 presents the opportunity to redefine the way we plan, pay for, and build infrastructure over the next
three decades.

The pandemic has revealed vulnerabilities in the Sector that
existed prior to the pandemic. The findings of this report
suggest challenges amplified by COVID-19 need to be
considered as part of an action plan to capitalise on the
opportunity that the current infrastructure stimulus presents
for the recovery of the economy, and the Sector itself.

7
Executive summary
Key themes, challenges, and opportunities identified in this report
Themes What is the challenge? Challenges prior to COVID How COVID amplified Opportunities to address
this challenge? this challenge
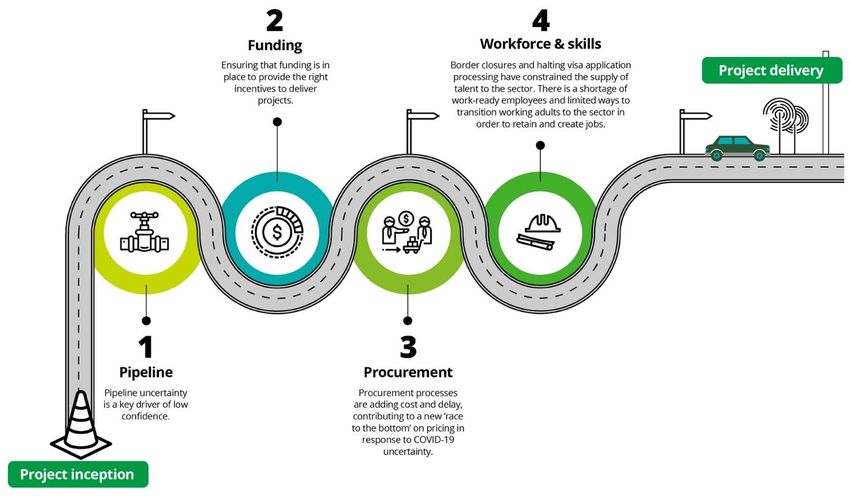
Pipeline Pipeline uncertainty is a key • A lack of a ‘single source • One of the greatest concerns • Improving the robustness
certainty driver of low confidence. of the truth’ many survey respondents of project selection
The pipeline needs to be • Tendencies for signalled shared was the disruption of • Ensuring the pipeline
complete (have the projects/activity to be forward work and the addresses the project
appropriate mix of projects), delayed associated uncertainty in the lifecycle and all sub-
certain (forecast spend, and • The influence of the longer-term pipeline sectors
timing is accurate) and electoral cycle on the • Projects delayed as a result of • Achieving appropriate
strategically robust (projects direction of infrastructure COVID-19 project mix
are strategically aligned and activity, particularly for • Collaboration across
represent value for money). flagship projects purchasing and delivery
agencies
• Identifying and
progressing projects that
support the widest range
of firms
Local Local authorities are key • Existing funding COVID-19 has impacted some • Available funds either
government spenders on infrastructure; challenges related to; local government’s revenue need to be used more
funding however, funding challenges maintaining services in streams and are contributing to judiciously to ensure
are driving reductions or areas with declining delays and cancellations in maximum benefit, or
deferrals in expenditure. populations, a projects and/or maintenance alternative sources of
requirement for higher activities funding needs to be
asset performance, and sought
replacing assets that are • Improve asset
at the end of their useful management capability
life • Recognise the important
role of maintenance
activities
Improve Procurement processes are • Purchasing entities do not COVID-19 made procurement • Consistent and expedited
procurement adding cost and delay, always appropriately challenges more pressing: procurement processes to
contributing to a new ‘race consider whole-of-life • Survey respondents indicated help reduce costs and get
to the bottom’ on pricing in costs that they have seen price work to market faster
response to COVID-19 • Inefficient procurement discounting as a result of • Increased use of
uncertainty. processes COVID-19 collaborative models
• Procurement processes • Margins for sub-contractors • Providing clear and robust
do not always allocate were harder hit than head plans to procure the work
risks to the party best contractors • Consider the ongoing
positioned to manage impact of COVID-19 when
them allocating risks
Workforce and Border closures are • The range of skills needed • With the overseas workforce • Streamlining and clarifying
skills constraining access to talent are not home-grown, nor drying up, local firms are border exemptions
that was already in demand. in abundant supply finding it increasingly difficult • Targeted micro-courses
There is a shortage of work- • The country’s immigration to source the right people aimed at transitioning
ready employees and limited and visa processing • There is a ready supply of workers into
ways to transition working systems can be time- potential labour within the infrastructure-related
adults to the Sector in order consuming and opaque market as a result of construction
to retain jobs. when seeking to obtain redundancies in other sectors,
border exemptions however, a mechanism is
• Developing people with required to support the
the right knowledge and transition of these workers
skills takes time • Demand for skills is not
limited to New Zealand. Other
countries are competing for
the same talent
Source: Deloitte
08
About this report

About this report
In a year marked by turbulence, it is time to reflect on the impact of
COVID-19 on a sector integral to drive infrastructure
as a stimulus – and to lifting our long-term wellbeing.

The COVID-19 pandemic has had a profound effect on the New Zealand economy. We have entered a period of
uncertainty and variable activity. Border closures, along with ongoing restrictions globally, continue to impact all
sectors to varying degrees. The infrastructure-related construction sector (the Sector) has not been immune to
this, with COVID-19 creating new challenges and exacerbating or accelerating existing challenges.

Given the far reaching and meaningful impacts of the pandemic and Alert Levels Four and Three on the
economy, the New Zealand Infrastructure Commission (Te Waihanga) engaged Deloitte to assess both the
impact of COVID-19 on the Sector and the outlook for recovery.

This report addresses four questions in relation to the Sector:

      •     What was the state of the Sector pre-COVID-19?
      •     What impact has COVID-19 had on the Sector in the Q2 and Q3 2020?
      •     What could recovery look like over the next five years?
      •     What are the key challenges facing the Sector as it moves through recovery?

The intention of the report is to provide further insight into the current state of the Sector and what recovery
could look like. These findings will provide Te Waihanga with information that can support the delivery of its
remit to lift infrastructure planning and delivery to a more strategic level and improve the long-term economic
performance of the nation.

This report focuses on the impacts of the COVID-19 pandemic only and excludes longer term sector
considerations of technology and climate change, which will be addressed in Te Waihanga’s forthcoming 30-year
strategy. We also acknowledge the significant ongoing work around the reform of the Resource Management Act
(RMA) and Local Government, including Three Waters. This report will not attempt to address these specific
reforms.

Te Waihanga is committed to lifting infrastructure planning
and delivery to a more strategic level and, by doing so,
improving New Zealanders’ long-term economic performance
and social, cultural and environmental wellbeing. Te Waihanga
is determined to capture the best elements of the recovery of
the Sector and is supporting initiatives through the
Construction Sector Accord and engaging in its own primary
research.

09
About this report
Defining the Sector
Infrastructure is a system of inter-connected physical structures which consume capital to produce services that
enhance wellbeing. Examples of infrastructure include transport, three waters, energy, telecommunications,
social infrastructure such as schools and hospitals, commercial and residential property.
The Sector includes three sub-sectors: horizontal, vertical and residential construction. The Sector also captures
construction related activities.
The focus of this report is on the horizontal and vertical sub-
sectors but refers to residential construction and
construction related activities where relevant.
Horizontal construction is construction of a non-building type such as roads, bridges, utilities and other civil
works. Vertical construction comprises of building types other than residential structures, including hotels,
offices, retail outlets, industrial buildings and social infrastructure such as prisons, schools and hospitals.
The standard industrial classifications used by Statistics New Zealand (Stats NZ) define construction as comprising
heavy and civil engineering construction, building construction and construction services. Building construction is
disaggregated into non-residential and residential construction. The figure below illustrates how this report maps
the infrastructure-related construction sub-sectors to the standard industrial classifications.
Figure 1 ANZSIC industrial classifications and the definitions used throughout this report
ANZSIC Level 1
classification
Construction
ANZSIC Level 2
Building construction
classification
Heavy & civil engineering Construction services
construction
Road & bridge construction Non-residential building Land development & site
construction
Vertical construction
Other heavy & civil engineering Building structure services
ANZSIC Level 3
classification
construction
Horizontal construction Building installation services
Residential building construction
Building construction services
Other construction services
Source: Deloitte based on Statistics New Zealand
10Approach
Deloitte developed a tailored approach to identify the impact and shape of recovery for the Sector. To
complement existing research and literature, several primary research methods were used to analyse the Sector.
Table 1 Primary analysis conducted during this project
Analysis Description
Sector survey (referred to as the C-19 Deloitte and Te Waihanga conducted a targeted new survey on the impacts of COVID-19 on the
Recovery Survey) Sector and opportunities to support recovery. The survey was distributed from September to
October 2020 to businesses across all regions, sizes, maturities, and operations.
Businesses answered questions about pre COVID-19 revenue, location, maturity, along with
questions ranging from COVID-19 impacts in Q2 and Q3 2020, roadblocks to recovery, capacity to
meet flagged stimulus, and suggested recovery measures. See Appendix B for more detail.
Collaboration across agencies We collaborated with a number of agencies to gain insights and customised data on the Sector,
including MBIE, Statistics New Zealand, Immigration New Zealand, the Companies Office and Te
Waihanga.
Stakeholder consultations We conducted interviews with representatives from sector peak bodies across all the segments of
the Sector. These Interviews were designed to understand the impact of COVID-19 on firms along
with infrastructure supply and demand, opportunities and challenges, overall sentiment in the
market and possible stimulus initiatives to support recovery. See Appendix A for more detail.
Source: Deloitte
This report is organised to reflect the impact of COVID-19 on the Sector and recovery over the next five years:
Part A: The COVID-19 context
• The Sector pre-COVID-19: We assessed the pre-pandemic state of the Sector to provide a baseline
against which the impact of COVID-19 can be assessed. Data was obtained from several official sources,
including the Companies Office, Statistics New Zealand and MBIE, to assess output and expenditure,
employment, the structure of the Sector, and demand prior to COVID-19. Demand for the Sector is
defined as both public and private demand for infrastructure from the MBIE Construction report and Te
Waihanga’s infrastructure pipeline.
• The impact of COVID-19: The impact of COVID-19 on the Sector in Q2 and Q3 2020 was ascertained
based on:
▪ Sentiment data from publicly available data sources, existing surveys in the Sector, and
customised sub-sector data collected from the Companies Office and Statistics New Zealand.
▪ Our C-19 Recovery Survey.
▪ This information was compared to other sector surveys and research to provide a richer and
more balanced picture of the impact of COVID-19 on the Sector at a firm level.
• Recovery over the next five years: A directional outlook of what recovery for the Sector could look like
was developed, drawing on the MBIE’s 2019 National Construction Pipeline Report, sector expertise and
survey results.
Part B: Challenges and opportunities
Opportunities to address challenges amplified by COVID-19 to recovery: We identified opportunities to
address the challenges amplified by COVID-19 to support recovery based on desktop research and stakeholder
interviews with representatives from sector peak bodies.
11Part A: The COVID-19 context Understanding the impact of COVID-19 on the Sector and the likely recovery path 12
State of the Sector prior
to COVID-19

State of the Sector prior
to COVID-19
Infrastructure-related construction is an important contributor to the
New Zealand economy, and up until 2019, the state of the Sector
appeared positive but with headwinds.

This section examines the output and expenditure, demand, employment and structure of the Sector prior to
COVID-19.

Output and expenditure
The construction sector is a major contributor to economic activity, accounting for just under a tenth of the
economy’s output and just over a tenth of total expenditure.

In the year ending December 2019, the total construction sector made up 6.9% of GDP. Spending on
construction comprised 11.9% of national spending. The distribution of spending across the sub-sectors was as
follows: 1
     • Horizontal construction was $7.3bn, or 23% of total construction expenditure.
     • Vertical construction was $7.4bn, or 24% of total construction expenditure.
     • The residential sector makes up just over half of the construction sector (53%), with expenditure of
          $16.1bn in the December 2019 year.

Growth in the Sector has outpaced that of the national average in recent years. In the five years to 2019, the
vertical and horizontal sectors grew at an average annual rate of 4.9% and 4.2%, respectively. This compares to
national average annual GDP growth of 3.5%.

However, while residential sector expenditure has grown over the past 10 years, vertical and horizontal
sectors expenditure remains at a similar level. Chart 1 shows annual horizontal construction activity peaked in
June 2018 but was at the same level in 2019 as it was 10 years earlier, at $7.2bn. Overall, spending on horizontal
construction declined from 34% of total construction spending in 2010 to 24% in 2019. As the horizontal sector is
largely publicly funded, this downward trend will reflect changes in Government expenditure on infrastructure.
Vertical construction, mostly driven by private investment, remained relatively stable at 23% of total
construction spending in both 2010 and 2019. Chart 1 also shows that residential construction increased from
43% of total construction spend in 2010 to 53% in 2019.

1
 GDP (E) is used for relevant data and calculations – we acknowledge that although the production measure is the most common GDP
measure, the expenditure measure is used in this case as it allows for a breakdown of construction sub-sectors. Source, data provided by
Statistics New Zealand.

13
State of the Sector prior
to COVID-19
Chart 1 Construction sector GDP (E) (real terms), $’000
$18,000
$16,000
$14,000
$12,000
$10,000
'000
$8,000
$6,000
$4,000
$2,000
$0
2009 2010 2011 2012 2013 2014 2015 2016 2017 2018 2019
Residential Vertical Horizontal
Source: Statistics New Zealand
Employment
The total construction sector is a significant national employer. The Sector employed 10% of FTEs in 2019 and
employment has grown at a similar pace to GDP.
The total construction sector employed approximately 172,900 fulltime workers in 2019, compared to 136,000 in
2015 and 108,000 in 2010.2 Table 2 displays the breakdown in employment across construction sub-sectors.
Building construction (including both residential and vertical sectors) and horizontal sector construction account
for 24% and 21% of construction employment, respectively. In particular, residential construction accounts for
17% of the construction sector and vertical construction account for 7%. Construction services accounted for
55%, including building completion services (10%), building installation services (23%), building structure services
(6%), land development and site preparation services (6%) and other construction services (10%).
Table 2 Construction sector employment, year to September 2019
Full-time employees (‘000), annual average % of total construction sector
Building construction 41,063 24%
Residential building construction 29,180 17%
Non-residential building construction (vertical sub-sector) 11,880 7%
Heavy and civil engineering construction (horizontal sub-sector) 36,525 21%
Construction services 95,290 55%
Building completion services 17,313 10%
Building installation services 39,693 23%
Building structure services 9,718 6%
Other construction services 17,615 10%
Land development and site preparation services 10,950 6%
Total Construction 172,878 100%
2 This definition of the construction sector includes the residential construction sector.
14State of the Sector prior to COVID-19 Source: Statistics New Zealand A wide variety of occupations, skills, and skill levels are required across the construction sector. There is a strong concentration of technicians and trades workers, machinery operators and drivers, and labourers in the construction sector, at 57%. Almost a third (32%) of construction worker employees were professionals and managers (highly qualified workers). Details of occupations by ANZSIC Level 1 construction sector are presented in Table 3 Construction sector occupations, Census 2018. Table 3 Construction sector occupations, Census 2018 Occupations within construction sector % of total construction sector Managers 25% Professionals 7% Technicians and Trades Workers 37% Community and Personal Service Workers 1% Clerical and Administrative Workers 8% Sales Workers 2% Machinery Operators and Drivers 8% Labourers 12% Total 100% Source: Statistics New Zealand The Sector is facing a domestic skills shortage. The range of skills needed in the construction sector are not all home-grown, nor in abundant supply, including specialised expertise in civil, water and structural engineering. Specialist rail knowledge, and project management – particularly in vertical infrastructure – are also in demand. The C-19 Recovery Survey suggested 20% of firms in the Sector have at least half of their employees on a working visa. In fact, some areas of infrastructure expertise, like tunnelling, are almost entirely sourced from overseas. Simply put – without the right mix of skills and people, the ability to deliver the infrastructure pipeline and unlock significant domestic employment opportunities appears fragile, even prior to COVID-19. 15
State of the Sector prior
to COVID-19

Structure of the Sector
Businesses in the Sector accounted for 11.4% (or 66,264) of total businesses in 2019. Table 4 presents the
distribution of these businesses by construction sub-sector and growth between 2000 and 2019.

Table 4: Business units, by ANZSIC Level 2 Construction subsectors

                                                                              2000           2019          Growth between 2000 and 2019

Building Construction                                                        27,645         40,641                        47%
(including both vertical and residential construction)
Construction Services                                                        13,035         23,358                        79%
Heavy & Civil Engineering Construction                                       1,749           2,265                        30%
(horizontal construction)

Source: Statistics New Zealand

Building construction, which captures both vertical and residential construction, accounts for the largest number
of New Zealand construction businesses, due to the proportionately high number of sole traders. Sole traders are
however more vulnerable to a downturn in activity resulting from economic recessions and external shocks.

Horizontal construction firms are underrepresented in terms of business units relative to the rest of the Sector,
as it consists of a smaller number of very large firms. Large firms generally have a greater ability to adsorb
economic shocks, however, there are examples of large firm failures in the New Zealand context in recent years.

Chart 2 presents the number of construction sector business “births and deaths” over the past 20 years. The data
shows that during the GFC, there was a significant decrease in construction sector “births”, while at the same
time an increase in “deaths" up to 2013. Post 2013, an inflection point occurred in the relationship between
"births and deaths”, where the number of births exceeded the number of deaths, as the Sector recovered from
the GFC.

Chart 2 Total construction businesses vs births and deaths of construction businesses

                            70,000                                                                                                     10,000
                                                                                                                                       9,000
                            60,000
                                                                                                                                       8,000
     Number of businesses

                                                                                                                                            Number of businesses

                            50,000                                                                                                     7,000
                            40,000                                                                                                     6,000
                                                                                                                                       5,000
                            30,000                                                                                                     4,000
                            20,000                                                                                                     3,000
                                                                                                                                       2,000
                            10,000
                                                                                                                                       1,000
                                0                                                                                                      0
                                     2001 2002 2003 2004 2005 2006 2007 2008 2009 2010 2011 2012 2013 2014 2015 2016 2017 2018 2019

                                       Number of construction businesses (LHS)                Number of construcion business births (RHS)
                                       Number of construction business deaths (RHS)

Source: Statistics New Zealand

16
State of the Sector prior
to COVID-19
Demand
For the purposes of this report, we have derived our estimate for the infrastructure-related construction sector
from the 2019 MBIE Construction Pipeline report for infrastructure projects.
Horizontal infrastructure approvals and work delivered is heavily influenced by Government policies, such as
NZUP3. This section only considers approvals and works in the December 2019 year. In 2019, MBIE’s Construction
Pipeline Report forecast the infrastructure pipeline to grow gradually from $7.6bn in 2018 to a peak of $8.3m in
2024.4
Before the pandemic, the Government was already progressing a large infrastructure programme consisting of
major projects and smaller works. In early 2020, the Government announced $12bn of additional infrastructure
spending, $6.8bn of which was earmarked for transport infrastructure, bringing its total forecast infrastructure
spend to $41bn between 2019 to 2023. This investment was intended to address the existing infrastructure
deficit, boost economic activity, and improve road and rail transport.
Chart 3 Horizontal sector infrastructure pipeline, 2019 to 2024
9 8.1 8.2 8.3
7.8 7.9 8
8 7.6
6.8
7
$billions/year
6
5
4
3
2
1
0
2017 2018 2019 2020 2021 2022 2023 2024
Source: MBIE 2019 Construction Pipeline Report
Local government is the largest investor in horizontal infrastructure. According to MBIE 2019 data, local
government accounts for 47% of all projects planned for delivery over 2019 to 2024. Central government and the
private sector account for 28% and 25% of planned investment, respectively. Transport is the largest category of
investment by central government, while subdivisions are the largest for the private sector.
Vertical infrastructure had a strong pipeline, off the back of stronger population growth and a positive
economic environment.
The vertical sector, predominantly driven by private investment, was experiencing strong growth prior to COVID-
19. Population growth and positive economic conditions were drivers for this buoyancy.
According to the 2019 MBIE National Construction Pipeline Report, commercial buildings were forecast to
represent 59% of the total value of vertical infrastructure activity from 2019 onward. Education had a smaller
share of total value (11%) but has the largest number of projects forecast from 2019.
The private sector was forecast to be the largest initiator of non-residential building, contributing 65% of the
value of intentions over the forecast period, while central and local government made up 20% and 15%
respectively.
3
The NZ Upgrade Programme was not initially intended as a COVID-19 recovery package.
4 MBIE (2019), National Construction Pipeline Report 2019
17State of the Sector prior
to COVID-19
In 2019, MBIE forecast the non-residential pipeline to peak at $9bn in 2021 but then steadily decline to $7.2b in
2024. The vertical infrastructure pipeline in 2019 suggested continued strong demand for commercial buildings
and other types of vertical infrastructure. Pre-COVID investment intentions for Central and Local Government
generally remained strong throughout the forecast period. In contrast, private sector projects were more heavily
skewed towards the shorter term due to a combination of optimisation bias and planning that is based on a
shorter-term horizon reflecting the nature of market demand in this part of the Sector.
Chart 4 Non-residential construction activity nationally, $ billion/year
10 9 9
8.7 8.9
9 8.4 8.5
7.9
8 7.2
7
$billions/year
6
5
4
3
2
1
0
2017 2018 2019 2020 2021 2022 2023 2024
Source: MBIE 2019 Construction Pipeline Report
Regional expenditure patterns tend to reflect recent population growth trends, with high growth councils of
Hamilton, Tauranga, Auckland, and Queenstown contributing a high proportion of recent construction
expenditure. Chart 5 illustrates the regional distribution of the total construction sector between 2013 and 2018
as well as population growth between the 2013 and 2018 censuses. Auckland accounts for the largest proportion
of construction GDP, at 31% of total activity between 2013 and 2018. A further 45% of construction activity is
attributable to the rest of the North Island and the 24% was in the South Island.
Chart 5 Proportion of construction sector GDP and population growth between 2013 and 2018
35.0%
30.0%
25.0%
20.0%
15.0%
10.0%
5.0%
0.0%
% of change in population between 2013 and 2018 % of infrastructure expenditure between 2013 and 2018
Source: Statistics New Zealand
18COVID-19 disrupted the Sector COVID-19 disrupted the Sector The impact of COVID-19 has made 2020 the most turbulent year in recent history. 19
COVID-19 disrupted the Sector

Broad impacts of COVID-19
Compared to many other countries, New Zealand performed relatively well both in its fight against the virus and
its fight to save the economy. But ‘relatively well’ during the worst global recession since World War II, does not
mean we are unscathed.

New Zealand has suffered a deep recession, driven by two main causes:

                •     Lockdown restrictions that shut down much of the economy for an extended period; and
                •     Persistent economic weakness. Even as restrictions were lifted, weakness in economic activity persisted
                      as demand had taken a massive hit through low consumer confidence and higher levels of
                      underutilisation.

Chart 6 shows the significant toll COVID-19 has taken on New Zealand’s economy, with our main measure of
economic activity (real GDP) falling by 12.2% in the June 2020 quarter alone. This was at the height of national
disruption and represented a very different environment to the one enjoyed by New Zealand today, where
growth has rebounded.

The economy rebounded strongly in Q3 2020, lifting 13.8% from Q2 (seasonally adjusted). On an annual basis,
the economy was 0.2% higher in Q3 2020 than it was the same period a year earlier. A continued low interest
rate environment, which will be further supported by the RBNZ Funding to Lending programme and potentially
negative interest rates, the strong residential property market, increasing consumer and business confidence will
support recovery over the near term. However, the economy is facing significant headwinds, with weak global
conditions the removal of the wage subsidy negatively impacting firms and employment throughout Q4 2020
and Q1 2021.

Chart 6 Gross Domestic Product, year-on-year percentage growth, 1988 to 2020

                10.0%

                    5.0%
 yoy % growth

                    0.0%

                 -5.0%

                -10.0%

                -15.0%
                      1988       1991      1994      1997      2000     2003      2006      2009      2012      2015      2018

Source: Statistics New Zealand

Domestic impact on the Sector
The direct impacts of COVID-19 and the associated restrictive measures aimed at limiting the spread of the
disease had a material effect on the Sector. These effects resulted from the inability of many construction firms
to operate at full capacity, or at all, during Alert Level Four and Alert Level Three (“the lockdown”). After the
lockdown measures relaxed and firms were able to operate freely, the Sector started to recover.

20
COVID-19 disrupted the Sector
We are gaining further insight into this impact daily. The impact on construction activity depended on:
• The degree to which firms can be classified as providing an essential service and the direct limitations
on sector activity. Relative to pre-COVID-19 activity, only 19% of the wider construction sector was able
to operate during Alert Level Four, and this increased to 85% during Alert Level Three. 5 While
construction was amongst the hardest hit sectors during Alert Level Four, relative to other sectors, it
was able to recover faster, given the Sector could operate at close to full capacity during Alert Level
Three.
• The response of firms and workers, and wider supply chain implications. Some firms may have chosen
to pause operations even though they could be classified as essential, and some operations were
impacted by the need to keep workers safe. The Sector cannot be transferred to a remote mode of
operation and therefore is one of the most vulnerable sectors to COVID-19.
The sectors hardest hit by COVID-19 disruptions during Q2 2020 were retail trade and accommodation,
transport, postal and warehousing, and construction.
Chart 7 Gross Domestic Product by sector, change from Q1 2020 to Q2 2020 ($ Millions)
Retail trade and accommodation
Construction
Business services
Wholesale trade
Rental, hiring, and real estate services
Information, media, and telecommunications
Electricity, gas, water, and waste services
Agriculture, forestry, and fishing
-1,200 -1,000 -800 -600 -400 -200 0 200
Million $
Source: Statistics New Zealand
Construction sector activity lifted strongly in Q3 2020 after falling to its lowest level in 10 years in Q2 2020.
Construction sector GDP rose by 54% in Q3 from the previous quarter and is now higher than it was the same
period a year earlier.
Chart 8 shows that all three sub-sectors – horizontal construction, vertical construction and residential
construction – experienced marked declines during the Q2 2020 but rebounded in Q3 2020. Vertical construction
– a sub-sector predominantly driven by private investment – experienced the greatest decline in activity, falling
by 29% over Q2 2020 relative to Q2 2019.
5 Stannard, Steven, McDonald (May 2020), Economic impacts of COVID-19 containment measures, Reserve Bank of New Zealand.
21COVID-19 disrupted the Sector
Chart 8 Gross Domestic Product (E), percentage change in Q2 2020 and Q3 2020, relative to the quarter in the
previous year
10% 7%
5%
5%
0%
-5%
-10% -7%
-15%
-20% -16%
-25%
-30% -25%
-29%
-35%
Residential construction Vertical construction Horizontal construction
Q2 2020 Q3 2020
Source: Deloitte, Statistics New Zealand
However, vertical construction still shows negative growth in Q3 2020, relative to the quarter in the previous
year and this recovery likely masks the true impact of COVID-19 to the sector. We could see construction activity
soften in Q4 2020 and Q1 2021 post removal of the wage subsidy and other government support packages and
pre-committed COVID-19 projects phase out. The construction sector took years to recover following the
previous economic recession. Chart 9 shows this sector took five years to rebound from the GFC (Q1 2008 to Q1
2013). The GFC had a significant impact on the finance company sector – a sector that was largely focused on
funding property development directly linked to construction activity.
Chart 9 Construction activity, seasonally adjusted, quarter-on-quarter change, Q1 2000 to Q3 2020
5,000
4,500
GDP, $ Millions
4,000
3,500
3,000
2,500
2,000
1,500
Source: Deloitte, Statistics New Zealand
COVID-19 however raises a number of new complexities, including border closures within and between
countries, a dual supply and demand shock, risks around the interconnected global supply chain, and interest
rates close to zero. It is possible the Sector will see a faster bounce back relative to the GFC as the downturn in
this crisis was caused by restrictions, rather than underlying demand or supply problems before the crisis hit. We
note that in this crisis, the Reserve Bank has limited residual ammunition, with interest rates being close to zero,
so fiscal policy support is important to further support the Sector during recovery.
22COVID-19 disrupted the Sector
Input indicators fell materially in the wake of COVID-19, but data shows a rebound since Q3 2020. For example,
prior to COVID-19, it was estimated that the steel sector had 36% spare capacity, this increased to 47% during
the June quarter, improved to 40% in the September quarter and is expected to be at 35% in 2021 – back at pre-
COVID-19 levels.6 Ready-mix concrete volumes dropped 9.5%, having been increasing at an annual average rate
of 4.7% between 2015 and 2019. Volumes in ready-mix concrete showed a strong rebound in Q3 2020, indicating
that most of the Sector is back in operation.
Chart 10 Ready-mix concrete volumes, seasonally adjusted Q1 2000 to Q3 2020 (m3, thousands)
1150
1050
950
850
750
650
550
2000 2001 2002 2003 2004 2005 2006 2007 2008 2009 2010 2011 2012 2013 2014 2015 2016 2017 2018 2019 2020
Source: Statistics New Zealand
In the C-19 Recovery Survey, firms were asked if they had experienced an impact on their cost of materials. Some
firms reported that they had received invoices for higher amounts for certain items, which were attributable to
supply chain constraints. Firms also noted they had seen an increase in cost for imported products due to a
weaker New Zealand dollar. Overall, 83% of firms expect the cost of materials to increase in line with inflation or
above.
• Employment. The impact of COVID-19 on the Sector is reflected in the significant uptake of the wage
subsidy, hours worked and underutilisation.
• Wage subsidy support. In all, 203,000 construction jobs were supported by the initial wage subsidy –
the highest number of jobs for any sector. The wage subsidy extension saw 56,000 construction jobs
supported, the second highest for any sector. This high reliance on government support raises a
potential question of the Sector’s stability now that the wage subsidy has ended.
Firms which responded to our C-19 Recovery Survey reiterated the importance of the wage subsidy in
helping them to keep employees. This reliance on the subsidy was validated by interviews with peak
bodies, which cited the wage subsidy as crucial for survival until stimulus projects were ready to get
underway. According to the C-19 Recovery Survey sample, 49% applied for the wage subsidy and, of
those, 83% said it saved jobs within their firm. 70% said it was easy or very easy to access, and 72%
either agreed or strongly agreed that it was provided in a timely manner. Across the vertical and
horizontal sectors, 60% of those in the vertical sector applied, compared to 42% in the horizontal
sector.
6 Steel Construction Limited (2020), Structural Steel Industry Updates in February, June, September, December 2020.
23COVID-19 disrupted the Sector
Chart 11 Number of unique jobs on the wage subsidy by sector (thousands)
Construction
Accomodation and food services
Professional, scientific and technical services
Wholesale trade
Other services
Agriculture, forestry and fishing
Rental, hiring and real estate services
Financial and insurance services
Public administration and safety
Mining
0 50 100 150 200
Thousands, unique jobs
Wage subsidy Wage subsidy extension
Source: Ministry of Social Development
• Hours worked. The impact of COVID-19 is also observed in the significant drop in the hours worked in
the construction sector. The change from Q1 2020 to Q2 2020 was:
o Vertical construction: -14.6%
o Horizontal construction: -12.6%
o Construction services: -10.3%
• Underutilisation. The underutilisation rate is a broader measure of untapped capacity in the labour
market. The underutilisation rate, as at September 2020, has increased across all sub-sectors in the
Sector. Higher underutilisation suggests there is more spare capacity in the Sector than overall
employment figures suggest.
Chart 12 Underutilisation rate across sub-sectors (September 2018 to September 2020)
14%
12%
10%
8%
6%
4%
2%
0%
Total construction Vertical construction Hortizontal construction Construction Services National rate
2018 2019 2020
Source: Deloitte, Statistics New Zealand
Despite the significant impact of COVID-19 on hours worked and underutilisation, employment in the
construction sector has increased since the start of March 2020. However, employment weakness is expected in
the coming months as the wage subsidy rolls off and uncertainty endures.
24COVID-19 disrupted the Sector
Chart 13 Employment by selected sector (changes between Q1 2020 and Q2 2020)
Other services
Trade
Transport, accomodation and food services
Manufacturing
Forestry and mining
Utilities and government
Construction
-15,000 -10,000 -5,000 0 5,000 10,000 15,000
Employees
Source: Deloitte, Statistics New Zealand. Note: sectors not presented are public administration and social assistance; arts recreation services; other services;
electrical, gas, water and waste services; retail trade; not elsewhere classified; mining; financial and insurance services; wholesale trade; financial and
insurance services; agriculture, forestry and fishing.
Productivity is a well-known challenge for the construction sector. Productivity, at a low level relative to other
sectors pre-COVID, was negatively impacted during COVID-19 lockdowns as a result of new health and safety
requirements. With most construction deemed not to be an essential service during Alert Level Four, only 19% of
the Sector was able to operate relative to pre COVID-19 levels. Over the June 2020 quarter, productivity dropped
within a range from 5% to 20% according to the majority (70%) of respondents to the C-19 Recovery Survey.
When we measure productivity as the output per hour worked, productivity growth remains well below its
post-GFC peak, decreasing to its lowest level in 10 years in Q2 2020. Chart 14 shows the estimated output per
hour worked between 2010 and 2020.
Chart 14 Annual percentage change in productivity Q1 2000 to Q2 2020 (measured as output per hour worked)
20%
15%
10%
5%
0%
-5%
-10%
-15%
-20%
2010 2011 2012 2013 2014 2015 2016 2017 2018 2019 2020
Source: Deloitte, Statistics New Zealand
Productivity in this sector tends to be cyclical, picking up when business conditions are strong and easing again
when conditions weaken. As the country moves into the recovery phase it is expected to lead to efficiency gains
as some unproductive firms go into liquidation and employees are redeployed to more productive firms or other
parts of the economy.
25COVID-19 disrupted the Sector
Firm level impacts
Businesses faced disruptions to their supply chains earlier this year. Just over half of respondents in the C-19
Recovery Survey acknowledged COVID-19 caused supply chain disruptions in Q2 and Q3 2020. Firms across the
horizontal and vertical sectors were similarly impacted by supply issues. The key reasons for supply chain
disruptions were:
• Difficulties with the importing and movement of building materials
• Lack of available skilled resources
• Lack of certainty over timing and readiness of projects
Chart 15 Key reasons for supply chain issues (% of total responses)
Importing and/ or movement of building materials
Availability of skilled resources
Lack of certainty over timing and readiness of projects
Issues with Government not being able to make decisions to start
and/or continue projects
General issues with delays on construction sites
Communication, accessibility and responsiveness of contractors and
consultants
Other
0% 10% 20%
Source: C-19 Recovery Survey
Most stakeholders interviewed indicated disruptions in the movement of building materials have eased; however,
access to resources and materials and timing of projects remain a concern. As we moved closer to the peak
Christmas season, there was congestion around ports. In December, Ports of Auckland operated at only a third of its
crane capacity and some shipping lines are choosing to bypass New Zealand or cancel dedicated trans-Tasman
services.7 Congestion at the ports will worsen and not ease until the second quarter of 2021, according to Maersk.
Firms faced a negative impact on revenues in Q2 and Q3, irrespective of size. Of those surveyed in our C-19
Recovery Survey, 73% expect turnover to decrease by 5% or more in Q2 and Q3 2020, and 44% of these were
businesses with turnover of more than $100m. While 27% of the survey respondents expected no change in
turnover relative to pre-COVID-19 levels. Presented in Chart 16, 36% of vertical firms expected turnover to be
impacted by 10-20%+, compared to 16% of horizontal firms.
7 Business Desk (10 November 2020) Port bottlenecks stoke Christmas stocking concern
26COVID-19 disrupted the Sector
Chart 16 Proportion of respondents who selected answers to “What is the expected impact on turnover in Q3
2020 for your New Zealand operations?”, by type of firm.
35%
30%
% of respondants
25%
20%
15%
10%
5%
0%
None 5% less 6% to 10% less 10% to 20% less >20% less
Horizontal-related infrastructure Vertical-related infrastructure
Source: C-19 Recovery Survey
A similar impact was observed in the survey conducted by Civil Contractors New Zealand (CCNZ). Of the 188
respondents, 47% expect turnover to shrink over the next 12 months i.e. between June 2020 and April 2021.
Conversely, 23% of respondents expect turnover to grow. Civil contractors operating in the vertical
construction sector appear to have been impacted to the greatest extent. Ongoing uncertainty is likely to
weigh on investor sentiment and potentially delay some large projects. Vertical construction represented 14% of
projects in 2020, down from 22% in 2019.8
Firms based in Auckland felt the negative effects of the August community outbreak as Alert Level Three was
enforced throughout the region. Illustrative of this, the C-19 Recovery Survey showed 44% of Auckland firms’
turnover fell by 10% or more as a result of the August outbreak.
Liquidations in the construction sector have been considerably lower compared to the same period in 2019.
In the June 2019 year, there were 152 liquidations and five insolvencies in the construction sector. This compares
to 103 liquidations and three insolvencies in the Sector in the year to June 2020. Liquidations and receiverships
decreased across vertical, horizontal and residential construction sub-sectors.
With the end of the wage subsidy and other government stimulus, it is possible that there could be a catch-up in
insolvencies in the year to June 2021. This is due to a potential backlog of firms and sole traders that would have
ceased trading had the wage subsidy not been in place. To illustrate this point, Chart 17 presents the number of
construction company deaths, using expected insolvencies to forecast the potential impact in 2021. Although
this estimate of liquidations is potentially conservative, it does reflect a view that an exponential increase in
liquidations is unlikely given the swift recovery of the Sector and the government’s willingness to provide further
support if there are further waves of lockdowns in the future.
8 Civil Contractors New Zealand (June 2020), Construction Industry Survey 2020
27You can also read