5 REPUBLIC OF INDONESIA 5.1 PESTLE OR MACRO ANALYSIS - DIBICOO
←
→
Page content transcription
If your browser does not render page correctly, please read the page content below
D3.3 - Republic of Indonesia

5 Republic of Indonesia

5.1     PESTLE or Macro Analysis
Introduction
In Indonesia, there is a total of 1,779 palm oil companies (Statistics Indonesia, 2017, p. ix) that
deals with either planting or processing. 608 of those are designated Palm Oil Mills (POMs);
38 of which are equipped with methane-capture facilities (Winrock International, 2015b), and
the remaining 569 are still operating a series of open lagoon. 10 of these POMs have Palm Oil
Mill Effluent (POME)-to-electricity projects (Moriarty et. al., 2013, p. xiii) and only one is con-
nected to the national power grid (MCA-Indonesia, 2014, p.2).
POME-based biogas industry faces political, economic, social, technological, and environmen-
tal challenges. The related issues are broad, cross-sectoral, and involving a wide array of ac-
tors. Given the particularities of Indonesian renewable policies and strategies, identifying
stakeholders is required to correctly mitigate risks (Yudha & Tjahjono, 2019).

5.1.1     Political aspects
      1. National targets and strategies
The development of biogas technology in Indonesia is inextricably tied to the nation’s aspira-
tions towards energy security. The revised National Energy Policy (Kebijakan Energi Nasional
– “KEN”), signed through Government Regulation 79/2014, is a policy revolving energy mix
diversification, independence, and a push towards renewable energy (RE) sources including
biogas.
Another policy also exists as renewable energy target in Indonesia. The General Electric Gen-
eration Plan (Rencana Umum Pembangkitan Tenaga Listrik/RUPTL), promulgated in 2019, is
essentially a business plan of the State Electricity Company (Perusahaan Listrik Negara/PLN).
However, since they are the sole distributor of power in Indonesia, this plan can also serve as
indicator of governmental interest in the sector in a moderate-to-long term. RUPTL also indi-
cates the extent of guaranteed support PLN will give to RE development, as it shows their
allotted budget and capacity to RE generation as shown in Figure 24.

             Figure 24: Energy generation target from 2017-2025, as written in the latest RUPTL (2019).

       This project has received funding from the European Union´s Horizon 2020 research and innovation programme under grant         100
       agreement N° 857804. The sole responsibility for the content of this document lies with the authors. It does not necessarily
       reflect the opinion of the EU.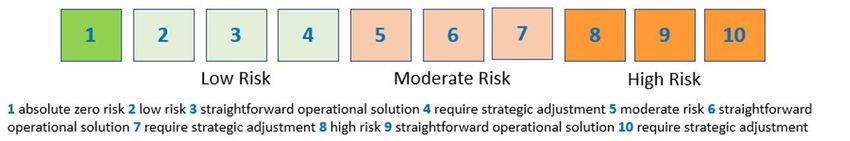
D3.3 - Republic of Indonesia

   2. Fossil Fuel Dominance
Indonesia’s purported enthusiasm for the broader promotion of renewables in its recent energy
policies falls flat through its lack of a clear strategy and implementation. The Indonesian gov-
ernment continues to contradict its clean energy goals with heavy investments towards new
coal-fired power plants development. The attraction to coal usage within Indonesia lies in its
reliability, low price, as well as its central role in the country’s revenue stream to counterbal-
ance oil and gas deficits (Arinaldo and Adiatma, 2019). Fossil fuels have historically been, and
continue to be, a major player in Indonesia’s energy sector.
   3. Lack of Prioritization on Biogas and POME
Within the renewable sector, the Indonesian government has largely prioritized biofuel over
biogas in its broader bioenergy strategy. Although Indonesia has achieved its 2018 bioenergy
investment targets, this has little implication for the biogas industry and for POME-based bio-
gas, as a significant portion of this figure is for biodiesel development (DITJEN EBTKE, 2019:
p. 38). The long-term trends for general bioenergy are also concerning. Despite ramping up
investments in general renewables, the 2018 bioenergy investment target is a drastic drop
from 2017’s $0.749 to $0.073 (in billion USD) (DITJEN EBTKE, 2019). Based on previous
bioenergy trends, it would be safe to assume this would manifest as a decreased focus in
biogas in lieu of biofuel development.
In terms of energy production and supply capacity, biogas makes up an alarmingly small
amount of the potential domestic energy supply source (DITJEN EBTKE, 2019, p.39). Of this
small figure, there have been further difficulties in increasing biogas energy supplies, as indi-
cated by the DITJEN EBTKE 2018 Performance Report. There are also concerns regarding a
sudden absence of POME-based biogas information, compared to previous reports between
2013-2017. This is concerning for two reasons. First, it reflects a larger trend of irregularity in
government data and reports. It also signals a false shift of interest – private actors who read
these reports will likely assume POME usage is no longer relevant for national government
policies, incentivizing transition to cheaper non-biogas bioenergy. Proper planning and execu-
tion of risk management is important to RE development, since the sector is still relatively
young. Financiers are wary of the monetary risks, Engineering-Procurement-Construction
firms (EPCs) are still dependent on policy stability, and benefits for site owners are largely
passive.
   4. Governance
The project risks arising from the intersection of political, economic, institutional, and social
characteristics should be taken into account when considering new biogas projects. Research
by Aipassa, Kristiningrum and Tarukan (2018) on the potential of POME-to-energy programs
in East Kalimantan demonstrates the need for intricate, multi-stakeholder cooperation in miti-
gating risks for new projects.
These projects span multiple levels of government, ranging from regency, provincial govern-
ment, and district governments. This complex decentralization is further complicated by the
additional need to coordinate with the private sector, such as the palm oil mills supplying feed-
stock, as well as other financing bodies supporting the program. The lack of administrative
body for biogas development in Indonesia poses an issue for both Indonesia’s aspirations to-
wards energy security and disparity reduction. The Indonesian government lacks proactive-
ness in establishing, implementing, or promoting biogas projects in a tangible form. The current

     This project has received funding from the European Union´s Horizon 2020 research and innovation programme under grant         101
     agreement N° 857804. The sole responsibility for the content of this document lies with the authors. It does not necessarily
     reflect the opinion of the EU.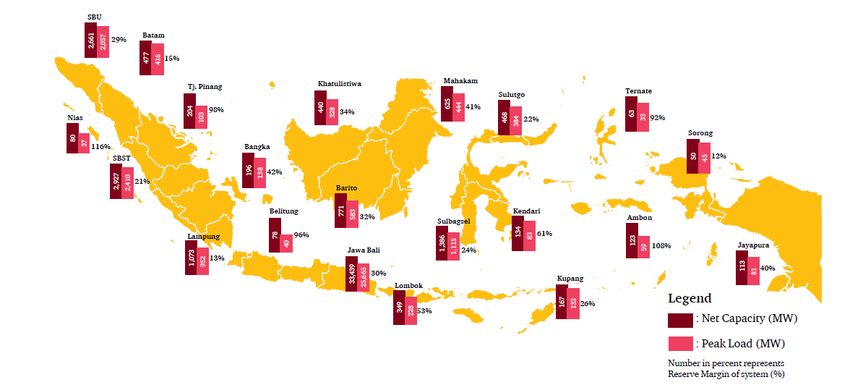
D3.3 - Republic of Indonesia

form of leadership provided by the government is hindered by overlapping priorities and juris-
dictions, which slows the decision-making process.
Large-scale palm oil plantations have been incentivized to introduce POME-to-energy projects
out of corporate social responsibility, ethical or public relations purposes instead of through
government initiation (Winrock International 2015; Budiman 2019). However, this is not feasi-
ble for smallholder plantations, who may be more restricted in terms of capital and are deterred
by higher risk factors and could benefit more from stricter biogas governance. Problems of
governance are inextricably tied to previous issues of coal dominance and lack of focus on
biogas, further made complicated by the lack of regulatory and administrative support by those
who have the most influence (IISD 2018). Government decentralization also seeps into the
problem of regulatory uncertainty, where the private sector is demoralized due to a lack of
transparency on government support (Taylor et al, 2019).

5.1.2   Economic Aspects
   1. Feed-in Tariffs
Feed-in tariffs (FITs) is the major policy support scheme for biogas development in Indonesia.
They guarantee a fixed purchase price of renewable generation from power producers and
aims to cover the costs of RE development, while providing reasonable rates of return to in-
vestors and reduce investor risks from RE projects financing (Bohringer et al 2012). The ap-
plication of the feed-in-tariff scheme is commonplace for governments seeking to implement
RE. In Southeast Asia alone, a majority of the developing countries already have applied FITs,
as seen in Table 28. Indonesia is a bit late in joining in, only having FITs implemented after the
creation of the General Energy Plan (RUEN) in 2017. The rates in which FITs are implemented
in Indonesia are also biased towards the government’s rates for fossil electricity generation –
unlike other countries who provide greater FITs to encourage RE transition. To some extent
this is also evident in Vietnam, but their recent achievements in RE generation prove that lower
FITs do not always translate to underdevelopment.

     This project has received funding from the European Union´s Horizon 2020 research and innovation programme under grant         102
     agreement N° 857804. The sole responsibility for the content of this document lies with the authors. It does not necessarily
     reflect the opinion of the EU.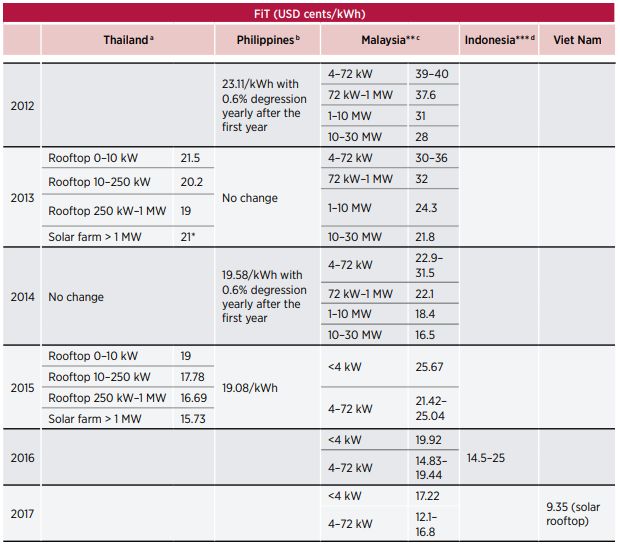
D3.3 - Republic of Indonesia

            Table 28: (Solar) FIT implementation in major South East Asian countries (IRENA, 2018).82

There are two key actors associated with the current FIT program. The Indonesian govern-
ment, through the state-owned enterprise State Electricity Company (PLN), is the major player
in determining investments by independent power producers (IPPs). PLN regulates all current
tariff regimes. Each tariff is benchmarked against PLN’s average electricity generation. If local
Levelized Cost of Energy (LCOE) is higher than national rates, PLN will only pay a certain
percentage of it (never 100% FIT). If local LCOE is lower than national rates, the developer
has rights to negotiate with PLN (>100% FIT is possible but very unlikely). This showcases a
preferential treatment to existing generation systems.
Tariffs and pricing are sensitive issues within the Indonesian renewables and biogas regulatory
framework. Although it purports greater flexibility and higher incentives for the development of
Indonesia’s outer provinces, the governmental level regulation (No 50/2017) has been heavily
criticized for its non-investor friendly design and selective prioritisation of governmental pro-

82 Full document can be accessed in: https://www.irena.org/-/media/Files/IRENA/Agency/Publica-
tion/2018/Jan/IRENA_Market_Southeast_Asia_2018.pdf

     This project has received funding from the European Union´s Horizon 2020 research and innovation programme under grant         103
     agreement N° 857804. The sole responsibility for the content of this document lies with the authors. It does not necessarily
     reflect the opinion of the EU.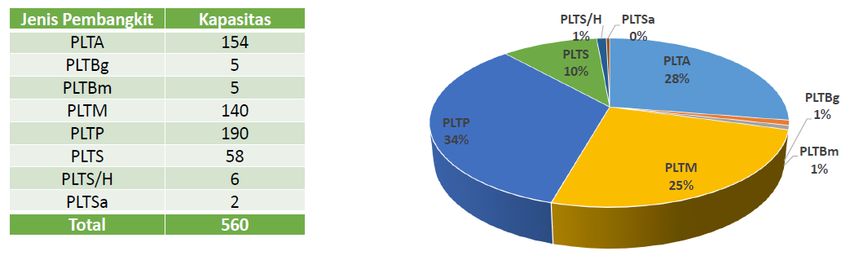
D3.3 - Republic of Indonesia
jects. Through this regulation, PLN has power over tariff negotiations through their direct se-
lection mechanism, providing an incentive to sign PPAs suitable with PLN’s mandates, while
excluding those that have failed to do so.
Once selected, IPP projects are obligated to complete construction of the power plants in ac-
cordance with the PPA, where sanctions and penalties are imposed on those that fail to finish
projects (PWC 2018a). Investors have criticized these low power purchase prices, claiming
high risk implications and a “roadblock” that keeps developers from recovering investment and
generating reasonable profit from projects (IISD, 2018).
2. Investment Types
Investments for biogas development can be sourced from both public and private sector. Public
funding are commonly grants derived from the national budget. Private funding is provided
from a wide range of non-government; we will mainly focus on commercial bank loans.
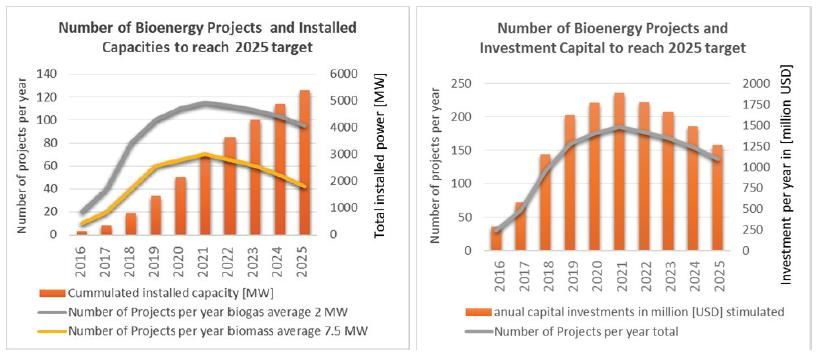
That aside, a lot of investment is needed to achieve the government’s target of 5.5 GW renew-
able energy by 2025 (stipulated in RUEN, promulgated in 2017), as shown in Figure 25.83
Around 13.5 Billion USD to be exact – and this is 2017 rates. That capital is to be distributed
across 1.300 projects with a 2MW to 7.5MW generation scale.
Figure 25: Estimation of investments required to achieve 2025 targets.
In addition to the Indonesia’s FIT mechanism, biogas development is also, to a smaller extent,
supported by other government-mandated mechanisms and incentives. This support scheme
varies from a national, regional, and local level. However, implementation and execution are
concentrated in the regional and local levels. These come in the form of disparity reduction
programs (national targets on achieving 100% electrification to reduce energy supply disparity)
and are supported by direct government subsidies. Non-governmental organisations, however,
have panned the fully subsidized approach to biogas development by the Indonesian govern-
ment as it contradicts the market-based sector development approach utilized by various in-
ternational donor agencies (Greenpeace, 2019; IESR, 2018)
A. Commercial Banks
83The General Plan of National Energy can be accessed in: https://www.esdm.go.id/assets/media/content/con-
tent-rencana-umum-energi-nasional-ruen.pdf. (In Bahasa).
This project has received funding from the European Union´s Horizon 2020 research and innovation programme under grant 104
agreement N° 857804. The sole responsibility for the content of this document lies with the authors. It does not necessarily
reflect the opinion of the EU.D3.3 - Republic of Indonesia
The significance of banks within the Indonesian financial system should not be understated.
Although Indonesia’s financial market is small, with its financial sector assets representing 72%
of the country’s GDP, banks hold approximately three quarters of all financial sector assets
(IMF 2017; ADB 2018). However, the financial sector’s lack of experience with renewable en-
ergy led to risk averseness that impacts financing costs, capital availability and project viability
(CPI 2018). There is also the issue of equity and debt balance. Biogas projects are costly in
the earlier stages. Neither project owners nor EPCs are able (or willing) to set aside a large
amount of asset as equity, but investors cannot be expected to just cover it all with debt.
Table 29: Commercial finances that are available in Indonesia. 2nd and 3rd are most common (GIZ LCORE-INDO
and MEMR, 2017).
The novelty of biogas, let alone POME-to-energy project, further complicates financing
schemes as lenders lack information from past projects, affecting their confidence in assessing
future ones, leading to a conservative stance. This unfamiliarity with RE has resulted in the
rarity of project finance implementation by local banks (CPI, 2018). Biogas programs ended
up having to deal with equity or corporate financing (essentially 2nd option in Table 29 above).
As briefly summarised in Table 29, infrastructure funding done via corporate structure does
not have favorable terms and rates for renewable energy development. It is created to finance
well-established infrastructures (like roads) which already have a set development pattern and
minimal, spread risks. RE development, in contrary, needs a lot of support even in earlier
stages and significantly larger capital upfront. The latter is currently unsolvable, since the cen-
tral financial authority has yet to legalize loan structures that allow large upfront investments.
Blending financial sources is essentially required.
As an alternative, biogas programs have relied on international philanthropic donor-funded
programs (Winrock International, 2015; IESR, 2019; APEC, 2017). This alternative is not with-
out caveats. Donor program funding period are often limited to the length specified in a pro-
posal, rendering post-project operations unpaid for. Combined for the philanthropic nature of
donors, business viability is rarely in the equation in such funding schemes.
5.1.3 Technological Aspects
Anaerobic digesters (AD) are now being used as primary treatment for POME at Indonesia
Palm Oil Mills (POMs) because aeration processes don´t need to be accommodated here,
hence reducing cost and technical complexity effectively. Biogas from anaerobic processes,
irrespective of the involved technology, can be utilized for other purposes such as producing
This project has received funding from the European Union´s Horizon 2020 research and innovation programme under grant 105
agreement N° 857804. The sole responsibility for the content of this document lies with the authors. It does not necessarily
reflect the opinion of the EU.D3.3 - Republic of Indonesia
electricity. This process will also produce sludge that can be reprocessed as fertilizer for agri-
cultural applications (Abdurahman, et. al., 2013).
A. Covered Lagoon
Covered Lagoon is mostly used by Palm Oil Mill to treat POME in Indonesia (Eastern Research
Group, Inc. and Winrock International, 2015). Covered lagoon is an improved version from the
open lagoon method, covering a waste reservoir with floating plastic membranes. The opera-
tional simplicity and low investment cost of covered lagoons support and enable more instal-
lations of the covered lagoon compared to other AD technologies in POME treatment in Indo-
nesia (Rajani A., et. al., 2019). However, the covered lagoon infrastructure requires large phys-
ical space and will still leave a sizable carbon footprint.
B. Continuous Stirred Tank Reactor (CSTR)
According to Eastern Research Group, Inc. and Winrock International (2015), there are only
three POMs using the tank system to treat POME in Indonesia. A continuous stirred tank re-
actor (CSTR) is similar to a cylindrical closed tank reactor but it uses an agitator to increase
contact between biomass and waste. Due to the agitation, CSTR can produce more biogas
than closed tank. This reactor should be operated at steady state with continuous feed flow.
There are several assumptions used in CSTR such as uniform composition throughout the
reactor and uniform composition between exit stream and in the reactor.
5.1.4 Environmental Aspects
The Government of Indonesia has implemented the Program for Pollution Control, Evaluation,
and Rating (PROPER) to promote “clean technology” back in 1995. PROPER is a national-
level public environmental initiative created under the umbrella of the Environmental Impact
Control Council (Badan Pengendalian Dampak Lingkungan - BAPEDAL). PROPER was cre-
ated due to the BAPEDAL’s limited capacity to monitor the pollution caused by business ex-
pansions in the agricultural sector.
This mechanism helps enforce the industry to adopt “clean technology” practices by rating
each company’s performance based on the regulatory standard. The rating of PROPER
ranges from gold as the highest category to black as the lowest. Actual implementation, how-
ever, is rather lacking at this stage.
Sanctions exist for those who violate regulations related to PROPER; varying from administra-
tive sanctions (written reprimand, revocation of operational permit, etc.) to punishment in jail
as short as a year up to 15 years, as covered in Indonesian Law (UU) Perlindungan dan
Pengelolaan Lingkungan Hidup, 2009. Perpetrators would also be fined 500 million IDR up to
15 billion IDR, depending on the severity of the case.
5.2 Market Characterization and Definition
Biogas project development in Indonesia will is best focused on turning palm oil effluent
(POME) into electricity. This is the case due to several reasons: the palm industry is the only
sector with the ability to produce constant feedstock, with regional localization that ease logis-
tics, and with a clear track record of waste-to-energy practices. All these factors contribute to
a decent potential for the palm oil sector to become a dependable power supplier.
This project has received funding from the European Union´s Horizon 2020 research and innovation programme under grant 106
agreement N° 857804. The sole responsibility for the content of this document lies with the authors. It does not necessarily
reflect the opinion of the EU.D3.3 - Republic of Indonesia
Commercial power purchase in Indonesia is only done at the national level, as mandated by
law. Therefore, market assessment in this report will be conducted on the nationwide ‘electric-
ity market’.
5.2.1 Electricity Market Form
The Indonesian electricity market, like many developing nations, is state-controlled. The state-
owned utility solely controls the national power distribution and is enabled by several laws to
also control the generation side through the Build, Own, Operate, Transfer (BOOT) scheme.
The State Electricity Company (PLN) operations are divided into regional branches – each with
their own territorial reach but still compliant to the Central PLN. Non-governmental entities can
also enter the power generation business, but on-grid supply will ultimately be done through
the PLN infrastructure.
This topology divides the larger Indonesian market into multiple regional segments. The Java-
Bali region of PLN is the largest power producer and consumer across the national grid, region
also highly concentrated with power stations (several reaching Gigawatt-level capacity) and
industrial facilities (especially in East Java).
The existence of PLN creates a balance between power producers and the general power
consumers by supporting national-level management. However, this condition has resulted to
difficult non-governmental development of renewable energy, especially in the upstream mar-
ket. PLN, a state-owned enterprise benefits from governmental leverage through national reg-
ulations and bureaucratic structure enables and supports PLN operations (subsidies, project
development process, electricity sale rates, etc.).
Indonesia’s industrial scale of biogas generation market is very concentrated and developed
due to stable supply of feedstock. For POME-based biogas, this means close proximity of
biogas installation locations to palm plantations. By far, POME-based biogas installations are
very prevalent in Sumatera and Kalimantan well-known regional hubs of Palm Oil Cultivation
and Processing. Essentially, every province in these islands hosts large-scale biogas facilities.
However, it is also important to note that majority of these facilities operate solely to support
internal primary needs without having to sell excess power to PLN’s national grid. Biogas tech-
nology owners end up using the electricity to fill gaps in their power deficit.
The financial and administrative labour intensive process deters biogas owners in exploring
opportunities to sell excess power to PLN’s national grid. In addition, Indonesian Palm Oil As-
sociation claims that palm mills only use 0.5 to 0.7 MW from biogas and therefore there is
really no incentive to invest in biogas tech larger than 1MW. At least, until PLN decides to
adjust the requirement for power purchase agreements.
5.2.2 Electricity Market Size
PLN is guided by governmental policy targets in planning the infrastructural and capacity de-
velopment/expansions. This approach is useful in maintaining market equilibrium, maintaining
energy demand forecasts and preventing excessive energy supply—this can be seen in how
Indonesia’s energy reserve is higher than average load, but not to the point of development
being wasteful.
As we can see in the illustration in Figure 26, net capacity is consistently higher than peak load
across all the regions shown below:
This project has received funding from the European Union´s Horizon 2020 research and innovation programme under grant 107
agreement N° 857804. The sole responsibility for the content of this document lies with the authors. It does not necessarily
reflect the opinion of the EU.D3.3 - Republic of Indonesia
Figure 26: Governmental Targets for Electricity Expansion (Pricewaterhouse Cooper, 2018)
All regions within Indonesia have no shortage of power—if calculated by demand. Although
not every regional demand is representative of its populace. If we attempt to compare regions
purely on the basis of demand and observe the 25 GW demand of Java-Bali, other regions
become relatively insignificant in terms of energy demand. In reality, many regions outside
Java-Bali still need additional power. Unfortunately, the national grid (and by extension, PLN
operations) cannot reach regions. Therefore, the lack of access to the national grid has birth
off-grid power producers’ market.
Biogas is rarely considered as a feasible power source in Indonesia and no demand can be
directly traced to it. This negatively affects the size of biogas as a ‘commodity’. The Ministry of
Energy can only trace household usage of biogas, which is around 167 Barrels of Oil Equiva-
lent (BOE) in the entirety of 2018 (MEMR, 2017). This is somewhat inconsistent with the PLN
2018 General Electricity Plan that listed around 39.4 MW worth of active biogas plants across
Sumatra and Kalimantan excluding t biogas plants that are currently under construction.
In a more detailed rendition of the General Electricity Supply Plan (RUEN), PLN declared that
Indonesia has an overall biogas potential of 94.2 MW (out of the total renewable energy goal
of 2.1GW). This data was quite unclear, as the 2.1 GW goal was written as a ‘national’ projec-
tion which includes both industrial and household implementation. Therefore, this amount
might not be representative for the actual growth.
We assume this means biogas demand is very exclusive, i.e. only considered by stakeholders
that are related to the feedstock. Even then, the way Indonesian government perceives bioen-
ergy favors biomass and biofuel implementation more than biogas.
Biogas is barely utilized for electricity generation in Indonesia. The government prefers other
renewable sources such as hydro and geothermal. Biogas utilization ended up being focused
to gaseous forms of energy, such as combustible for households or methane upgrading for
industries. Even for bioenergy in general, POME and biogas usage as a source is rarely con-
sidered as the government prefers using solid palm hulls or straight up Municipal Solid Waste
(MSW) via Biomass processes. Recent policy even shifts palm waste usage (both POME and
the solid hulls) to Biofuel synthesizing for the national B30 initiative—a policy that intends to
gradually replace conventional diesel fuel to biodiesel, with the national oil & gas company
This project has received funding from the European Union´s Horizon 2020 research and innovation programme under grant 108
agreement N° 857804. The sole responsibility for the content of this document lies with the authors. It does not necessarily
reflect the opinion of the EU.D3.3 - Republic of Indonesia
(Pertamina) serving as guaranteed buyer. Such measures further reduce the benefits of at-
tempting a Biogas development project.
The private sector, especially owners of palm plantations, perceive the value of Biogas tech-
nology differently. Most of them utilize Anaerobic Digestion technology to provide electricity for
internal use. By doing this, they can save operational costs while improving waste manage-
ment (which further grants them certain environmental certifications) practice at the same time.
5.2.3 Electricity Market Growth
Stabilisation of demand can already be felt in several regions, especially those with higher
count of electrification/had access to power early on. Java-Bali, Sumatera, and Kalimantan
demands are stabilising. PLN acknowledged that the largest sum of electricity demand comes
from annual household connections (PLN, 2018). Demand growth gets slower every year since
electrification is indeed getting better, despite questions around ‘99% electrification rate’ de-
clared by the government.
Note that the Indonesian market is just stabilizing, i.e. it will no longer benefit from the large
influx of new customers. Both PLN and private sectors believe that the uptrend will persist due
to the developing nature of domestic economy. Energy demand increases with the growing
industrial and financial sector.
If we follow PLN’s methodology and take 2018’s national economic growth rate and assume
the same condition will persist for the following years, we can see (see Figure 27) that power
demand will still rise despite the aforementioned stagnating household demand. Existing ca-
pacity will not be able to accommodate the growth rate.
Figure 27: Electricity Demand (2018-2027) (Pricewaterhouse Cooper, 2018)
Demand will only surpass current generation capacity at around 2021-2022. Table 30 shows
the development targets of the generation capacity of power plants.
This project has received funding from the European Union´s Horizon 2020 research and innovation programme under grant 109
agreement N° 857804. The sole responsibility for the content of this document lies with the authors. It does not necessarily
reflect the opinion of the EU.D3.3 - Republic of Indonesia
Table 30: Generation Capacity of Power Plants (PLT) (PLN, 2018)
We can see that PLN is considering these estimates and is planning a massive expansion in
2021, to secure a total of 1,607MW additional supply in preparation of the projected demand
increase. In addition, it must be highlighted that biogas is not explicitly mentioned in the table
– but the biofuel target may serve as an entry point.
5.2.4 Electricity Market Share
In 2018, electricity became quite a large energy use in Indonesia. Indonesia consumed 156.95
Million BOE of its energy supply as electricity (industry, commerce, and household combined),
making up 18.07% of the total energy consumption (National Energy Council of Indonesia,
2018).84 This number is only surpassed by fuel use, which made up 38.79%.
The commonly discussed renewable energy target is 23%. The current administration hopes
for renewable energy to contribute that amount to the national energy mix by 2025 – which
would be around 560MW. This represents renewable energy’s expected share in a larger en-
ergy market. Which is unrealistic when we consider the very minimal amount of renewable
energy contribution was 4-5% in 2017. In the document (RUPTL 2018-2027)85 itself biogas is
only expected to contribute 5MW energy output (MEMR, 2018). That can also be understood
as less than 1% of total renewable energy generation by 2025, likely because the government
only expected heat energy out of Biogas.
84 Full report by the National Energy Council of Indonesia: “2018 Energy Outlook for Indonesia” can be accessed
in: https://www.esdm.go.id/assets/media/content/content-outlook-energi-indonesia-2018-bahasa-indonesia.pdf (In
Bahasa)
85 The full RUPTL document can be accessed in: https://web.pln.co.id/statics/uploads/2018/04/RUPTL-PLN-2018-
2027.pdf (in Bahasa)
This project has received funding from the European Union´s Horizon 2020 research and innovation programme under grant 110
agreement N° 857804. The sole responsibility for the content of this document lies with the authors. It does not necessarily
reflect the opinion of the EU.D3.3 - Republic of Indonesia
Figure 28: Detailed breakdown of Indonesia’s 2025 renewable targets. (PLN, 2018).
National supply wise, the majority of electricity is generated by PLN (~74%) while the rest is
generated by IPPs (~22%) and off-grid producers.
The BOOT scheme might contribute further to increasing PLN’s numbers. IPP developers in
contract with PLN were once obliged to hand over all assets after around 10 years of opera-
tions. IPP numbers were essentially transitional. This is changed in the latest iteration of the
energy law (Energy and Mineral Resources Ministerial Law 4/2020 Article 27B), where IPPs
are no longer required to hand over all infrastructure assets. But changes were so recent that
no projects are made under these favorable terms yet.
Currently, the government is mainly focused on short term objectives such as improving elec-
tricity supply to the productive sector (i.e. industrial and financial sector), transitioning to re-
newable energy sources and solving waste issues. Therefore, we can infer that technological
advancement and sustainability of business would not immediately be considered.
For example, this can be seen in one of the larger renewable energy initiatives of the current
administration, where MSW-based bioenergy is to be developed in 12 major cities in Indonesia.
The technology promoted is thermal biomass, which means burning via incinerator. The initia-
tive also has a significant energy potential, but the primary goal is waste management. If this
trend is to persist, bioenergy (and biogas alongside it) would stay a minimal contributor to the
overall energy share.
5.3 Customers and Clients
There are 2 types of stakeholders that can be understood as customers. The definition will be
based on our previous stakeholder mapping categorization which includes the technical role,
clientele, input/process/output, and external issues;
Palm oil companies (both plantation and mills due to interdependency between them)
• Their technical role in a larger supply chain is the periodic cultivation and initial pro-
cessing of palm into oils of varying quality;
• Clients of Palm Oil Companies operating in other industrial sectors; either domestic or
international;
• Input: land use granted by the government, capital sourced via financing is required to
reform land to palm standard and manage climate risk and operational cost via income,
seeds are not in constant supply, because a tree can be productive for around a dec-
ade.
There is a notable side impact to a developing market economy via employment (but
on the other side an analogue process will limit productivity).
This project has received funding from the European Union´s Horizon 2020 research and innovation programme under grant 111
agreement N° 857804. The sole responsibility for the content of this document lies with the authors. It does not necessarily
reflect the opinion of the EU.D3.3 - Republic of Indonesia
• Process in a mill starts by sterilization – which applies for all mills, and the point where
POME is created. Fruit bunches can also be taken from this point for biomass energy.
Another POME-creating stage is the extraction.
• Outputs are crude palm oil (CPO) or Palm Kernel Oil (PKO) plus derivatives; these
markets are generally in uptrend due to a sustained demand of consumer goods –
several of which using palm oil to manufacture. Another recent trend is biofuel, also for
domestic and foreign market consumption (but is subject to different sustainability cer-
tifications). Palm outputs are essentially products sold in large amount i.e. a commod-
ity; (price very elastic to demand, closely related to policy making). There’s an ongoing
issue about productivity due to the slow replanting cycle. Indonesia’s weaker currency
value also makes international trading difficult and somewhat seasonal.
• General issues of palm mill/plantation include: a high dependency on the international
market for sales, a product / commodity value that is very susceptible to market fluctu-
ations, and important components for expanding value chain are almost never available
in domestic markets.
Engineering, Procurement, and Construction (EPC) firms that work in biogas projects:
• EPC technical role is the installation of various biogas infrastructure, ranging from di-
gesters, gas engines and methane upgrading; They have a limited role in sourcing
these technologies pre-project, and maintaining it after the construction project has fin-
ished.
• Clients of EPC firms are companies with a stable access to feedstock – either through
own processes (palm companies) or waste collection (municipal landfill). Most Indone-
sian EPCs prefer engaging with one larger institution rather than several smaller ones,
presumably to reduce operational and development risk;
• Input is mostly capital used for purchasing technology which can be sourced in several
ways – own capital and repaid later, client’s capital, or corporate financed by banks.
This is dependent on the project structure and partners involved;
• Project development in Indonesia requires extensive coordination with related line min-
istries and the PLN. A project design relies heavily on ministries’ and PLN approval,
before proceeding to financing. There is also rigid tendering process for national pro-
jects. There is a limited number of projects approved within a period and contractors
need to be pre-approved by the government. Thereafter, project developers are re-
quired to secure capital funding within a short period of time, before applying for con-
struction approval;
• Output is generally turnkey projects, where the EPC source technology and installs it
for the project owner to own (completely or partially) after completion/agreed date (the
BOOT scheme practiced by PLN). Latest reviews of the law have removed this clause;
Technically, AD processing yields gases that can be further used to provide CHP or
upgraded to excrete methane component, while gasification (a derived process of bio-
energy) is a way to produce syngas which has high industrial value and has a clear
demand in Indonesia;
• General Issues for EPCs revolve around the difficulty in accessing the commercial
money market, reactive governance (in policy and structure alike), difficulty in sourcing
reliable inputs, unclear demand for biogas, and how RE implementation is rarely prior-
itized by the government and potential clients.
This project has received funding from the European Union´s Horizon 2020 research and innovation programme under grant 112
agreement N° 857804. The sole responsibility for the content of this document lies with the authors. It does not necessarily
reflect the opinion of the EU.D3.3 - Republic of Indonesia
As an attempt to mitigate the innate risks of palm companies and EPC profiles, we decided to
set targets on state-owned enterprises. They represent a good balance between privatized
business operations and governmental leverage. State enterprises are exempt from many bu-
reaucratic processes a regular company would have to deal with. A three-year long develop-
ment cycle can be reduced to one and a half by this status. They also have the benefit of
subsidization, which theoretically allows them to take more business risks. State enterprises
also synergize well with other state enterprises, which can benefit cross-sectoral biogas pro-
jects.
5.4 Competitive Analysis through the Porter’s 5 Forces
In Indonesia, EPCs usually have an external supplier for technology while also being capable
of planning a development project. The difference is that EPCs offer a wider range of services
which usually include construction maintenance etc.
• Relevant because these EPCs indirectly provide all of the components – usually
sourced from the US, Germany, or China. Service-wise these EPCs (ones picked as
benchmark) compete on a national level – most have extensive project portfolio.
• Indonesian EPCs are required by law to piece together projects (indirect government
role)
The competitive analysis included in this report will therefore be conducted from the perspec-
tive of POME-based Biogas EPCs. Implementation scale will be industrial due to project re-
quirements, as household implementation will significantly limit target achievement and evalu-
ation. Market scope will be national since many of the sample EPCs are based in Jakarta but
targeting Sumatra and Kalimantan palm industries that normally focus on export.
Each force indicator will be analyzed, and later scored with these following specifications:
1. is absolute zero risk
2. is low risk with straightforward operational solution
3. is low risk which require strategic adjustment
4. is persisting low risk attributed to business model
5. is moderate risk with straightforward operational solution
6. is moderate risk which require strategic adjustment
7. is persisting moderate risk attributed to market responses
8. is high risk with straightforward operational solution
9. is high risk which require strategic adjustment
10. is high risk that is not solvable with available capital
5.4.1 Rivalry among Existing Competitors
• Sectoral Growth is not significant. It is negatively affected by 7-or-more years before
actual returns. Profit margins from a project are not very different from other EPC jobs.
One-time project owners rarely want to commit additional development.
Scored 7. Even if not stagnating or negative, the long return period slows activity in the
market.
This project has received funding from the European Union´s Horizon 2020 research and innovation programme under grant 113
agreement N° 857804. The sole responsibility for the content of this document lies with the authors. It does not necessarily
reflect the opinion of the EU.D3.3 - Republic of Indonesia
• Capital Costs are high. During a bioenergy event conducted on 25 February 2020,
one project owner stated that the total project cost can reach around 1 million in USD
which is a lot for Indonesia. In a joint report with the Indonesian Financial Services
Authority (2016), USAID also found that 30 to 40 % of that cost is incurred by Biogas
technology such as digester, engines, auxiliary components. And that is only the fixed
costs. Risks associated with developing biogas incur due to a lot of variable costs.
Switching costs are a bit tricky, since customers are free to pick contractors before the
project starts (essentially for free).
Figure 29: Detailed composition of investment in a biogas project.
Scored 8-9 depending on project. Starting a project costs a lot, and most of that cost
cannot be adjusted because it is incurred by the technology. Unclear switching costs
in between projects force competitors to be more active in engaging the market.
5.4.2 Customers (Bargaining power of Buyers)
• Effect on Industrial Processes is limited for the time being. A vast majority of cus-
tomers only utilize biogas for electricity generation – be it internal or to be bought by
PLN. Benefits of biogas implementation tends to be a ‘saving’ than creating additional
income, which is a lost opportunity for companies. But there is a side benefit for plan-
tations who utilize biogas in the form of certifications, since a biogas process intersects
on a lot of points with several environmental certifications e.g. Indonesian Sustainable
This project has received funding from the European Union´s Horizon 2020 research and innovation programme under grant 114
agreement N° 857804. The sole responsibility for the content of this document lies with the authors. It does not necessarily
reflect the opinion of the EU.D3.3 - Republic of Indonesia
Palm Oil Certification System (ISPO) or Roundtable of Sustainable Palm Oil (RSPO).
Owning these sustainability certificates opens additional markets for plantations – es-
pecially international.
Scored 6-7 depending on the buyer. The benefit of installing biogas into existing
business is still limited. However, the role of biogas in achieving sustainable certifica-
tions can be leveraged.
• Buyer Costs are numerous. In the project stage costs will be incurred by many things
aside from the technology price – installation, logistics (customs included, almost every
piece of critical technology is imported), land clearing, feasibility studies, etc. After eve-
rything is done the customer will still have to set aside some funds for maintenance and
repair operations.
Figure 30: Costs incurred by operations. (USAID and OJK, 2016)
Scored 6. In a plantation context, a lot of additional costs will be involved in biogas
development. Workaround is difficult since the law forbids POME to be moved out of
the premises of a mill, and these palm mills are typically quite far from urban areas.
Paying and arranging these additional services will be a hassle, but the effect to cost
structure is actually not significant.
This project has received funding from the European Union´s Horizon 2020 research and innovation programme under grant 115
agreement N° 857804. The sole responsibility for the content of this document lies with the authors. It does not necessarily
reflect the opinion of the EU.D3.3 - Republic of Indonesia
5.4.3 Suppliers (Bargaining Power of Suppliers)
To facilitate a comprehensive analysis, auxiliary component manufacturer or general exporting
logistics will also be accounted as ‘service provider’/supplier equivalent.
• Substitutes are only valid before a project starts. Once a project is initiated technology
can rarely be replaced. But before projects substitute biogas technologies are provided
by other EPCs (bundled with their own services) or by pure tech supplier/reseller.
Scored 4. There are a number of EPCs in Indonesia that can supply a project with
technology, so pre-project decisions can be made with a degree of flexibility. But it’s
kind of a choice illusion when we remember that the technology available in Indonesian
EPCs are imported from foreign tech manufacturer anyways.
• Supplier Concentration: Concentrations of major international manufacturer (whose
products are used in Indonesia) are all foreign – US, Europe, China. This will inevitably
cause additional cost and time.
Scored 6. Biogas technology is almost exclusively imported. This adds inevitable cost
and time for EPCs or suppliers to stock up (or start a project). Trade routes are also
prone to disputes, taxation, and exchange loss from dealing with a foreign currency.
Fortunately, it appears that technology exporters also found value in the Indonesian
market as no EPCs or suppliers have experienced a debilitating shortage of technol-
ogy.
5.4.4 Threat of New Entrants
Threat value becomes high when the market structure allows for easier participation from
would-be competitors.
• Scalability is theoretically achievable for industrial-scale implementation. Biogas infra-
structure of this level starts as small as 1MW generating power per 30 ton of waste.
Increasing feedstock input (in this case, POME) yields greater power with an increase
of 0.3MW per 15 ton of waste. Same thing with cost scalability. Larger biogas projects
This project has received funding from the European Union´s Horizon 2020 research and innovation programme under grant 116
agreement N° 857804. The sole responsibility for the content of this document lies with the authors. It does not necessarily
reflect the opinion of the EU.D3.3 - Republic of Indonesia
benefit from relatively stable design and construction cost (i.e. at least physical dimen-
sion not radically changing per MW upscale).
Scored 3. Economics of scale applies in implementing POME biogas in plantations.
This is especially the case for industrial-scale implementation, which gives old players
with established revenue stream and anyone who has additional capital an advantage
over newcomers. Will be a bit problematic for smaller-scale attempts.
• Capital Requirements are high as mentioned before. New entrants who do not have
previous industrial/engineering/chemical industry background (and assets) will have a
hard time trying to participate in the market. Implied necessity of a Special Purpose
Vehicle (SPV) establishment doubles this notion. On the flipside – larger companies
from adjacent sectors (especially fossil energy) who transition into biogas development
will be able to retain their network, assets, and reusable capacities effectively.
Scored 4. Big initial capital is required to develop biogas projects. While theoretically
this can become a barrier for newcomers similar to the ‘Scalability’ aspect, existence
of financial institutions can bypass this.
• Government Policies can act as barrier. Although no policy explicitly denies entry to
the biogas market, there are policies who disincentives the intent. For example; low FIT
prices when selling biogas electricity to PLN grid, mandatory transfer of assets after
PPA term expires, minimum local content requirement (where development needs im-
ported technology – happened in other industries as well). The whitelist previously
mentioned also limits new entries.
Scored 2. This is more or less the main determinant for someone to transition into
renewable energy in the Indonesian market. While the government subsidizes energy,
the same is not true for renewables. At the moment they only regulate, and the regula-
tions are not exactly business friendly – even for the old players. This is clearly not
encouraging.
This project has received funding from the European Union´s Horizon 2020 research and innovation programme under grant 117
agreement N° 857804. The sole responsibility for the content of this document lies with the authors. It does not necessarily
reflect the opinion of the EU.D3.3 - Republic of Indonesia
• Incumbency is somewhat perpetuated in the culture (thanks to the market as well).
Project owners, either government or private, strongly prefer working with known EPCs.
Project development portfolio is also a point of consideration. This gives old players a
massive advantage. Biogas stakeholders also know one another, and this network of
connections enables Business-to-business (B2B) marketing, a clear Human Resource
(HR) pipeline, project opportunities, and several other benefits.
Scored 2. The poor quality of information management in Indonesia does not give
benefit from late movement. Not to mention the limited amount of biogas development
projects available to tender in each given period. EPCs who move fast will get the pro-
ject, and EPCs who get said project will be known across the market – easing future
projects and collaborations.
• Project Stream is also limited for government and private alike. The government ap-
proaches contractors via the whitelist, because state fund allocation for renewables is
getting cut every year – and biogas is not prioritized in the list. Private sector is hesitant
to participate because they are not yet sure about the financial feasibility and value of
implementing biogas into their existing business processes.
Scored 5. While government and private sector projects are communicated to the mar-
ket most of the time, actually accessing the tender process is difficult. The government
has its limitations, and actors from the private sector rarely do so. Not to mention direct
contracts which depends on the extent of someone’s network.
5.4.5 Substitute Sector
• Price Gap exists between biogas and biomass development, but the yield-to-cost ratio
is actually in favor to biogas. In Indonesia biogas is 1:1, biomass incinerators 1:2, and
This project has received funding from the European Union´s Horizon 2020 research and innovation programme under grant 118
agreement N° 857804. The sole responsibility for the content of this document lies with the authors. It does not necessarily
reflect the opinion of the EU.D3.3 - Republic of Indonesia
MSW landfill gas 1:4. The ratio mentioned is also based on Covered Lagoon technol-
ogy, which is generally subpar in everything but price. CSTR biogas exists in Indonesia,
but information on its development and associated costs are very limited.
The price gap is indirect for biofuel development. Unlike biomass technology (where
the implementation excludes the use of biogas because a site rarely has both), biofuel
enters a palm mill process from a different point. They purchase mill CPOs directly, not
engaging with waste. In this sense, a buyer will not need to invest on tech infrastruc-
tures but still participating to renewable energy production BUT they will not be able to
internally control savings or income rates.
Scored 6. Biogas is stuck in an unusual condition where the commonly used technol-
ogy is actually cheaper, but it is neither endorsed explicitly by the government nor does
it have clear offtake for yields. EPCs ended up preferring the more expensive substitute
for the clarity of benefits. Biofuel, while supported by governmental uptake, is beyond
private stakeholders’ control.
• Buyer Sensitivity is very apparent in the biogas market. Clients are wary of a market
that is still non-commercial, since there aren’t many other cases that can be used as a
benchmark. The plantation sector (as primary client segment) is also dealing with a
naturally fluctuating business. Investing in a technology that currently has limited use
and is risky to develop is not a good decision.
In this manner biofuel is more threatening. The current governmental purchasing
scheme addresses buyer sensitivity to price flux directly by buying their products at a
fixed rate. While the scheme does not necessarily buy all of a mill’s output, the fact that
they will be able to sell a guaranteed amount per period sets a price floor and ceiling
for their core business (CPO).
Scored 9. Buyers are considering every financial component of renewable energy pro-
jects due to the massive time and money investment required. Development costs can-
not be modified in a meaningful way since it consists of fixed costs, and financial benefit
is still limited and uncertain.
This project has received funding from the European Union´s Horizon 2020 research and innovation programme under grant 119
agreement N° 857804. The sole responsibility for the content of this document lies with the authors. It does not necessarily
reflect the opinion of the EU.D3.3 - Republic of Indonesia
• Product Performance – within the context of palm plantations as clients, biomass
plants will be using fruit bunches. Biomass plants have two clear uses for its yields:
electricity from heat-based generators and ash that can be sold as fertilizers. Biogas,
on the other hand, requires additional processing and technology to utilize maximized
yield (since biogas is effectively manufacturing material as well). Both will require a
long time before return of investment occurs. Relative simplicity can also ease local
development.
Biofuel performance does not matter, since the current scheme is limited to raw pur-
chase of CPO.
Scored 6. The rates in which these technologies produce power is similar. The differ-
ence lies in the process. Biomass seemingly offers higher performance because the
process is more straightforward than biogas (and the full potential of biogas is not yet
realized in the market).
• Sub-Sector Trends are positive in large part thanks to the government. Earlier, we
mentioned how renewables development in Indonesia is largely dependent on govern-
mental policy and decisions. And the government is quite supportive of biomass re-
cently. For example, Presidential Order No.35/2018 mandated the development of bi-
omass in 12 Indonesian major cities to solve municipal waste problems. Even if the
target is not power generation, orders like these are still beneficial for the substitute
sector. Biomass development became a government target, with quite a clear guideline
as well.
The same applies to biofuel, to a greater extent. A Presidential Mandate regarding na-
tional biofuel use is in effect, with clear milestones and asset mobilization. Having gov-
ernmental support increases confidence in the biofuel segment, and it seems that the
trend will persist at least until the cabinet changes in the next period.
Scored 7. Biomass sectoral performance is not affected by the current trend, as tech-
nology research and development are generally progressing slowly in Indonesia. How-
ever, increased adoption that is enforced by the government continually improves fi-
nancial access and EPCs efficiency in implementing – essentially reducing the risk of
additional costs.
This project has received funding from the European Union´s Horizon 2020 research and innovation programme under grant 120
agreement N° 857804. The sole responsibility for the content of this document lies with the authors. It does not necessarily
reflect the opinion of the EU.D3.3 - Republic of Indonesia
5.4.6 Competition
Competition for new biogas project developers will come from those who provide access to
biogas technologies to the market. The role is primarily fulfilled by EPCs who are either in
standing agreement with certain suppliers, or by a tech manufacturer’s subsidiary organization.
When the industrial scale of >1MW of biogas power plant is taken into context, identification
parameters are:
• Operational Region is important because it is related to palm variety, soil characteris-
tics, related stakeholders, and governmental idiosyncrasy.
• Primary Digester Technology (and yield) will show us the most relevant type and size
of technology that typically leads into a successful project.
• Organizational Status ranges from local EPCs that are made from scratch to palm mills
that are starting to transition into renewable energy development.
Accounting for tech suppliers is also important, but it is rarely mentioned by the companies or
the news pertaining their activities. Any notable responses to approach will also be detailed –
whether these stakeholders are taking a competitive or cooperative stance. Names listed be-
low are taken due to their close relation to GIZ Indonesia’s current efforts at improving Bioen-
ergy commercial viability, i.e. they are well-known as veteran players, or have achieved a mile-
stone, or have a tendency to actively participate in market-building events.
1. GREE New Energy became notable for its development of a large cassava-based cov-
ered lagoon in Lampung with 3MW yield, which was successfully connected to the na-
tional grid. It is also notable how they are explicitly setting a GHG reduction target of
65KT per year. GREE is an independent EPC which also offers operational services
(post-construction, taking a role similar to SPVs) and project feasibility checking.
2. Ecody Agro Energy is one of the most prolific EPCs in Indonesia, with 11 Biogas plants
spread across Sumatra and Kalimantan. They usually deal with covered lagoon tech-
nology ranging from 500KW to 3MW in size. Ecody also offers a wide range of services,
essentially becoming a one-stop shop for Biogas development. This extensive capac-
ity, coupled with a constant stream of governmental and private contracts, left them in
an advantageous market position. We perceive them as market leader in commercial
Biogas development.
3. Pasadena Engineering Indonesia is one of the early players in Indonesian renewables
development. Initiated in 2006 as an EPC and continually adapting to the market, Pas-
adena is adept at capitalizing off market trends. Their covered lagoons are located
across Sumatera and Kalimantan, yielding 1-2MW in average. They are currently chas-
ing the prospect of Biofuels, shown by the establishment of Pasadena Biofuels Mandiri,
a subsidiary that exclusively deals in Biofuel processing. Both of these companies were
cooperative and are willing to provide information and resources in later stages of the
project.
4. Austindo Aufwind New Energy (AANE) is a special purpose vehicle (SPV), created via
joint venture between Austindo Nusantara Jaya plantation and Germany-based
Aufwind Schmack Asia Holding (GmbH). Austindo originally deals with operating plan-
tations that yield consumable crops, one of which being oil palm. Wastes of internal
This project has received funding from the European Union´s Horizon 2020 research and innovation programme under grant 121
agreement N° 857804. The sole responsibility for the content of this document lies with the authors. It does not necessarily
reflect the opinion of the EU.You can also read