Carbon Control and Competitiveness Post 2020: The Cement Report
←
→
Page content transcription
If your browser does not render page correctly, please read the page content below
Carbon Control and
                             Competitiveness Post 2020:
                             The Cement Report
                             FINAL REPORT

                             February 2014

                        Authors
                     Karsten Neuhoff
                   Bruno Vanderborght
                    Andrzej Ancygier
                   Ayse Tugba Atasoy
                    Manuel Haussner
                      Roland Ismer
                     Benedikt Mack
                  Jean-Pierre Ponssard
                    Philippe Quirion
                     Arjan van Rooij
                      Nagore Sabio
                      Oliver Sartor
                       Misato Sato
                      Anne Schopp

FRIEDRICH-ALEXANDER
UNIVERSITÄT
ERLANGEN-NÜRNBERG

FACHBEREICH
RECHTSWISSENSCHAFT
About the Authors
Karsten Neuhoff,
German Institute for Economic Research, DIW Berlin
Bruno Vanderborght,
Independent Researcher
Andrzej Ancygier
Hertie School of Governance
Ayse Tugba Atasoy
German Institute for Economic Research, DIW Berlin
Manuel Haussner
University Erlangen-Nürnberg
Roland Ismer
University Erlangen-Nürnberg
Benedikt Mack
German Institute for Economic Research, DIW Berlin
Jean-Pierre Ponssard
CNRS-Ecole Polytechnique
Philippe Quirion
Centre International de Recherche sur l’Environnement et le Développement (CIRED), CNRS
Arjan van Rooij
Radboud University Nijmegen
Nagore Sabio
University College London
Oliver Sartor
The Institute for Sustainable Development and International Relations (IDDRI)
Misato Sato
The Grantham Research Institute on Climate Change and the Environment, London School of Economics and
Political Sciences
Anne Schopp
German Institute for Economic Research, DIW Berlin

This report is an output from the Energy Intensive Industries project funded by Ministries in Germany, Netherlands,
France, UK and by Tata Steel and Heidelberg Cement. The views expressed and information contained in it are not
necessarily those of or endorsed by the funders which can accept no responsibility or liability for such views,
completeness or accuracy of the information or for any reliance placed on them.

The authors are gratefull for detailed comments and other input to Samuela Bassi, Christopher Beauman, Simone
Cooper, Michael Flach, Daniel Gauthier, David Grover, Guillaume Habert, Detlef Heinz, David Leal, Niall Mackenzie,
Kerstin Ringelhan, Martin Schneider, Matthew Tisdale, Heleen de Coninck and Stefan Schleicher.

About Climate Strategies
Climate Strategies is an international organisation that convenes networks of leading academic experts around
specific climate change policy challenges. From this it offers rigorous, independent research to governments
and the full range of stakeholders, in Europe and beyond. We provide a bridge between research and
international policy challenges. Our aim is to help government decision makers manage the complexities
both of assessing the options, and of securing stakeholder and public consensus around them. Our reports
and publications have a record of major impact with policy-makers and business.
Table of Content

EXECUTIVE SUMMARY ........................................................................................................................ 2

1.               Introduction ...................................................................................................................... 5

2.               Mitigation options in the cement industry ......................................................................... 7

3.               Past drivers and future needs to unlock the various mitigation options ........................... 11

      3.1.       Alternative fuels, biomass and the CO2 intensity of the fuel mix ....................................... 11

      3.2.       Emissions savings through investments in energy efficiency ............................................. 14

      3.3.       Emission reductions through substitution of clinker with other materials .......................... 16

      3.4.       Efficient cement use and substitute building materials ..................................................... 20

      3.5.       Developments of alternatives to cement ........................................................................... 22

      3.6.       Development of CCS ........................................................................................................ 22

4.               Effects of the EU ETS on pricing, operational and investment decisions ......................... 25

      4.1.       Pricing: Are carbon costs passed on to cement purchasers? ............................................. 25

      4.2.       Trade and re-investment: Is there evidence of carbon leakage? ......................................... 27

      4.2.1. EU cement and clinker consumption and trade ................................................................ 28

      4.2.2. Is there evidence of operational leakage? .......................................................................... 30

      4.2.3. Is there evidence of investment leakage? .......................................................................... 31

      4.3.       Distortions arising from fixed ex-ante allocation and activity thresholds ............................ 32

      4.3.1. Effects on operational decisions ....................................................................................... 33

      4.3.2. Effects on asset rationalisation and investment in efficiency ............................................. 35

      4.3.3. Effects on trade and cement markets ............................................................................... 36

5.               Implications for policy design ......................................................................................... 38

      5.1.       Strengthening the carbon price signal .............................................................................. 40

      5.2.       Reduce distortions from carbon leakage protection measures .......................................... 40

      5.3.       Clarity on future developments ........................................................................................ 44

      5.4.       Support for innovation ..................................................................................................... 45

      5.5.       Adjustments to regulations and building codes ................................................................ 45

Annex I. Interviews............................................................................................................................. 47

Annex II. Inclusion of consumption .................................................................................................... 48

Annex III. Innovative Cement-Based Materials ................................................................................... 52
EXECUTIVE SUMMARY
This report assesses how production and emission volumes, energy and CO 2
efficiency and competitiveness of companies in the Energy Intensive Industries have
evolved prior and during the European Union Emissions Trading System (EU ETS).
Furthermore the report assesses how the EU ETS and other policy instruments may
have influenced investment and operational choices at the company level. In doing so,
this work combines detailed analysis and comparison of available data with
comprehensive interviews of industry executives.
Building on the experience gathered to date, the project then explored what is needed
to unlock the mitigation potentials identified in the low-carbon roadmaps for the
sector – with respect to potential reforms of the EU ETS as much as with respect to
complementary policy instruments.
Top management’s confidence in the EU ETS policy needs to be restored
Our research findings reveal that during its early years the EU ETS attracted top
management attention to reducing CO2 emissions. Cement companies firmly included
CO2 reduction targets and carbon costs into their planning and decision-making.
However, with a carbon price declining from 30 to 5 €/ton CO2, with the limited
effectiveness of the system to date, and with the system’s complexities and
uncertainties, and against the economic background of a global financial crisis, the
EU ETS has slipped from the top of management’s priorities. In addition to the
carbon price being low, it is also as volatile as energy prices. The volatility increases
the perception of complexity. This is not helped by the prolonged discussions on
changes to the system, such as on backloading of allowances, structural reforms of
the EU ETS and limitations on the eligibility of emission reduction credits. As a result,
even the most knowledgeable top executives are no longer able to explain to their
board the relevance of the policy framework for corporate decisions.
By early 2014, backloading has finally been approved and the European Commission
has published its vision of a 2030 package on January 22, 2014. The discussion and
ultimate implementation of the package including setting of new targets for 2030,
structural reform of the EU ETS and formulation of other policy objectives, for
example on innovation, provides the opportunity to recover the confidence and
initiative of cement companies.
More effective economic incentives are needed to unlock mitigation
To date, most of the emission reductions in the cement sector are caused by drivers
other than the EU ETS. The share of emissions from the cement sector in total EU
ETS emissions decreased from 7% in 2008 to 5.6% in 2012 but this was largely due
to a decrease of clinker and cement production as a consequence of the state of the
economy. Carbon intensity of cement has improved by 3-5% since 2005, but largely
linked to drivers outside of EU ETS. While this shows that the sector does respond to
2policy and regulation the limited scale of improvements is also evidence of EU ETS
insufficiencies.
The combination of the free allocation and low carbon price for most of the period
under Phase I and II provided an insufficient economic incentive to further leverage
emission reduction options in this sector. However, to unlock significant additional
emission reductions, a robust carbon price is necessary but not sufficient.
The EU ETS emission cap declines by 1.74% per year. Industry executives raised
doubts whether given uncertainties about the scale and costs of different mitigation
options this is technological and economical optimal for the cement sector. Such
industry interpretation of an emission trajectory at sector level contrasts with the
motivation of using an emission trading mechanism to provide flexibility through
trading between sectors. But it points to the need for sector specific low-carbon
roadmaps to provide guidance and allow for coordination. The road maps need to
obtain broader visibility, including through the incorporation of customer side
mitigation options.
Free allocation may explain absence of carbon leakage, but creates
distortions
No operational leakage 1 has taken place so far and provisions concerning free
allocation may be credited for that. There is also currently no evidence that
investments in Europe have been cancelled and moved abroad because of the EU
ETS. However, free allowance allocation provisions also create severe distortions. The
shift from historic levels of emissions towards benchmark-based allocation has
eliminated perverse subsidization of inefficient plants, but major distortions remain.
Activity level requirements imply that half of the historic production level must be
maintained for installations to obtain maximum free allocation. This discourages
asset rationalization and negatively affects energy efficiency improvement. It also
causes excess clinker production, reducing clinker substitution with lower-carbon
substitutes and distorting trade flows. The profits resulting from the excess allocation
further distort competition. Apart from their direct consequences, these deficiencies
fundamentally undermine the level of confidence in the policy by the top
management, further lowering it in their priorities.
As most mitigation options are linked to efficiency, innovation and lead market
investment, early clarity on the leakage protection measures post-2020 is essential to
ensure early investment choices.
1
Carbon leakage is a transfer of production to other countries triggered by climate policy instruments.
This would lead to reduced emissions in the EU, but less of an overall reduction of global GHGs
emissions. In our Report we differentiate between operational leakage, the replacement of domestic with
foreign production, and investment leakage, the replacement of investment in domestic production
capacity with investment in foreign production capacity.
2Refining EU ETS carbon leakage protection to provide carbon price for
consumers
The combination of free allowance allocation – in place to address carbon leakage
concerns – and the competition with imports from countries where producers do not
pay for carbon, results in a low and very uncertain carbon price pass through to
cement prices. Without an increase of cement prices major mitigation options cannot
be pursued as: (i) customers are unlikely to select other cement types with lower
clinker content in the absence of economic incentives; (ii) firms will not develop new
low-carbon cement types without prospects of future market demand; and (iii) the
building industry has limited incentive to use cement more efficiently. Reflecting the
full carbon price in cement prices in Europe could be realized through two
mechanisms, in the absence of a global carbon price.
First, a shift to full auctioning could be combined with the inclusion of importers in
the EU ETS as envisaged in Article 10b of the 2009 ETS directive. Imported clinker
and cement would be liable to surrender allowances based for example on the current
best available technology benchmark. This would ensure non-discrimination between
domestic and foreign producers and contributes to World Trade Organization
compatibility. International coordination would be required to avoid political
repercussions.
Second, output based allowances allocation could be combined with an inclusion of
consumption in the EU ETS. Allocating allowances proportional to clinker production
volume (output based) instead of the current use of activity level requirements
eliminates distortions for efficient production of clinker, but eliminates incentives for
clinker substitution and efficient customer choices. Hence it is combined with a
consumption charge on the clinker content in cement linked to the EU ETS. Firms
producing or trading cement would have to levy the charge as the product is prepared
for final domestic sale, irrespective of the country or production process of the
clinker.
Both of these approaches would not impact the basic structure of EU ETS or the ETS
directive, but merely implement one of the options already outlined in the directive for
carbon leakage protection of individual sectors (inclusion of imports) and add one
additional option (inclusion of consumption). However, the options are politically
(inclusion of imports) and administratively (both options) challenging – and hence
their application would likely be focused on products with very high shares of
embedded carbon.
EU ETS not sufficient: enabling environment and innovation policy essential
Empirical evidence reveals that emissions trading on its own will be an insufficient
policy to incentivise further CO2 mitigation. Coordination with and adaptation of other
existing and new policies will be required to enable the realisation of low-carbon
options.
3Enabling mitigation options by addressing regulatory and institutional constraints: Much of
the emission reductions in the cement sector to date have been initiated or facilitated
by regulatory changes. For example, the co-firing of waste products required new
permits, which together with the supply of suitable waste was required by the waste
framework, incineration and landfill directive or the reduction of clinker content in
cement and concrete achieved to date required adjustments to codes and standards.
What precise requirements are needed for the exploration and diffusion of further
mitigation options needs early analysis to avoid potential regulatory barriers.
Engaging decision makers to consider lower-carbon options in cement production and use:
On the cement user side, adaptations of building practices, standards, and
information systems will be needed to stimulate low carbon procurement in the
construction industry. This can require provision of information, e.g. with labelling
approaches and reporting requirements, as much as training and certification of
different actors.
Support investment in innovation for longer-term mitigation options: Major mitigation
options, such as material substitution and carbon dioxide capture and storage (CCS),
will require significant investment in demonstration plants and large-scale adoption of
new building practices and materials will require significant upfront demonstration of
the viability of new practices and materials. Experience from the EU ETS and other
sectors suggest that the necessary scale of funding is unlikely to materialize through
private initiative alone. Further work is required to understand the precise
requirements for funding and suitable mechanisms.
41. Introduction
The objective of this research is to provide objective, evidence-based analysis and
explanation of the past and current effectiveness of the EU ETS for Energy Intensive
Industries (EII). In doing so, we identify potential areas of improvement for the EU
ETS and complementing policy instruments. The insights gained enable us to evaluate
possible options to improve the effectiveness of policy to foster energy efficiency and
greenhouse gas mitigation, whilst maintaining the international competitiveness of
European EII.
The research focuses on three of the most energy and carbon intensive industrial
activities, namely cement, steel, and chemicals. This first study explores the situation
in the cement sector based on data analysis of sources such as the WBCSD – CSI
Getting the Numbers Right database, the EUTL, Eurostat, the UN Comtrade trade flow
data and company annual financial reports. The researchers then conducted a series
of interviews with executives from cement companies with the purpose of discussing
and understanding the business decision processes and the role of the EU ETS and
other policy instruments. Annex 1 includes the list of interviewed executives and a
short description of the methodology. Wherever throughout this report there is a
reference to the interviews, the conclusion is based on a representative majority of the
interviews and thus likely scalable to the industry.
We found that the EU ETS attracted top management attention on the need to reduce
CO2 emissions. During the years with higher EUA prices and strong political support
for consistent long-term targets, emission reductions formed part of the company
strategy of most European cement firms.
However, the interviews with the cement executives revealed that over the last two
years (2012-2013), the EU ETS drastically slipped to the bottom of company’s
management priorities. This was due not only to the overall economic situation with
significant surplus capacity, but also to the ETS itself. Interest in measures that would
lead to the reduction of CO2 emissions at the management-level diminished as the EU
ETS came to be considered ineffective and deficient in several ways. The lack of CO2
market price predictability, the uncertainties about future structural reform of the ETS
and about future measures for carbon leakage protection, as well as the uncertainty
on the political support for consistent long-term CO2 emissions reduction targets all
added to a lack of confidence in the EU ETS.
Figure 1 depicts the absolute CO2 emissions and the production volumes of clinker
and cementitious products 2 from the European cement industry, relative to 2005
volumes. In the years 2009 – 2011 the absolute CO2 emissions from the European
cement industry were 20-22% lower than in the 2000-2005 period, and 25% below
the 1990 level. This trend is predominantly a consequence of the economic cycle with
2
Cementitious products are the sum of clinker not yet incorporated in cement, plus cement, plus clinker
and cement substitutes used in concrete.
5emissions and output peaking in 2007 and decreasing by 30% over the following two
years.
Figure 1. Absolute CO2 emissions and the production volumes of clinker and cementitious
products from the European cement industry, relative to the 2005 volumes
1,15
1,1
1,05
1
0,95
0,9
0,85
0,8
0,75
0,7
1990 2000 2005 2006 2007 2008 2009 2010 2011
CO2 Clinker Cement
Source: CSI GNR Source
The cement sector received 8% of the total volume of allowances for the years 2008-
2012 ranking second of the industrial sectors after steel and before refineries. At the
same time the share of emissions from the cement sector in total EU ETS emissions
decreased from 7% in 2008 to 5.6% in 2012, ranking as the third industrial sector
after steel and refineries3.
There is limited evidence that the EU ETS has accelerated the pace of improvement in
the CO2 intensity of clinker and cement production. The same pace of improvement
has been observed during the 5-10 year period prior to the EU ETS and the 7 years of
the ETS. During the EU ETS the average CO2 emissions per ton of clinker decreased
by 1.2% to 2% over the entire 7 years period from 2005 to 2011. Over the same
period CO2 emissions per ton of cement decreased by about 3% to 5%. There is a
strong argument to consider the significant decrease of the cement production and
the CO2 emissions in the EU since the beginning of the EU-ETS in 2005 as a
consequence of the economic crisis and not of the investment and operational
leakage caused by the EU ETS.4
3
European Environmental Agency and EU ETS registry (EUTL).
4
Similar conclusions were made in the ecorys study prepared for the European Commission: Closure of
plants and reduced cement production was caused by economic crisis and has not by the carbon price.
Ecorys (2013) "Carbon Leakage Evidence Project",
http://ec.europa.eu/clima/policies/ets/cap/leakage/docs/cl_evidence_factsheets_en.pdf (pp. 133-134).
6To understand this we present the main options for a reduction of the CO2 emissions
in the cement sector in the following section. Subsequently, in Section 3 the current
progress to date of the different levers to reduce CO2 emissions and the contribution
of the ETS and other regulatory and economic drivers towards this progress are
analyzed. The section does not provide a comprehensive coverage of all instruments
in place, but merely discusses instruments where they were reported to be relevant
for past decisions with mitigation impact. Section 4 discusses the effectiveness and
other implications of the carbon leakage protection measures. Based on the empirical
evidence gathered, we then discuss improvements to the policy framework that could
unlock the portfolio of the mitigation options in Section 5.
2. Mitigation options in the cement industry
The purpose of this section is to briefly summarize the sources of CO2 emission in the
cement industry and the possibilities to reduce them.5 Cement is the mineral glue
that is responsible for the strength of the widely used construction materials concrete
and mortar. The main ingredient of cement is clinker, which is activated by gypsum.
The properties of cement can be changed by adding other mineral components, which
are partially substituting clinker, such as ground granulated slag from the steel
industry, fly ash from coal combustion, ground limestone and burnt oil shale.
Clinker is produced by decarbonizing and mineralization of limestone in a high
temperature process. Consequently it is the production of clinker that causes the
majority of the CO2 emissions of the cement industry. Overall the CO2 originates from
two main sources: The decomposition of limestone (so called process CO2) and the
combustion of fuels burnt to reach the high temperatures (fuel CO2). The process CO2
emissions amount to typically around 530 kg CO2 per ton of clinker6, 7. Depending on
the thermal energy efficiency of the clinker kiln and the fuel type, fuel emissions range
between 220 kg and 500 kg fuel CO2 per ton of clinker.
5
Ba-Shammakh, et al., Analysis and Optimization of Carbon Dioxide Emission Mitigation Options in the
Cement Industry, American Journal of Environmental Sciences, 4 (5): 482-490, 2008; Moya et al., Energy
Efficiency and CO2 Emissions: Prospective Scenarios for the Cement Industry, JRC Scientific and
Technical Reports, 2010.
6
Source: CSI Getting the Numbers Right database. .
7
IPCC and EU ETS Phase III benchmarks assume 525 kg CO2 per ton of clinker.
7Figure 2. Fuel and process related emissions of cement sector and mitigation options to
reduce the emissions.
Process related Fuel related
emissions (65%) emissions (35%) Total cement
emissions (demand
times emissions/t)
Pre-treated waste
Energy Efficiency
Biomass waste
Emission reduction
Cement demand (EU 27)
options (illustration)
Carbon Capture
& Storage
New cement types
Lower clinker content
Substitution/efficient cement use
Emissions / t cement
In addition to the process and fuel related emissions, there are also indirect
emissions that originate from the consumption of electric power (around 110
kWh/ton cement) 8 and emissions resulting from transport. Transport emissions
obviously vary depending on transport distance and mode, but generally contribute a
maximum of 5% to the production emissions. 9
The main options to reduce emissions from the cement industry are discussed in the
points that follow.
Reduction of fuel-related emissions:
Substituting the traditional fossil fuels such as coal, lignite and petcoke, which
emit around 100 kg CO2/MJ, by alternative fossil fuels, mainly waste derived
fuels emitting around 70 to 80 kg CO2/MJ or biomass that is considered
climate neutral if it is waste biomass or sustainably grown; and
Improving the thermal energy efficiency of the clinker kilns by using Best
Available Technology (i.e. pre-heater pre-calciner kiln technology) and Best
Operating Practices (i.e. concentrating production in the most efficient
installations and operating those close to their nominal capacity).
8
CSI „Getting the Numbers Right“, indicator 3212.
9
The role of cement in the 2050 low carbon economy, The European Cement Association, 2013.
8Reduction of process and fuel emissions:
Substituting clinker by other mineral components in cement and concrete. This
can involve enhanced clinker mineralization and reactivity which makes further
clinker content reduction possible while maintaining concrete strength;
Substituting cement with low-carbon cement alternatives; and
Carbon Capture and Storage (CCS) or Carbon Capture and Utilization (CCU).
Indirect emission reductions:
Improving the electric energy efficiency of clinker and cement production
installations.
Several organizations have estimated the potential for cement CO 2 emissions
reduction from 1990 to 2050. These include reports and roadmaps by the
International Energy Agency in collaboration with the WBCSD Cement Sustainability
Initiative (CSI), the CSI with the European Cement Research Academy (ECRA),
Cembureau and the European and British cement trade associations (MPA) from the
perspective of the cement industry and Ecofys with WWF and the UK Climate Change
Committee from the NGO and governmental perspectives, respectively.10
Figure 3 shows the contribution of the mitigating options to achieve 80% emissions
reduction by 2050. The roadmaps are fairly consistent in estimating about 15% of the
reductions to be achieved by replacing fossil fuels by biomass, with only a small
fraction of this potential already used. Clinker substitution is estimated as having a
similar potential but with a larger variation across regions and a large share of the
potential already implemented between 1990 and 2011. An important feature of the
roadmaps proposed by the IEA and the industrial stakeholders is that they include
“offsets” for the CO2 emissions from fossil waste as a fuel (i.e. they refer to “net”
instead of “gross” CO2 emissions11) an indirect reduction that the EU ETS, WWF and
the UK CCC do not account for. The estimations of the potential from cement
substitution, more efficient usage of cement and new cement types are merely
ballpark figures on which there is little consensus across the roadmaps. To bridge the
gap to 80% reduction by 2050, about 40% to 60% of the total reduction should come
from Carbon Capture and Storage.
10
Cement Technology Roadmap 2009 Carbon emissions reductions up to 2050, World Business Council
for Sustainable Development and International Energy Agency; Development of State of the Art-
Techniques in Cement Manufacturing: Trying to Look Ahead, (CSI/ECRA) Technology Papers, 2009; The
role of cement in the 2050 low carbon economy, The European Cement Association, 2013; Mineral
Products Association Cement GHG Reduction Strategy, The mineral Product’s Industires Contribution to
the UK, 2012; How to Turn Around the Trend of Cement Related Emissions in the Developing World.
WWF International.
11
Net and gross CO2 as defined by the WBCSD / CSI MRV protocol.
9Percentage Share of Emissions Reduced by 2050
10%
20%
30%
40%
50%
60%
0%
IEA (low demand scneario)
Ecofys/WWF
UK Committee on Climate Change
Cembureau
Biomass (waste)
Mineral Products Association
WBSD/ECRA Technology Report
IEA low demand scneario
Ecofys/WWF
UK Committee on Climate Change
Cembureau
Mineral Products Association
Pre-treated (waste)
WBSD/ECRA Technology Report
Share of Total Emissions Reduced
IEA low demand scneario
Source: Compilation of different cement sectoral roadmaps
Ecofys/WWF
UK Committee on Climate Change
Cembureau
Energy Efficiency
Mineral Products Association
WBSD/ECRA Technology Report
IEA low demand scneario
Potential Emission Reductions of Different Mitigation Options by 2050
Baseline Adjustment
the assumption that alternative fuel use mainly consists of biomass and pre-treated waste.
Ecofys/WWF
UK Committee on Climate Change
Cembureau
Mineral Products Association
Clinker Substitution
WBSD/ECRA Technology Report
IEA low demand scneario
*Baseline Adjustments are based on the data collected from GNR database. Pre-treated waste have been calculated with
Ecofys/WWF
UK Committee on Climate Change
of Cement
Cembureau
Mineral Products Association
IEA low demand scneario
Ecofys/WWF
UK Committee on Climate Change
Materials
Cembureau
Figure 3. The relative share of the major emission reduction levers to reach 80% CO2 emission reduction from 1990 to 2050
Mineral Products Association
Substitution/Efficient Use Innovative Cement Based
IEA low demand scneario
Ecofys/WWF
UK Committee on Climate Change
Cembureau
Mineral Products Association
Carbon Capture and Storage
WBSD/ECRA Technology ReportFurther options that reduce indirect CO2 emissions where power generation remains
fossil based include:
Improving electric power efficiency of clinker and cement production. Grinding
cement more finely and using more slag increases power consumption but
enhances cement performance and thus makes it possible to use less clinker
and cement in concrete;
Recovering of waste heat from the clinker kiln and using this to produce
electric power. It should be noted though that the more energy efficient the
clinker kiln is, the less waste heat there is to recover.
The next section will describe how the ETS and other policy instruments have
influenced progress and business decision-making on the different mitigation options.
3. Past drivers and future needs to unlock the various
mitigation options
3.1. Alternative fuels, biomass and the CO2 intensity of the fuel mix
The EU cement sector reduced fuel related gross CO2 emission intensity by 6%
between 2005 and 2011, primarily by replacing coal with biomass, the latter of which
is considered to be climate neutral by ETS accounting standards. There was also
some CO2 emissions reduction due to replacement of coal by waste.
The share of energy sourced from biomass has more than doubled from 3.6% in 2005,
to over 5.1% in 2008 to 8.7% in 2011, replacing emissions from coal combustion of
about 3.3 million ton CO2. The share of fossil waste increased from 11% in 2005 to
almost 26% in 201112. Currently, 80% of installations in the EU use fossil waste. The
decisive factors driving the usage of alternative fuel use are: (i) reducing energy cost
(approx. 10 €/ton clinker); and (ii) long-term hedging of energy supply and cost risks.
The economic incentive resulting from the EU ETS is still of secondary importance for
the industry’s biomass and of minor importance for fossil waste use. Using 1 ton of
biomass saves about 1.5 tons of CO2 and 1 ton of fossil waste saves about 0.3 tons of
CO2. At a CO2 market price of 10 €/EUA, companies would save allowances worth 15
€/ton from biomass and 3 €/ton from fossil waste. If 50% of energy would be sourced
from biomass, this would correspond to savings worth 3 €/ton clinker.
All over Europe the volume of biomass use in cement production (ton biomass / year)
has changed little since 2005. Some exceptions include Spain (50 to 100% increase),
the UK (+10%) and Poland (however with low volumes). In contrast, Germany and
12
CSI „Getting the Numbers Right“, indicator 3211a.France witnessed a decrease of biomass volumes of about 25% during Phase II of the
EU ETS. This can be linked to the support mechanisms for renewable energy that
creates incentives for the use of biomass in heat and power production, but not in the
cement sector. Hence the cement industry only uses less than 10% “traditional”
biomass (primarily in Spain) and relies otherwise on wastes such as contaminated
animal meal and fat, sludge from waste water treatment and the biomass fraction of
treated municipal waste (Refuse Derived Fuel). The high temperatures achieved
during clinker production make it ideal for bio-waste disposal, by ensuring that any
biological contamination in animal waste products is destroyed. It thus allows cement
installations to use biomass products that would otherwise have to be treated in
dedicated waste incineration.
The share of energy sourced from biomass varies widely across Member States and
installations. Some installations use up to 40% of biomass, but usually the share is
lower. In France and Germany up to 80% – 90% of installations use biomass. In Italy,
only 10% of installations use small quantities of biomass, and there has been no
increase of the number of installations using biomass since 2000. The Italian average
thermal substitution rate remains 3 to 7 times below the European average. This is
due to a combination of aspects linked to permitting such as: low understanding and
limited trust in the information provided; local resistance; fragmented and
decentralized permitting competences; and numerous and lengthy appeal procedures
making the rational implementation of policies and changes extremely difficult.
Figure 4: Volume of biomass used for cement production in selected EU countries (years
2001-2004 interpolated)
1,0 2,5 9% of thermal
Absolute Volume of Biomass (Mt)
0,9 right axis energy from bio-
Absolute Volume of Biomass (Mt)
0,8 2,0 D
mass (waste)
0,7 F
0,6 1,5 E
~ savings of about
0,5 I
3.3 Mt CO2
0,4 1,0
UK
0,3
PL
0,2 0,5
EU
0,1
0,0 0,0
2000 2001 2002 2003 2004 2005 2006 2007 2008 2009 2010 2011
Source: CSI GNR: Indicator 314
Source: CSI GNR: Indicator 314
Across Europe, fossil wastes are often accepted for co-incineration with payment of a
service fee in the order of 10 €/ton waste, which could increase to 100 €/ton waste
for difficult hazardous waste materials. However, for some easy high calorific wastes
12such as waste oil, the cement company has to pay instead. Thus, in principle there is
a strong economic incentive for the use of fossil waste without the EU ETS. This
incentive to use waste is also linked to other regulatory measures. In particular, the
EU Directive (99/31/EC)13 restricts landfill of waste, and the gradual increase of the
use of waste in cement plants after the implementation of this Directive could be
linked to its slow transposition into national laws. The 2009 deadline for the
transposition was in fact met by only 9 Member States. Italy is again an outlier, as the
number of installations using waste as a fuel has not increased since 2000. This is
again due to the challenging local permitting processes.
The use of biomass and waste requires investments in waste pre-treatment, storage
and handling facilities. The use of biomass also decreases the clinker production
capacity of the installation. This is, however, of limited concern during times of
(significant) over-capacity.
Figure 5. The volume of waste used as fuel in cement plants
3 right axis
9
Volume of waste (Mt) (Member state)
8
Volume of Waste (Mt) (EU)
7 D
2 6 F
5 E
4 I
1 3 UK
2 PL
1 EU
0 0
2000 2001 2002 2003 2004 2005 2006 2007 2008 2009 2010 2011
Source: CSI GNR: Indicator 313
Source: CSI GNR: Indicator 313
13
Directive 99/31/EC on Landfill of Waste.
133.2. Emissions savings through investments in energy efficiency
During the 12 years between 2000 and 2011, including 8 years of the EU ETS, the EU
average thermal energy efficiency of kilns remained unchanged at 3’730 MJ/ton,
which is 20% above Best Available Technology level.
Figure 6. Change in the average thermal energy efficiency of the cement plants.
4400
D
4200 F
MJ/ton Clinker
4000 E
3800 I
UK
3600
PL
3400
EU
3200
2000 2001 2002 2003 2004 2005 2006 2007 2008 2009 2010 2011
Source: CSI GNR: Indicator 329
About 45% of European clinker production is based on dry kilns with multistage
preheater and precalciner (PHPC). They are considered as Best Available Technology
(BAT) with the potential thermal energy consumption of 2’900 – 3’300 MJ/ton
clinker.14 However, the average operational energy consumption observed in European
PHPC kilns was higher than the potential. Between 2005 and 2011 the annual EU
average thermal energy consumption of PHPC kilns was stable at about 3’550 MJ/ton
clinker15. This is due to the kilns utilization below design capacity and less stable
process control and fuel mix. Increasing the share of alternative fuels in the fuel mix
may increase energy consumption by 2% because of the water content and coarse
particles.
Another 45% of EU production capacity is in dry kilns that are not BAT. These are
either preheater kilns without precalciner or long dry kilns without PH and PC.
14
Moya, J. A., et al., “The potential for improvements in energy efficiency and CO2 emissions in the EU27
cement industry and the relationship with the capital budgeting decision Criteria”, Journal of Cleaner
Production 19 (2011) 1207-1215.
15
CSI „Getting the Numbers Right“, indicator 3210a.
14The remaining 10% of European production is based on 10 wet and 30 semi-wet
clinker installations. These technologies are more energy intensive 16 than the best
available technology: By 9% in the case of an average semi wet kiln and by 50% for a
wet kiln. Yet the use of wet and semi-wet kilns in Europe declined only very slowly
since 2000 and at an even slower pace after the introduction of the EU ETS (Table
1)17. Replacement of the remaining kilns could contribute to emission reductions of
0.5 Mt CO2/year for the EU cement sector.
Modern PHPC kilns capacity was built or expanded in Germany, the UK and Poland
prior to 2005, and in Ireland and some East European countries (Bulgaria, Romania,
Latvia, Slovakia and Cyprus) during Phase II of the EU ETS.
Table 1. Share of cement produced in Best Available Technology (BAT), semi-wet and wet
kilns
Percentage of total EU clinker produced in different kiln types
Year
BAT (preheater + Semi-wet Wet
precalciner) (9% more energy) (50% more energy)
2000 34% 12% 6% in 19 installations
2005 42% 9% 5% in 13 installations
2011 44% 7% (30 kilns) 5% in 11 installations
Source: CSI GNR
Investment decisions are made considering a consolidation of many market,
economic, financial and regulatory aspects, of which the EU ETS and its carbon cost
is just one out of many.
Investment decisions in the European cement industry were made particularly difficult
by the economic downturn since 2008. Investments in modernization of installations
and cost reduction traditionally require better financial performance (ROIC, IRR,
payback) than investments that allow accessing new markets or increasing the value
and price of products. However, with the current limited profitability of the cement
industry, short-term - up to 3 years - financial aspects and performance (gearing and
ROIC, IRR, payback period) play a much bigger role than previously also for long-term
investments. This is particularly the case for the multinational groups where gearing,
debt reduction and the financial rating are absolute top priorities.
Within such a short-term focused financial appraisal applied even to investments in
long-lasting assets, the longer-term objectives and risks for carbon inefficient assets
induced by the EU ETS play only a secondary role in the investment decisions.
Assuming a carbon price of 20 €/EUA, replacing a wet or semi-wet kiln with a PHPC
16
CSI „Getting the Numbers Right“.
17
CSI “Getting the Numbers Right“, indicator „synthesis“.
15kilns leads to cost savings of 4.6 €/ton and 1.4 €/ton clinker respectively. While this
is not a negligible cost, it is insufficient for justifying a wet to dry kiln conversion. The
refurbishment of existing installations to bring them to BAT level is expensive,
especially because many of the less efficient installations in Europe are of relatively
small size (less than 1 Mton/year).
Based on the interviews with company executives, wet kilns can still reach a financial
contribution (i.e. sales price minus production cost) of about 20 to 30 €/ton product,
despite the higher thermal energy consumption and CO2 emissions. Apart from the
investment costs having been amortized, (semi) wet installations in Europe reduce
their energy cost through sourcing high to very high (up to 70%) energy contributions
from waste, often industrial wastes that are obtained including a service fee.
The CO2 cost is thus insufficient to trigger a wet to dry kiln conversion at carbon
prices in the range of 10 to 20 €/EUA. The effect of carbon prices is weakened
through the allowance allocation provisions within the EU ETS. As installations receive
the full allowance allocation as long as annual production volume is not bellow 50% of
historic production volume, old installations can operate at a lower capacity factor (as
they are already depreciated) and still benefit from full allowance allocation, thus
obtaining surplus allowance allocation that contributes to net revenue. 18
A set of the EU ETS provisions and implementing measures contribute to a perception
of reduced regulatory predictability and investment uncertainty that may have
contributed to a delay of investment decisions. These include the revision of the list of
carbon leakage-exposed sectors which takes place every 5 years, uncertainties about
carbon leakage protection measures after 2020 and the complexity of historically
based allocation rules. It also relates to ongoing discussions on backloading,
structural reforms of the EU ETS, 2030 targets and international agreements
concerning the reduction of CO2 emissions. However, according to several executives
interviewed, the risks induced by the EU ETS are also used as a welcome excuse for
the deferral of difficult decisions.
3.3. Emission reductions through substitution of clinker with other
materials
Since it is the production of clinker that causes CO2 emissions, the substitution of it
by other hydraulic minerals is the most effective way to reduce CO2 emissions in
cement. The European cement norm19 allows six clinker substituting minerals, from
which the most important are ground granulated blast furnace slag from the steel
industry, fly ash from coal fired power stations, limestone and burnt oil shale.
Reducing the clinker content in cement is currently the most effective mitigation
18
Demailly, D., et al., “How to design a border adjustment for the European Union Emissions Trading
System?”, Energy Policy 38 (2010) 5199–5207.
19
European Standard EN197-1 Cement - Part 1: Composition, specifications and conformity criteria for
common cements.
16option because it not only prevents fuel CO2 but also the process CO2 emissions from
the chemical transformation of limestone in clinker.
The EU average clinker content in cement has decreased by about 2% during Phase I
of the EU ETS, but during Phase II the average clinker substitution 20 from all
hydraulic minerals has been stable at 20 to 20.5% (Figure 7).
Figure 7. Share of materials substituting clinker in cement.
Gypsum Limestone Puzzolana Slag Fly ash Others
9
8
in % Total Volume of Cements
7
6
5
4
3
2
1
0
2000 2001 2002 2003 2004 2005 2006 2007 2008 2009 2010 2011
Source: CSI GNR: Indicator 3219
Clinker substitution is an important business aspect with multiple dimensions
elaborated below, affecting the core product and assets of the cement industry, i.e.
clinker, clinker installations and limestone reserves. The degree of substitution
depends on the factors outlined below.
Regional availability of substituting materials
The regional availability of slag, fly ash and pozzolanic materials is a pre-requisite for
their use as clinker substitute, given transport costs for acquiring inputs from longer
distances.
Fly ash is essentially a waste product from dust filters installed at coal fired power
stations. Thus the different share of coal in the local power generation mix impacts
the availability of fly ash. For example, Poland uses 9% of fly ash in cement
20
Clinker substitution consists of all mineral components other than clinker and gypsum.
17production, significantly above the European average of 3%. The potential for further
increases of the use of fly ash is limited and will decline if climate policy triggers a
shift away from coal power generation.
Most slag from steel plants is utilized across Europe for cement production.
Significant up-front investment costs are required for processing facilities prior to
inclusion of slag into cement. In the UK and Ireland, clinker is also substituted with
slag at the concrete mixer instead of during cement production. Total clinker
substitution for these countries, in cement and in concrete combined, is similar to the
rest of Europe.
Geology limits the availability of pozzolanic minerals to a few southern European
countries with volcanic activity such as Italy to Greece. 21 Also, burnt oil shale is an
excellent cementitious product. It is produced in a fluidized bed combustion
installation and co-generates electric power. CO2 emission per ton of cement is low
because there is no limestone decomposition, it requires a low combustion
temperature (half that of a clinker kiln) and it co-generates power. However, geology
limits the availability of open-air mining of useful shale to a few regions in Europe.
Cost of substituting materials
Fly ash and slag are by-products of power and steel production. Their use requires
some up-front investments in treatment plants. Cement producers compete for the
limited available fly ash and slag, resulting in significant prices that however usually
remain below the total cost of providing clinker. In addition, there is a trend that with
contract renewals the value of the CO2 savings from clinker substitution by slag is
shared between the cement and steel companies. Typically supply contracts secure
cement companies a stable access to fly ash and slag at a fixed price.
Dependence on other companies
The economic cycles of cement and steel do not always coincide. This may lead to
temporary imbalances in the supply and demand of slag as a clinker substitute. Since
2009 slag has been (temporarily) stockpiled in limestone quarries of cement
companies rather than being used in cement. There are no accurate data available on
the volume and time of slag stockpiled. A reasonable estimate could be around 3
million ton or about 15% of the slag volume used annually across Europe.
Meeting consumer needs
Clinker substitution may impact the technical qualities and requirements of the
concrete, such as early and late strength, sulphate resistance, colour and workability.
This requires overcoming demand-side resistance to new products.
21
“A blue print for a climate friendly cement industry. How to Turn Around the Trend of Cement Related
Emissions in the Developing World”, Ecofys, 2008.
18Some companies have started with Product Carbon Footprinting, labelling and
advertising reduction of embedded CO2 in marketing and sales of different cement
types. Market acceptance has been mixed but generally rather muted. Product quality
and price remain the two most important aspects for the customer. This shows the
importance of economic incentives for emission reductions from the EU ETS into
consumer choices. The cost of embedded CO2 should be reflected in the cement price
to more effectively stimulate consumer choices to low carbon cement types.
The EU ETS
Substituting for example 25% to 30% of clinker, i.e. selling CEM II instead of CEM I
cement, saves about 0.2 ton CO2/ton of cement. At a carbon price of €10 this would
offer savings of 2 €/ton of cement. This raises the question as to why the EU ETS has
not induced further clinker substitution.
Most cement executives interviewed stated that, while recognizing that clinker
substitution is an effective option to reduce CO2 emissions, the influence of the EU
ETS is not (yet) weighted as much as other factors that drive decisions about clinker
substitution. This can be broken down to two factors:
First, cement companies only add a limited and uncertain share of opportunity costs
for CO2 allowances to cement prices (see section 4.2). Thus there is currently a very
limited economic incentive for cement consumers to shift towards cement with lower
clinker content. A (full) CO2 cost pass-through in the cement pricing may be necessary
to effectively influence consumer choices towards lower CO2 cement types and
producers.
Secondly, cement companies discount the value of potential emission savings from
clinker substitution if allowances are allocated for free. This repeated observation in
industry reality contradicts simplified economic models of companies maximizing
profits. In theory, companies should pursue equal levels of abatement if they can save
costs from buying fewer allowances or if they can increase revenue from selling
additional surplus allowances. Why the reality diverges from this theory can be linked
to: (i) the uncertainty whether lower clinker production will be reflected in the base-
line for allowance allocation in future periods; and (ii) the norms in corporate
accounting procedures that report costs, but ignore forgone opportunity costs savings
(see also section 4.3 on use of profits from over-allocation by cement companies).
As a result, some companies have invested in production with reduced clinker content,
mainly in view of a long-term corporate CO2 reduction strategy. Yet the effective
incentive from the EU ETS was limited across Europe and the average share of clinker
substitution remained stable. Regional differences did however occur. Germany and
the UK have further increased clinker substitution during both EU ETS phases, in the
UK mainly with fly ash. Poland increased clinker substitution during Phase I but not
Phase II. In Italy and the Czech Republic clinker substitution remained remarkably
unchanged since the beginning of the EU ETS. Slag use at the concrete mixer in the
UK has also not changed since 2005. Spain on the other hand has decreased clinker
19substitution during EU ETS Phase II, going back to the year 2000 level (see further in
section 4.3). Also Austria increased the clinker content of cement, reaching
substitution levels only slightly above the EU average.
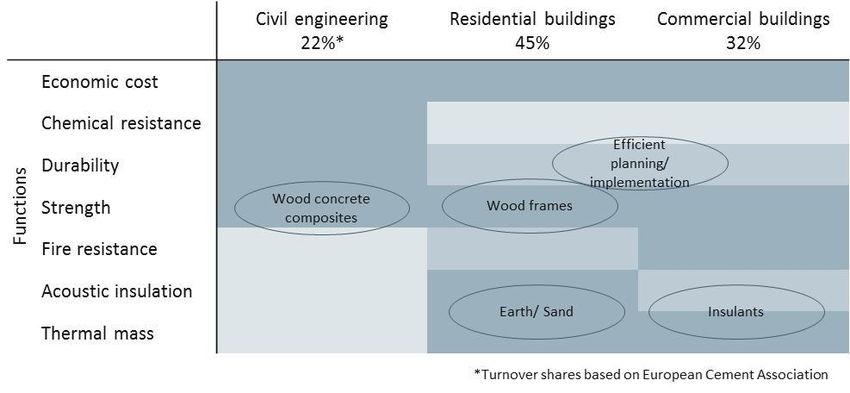
3.4. Efficient cement use and substitute building materials
Cement and concrete are the most common construction materials today. This is due
to the fact that they provide functional performance capabilities at relatively low cost,
unequalled by any other building material. To our knowledge the potential share of
cement and the associated emissions that can be saved by using cement more
efficiently (e.g. better design) or substituting cement products with alternative
materials has not been systematically assessed. It is unlikely that there will be one
single substitute for cement. Instead, approaches for more efficient cement use and
suitable alternative materials will depend on the specific functions that need to be
provided. These functions can differ between residential and commercial buildings
and civil engineering (Figure 8).
Figure 8: Efficient cement use and cement substitution with alternative materials
(dark ~ relevance of function)
In civil engineering, bridges are one example where - from a technical point of view -
the use of concrete can be reduced by using wood-concrete-composite bridges. In this
way, concrete can support compression loads and wood can be used to take over
tension forces 22 . In interviews with engineers, it was reported that wood-concrete-
composites can save 50% of concrete and 20% of steel required for the construction
of bigger heavy traffic bridges or long deck constructions.
22
Flach, M. and Frenette, C.D., (2003), Wood-Concrete-Composite-Technology in Bridge Construction.
20In the construction of residential and commercial buildings, concrete is typically used
to address various functions: strength; fire resistance; thermal mass; or acoustic
insulation. Several studies show that building components such as frames, inner and
outer walls and floors can be built with wood while allowing for the same functions. It
embodies - according to life cycle assessments - less carbon emissions than
concrete.23 The potential for wood might be, however, higher for residential buildings
than for commercial warehouses, since the fire protection requirements for
commercial warehouses are more stringent. Furthermore, the function of thermal
mass can be provided by sand or earth24. It was reported that if concrete is used only
for the structural purpose, potentially more than 20% of concrete can be saved at the
building level from a technical perspective.
However, the actual potential to substitute cement products by other building
materials depends not only on these technical considerations, but also on factors
such as the availability of alternative materials, their economic cost, entrepreneurial
activity in the field, cultural aspects and the role of building regulations. To better
understand the potential to reduce cement demand and the associated emissions a
more systematic analysis is needed in these fields.
In addition to concrete substitution, the use of concrete can be reduced through
better planning and implementation. It has been argued that early collaboration
between structural engineers and architects can reduce the required material use.25
One example for better planning is the coordination between foundation, walls and
floors – thus, walls and floors made of lighter materials than concrete require less
concrete for the foundation.26 Moreover, better implementation can reduce the use of
concrete for building floors. For example, concrete is needed on top and at the
bottom to fulfil strength requirements. The filling could be left empty or be filled with
Styrofoam. However, in practice concrete is also put as filling, since this allows for
easy implementation.
Previous studies estimate that the price elasticity of substitution is in the range of -
0.5 to -127 If the cement price is without carbon cost at current European levels of 60
€/ton, a CO2 price of 40 €/ton in 2050 could reduce cement demand by 20-35%.
23
Albrecht, S. Rüter, S. Welling, J. Knauf, M. Mantau, U. Braune, A. Baitz, M. Weimar, H. Sörgel, S.
Kreissig, J. Deimling, J. Hellwig, S., (2008), Ökologische Potenziale durch Holznutzung gezielt fördern,
Bericht gefördert von BMBF; Gustavsson L., Madlener R., Hoen H.-F., Jungmeier G., Karjalainen T., Klöhn
S., Mahapatra K., Pohjola J., Solberg B., Spelter H. (2006). The Role of Wood Material for Greenhouse
Gas Mitigation, Mitigation and Adaptation Strategies for Global Change, 11(5-6): 1097-1127; O’Connor,
J. and Sathre, R., (2010), A Synthesis of Research on Wood Products and Greenhouse Gas Impacts, 2nd
Edition, Vancouver, FP Innovations.
24
Pacheco-Torgal, F. and Jalali, S., (2011), Earth construction: Lessons from the past for future eco-
efficient construction, Construction and Building Materials, Vol. 29, pp. 512–519; Goodhew, S. and
Griffiths, R. (2005), Sustainable earth walls to meet the building regulations, Energy and Buildings, Vol.
37, pp. 451–459.
25
Mehta, K. and Meryam, H., (2009), Tools for Reducing Carbon Emission due to Cement consumption,
Structure magazine, January 2009.
26
John, V., Habert, G. (2013), Graue CO2-Emissionen im Gebäude – wo sind sie hauptsächlich verortet?
Ökobilanzanalyse mittels zweier verschiedener virtueller Blickwinkel auf die Konstruktionsweisen und
Bauteile von vier unterschiedlichen Mehrfamilienhäusern, Bauingenieur 08, pp. 342-348.
27
Cour and Møllgaard (2002) -0.3; Roller and Steen (2006) -0.5 – 1.5; Jans and Rosenbaum (1997) -0.8;
Ryan (2005) -3.
21You can also read