UTILITIES AND ECONOMIC DEVELOPMENT AND GROWTH IN ETHEKWINI - ETHEKWINI MUNICIPALITY
←
→
Page content transcription
If your browser does not render page correctly, please read the page content below
14th Issue SEPTEMBER 2015

    Economic Development AND Growth in EThekwini

UTILITIES AND
Welcome to the EDGE
Welcome to the 14th edition of The EDGE, a quarterly economic
bulletin that looks at the eThekwini economy, with a brief overview
                of the global and national context.

PUBLISHED BY THE ETHEKWINI ECONOMIC DEVELOPMENT AND INVESTMENT
PROMOTION UNIT, THE EDGE AIMS TO INFORM STAKEHOLDERS OF THE LATEST
DEVELOPMENTS AND TRENDS IN ETHEKWINI. THE THEME OF THIS EDITION
CENTRES ON UTILITIES WITHIN ETHEKWINI, AMIDST THE CHALLENGES BEING
   EXPERIENCED THROUGH LOAD-SHEDDING AND WATER RESTRICTIONS.
CONTENTS
                                                                                                Page
Foreword                                                                                                2
Message from the Editor                                                                                 3
Economic Overview                                                                                       5
A Closer Look at Utilities and Smart Cities                                                          18
Electricity                                                                                          22
Water                                                                                                36
Feedback from Recent Events                                                                          43

EDGE Contributors
Editor: Aurelia Albert     Policy, Strategy, Information and Research Department, eThekwini Municipality

Contributors:

Clive Coetzee              KwaZulu-Natal Provincial Treasury
EThekwini Electricity Unit – Leshan Moodliar, Manju Naidoo, Jonathan Hunsley

EThekwini Water and Sanitation Unit – Simon Scruton, Teddy Gounden

Susanna Godehart           Energy Office, eThekwini Municipality

Chris Whyte                USE-IT

Ajiv Maharaj               Policy, Strategy, Information and Research Department, eThekwini Municipality

Denny Thaver               Policy, Strategy, Information and Research Department, eThekwini Municipality

Thobeka Ngcobo             Policy, Strategy, Information and Research Department, eThekwini Municipality

Tshegang Chipeya           Policy, Strategy, Information and Research Department, eThekwini Municipality

Shivani Singh              Policy, Strategy, Information and Research Department, eThekwini Municipality

Pumla Jali                 Policy, Strategy, Information and Research Department, eThekwini Municipality

Information for this publication was obtained from sources believed to be accurate and reliable. The
eThekwini Municipality and all other providers make no representations or warranties, expressed or implied,
to any subscriber, person or entity as to the accuracy, timeliness, completeness, merchantability or fitness
for any particular purpose of any of the information or forecasts contained herein.

                                                                                                               1
FOREWORD

                                         Welcome to the 14th edition.                  making large-scale investments into those
                                                                                       areas, as well as water and sanitation. The
                                         This is the first EDGE published              on-going drought has brought to the
                                         in the Council’s new financial year,          fore the challenges associated with the
                                         being 2015/16. This year the Council          provision of adequate clean water. But,
                                         has adopted a capital budget of               the challenges associated with utilities are
                                         approximately R6 billion, which is            not simply about Government building
                                         aimed at both addressing the pressing         infrastructure, it’s also about business and
                                         challenge of service delivery, while          the citizens playing a crucial part. The
    Her Worship Deputy Mayor of          maintaining and rehabilitating existing       shortage of rainfall, due to the current
    eThekwini Municipality, Councillor   infrastructure, as well as laying the         rainfall cycle, combined with infrastructure
    Nomvuzo Shabalala                    foundation for economic growth through        challenges has created water shortages
                                         the provision of new bulk infrastructure.     in the city.

                                                                                       Water, as a most precious resource, is
                                         In the 2015/16 financial year alone, R1,2     often taken for granted and used by
    “R1,2 billion                        billion is set aside for transport, which     people as something inexhaustible.
    is set aside for                     includes the Integrated Rapid Public          Despite the shortages, I still see people
                                         Transport Network, while R1,4 billion         washing their cars with a running
    transport which                      is committed to water and sanitation          hosepipe and operating sprinklers in the
    includes the                         and R900 million to general engineering       middle of the day. This type of wastage
    Integrated Rapid                     services, R836 million to electricity and a   shows contempt for the rest of society as
                                         further R750 million to housing.              this resource needs to be shared in a way
    Public Transport                                                                   that meets the basic needs of everyone.
    Network while                        We recognise that in order to attract
                                         investment in key areas we needed             On the part of infrastructure, the
    R1,4 billion                         to invest in the extension of bulk            capturing and distribution of water, as
                                         infrastructure. Hence this budget invests     well as the extension of bulk waste-water
    is committed to water                substantially in water and sanitation,        infrastructure requires approval on the
    and sanitation and                   electricity and roads. The public             part of the Department of Water Affairs
                                         transport investments are significant and     and we appeal that matters such as
    R900 million                         anticipated to change the spatial structure   the approval of water use licences, the
    to general                           of the city in the long-term while creating   Umhloti waste-water treatment works,
                                         efficient and safe public transport in the    as well the proposed desalination plant,
    engineering services,                short-term. Poor people who live in the       are treated with urgency. Challenges
    R836 million                         townships spend on average about 20%
                                         of their income on travel to and from
                                                                                       associated with water are not short-term
                                                                                       in nature and should not be treated lightly
    to electricity and                   work. This is high by any standard and we     once the drought has ended, since this is
    a further                            need to change this model.                    a long-term challenge which will require
                                                                                       significant investment over the long-term
    R750 million                         As you would be well aware, load-
                                         shedding has become a way of life
                                                                                       in order to ensure that the economic
                                                                                       growth of the city is not stifled. Rainwater
    to housing.”                         and this, coupled with the rising costs of    harvesting should be viewed seriously by
                                         electricity, have had a negative impact       households and industry, while industry
                                         on business and job creation. While the       also needs to ensure efficiency in water
                                         Municipality has moved to minimise the        usage and recycling.
                                         impact of load-shedding on industries
                                         during stage 1 and 2 load-shedding,           This issue of The EDGE brings a focus
                                         it is inevitable that it will dampen          to the utilities that make the city work.
                                         economic growth.                              We have compiled extensive statistics,
                                                                                       trends and expert views to inform
                                         While Government makes large-scale            decision-making and lead us onto a path
                                         investments into infrastructure at the        that enables economic growth and job
                                         national sphere to address issues, such       creation. We acknowledge that working
                                         as electricity, housing, transport and        together we can achieve better results.
                                         logistics, this Municipality is further

2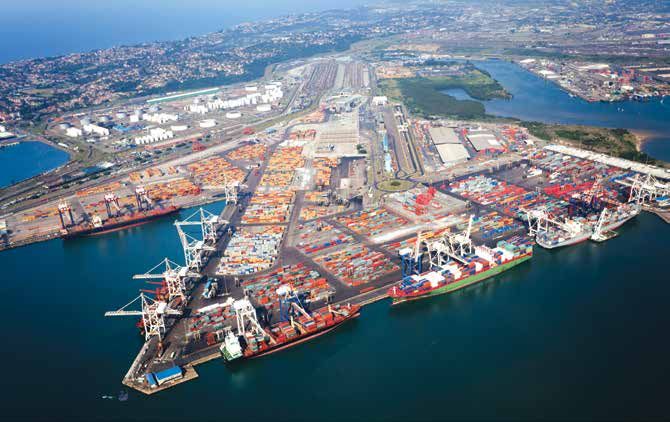
Message from
                                the Editor
                                This edition focuses on                        The EDGE also explores the concept of
                                utilities in light of the                      a Smart City, with respect to energy and
                                                                               water, and looks at ‘smart systems’ as a
                                prevalent issues facing                        way to improve efficiencies, reduce costs
                                our country and region.                        and improve workability, liveability and
                                These are challenging                          sustainability. EThekwini Municipality
                                times that eThekwini is                        has already started looking at smarter
                                facing especially with                         systems, with a number of initiatives being
                                                                               implemented by service departments.
                                regard to the double-
                                                                               Research and development has been at
                                whammy that we have                            the core of these initiatives in the hope
Aurelia Albert
Policy, Strategy, Information
                                been dealt - the energy                        of transforming eThekwini into a Smart
and Research Department,        and water crises.                              City by improving service delivery using a
eThekwini Municipality                                                         holistic approach.

“EThekwini                      The electricity crisis has reached a point     Key questions which arise during the
                                where the grid is so constrained that load-    course of this publication include:
Municipality has                shedding and the high cost of utilities has
already started                 become a prominent part of our lives,          •    Are energy and water costs
looking at smarter              forcing all citizens and businesses alike to        exorbitant, in light of their scarcity
                                find ways in which to curb these costs and
systems, with a                 switch to energy reduction and alternative
                                                                                    and economic value?
number of initiatives           forms of energy.                               •    Is there a more sustainable approach
being implemented by                                                                to tackling the issues of a constrained
                                The water crisis, on the other hand, has
service departments.”           affected many citizens and businesses in
                                                                                    energy system and the drought that
                                                                                    has further impeded growth?
                                eThekwini, especially in the North. The
                                water shortage, together with a high
                                                                               •    Is the Smart City approach the right
                                increase in tariffs, has constrained the
                                                                                    one in light of the diverse economic
                                citizens of eThekwini.
                                                                                    and social landscape of eThekwini?
                                This edition firstly looks at the eThekwini
                                economy which has grown slowly.                •    How can the challenges being
                                Statistics regarding eThekwini’s economy            experienced be shared by
                                confirm the trend, although some positive           Government and the private sector?
                                signs are showing in 2015.
                                                                               •    Are investments in key catalytic
                                While unemployment has declined                     projects going to move eThekwini
                                slightly, the number of discouraged                 out of a stagnant growth trajectory?
                                work-seekers has increased, posing a
                                real problem to the city. This could be        This ‘bumper’ edition is designed to help
                                partly due to the slow, or no growth in        the reader think critically, while providing
                                the productive sectors of the economy,         a balanced view of key issues. I hope that
                                which are generally large contributors to      you enjoy the read!
                                employment and job creation.

                                                                                                                              3
Foreign direct investment (FDI)
flows to South Africa fell by over
31% last year to

    $5,72
    billion
    from $8,3 billion in 2013

                                     The eThekwini economy
                                     grew by 0,9% in 2014

                                      R248,5
                                      billion
                                                             Global infrastructure
                                                             spending is expected to
                                                             grow to more than

                                                             $9 trillion
                                                             by 2025

4
Economic Overview

                                Global Economic
                                Outlook

                                According to the Global Economic Prospects
                                Report by the World Bank (July 2015), the global
                                economy is expected to grow 2,8% during 2015,
                                slightly less than forecast in January, and will
                                strengthen moderately to 3,2% in 2016/17.

                             The risks to this outlook include tight           to impinge the minerals sector.
                             global financial conditions coupled with          The number of unemployed people
                             deteriorating growth prospects, especially        increased by 2,1% during 2014 to
                             in commodity-exporting countries. The IMF         approximately 4,8 million, with an
                             has also cut its global forecast for 2015 to      unemployment rate of 25%. Economists
          WORLD              3,3%, citing the financial market turbulence      believe that lower oil prices or a stronger
                             in China and Greece as the main factors.          currency is likely to see growth exceeding
                                                                               2% in the future. The local challenges, such
                             The Report also mentions that developing          as load-shedding by Eskom and frequent
                             countries are facing two transitions this         strikes in the manufacturing sector, remain a
                             year, as growth slows further to 4,4%.            threat to higher GDP growth.
south africa
                             Firstly, the widely expected tightening of
                             monetary conditions in the US, along with         Foreign direct investment (FDI) flows to
                             monetary expansion by other major central         South Africa fell by over 31% last year to
                             banks, has contributed to broad-based             $5,72 billion, from $8,3 billion in 2013,
                             appreciation in the US dollar and is exerting     according to the latest World Investment
                             downward pressure on capital flows to             Report. The weak global FDI was attributed
             kwazulu-natal   developing countries. Secondly, despite           to the fragility of the global economy, policy
                             some improvement in the first quarter of          uncertainty for investors and elevated
                             2015, lower oil prices are having a significant   geopolitical risks. Inflows to Africa, as a
                             impact in oil-importing countries, the            whole, remained flat when compared with
                             benefits to activity have so far been limited     2013, at $54 billion. Nevertheless, the Report
                             and, in oil-exporting countries, lower prices     indicated that South Africa was still the
                             are reducing activity and increasing fiscal,      largest FDI host economy in Africa.
    durban                   exchange rate, or inflationary pressures.
                                                                               Local Economic Outlook:
                             National Economic                                 EThekwini
                             Outlook
                                                                               The eThekwini economy grew by 0,9%
                             The national economy grew by 1,5% in 2014         in 2014 (R248,5 billion), probably due to
                             (R4,8 trillion in constant 2010 prices) - this    the mining, manufacturing and electricity
                             low growth is against the backdrop of the         sectors recording negative growth.
                             global impacts mentioned, especially the
                             drop in commodity prices. As South Africa         The agriculture, construction, transport and
                             is a minerals-driven economy that relies on       finance sectors enjoyed positive growth
                             industrialisation through beneficiation and       (agriculture had the highest at 4,6% with
                             foreign earnings, the decline in commodity        manufacturing the lowest at -0,5%). The
                             prices across the mining sector and the           number of unemployed people during
                             reduction in the demand for steel in the          2014 was approximately 217 000, at a rate
                             Chinese market are impacting negatively           of 15,2%, while the number of employed
                             on the national economy. This has severely        (this includes informal) was approximately
                             affected formal employment, which grew by         1,3 million. The pie chart overleaf shows
                             a modest 2,2% in 2014 with more job losses        the percentage contribution of the broad
                             on the cards as commodity prices continue         sectors for 2014.

                                                                                                                        5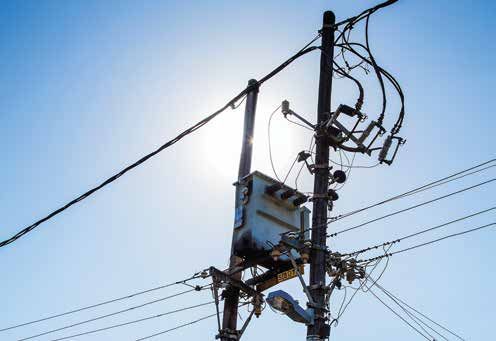
Graph 1: Sectoral Composition of GDP in 2014: EThekwini

                                 1%                                19%
                         Agriculture
                                                                    Manufacturing

               20%                                                     3%
          Community
                                                                       Electricity
            services

                                           0%                              5%
                                          Mining                           Construction
          20%
          Finance
                                                                     18%
                                                                     Trade
                      14%
                    Transport

    Source: IHS Global Insight

         The slow growth in the global and national economies has certainly impacted
         on eThekwini. However, the major projects planned for the city going
         forward will bode well for high economic growth, most notably those that
         will enhance trade activity with sub-Saharan Africa and, especially, in light of
         the anticipated GDP growth of 5% in 2016 for the continent. During 2014,
         Africa’s growth has been driven mainly by agriculture, extractive industries,
         construction and services and on the demand side, the boost came from private
         consumption and infrastructure investment. According to a recent report by
         PricewaterhouseCoopers, global infrastructure spending is expected to grow to
         more than $9 trillion by 2025, a substantial portion of which is expected in the
         basic manufacturing sector in sub-Saharan Africa, estimated at $16 billion.

6
Table 1: EThekwini Municipal Region: Key Indicators: 2013/2014

  Indicator                             2013              2014             Change

  Gross Value Added (GVA)        R246,2 billion        R248,5 billion      0,97%
  (Constant 2010 Prices)

  Gross Domestic Product         R270,5 billion        R273,0 billion      0,90%
  (GDP) (Constant 2010 Prices)

  Gini Coefficient               0,63                  0,64                0,01% points

  Per Capita Income              R51 284               R55 727             8,67%

  GVA Average Annual             2,2%                  1,0%                0,2% points
  Growth

  Population                     3 514 199             3 544 678           0,87%

  Geographic Area                2 291km2              2 291km2            0 change

  Population Growth              0,9%                  0,9%                0 change

  Population Density             1 533 persons/km2     1 547 persons/km2   0,91%

  Number of People Below the     752 873               780 017             3,61%
  Food Poverty Line

  Number of Households           997 000               1 009 081           1,21%

  Urbanisation Rate              84,5%                 85,1%               0,6% points

  Percentage of People in        21,4%                 22,0%               0,6% points
  Poverty

  Annual Per Household Income    R180 765              R195 757            8,30%
  (2010 Current Prices)

  Human Development Index        0,62                  0,28                0 change

  Annual Disposable Income       R133 277              R137 616            3,25%
  (2010 Constant Prices)

  Tourism Spend                  R12,9 billion         R12,1 billion       -6,20%

  Unemployment Rate              15,3%                 15,2%               -0,1% points

  Annual Expenditure             R184,1 billion        R202,2 billion      9,83%

  Annual Retail Trade Sales      R53,3 billion         R57,5 billion       7,73%

  Total Exports                  R60,7 billion         R68,0 billion       12,1%

  Total Imports                  R128,7 billion        R91,4 billion       -28,98%

Source: IHS Global Insight

                                                                                          7
Port of Durban:

      Graph 2: Containers Invoiced Quarter 1-2: 2014 vs 2015

                                        700 000                                                                       2014
                                        680 000
    Number of containers invoiced

                                                                                                                      2015
                                        660 000
                                        640 000
                                        620 000
                                        600 000
                                        580 000
                                        560 000
                                        540 000                Quarter 1                  Quarter 2
                                                                               Time

      Source: Transnet National Ports Authority

                                    The number of containers invoiced during the first two quarters of 2015 is much higher than
                                    the same period in 2014. This reflects the increase in activity at the Port of Durban.

8
Graph 3: Imports and Exports of Containerised Cargo - Port of Durban
1 400 000
1 380 000 IMPORTS
1 360 000
Number of TEU’s
1 340 000
1 320 000 EXPORTS
1 300 000
1 280 000
1 260 000
1 240 000
1 220 000
1 200 000
2010 2011 2012 2013 2014
Time
Source: Transnet National Ports Authority
The graph above shows the movement of containerised cargo through the Port of Durban in terms
of imports and exports. One can see that the level of trade with regard to containerised cargo has
decreased over the past five years, but this has picked-up somewhat since 2012. In 2014, exports were
slightly higher than the level of imports, this occurring for the first time in five years.
Graph 4: Aircraft Movements in EThekwini: Quarter 1-2: 2014 vs 2015
1 280 000
2014
1 260 000
Total Aircraft Movements
2015
1 240 000
1 220 000
1 200 000
1 180 000
1 160 000
1 140 000
QUARTER 1 QUARTER 2
Time
Source: Airports Company South Africa
The graph shows that aircraft movements have sharply increased from the first to second
quarter in 2015. The first half of the 2014 year was rather stagnant in terms of activity.
9Dube TradePort
Volumes
Graph 5: Total Terminal Throughput: 2014 - 2015
1 600 000
1 400 000
Total tonnage
1 200 000
1 000 000
800 000
600 000
400 000
200 000
0
Jul Aug Sep Oct Nov Dec Jan Feb Mar Apr May Jun
Time
Source: Dube TradePort Corporation
The graph shows the activity at Dube TradePort with regard to domestic and international
terminal throughput. The activity has been relatively consistent during the past few months,
but this has increased since December 2014.
EThekwini: Unemployment
Insurance Fund
Graph 6: UIF Applications Quarter 1 to 2: 2014 vs 2015
40 000
35 000 2014
Number of Applications
30 000
2015
25 000
20 000
15 000
10 000
5 000
QUARTER 1 QUARTER 2
Time
Source: Department of Labour
UIF applications were much higher in 2014 than in 2015. There has also been a slight decline
in the number of applications submitted since the first quarter of the year, following a similar
trend to the previous year.
10South African Revenue
Service
Graph 7: Number of Individual Taxpayers, Per Province
2 000 000
1 500 000
1 000 000
500 000
0
pe
e
ng
al
po
ga
t
pe
pe
ce
es
at
at
in
an
Ca
te
Ca
Ca
po
W
St
N
ov
au
al
u-
Lim
th
ee
n
n
rn
Pr
m
G
er
er
ul
or
te
Fr
pu
aZ
st
th
n
N
es
ow
Ea
or
M
Kw
W
N
kn
Un
2012 2013
Source: South African Revenue Service
The graph above indicates the change in the number of taxpayers, per province,
between 2012 and 2013. This is determined by using residential addresses declared
by taxpayers in their returns (the ‘unknown province’ indicates taxpayers who
provided insufficient information to determine in which province they reside). It is
likely that migration between provinces and the lack of information about some
taxpayers may explain the general decrease in the number of individual taxpayers
between 2012 and 2013. Also, between 2012 and 2013, the PIT tax brackets had
been increased, to partially compensate for the effects of fiscal drag or inflation.
The greatest proportion of individual taxpayers (36%) reside in the Gauteng province,
followed by the Western Cape and KwaZulu-Natal with 16% and 14% respectively.
11Company Income Tax (CIT)
Assessed, Per Sector (2012)
Graph 8: CIT assessed, Per Sector (2012)
4%
Community, social,
personal services
5%
All other sectors
8%
Transport, storage,
communication
9%
Mining and quarrying
37%
Financial intermediation,
insurance, real estate,
business services
15%
Wholesale/retail trade,
catering, accomodation
22%
Manufacturing
Source: South African Revenue Service
Company Income Tax (CIT) is levied on the taxable income (gross income less
exemptions and allowable deductions) of companies and close corporations. After
PIT and Value Added Tax (VAT), CIT has been the third-largest contributor to total
income revenue for the past decade. It is important to consider which sectors
contribute the most in terms of CIT assessed in 2012. The graph above illustrates
that the sector with the greatest national proportion of CIT assessed in 2012 was
the financial intermediation, insurance, real estate and business services sector
(37%), followed by the manufacturing sector (22%) and the wholesale/retail trade,
catering and accommodation sector (15%).
The following tables indicate that the number of taxpayers in the eThekwini
Municipality decreased between 2012 and 2013. This decrease may be attributed
to outward migration, the amendments to the PIT thresholds, retrenchments or
individuals voluntarily exiting the workforce. During the same period, the value
of tax assessed and the average tax income has increased. This is possibly due to
salary adjustments which were above inflation, possible upward social mobility and
greater compliance. It can also be seen that individuals in eThekwini Municipality
are responsible for more than half of the taxable income and tax assessed in
KwaZulu-Natal.
12Table 2: PIT Taxpayers in EThekwini Municipality
No. of taxpayers Taxable income (R million) Tax assessed (R million) Average tax income (Rands)
2012 416 787 77 567 14 596 186 106
2013 376 132 83 912 15 257 223 092
Source: South African Revenue Service
Table 3: EThekwini PIT Taxpayers as a Percentage of KwaZulu-Natal PIT Taxpayers
No. of taxpayers Taxable income Tax assessed
2012 54,1% 57,4% 59,9%
2013 53,2% 57,0% 60,3%
Source: South African Revenue Service
Company Registrations - CIPC: Company, Close Corporation
and Co-operative Registrations
Graph 9: CIPC Registrations
261 065 253 683 240 781
222 146
179 922
121 768
59 731
27 358 26 334 27 530
6 504 9 279 8 109 15 340 0 21 515 0 21 330
2008 - 2009 2009 - 2010 2010 - 2011 2011 - 2012 2012 - 2013 2013 - 2014
Campanies Close Corporations Co-operatives
Source: Companies and Intellectual Property Commission
13The Companies and Intellectual Property As at the end of June 2015, business
Commission (CIPC) recorded increases in confidence decreased by 2,3 index
the number of companies registered from points to 84,6 points (this is a decrease
222 146 in 2012/13 to 240 781 in 2013/14. from 86,9 points in May 2015), reflecting
a continuation of the downward trend in
The number of registered co-operatives business confidence, as illustrated in the
has increased significantly from 6 504 adjacent graph. As compared to June
in 2008/09 to 21 330 in 2013/14. This 2014, the BCI in June 2015 is 5,1 points
increase may be attributed to the lower.
discontinuation of close corporation
registration in 2012/13. Most importantly, the June 2015 BCI is the
lowest level of business confidence since
These increases in company and co- the low of 83,9 in January 1999 (a 16-year
operative registrations are a positive sign low). The June 2015 BCI is 37 index points
for economic growth, as they indicate lower than the highest recorded index of
that a greater number of individuals are 121,9 of December 2006.
engaging in entrepreneurial activities
and illustrate the relative ease of formally This significantly low level of business
registering a business entity. confidence may be attributable to a host
of factors, namely:
SACCI Business • The notable Balance of Payments
Confidence Index (BoP) deficit;
• The slowing of net financial inflows;
The South African Chamber of • The notable depreciation of the
Commerce and Industry (SACCI) Rand (between May 2015 and June
produces a Business Confidence Index1 2015, the Rand depreciated by 3,1%,
(BCI), a composite weighted index, which as opposed to depreciation between
is compiled from a number of economic June 2014 and May 2015 of 0,6%);
and market indicators. • The combination of a slowing
economy and high Government
There are 13 sub-indicators which are and household debt levels, which
used to compute the SACCI BCI. have both contributed to restraint in
recurrent spending;
This index, thus, reflects the prevailing • The slowing of real gross domestic
market-related business climate, i.e. fixed investment. This is a serious
it does not reflect the opinions of concern, as this type of investment is
businesses, but rather, it reflects what essential to enhancing infrastructure
businesses are experiencing and investment and ensuring that
how they are reacting to economic infrastructure projects are completed
developments in the market. on time; and
• Load-shedding, delays in bringing
The index, thus, reflects the net results of new electricity capacity onto the
positive and negative developments in grid and the inflationary impact of a
the general market and economy. substantial electricity tariff increase.
1
The SACCI Business Confidence Index was first published in 1985 and its method of calculation
has been updated numerous times since then, with the latest revision occurring in February 2010.
14SACCI Business Confidence
Index (Average)
Graph 10: Average SACCI Business Confidence Index
120
110
100
90
80
70
60
50
40
2008 2009 2010 2011 2012 2013 2014 2015
Average SACCI Business
Confidence Index
Source: South African Chamber of Commerce and Industry
Patents
The number of patent applications in most notably between 2011 and 2013, the
a country is indicative of the amount of number of applications lodged abroad has
investment which has occurred in research increased significantly, as opposed to those
and development activities. lodged locally.
A high number of patent applications may The graph that follows illustrates South
also illustrate an environment of innovation. African patents per field of technology.
It indicates that there is not a specific
The graph below illustrates the number sector where the vast majority of patents
of patent applications for South Africa are granted, as almost 47% of patents fall
and differentiates between applications outside the traditional sectoral categories.
which were lodged locally, i.e. resident
applications, and those which were lodged The most prominent sectors for South
internationally, i.e. abroad. African patents are civil engineering (7%),
materials and metallurgy (6%), chemical
While the total number of patent engineering (6%), basic materials chemistry
applications has appeared to increase, (6%) and medical technology (6%).
15Patent APPLICATIONS
Graph 11: Number of Patent Applications in South Africa2
2 500
2 000
1 500
Abroad
Resident
1 000
500
0
1999 2000 2001 2002 2003 2004 2005 2006 2007 2008 2009 2010 2011 2012 2013
Source: World Intellectual Property Organisation
South African Patents (by Field of Technology)
Graph 12: South African Patents Filed (per Field of Technology)
7% Civil Engineering
6% Materials Metallurgy
6% Chemical Engineering
6% Basic Materials Chemistry
6% Medical Technology
5% Handling
5% Other Special Machines
4% Furniture and Games
4% Electrical Machinery, Apparatus, Energy
4% IT Methods for Management
47% Others
Source: World Intellectual Property Organisation
2
This data was obtained from the World Intellectual Property Organisation (WIPO), and as the data
requires verification, it may only be supplied with a two-year lag.
16Real Estate
Average Home Prices
A recent analysis by HomeBid of some Johannesburg is the most expensive at
136 000 homes, transferred in the various R1 566 017, followed by Cape Town at
deeds offices during the first half of 2015, R1 492 551. Average home prices in Durban
revealed that the average home price in closely follow Cape Town at R1 448 251.
Graph 13: Average South African Home Prices (Rand)
180 00000
160 00000
140 00000
120 00000
100 00000
80 00000
60 00000
40 00000
20 00000
0
rg
wn
n
ia
nd
n
on
th
le
ba
ie
or
ng
be
bu
nd
Ra
To
nt
et
ur
ia
iza
es
fo
Lo
Pr
st
D
pe
Tr
nn
m
El
Ea
st
Ca
al
oe
ha
rt
Ea
Va
Po
Bl
Jo
Source: HomeBid (2015)
Office Vacancy Rates
Office vacancy rate data from SAPOA reveals This is an improvement on the previous
that eThekwini Municipality has the second year. It shows increasing confidence in
lowest office vacancy rate amongst the five the Durban CBD. The City of Cape Town
major municipalities, with a vacancy rate of boasts the lowest office vacancy rate of 8,3%.
10,2%, at the end of June 2015.
Table 4: Office Vacancy Rates Across South African Metropolitan Municipalities
Location Office vacancy rate (%)
Nelson Mandela Bay Municipality 14,7%
City of Johannesburg 11,3%
City of Tshwane 10,6%
eThekwini Municipality 10,2%
City of Cape Town 8,3%
Source: SAPOA (2015)
17A Closer Look
at Utilities and
Smart Cities
Smart Cities Globally include the establishment of effective,
safe and affordable public transport,
Cities are defined as ‘smart’ when producing sufficient energy to support
substantial investments are made in industry, while reducing carbon emissions
human and social capital, including both and interventions to ensure environmental
traditional and modern services, all of which sustainability and resilience to future shocks.
is meant to ensure sustained economic The Energy Efficiency Demand Side
development and a high quality of life. A Management (EEDSM) Programme was
global awareness that our natural resources also initiated by National Government for
are finite, together with the anticipated the purpose of achieving greater energy
impacts of climate change and a growing efficiency. The programme is funded by
population that is placing increasing National Treasury and focuses on reducing
burdens on cities has pushed the ‘smart city’ energy consumption in municipal-owned
concept onto centre stage. There appears and operated infrastructure. To date R115
to be a collective paradigm shift on how million has been spent on eThekwini-owned
we think about utilising scarce resources facilities. These include traffic and building
in a smart or meaningful way. At a built lighting.
environment metropolitan level, there
are six core systems, comprising people, The major cities in the country have
embarked on significant initiatives in the
business, transport, communication, water
transport and ICT sectors to enhance
and energy.
movement and communication. The City
of Johannesburg has taken control of
In a smart city, therefore, these six core
its broadband network after the Council
systems and other key services would be
approved the creation of a municipal-owned
managed harmoniously to support the
entity to roll-out free, high-speed internet to
smooth operation of critical infrastructure,
townships and in all public spaces in order
while providing for a clean, economic and
to unleash entrepreneurial potential and to
safe environment in which to live, work
create jobs.
and play. Globally, there is an outpouring
of initiatives from cities, regional blocs,
The City of Cape Town launched the Smart
international institutions (such as the World
Cape project more than a decade ago,
Bank and OECD) on smart city concepts. with the goal of ensuring that all residents
According to the World Bank, 75% of the have free access to basic information and
infrastructure that will exist in 2050 is yet to communication technologies. To date there
be built, so the actions taken now will shape are 3 000 registered Smart Cape users and
urbanisation patterns and quality of life for the initiative was awarded the $1 million Bill
many decades. & Melinda Gates Access to Learning Award
in 2003.
Smart Cities Nationally
There are several other ‘smart’ ideas
The National Development Plan (NDP) undertaken by numerous entities in
has identified all the components of a both the private and public sectors to
‘smart city’ as key developmental points make operations and service delivery
that will position the country as a globally more efficient in their region. These are
competitive location. Some of these mentioned elsewhere in this publication.
18Smart Cities Locally two 150kW turbines from Bremen to
Durban. They will be used to assess the
The eThekwini Municipality has several impact of wind energy on the local grid
smart city initiatives on the go. These infrastructure and to better understand
include energy, transport, ICT and learning. the environmental impacts of wind
In many instances, the city strives to address energy within the local context, which
the injustices of the past in tandem with will provide useful data for wind energy
smart city concepts that relate to skills development in KwaZulu-Natal.
enhancement, land reform, alternative
energy sources for human settlements and • A project named Eos (named after the
industry and to ensuring that historically Greek Goddess of the Dawn) is aimed
disadvantaged townships are synergised at promoting the use of embedded
with the main-stream economy. rooftop solar photovoltaics (PV) in
eThekwini. The project will allow
The eThekwini Municipality’s Energy Office the Municipality to obtain first-hand
(EO), established in 2008 is mandated to knowledge in understanding the
address climate change mitigation and is barriers to PV from which to test local
considered a leader in this sector at a Local policies and regulations.
Government level and is currently involved
in a comprehensive suite of activities: • The Durban Solar Map is an interactive
tool linked to the Durban Solar City
• The EO has determined that Framework that allows one to view
the municipal region emitted an aerial image of one’s property,
approximately 29 billion tons of carbon where the tool is able to automatically
dioxide equivalents (tCO2e) from calculate basic technical information,
transport, industrial, residential and such as size, cost, and the like
commercial activities during 2012. for a PV installation (http://www.
The EO has introduced key measures durbansolarmap.co.za/viewer/).
to decrease emissions in order to
reach the targets set in the eThekwini EThekwini is also trying to revolutionise
Municipal Energy Strategy of 2008. its transport sector to provide a flexible,
These include the Durban Climate safe and cost-effective transport service for
Change Strategy that aims to provide people with the launch of Go!Durban. This
guidance for the city as a whole, to is the Integrated Rapid Public Transport
mitigate against and adapt to climate Network (IRPTN) that will make transport
change. Another project relates to the universally accessible to Durban’s citizens.
eThekwini Eco-Industrial Park that aims
to establish an eco-industrial park that The core objective is to provide seamless
will serve as a dedicated commercial transfers across transport modes, by
and industrial zone within the Cornubia creating ease of access at stations and
development. This project has two precincts and by using electronic ticketing
objectives, namely to develop a and providing passenger safety and security.
climate-neutral eco-industrial park The provision of transport is intrinsic to
within eThekwini that promotes cleaner the creation of a vibrant, liveable and
production, pollution prevention, sustainable city, in line with the City’s vision.
energy efficiency, renewable energy
and inter-company partnering and, The eThekwini Municipality has ensured
in addition, to promote the green that it adheres to technological advantages
technologies and services sector in the communications field by launching
to supply directly into the broader the Smart Community initiative, which
Southern African Development is a smartphone application that allows
Community (SADC) region. customers to interact with the Municipality.
• Another initiative of the EO relates Residents who own smart phones or tablets
to wind re-powering. This is a are able to download this app from Google
collaborative exercise between the Play and the Apple Store which they may
Bremen Overseas Research and then use to report faults using GPS to record
Development Association (BORDA) accurate locations, view emergency contact
and the Municipality. It involves the numbers and receive their revenue balances
transportation and installation of and municipal alerts.
19Looking Ahead Smart Cities in Utilities: A
Broad Framework - What,
• What could cities do to become
Why and How?
smarter? The IBM Institute for Business
Value presents an excellent set of
The International Smart City Council
recommendations in its ‘A Vision for
acknowledges that the smart city sector is
Smarter Cities’. Firstly, it mentions without a universally agreed definition; it is
that there is recognition that cities still in the ‘I know it when I see it’
must work seamlessly across their own phase3.
organisational boundaries and partner
with other spheres of Government, While there is still indistinctness in the
as well as with the private sector and definition or exact denotation of a smart city,
civil society. Secondly, cities need to the global, intuitive understanding, is that a
be more than just focused or efficient; smart city is one that services its population
it will require the next generation of using innovative and smart technologies,
city to emerge - one based on smarter through smart human resources.
systems that are interconnected and
where people and objects interact in Why is this important in eThekwini? The
entirely new ways. Thirdly, the smart city World Economic Forum reports that more
must target all the inter-relationships than half of the world’s population now lives
between systems and requires a holistic in urban areas4.
strategy that addresses all factors.
This is likely to grow to two thirds of the
• The smart city scenario is not without world by 20505.
its challenges, especially for South
African cities still feeling the impact EThekwini Municipality, being a
of apartheid planning, poverty, lack of metropolitan municipality surrounded by
employment opportunities and low rural catchments, can only expect to attract
skills levels. The eThekwini municipal much of the rural to urban in-migration.
region is also 60% rural, which means
that a huge social burden is placed on With fixed land space and resources and
the urban centres as people continually increasing populations, Local Governments
migrate there in search of employment. and cities globally have been struck with
The focus to implement smart ideas an urgency to provide systems to cater for
for urban areas may also ignore the migration of this nature.
potential to seek sustainable initiatives
in rural regions. EThekwini is certainly no exception and the
increasing population calls for a deviation
• Smart city concepts rely heavily from the business-as-usual provision of
on the application of information services, to smarter forms of service delivery.
communication technologies (ICT) that
may incur huge set-up costs which may The following graph indicates the pressure
be quickly rendered obsolete, given the on service delivery as eThekwini’s household
dynamic pace at which things change population increases.
in this sector. This may place a financial
burden on cities to constantly adhere to The graph illustrates the increasing
these technological changes over time. percentage of households not serviced with
utilities.
• Another challenge is the high level
of big data collection and analysis The increase throughout the years is an
required for smart city planning. These indication of the high in-surge of (and
may have negative impacts on privacy, internal growth of) households in eThekwini.
due to predictive policing and may
infringe basic human rights. It indicates that between 2010 and 2014,
70%, 74% and 74% of the additional
• Smart cities will need a highly literate increase in households were not serviced for
population with technological savvy. weekly refuse removal, electricity and water
Until all are techno-savvy, what happens respectively, although not all households
to those who are not? were formal structures6.
20Nonetheless, the increase in new households not adequately serviced with utilities has been on the rise since 2009, setting a
clear case for the development of innovative and smarter methods in utilities provision.
Graph 14: EThekwini Service Delivery Pressure Indicator
80%
71% 74%
70%
74% % Increase of
60% households, less
54% 70% increase of
50% households provided
with electricity
40% connection
33%
30%
20%
% Increase of
10% households, less
increase of
0% households provided
1995 - 1999 2000 - 2004 2005 - 2009 2010 - 2014 with on-site water
connection
Source: Quantec Development Indicator Data, 2015
http://smartcitiescouncil.com/smart-cities-information-center/definitions-and-overviews
3
4
Part 2: Risks in Focus: 2.3 City Limits: The Risks of Rapid and Unplanned Urbanisation in Developing Countries; http://reports.weforum.org/
global-risks-2015/part-2-risks-in-focus/2-3-city-limits-the-risks-of-rapid-and-unplanned-urbanization-in-developing-countries/
5
Part 2: Risks in Focus: 2.3 City Limits: The Risks of Rapid and Unplanned Urbanisation in Developing Countries; http://reports.weforum.org/
global-risks-2015/part-2-risks-in-focus/2-3-city-limits-the-risks-of-rapid-and-unplanned-urbanization-in-developing-countries/
6
Informal structures; e.g. informal settlements; are by nature unplanned by the City, and often erected on difficult terrain. They are therefore
predominantly both unserviced, and difficult to service, where resources to do so become available. This decreases the ability of the City to
adequately provide utilities to these households; therefore decreasing their possibility of ever being serviced. This may skew the percentage
of the increase in households not serviced.
21Electricity
The state of electricity supply and capacity has manifested itself in the form of
distribution in eThekwini Municipality is as increased electricity tariffs. This is evidenced
follows. by the 78% increase, in real terms, of the
price of electricity between 2008 and 201112.
The Cost of Electricity
The table below shows the increase in
The under-investment in generating electricity prices over the past five years
capacity, combined with economic growth and the table that follows shows estimated
and the extension of electricity to previously increases for the next five years. It must
under-serviced areas, has resulted in be stated that the forecasts are purely
demand outstripping supply. deductions, based on past trends and
should not be deemed accurate in any way.
Now, while municipalities only have a
constitutional mandate to distribute However, should these figures materialise
electricity, the consequence of this historic in the future, the eThekwini Municipality
under-investment in electricity generation increase would be realistic.
Table 5: Percentage Tariff Increase
Percentage Tariff Increase
Financial Year EThekwini: 01 July Eskom: 01 July
2015/16 12,2 14,24
2014/15 7,39 8,06
2013/14 5,50 8,00
2012/13 11,00 13,50
2011/12 19,80 26,71
2010/11 25,00 28,90
Source: EThekwini Electricity Unit
Table 6: Percentage Tariff Increase
Scenario: Projected Percentage Tariff Increase
Financial Year EThekwini: 01 July Eskom: 01 July
2016/17 8,0 8,0
2017/18 8,0 8,0
2018/19 14,0 16,0
2019/20 14,0 16,0
2020/21 14,0 16,0
2021/22 14,0 16,0
Source: EThekwini Electricity Unit
12
Eskom. 2012. Overview of multi-year price determination, 2013/14-2017/18. Available online:
http://www.eskom.co.za/CustomerCare/MYPD3/Documents/1MYPD3PartOne19102012Website.pdf
22These increases are only estimates and will of electricity (in eThekwini Municipality,
change, based on costs, as approved by the electricity charges are the largest revenue
Municipal Council and/or the Regulator. source at R11,8 billion, or 35,6% of total
revenue), but Municipalities also spend a
To ensure a stable electricity price path in significant amount of their operating budget
South Africa, Eskom has implemented a on the provision of electricity services.
Multi-Year Price Determination. This means
that Eskom forecasts its costs and income Since the price at which Municipalities
for a five-year period and, based on these distribute electricity is regulated,
assumptions, details a price increase for Municipalities are constrained with regard
the next five years. This ensures that there to the extent that the higher bulk purchase
is predictability and certainty in electricity price, paid to Eskom, may be passed-on
prices in the country. MYPD3 was the last to consumers and this, in turn restricts the
determination and was capped at 8% per municipal capital budget available to invest
annum from 2013 to 2018. in new electricity infrastructure.
Eskom has found itself cash-strapped and When this is considered in conjunction with
applied to the regulator for a selective the mounting theft of electricity, as a result
re-opener to the MYPD3 in May 2015. The of illegal electricity connections, and the
motivation underpinning the application social mandate of Municipalities to
was for a further increase in tariffs to provide free basic electricity, the ability of
purchase additional diesel that could be Municipalities to supply electricity which
used to operate the Open Cycle Gas is secure, stable and affordable is severely
Turbines (OCGT) for longer durations during diminished.
the day. This will allow for a reduction of
load-shedding in the country. The eThekwini Municipality’s electricity
tariff increase for the 2015/16 year has been
Rising electricity tariffs have significant set at 12,2%, while Eskom’s bulk purchase
implications on the budget and operations increase for the same period is 14,24%.
of Municipalities. It is well-known that The lower municipal tariff is indicative of
Municipalities generate a significant amount the Municipality’s commitment towards
of their revenue from the distribution drawing-up a pro-poor budget.
Table 7: EThekwini Municipality and Electricity: Fast Facts
Number of electricity customers 738 593 (2 000 square kilometre area)
Total electricity sales 11 412 GWh
Maximum electricity demand 1 800 MW
Voltage 275 kV
Electricity infrastructure spend (major capital programme in R836,5 million
the 2015/16 medium-term capital budget)
Electricity infrastructure maintenance budget R1 032,3 million
Provision of new staff R15 million
Eskom electricity tariff increase 14,24%
EThekwini Municipality electricity tariff increase 12,2%
Loss in distribution 6,1%
Collection rate 97,5%
Source: EThekwini Electricity Unit
23Challenges in the as long as in OECD high-income countries.
distribution of electricity While the process for obtaining a new
electricity connection for businesses is
Electricity distribution by Municipalities fairly standardised across South African
is often fraught with challenges, mostly Municipalities, there are differences in
stemming from the need to balance the length of processes and the cost of
revenue generation with the costs of connections. In Mangaung, (South Africa’s
distribution and infrastructure maintenance. best-performing Municipality, in this study)
Hunsley13 (2014) identifies eight key obtaining an electricity connection requires
challenges experienced by eThekwini four procedures, takes 80 days and costs
Municipality’s Electricity Department: 383,2% of income per capita, while in
eThekwini, obtaining a new electricity
1. Provision of electricity to customers connection requires five procedures, takes
1. located in informal settlements; 98 days and costs 380,2% of income per
capita.
2. Theft of infrastructure;
In recent years, however, two key concerns
3. Theft of electricity; for the eThekwini Municipality have been
the theft of electricity and load-shedding.
4. Ageing networks, with increasing
4. maintenance costs and poor With regard to the cost of electricity, it is
4. maintenance practices; estimated that illegal connections cost the
Municipality about R150 million per annum.
5. Unplanned outages as a result of
4. overloaded networks; This may be attributed to the fact that
the existing electricity service backlog is
6. Lack of institutional memory; 265 989 houses, as well as the expansion
of informal settlements adjacent to key
7. Legacy information technology systems, economic nodes. In a bid to mitigate the
4. with fragmented applications; and theft of electricity, the City has attempted
to minimise the losses of electricity
8. Increasing compliance requirements through an interim services programme,
4.with respect to the quality of supply with the objective of electrifying informal
4.and service, finance, health, safety settlements.
4. and environment.
Load-shedding and its
In addition, a frequent concern raised by the impact on the
private sector is the difficulty experienced in private sector
obtaining a new electricity connection.
Load-shedding occurs when there is
The World Bank’s Doing Business in South insufficient electricity generation capacity to
Africa 201514 study finds that across South meet the demand for electricity.
Africa, obtaining an electricity connection
requires five procedures and takes To cope with this in an ordered fashion,
approximately 141 days. Municipalities have devised rotational
schedules to spread the burden of load-
The cost of obtaining this connection is shedding amongst its electricity customers.
472,8% of national income per capita. While Early in 2015, the Department of Public
the number of procedures it requires to get Enterprises estimated that the cost of
a connection in South Africa is on par with load-shedding to the national economy
OECD high-income countries, the time was between R20 billion and R80 billion per
taken to complete the procedures is twice month15.
13
Hunsley, J. 2014. Journey towards a smart utility: an eThekwini Electricity perspective. Available online:
http://www.ameu.co.za/Portals/16/Conventions/Convention%202014%20Papers/Jonathan%20Hunsley,%20
eThekwini%20Municipality.pdf
14
The World Bank. 2015. Doing business in South Africa 2015. Available online: http://www.doingbusiness.org/
SouthAfrica
15
Mahomed, N. 2015. The effects of load shedding, July 2015. Draft paper, Trade & Investment KwaZulu-Natal.
24These losses to the economy are dependent The survey also recorded trends in coping
on the stage of load-shedding, with stage 1 strategies adopted by businesses to
being 10 hours of blackouts for 20 days per manage the impact of load-shedding on
month, costing R20 billion per month, stage their operations. The survey found that 86%
2 costing R40 billion per month and stage 3 of firms now made use of Uninterruptible
costing R80 billion per month. Power Supply (UPS) battery back-up
systems, while 47% of firms had installed
It is difficult to quantify the exact costs of generators. It was also found that 42% of
load-shedding to the private sector, as the businesses were engaging in contingency
losses go beyond lost units of production. plans, which included adopting flexible
working hours and enabling staff to work
The losses experienced by the private sector from home, and 11% of firms had reduced
include inconveniences caused by delays, their total number of operating hours. In
idle staff, spoiled stock, lost sales and, terms of long-term strategic interventions,
essentially, the opportunity costs of more than half the firms stated that
time wasted. renewable energy is now something that
their companies were looking to pursue.
In June 2015, BDO South Africa16 released
the results of a load-shedding survey, Renewable energy
administered to businesses17 of varying
generation: an option for
sizes, in the Durban area. The key findings of
the survey are captured in the table below: eThekwini?
Key findings of the BDO load-shedding While it would seem appropriate for the
survey in Durban Municipality to encourage the private sector
• All firms which were surveyed to engage in renewable energy production
to mitigate the costs associated with
believed that concerns about the
load-shedding, the broad-based adoption
future security of South Africa’s
of renewable energy technologies by
electricity supply impacted negatively
municipal electricity customers could have
on investor confidence.
a potentially negative impact on municipal
• 47% of firms reported that electricity
electricity revenues and municipal revenue
disruptions had a negative effect in
in general. In February 2014, Sustainable
their operating costs and 59% of firms Energy Africa released a report entitled, the
reported that electricity disruptions Impact of Localised Energy Efficiency and
had an adverse impact on service Renewable Energy on eThekwini Finances
delivery. over the Next Ten Years18.
• With regard to the frequency of
load-shedding, for 86% of firms, the The Report found that the installation of
average period of load-shedding photovoltaic technologies in all sectors
lasted two to four hours and for the is only likely to occur in the eThekwini
remaining 14% of firms, load-shedding Municipality from 2024, as the costs of the
lasted less than two hours. technology become financially feasible for
• 41% of firms reported losing between consumers to install. The report states this
five and 20 operating hours in the past will result in expected operational revenue
three months, 37% of firms reported losses for the eThekwini Municipality in the
losing 21 to 40 hours and 7% of firms range of 8% to 15%, less than business-as-
reported losing more than 100 hours. usual, and these losses are only expected
• Load-shedding was found to have a to occur in 10 years. With growing support
high or medium impact on the turn- for carbon-conscious economic growth, the
over of 42% of businesses and on the Municipality must support the move towards
competitiveness of 56% of firms. the generation of renewable energy.
16
BDO South Africa. 2015. Durban firms hit hard by load shedding fear lower investor confidence and
lower global competitiveness. Available online: http://www.bdo.co.za/load-shedding-survey/BDO-
Survey-gauges-Load-shedding-Impact-Durban.pdf
17
Of the organisations surveyed in the Durban region, 69% were classified as small with up to 100
employees, 25% were medium-sized, employing between 101 and 2 000 people, and 6% were large
with between 2 001 and 25 000 employees
18
Sustainable Energy Africa. 2014. Impact of Localised Energy Efficiency and Renewable Energy on
eThekwini Finances over the Next Ten Years. Available online: http://www.durban.gov.za/City_Services/
energyoffice/Documents/eThekwin%20Revenue%20Impact%20Report.pdf
25However, it must do so in a prudent fashion Eskom Applications
to ensure that electricity revenues are to NERSA
proactively managed.
In April 2015 the National Electricity
There are three strategies mentioned in Regulator in South Africa (NERSA)
the Sustainable Energy Africa Report to announced the approval of an average
protect electricity revenue for the eThekwini annual price increase for electricity.
Municipality, namely:
NERSA has also approved Eskom’s request
1. A decoupled electricity tariff, where to change the time of use (TOU) peak
the consumer pays an energy charge period during winter.
(which will cover Eskom charges) and a
fixed charge (to cover the Municipality’s Subsequently, an additional appeal
cost of distribution). This option is from Eskom was submitted to NERSA
favourable as it secures the eThekwini to increase the price again by 9,58%, in
Municipality’s business model, while order to contribute to the more than R40
simultaneously encouraging private billion needed by Eskom to supplement its
sector investment in energy efficiency generation capacity with open-cycle gas
technologies and renewable energy turbines, and R19,9 billion for its short-term
production. power-purchasing programme.
2. A national feed-in tariff (NETFIT),
funded through the Renewable This proposed increase, if approved, would
Energy Independent Power Producer have amounted to 22,27% for the 2015/16
Programme (REIPPP), which would be year.
managed by Eskom. This will allow the
Municipality to be compensated for any However, the approved changes for non-
lost revenue as a result of photovoltaic local authority tariffs commenced on 1 June
installation, and recompense any 2015 and on 1 July 2015 for local-authority
excess generation from photovoltaic tariffs.
customers.
This is shown in the table below.
3. Grow the customer base for electricity
in the eThekwini Municipal region.
Table 8: Changes to Time of Use Periods
Previous morning TOU peak period Current morning TOU peak period
07H00 - 10H00 06H00 - 09H00
Previous evening TOU peak period Current evening TOU peak period
18H00 - 20H00 17H00 - 19H00
Source: National Energy Regulator of South Africa
26EThekwini Electricity incidents. Cable thieves export the cables
Unit – Challenges and from South Africa to other parts of the
world and this has negatively impacted
Opportunities the economy. The indirect cost of this is
estimated at about R5 billion a year.
EThekwini Municipality’s Electricity Unit
supplies more than 700 000 customers. Transnet reported that from 2008 to
Large electricity users within eThekwini 2009 there were 6 917 incidents of cable
Municipality make up 44% of electricity theft, valued at R95,5 million, resulting in
consumers, with the Municipality generating exports. Due to the large loss and decline
38% of revenue from sales in the 2013/14 in GDP, in 2008 the South African Revenue
financial year. Large customers pay Service introduced a mobile x-ray scanner
fixed charges and this will possibly be located inside the Durban Container
implemented for residential customers at a Terminal precinct as part of South Africa’s
later stage. participation in the US Container Security
Initiative. Every container moves through the
EThekwini Electricity faces numerous scanner before shipment.
challenges, such as illegal connections,
cable theft and vandalism of infrastructure, EThekwini Municipality is also attempting
non-paying customers and ageing to implement various solutions to reduce
infrastructure. vandalism and cable theft.
Cable theft and vandalism of infrastructure The following are some of the solutions
is very costly to the Municipality. The City in place:
has researched and reported that offenders
of most of the vandalism and theft cases • Installed alarm and pepper gas
are both amateur cable thieves, referred to system over the past three years
as ‘bread and butter’ offenders, as well as in sub-stations;
syndicates. The amateur thieves steal short
cable lengths, whereas syndicates steal • SCADA devices to detect faults;
longer lengths. The hotspots for cable theft
constantly change throughout the City. • Vibration monitoring systems have
been installed on pylons - detects
Durban is currently the third ranked city in frequency when someone tries to
South Africa with regard to cable theft cut into it.
Table 9: Costs and Incidents
Year Cost of infrastructure Incidents
2012/13 R60 542 587 13 471
2013/14 R22 797 395 3 619
2014/15 R30 924 335 8 573
Source: EThekwini Electricity Unit
The table above shows that since 2012/13 there has been a radical change with regard to cable
theft. The number of incidents is likely to decline in the future as a result of the measures that
the City is implementing.
27You can also read