Results for the Half Year Ending July 2018 - Next Plc
←
→
Page content transcription
If your browser does not render page correctly, please read the page content below

Results for the Half Year Ending July 2018
CHIEF EXECUTIVE’S REVIEW
INTRODUCTION & DOCUMENT STRUCTURE
INTRODUCTION
First half full price sales were up +4.5% on last year. This was ahead of the +1.0% guidance given in
January and the +2.2% given in May. When we issued our August Trading Statement we believed that
there was a high risk that the sales gained in July would be offset by losses in August. As it turned out,
we did not experience any material loss of sales in August or early September, so we are now raising
our central guidance for full year profit before tax by +£10m to £727m. This is broadly in line with last
year’s profit of £726.1m and would deliver a growth in Earnings Per Share of +5.0%.
The UK retail market remains volatile, subject to powerful structural and cyclical changes. Many of
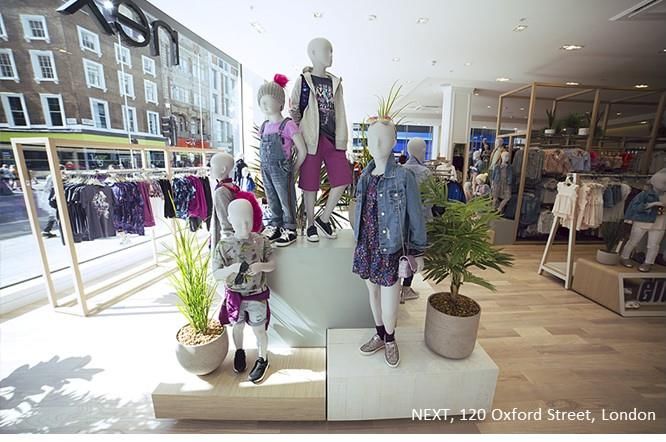
these headwinds have not abated. As expected, sales in our stores (which now account for just under
half of our turnover) continue to be challenging.
We believe the over-performance in the first half was flattered by the unusually warm summer and
we remain cautious in our outlook for the rest of the year (for more detailed guidance on outlook for
sales and profit, see page 42).
STRUCTURE OF THIS DOCUMENT
The document structure is set out in the table below. We have separated (1) the analysis of
performance in the half year from (2) our outlook and guidance for the full year. We have also added
a section detailing (3) the Company’s preparations for Brexit, focusing on the most challenging scenario
of a no-deal Brexit.
PART 1 Review of p6 This section gives a detailed description of the Group’s financial
Financial performance by business division (Retail, Online, Finance and
Performance Other Activities).
It also outlines the progress that we have made in delivering some
of the operational initiatives we outlined in our Full Year Statement
in March.
It finishes with information about the Group’s balance sheet,
financing and cash flows.
PART 2 Outlook for p34 This section describes the structural and cyclical changes affecting
Sales and our industry and our thoughts as to how these trends are
Profit developing in the current year. This section finishes with our
guidance for sales, profits and Earnings Per Share for the full year.
PART 3 Brexit p43 This section outlines the operational and administrative challenges
Preparation posed to NEXT by a no-deal Brexit. We set out NEXT’s plans to
and Impact mitigate the potential impact on our operating efficiency, product
Analysis availability, duty payments and cost base.
We also quantify the worst-case scenario increase in costs and
import duties in the unlikely event that no changes are made to the
UK’s tariff rates after a no-deal Brexit.
2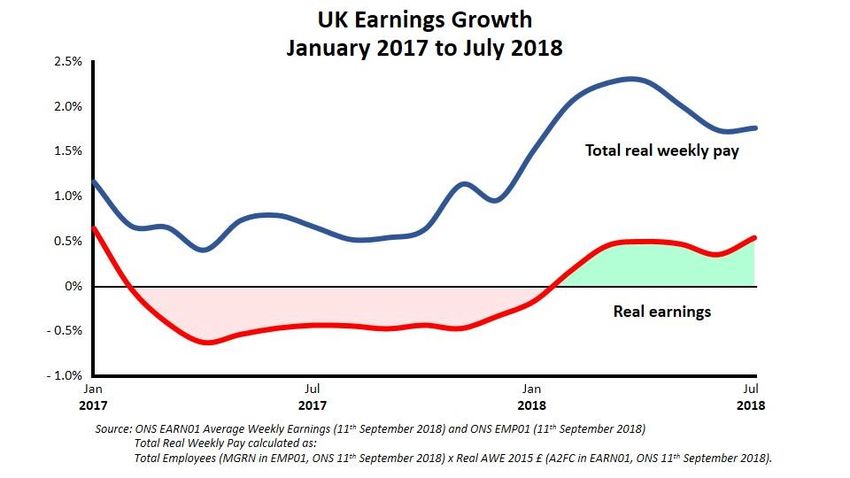
BIG PICTURE
There is a lot of detail in this document. Given the level of change NEXT is experiencing, we feel it is
important to give as full a picture as possible of how we are responding to the threats and
opportunities of a rapidly changing retail world. The summary below outlines the main themes within
the document, along with page references for further detail.

Retail in an Online World
The overarching story centres on the profound and rapid structural change in our sector, with ever
increasing volumes of sales transferring online. It is worth reflecting that 10 years ago NEXT Retail
contributed £2.2bn turnover to the Group and accounted for 67% of Group sales and profit. This year
we expect Retail sales, at just under £2bn, to contribute less than half of our Group sales and only 30%
of Group profit.
The fact that our Retail sales have only fallen by 10% in a period where like-for-like sales declined by
32%1 is because we have continued to invest in profitable new space. The disciplines we have imposed
on this investment programme have stood us in good stead. Relatively short lease terms, high
profitability hurdles, rigorous depreciation policies and a two year payback hurdle on capital invested,
collectively mean that our Retail portfolio remains very profitable (p11) and our lease commitments
relatively light (p11).
The challenge in Retail is twofold. Firstly, we need to make sure that we rigorously control our Retail
costs (p12). In particular, we must ensure that we take maximum advantage of the many lease expiries
we will experience over the next few years. Our aim is to manage rent levels and new lease terms to
match today’s levels of trade and volatility (p10). More importantly, we are intensely focused on
increasing the role our stores play as an integral part of our Online Platform’s delivery and returns
network.

NEXT’s Online Platform
The NEXT Online Platform consists of our customer base (p16), credit platform (p25), internal and
third-party logistics networks, warehouses and stores. It is the continued development of this Platform
that has enabled our Online sales (including interest income) to grow at a compound rate of 10% per
annum since 2008, taking it from a turnover of £816m to an estimated £2.1bn this year. We continue
to invest and innovate to accelerate the growth of this business through new digital marketing (p16),
website enhancements (p17), delivery services and broader product offers.
In terms of the breadth of our product offer, the story goes beyond simply extending NEXT branded
product ranges. Over the last ten years, we have gradually transformed our website from a single
brand site to an online aggregator of clothing, footwear and home brands. This year we expect to sell
around £370m of third-party product through LABEL (p18), a business that continues to grow and
develop.
The NEXT Brand continues to develop overseas through its presence online (p19). Sales of NEXT
branded product continue to grow strongly, both through our own international websites and local
third-party aggregators. We expect our Online Overseas business to turn over around £355m in the
current year and account for just under 20% of our Online sales (excluding Finance interest income).

1   The like-for-like sales reduction has been calculated by compounding the last 10 years’ annual like-for-like sales performance.

                                                                                                                                      3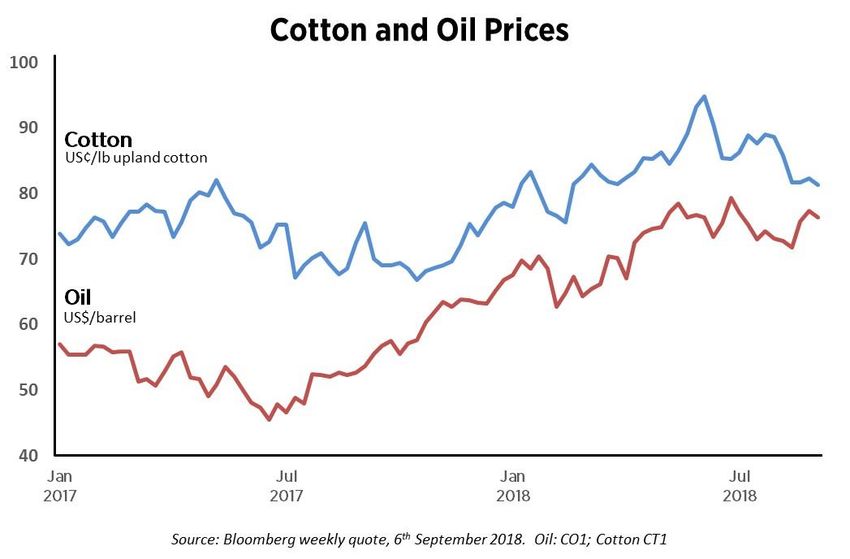
The transition from Retail to Online has not been painless and represents a continuing battle. The
juxtaposition of Retail’s fixed cost base with Online’s variable costs and lower third-party margins is
challenging. To make up for the profit on a 5% loss of sales in our Retail business, Online sales (at
current average margins) would have to grow by 8%. Of course, as our Online business grows in size,
the percentage growth required to make up for Retail’s decline will reduce. See costs of structural
change (p40).

Capital Discipline and Cash Generation
Despite the speed of change, we believe that the Group is likely to remain highly cash generative.
Looking forward, we believe that the increase in investment needed in warehousing and systems to
accommodate growth Online (p21) will broadly be matched by a decline in the levels of investment
required in our stores. We remain disciplined in our approach to the distribution of surplus cash. If
surplus cash cannot be invested at healthy returns and is not needed to develop the business, it is
returned to shareholders. This calendar year we have returned £300m to shareholders via share
buybacks, as we indicated we would in January. We estimate the share buybacks (including some
effect from buybacks last year) will enhance Earnings Per Share in the current year by 4.6%2.
In 2018/19 we now believe that we can roughly balance the bad news with good, and the most likely
outcome is for profit to finish close to last year’s performance. This, along with share buybacks, would
mean that at our central guidance Earnings Per Share would rise by +5.0% (p42).

Direction of Travel
We are often asked: “What will the high street look like in 10 years’ time?” The only honest answer to
this question is that we do not know; we can see the general direction of travel but can predict neither
the speed nor endpoint for the changes that lie ahead.
Our approach is to build as much flexibility into our operations and cost base as is possible to minimise
the negative effects of falling Retail sales and maximise opportunities for growth Online. This means
a constant process of reinvention and experimentation within our business, whilst preserving the
integrity of our brand, the calibre of our people, quality of the operations and the profitability of the
Group. The task remains extremely challenging, but with more than half of our sales now coming from
our Online and Finance businesses, it feels like we are moving in the right direction.

2   The difference between forecast post-tax profit growth and Earnings Per Share growth

                                                                                                       4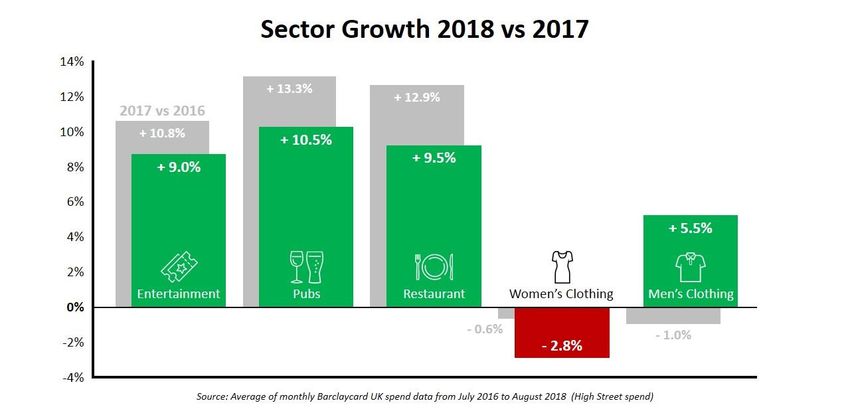
CONTENTS
PART 1 REVIEW OF FINANCIAL PERFORMANCE .............................................................................. 6
FINANCIAL OVERVIEW................................................................................................................... 6
  Changes to the Presentation of Our Divisional Results ......................................................................... 7
NEXT RETAIL ................................................................................................................................. 8
  First Half Performance - Sales and Profit .............................................................................................. 8
  Retail Space ........................................................................................................................................... 9
  Portfolio Profitability and Long Term Lease Commitments ................................................................ 11
  Managing Retail Costs ......................................................................................................................... 12
  Developing Our Stores as Part of Our Online Platform ....................................................................... 12
NEXT ONLINE .............................................................................................................................. 14
  First Half Performance – Sales, Profit and Customers ........................................................................ 14
  Focus on Marketing ............................................................................................................................. 16
  Focus on LABEL .................................................................................................................................... 18
  Focus on Overseas ............................................................................................................................... 19
  Focus on Warehousing, Infrastructure and Capex .............................................................................. 21
NEXT FINANCE ............................................................................................................................ 25
  NEXT Finance Profit and Loss Account Explained ............................................................................... 25
  Credit Customer Base .......................................................................................................................... 28
OTHER BUSINESS ACTIVITY .......................................................................................................... 29
  Lipsy ..................................................................................................................................................... 29
  International Retail and Franchise Stores ........................................................................................... 29
  NEXT Sourcing ..................................................................................................................................... 30
  Non-Trading Activities ......................................................................................................................... 30
COST INFLATION AND COST CONTROL ......................................................................................... 31
CASH FLOW ................................................................................................................................ 32
  Interest and Taxation .......................................................................................................................... 32
  Interim Dividends ................................................................................................................................ 32
  Capital Expenditure ............................................................................................................................. 33
NET DEBT AND FINANCING .......................................................................................................... 33
PART 2 OUTLOOK FOR SALES AND PROFIT ................................................................................... 34
A CHANGING MARKET................................................................................................................. 34
  (i) The General Economic Environment .............................................................................................. 34
  (ii) The Clothing Market....................................................................................................................... 36
  (iii) Structural Change – The Move Online .......................................................................................... 39
SALES AND PROFIT GUIDANCE ..................................................................................................... 41
  Outlook for Sales ................................................................................................................................. 41
  Outlook for Profits ............................................................................................................................... 42
PART 3 BREXIT PREPARATION AND IMPACT ANALYSIS ................................................................ 43
INTRODUCTION .......................................................................................................................... 44
KEY RISKS ................................................................................................................................... 44
  DIRECT RISKS ....................................................................................................................................... 45
  (i) Import Duties on Goods Arriving in the UK..................................................................................... 45
  (ii) Additional Administrative Costs of Bringing EU Stock into the UK ................................................ 48
  (iii) Import Duties for Stock Going to the EU from the UK .................................................................. 49
  (iv) Standards and Goods Regulation .................................................................................................. 51
  INDIRECT RISKS .................................................................................................................................... 51
  (i) Devaluation of Sterling .................................................................................................................... 51
  (ii) Delays at UK and EU Ports .............................................................................................................. 52
SUMMARY .................................................................................................................................. 53
APPENDIX 1 ................................................................................................................................ 54

                                                                                                                                                             5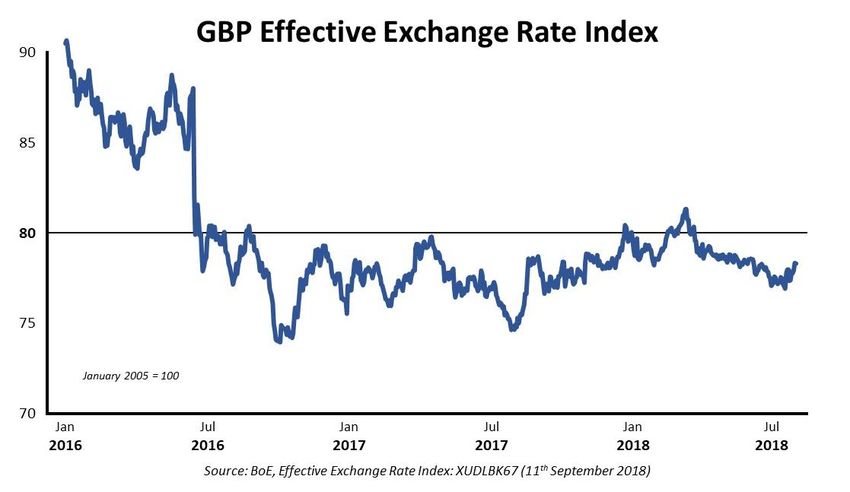
PART 1
                            REVIEW OF FINANCIAL
                               PERFORMANCE
FINANCIAL OVERVIEW
NEXT Brand full price sales3 in the first half were up +4.5% and total sales4 (including markdown) were
up +3.9% on last year. Group profit before tax was up +0.5% and Earnings Per Share (EPS) were up
+4.9%.
We are declaring an ordinary interim dividend of 55p per share, which is up +3.8% on last year.

    TOTAL SALES                                                          July 2018                        July 2017
                                                                               £m                               £m
    Retail                                                                   925.1                            993.2           - 6.9%
    Online                                                                   892.3                            764.3          +16.8%
    Finance                                                                  122.0                            108.5          +12.5%
    Brand                                                                  1,939.4                          1,866.0           +3.9%
    Other5                                                                    46.8                             48.0
    Total Group sales                                                      1,986.2                          1,914.0            +3.8%
    Statutory revenue                                                       1,961.9                         1,902.36

    PROFIT and EPS                                                        July 2018                      July 20177
                                                                                 £m                             £m
    Retail                                                                      73.2                           95.1          - 23.0%
    Online                                                                    163.3                          134.8           +21.2%
    Finance (after funding costs)                                               57.9                           58.7            - 1.3%
    Brand                                                                     294.4                          288.6             +2.0%
    Other                                                                       16.3                           18.0
    Recharge of interest to Finance                                             19.8                           18.6
    Operating profit                                                          330.5                          325.2             +1.6%
    Net external interest                                                      (19.4)                         (15.8)
    Profit before tax                                                         311.1                          309.4             +0.5%
    Taxation                                                                   (56.9)                         (57.2)
    Profit after tax                                                          254.2                          252.2
    Earnings Per Share                                                        185.6p                          176.9p           +4.9%
    Ordinary dividends per share                                               55.0p                           53.0p           +3.8%

3 Full price sales are VAT exclusive sales, excluding items sold in our mid-season and end-of-season Sale events and our Clearance operations.
4 Total sales are VAT exclusive sales including the full value of commission based sales (refer to Note 3 of the financial statements). Prior year
  total sales have been restated, refer to Appendix 1.
5 This line includes: NEXT Sourcing external sales, Franchise and Lipsy non-NEXT business.
6 Prior year statutory revenue has been restated by £14.7m to reflect the transition to IFRS 15; these IFRS 15 adjustments did not impact total

  or full price sales, refer to Appendix 1.
7 Prior year profit by division has been reclassified, refer to Appendix 1. Group profit remains as reported.

                                                                                                                                               6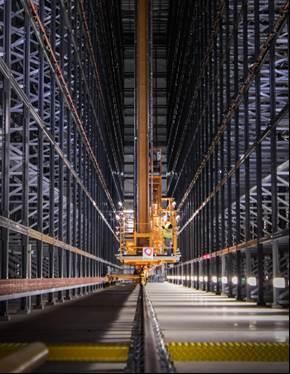
CHANGES TO THE PRESENTATION OF OUR DIVISIONAL RESULTS
We have made a number of changes to the way we present the performance of the individual divisions
within NEXT. The aim is to give a clearer picture of the underlying economics of the Group.

NEXT Finance
NEXT has a significant Finance business which currently provides £1.1bn of credit for customers to
purchase our products online and in our stores. In the past we have consolidated the Finance business
into our Online business for reporting purposes. In order to give greater clarity on the underlying
performance of both the Finance business and Online (product) business, we are now reporting these
separately.
Finance revenue represents the interest charged to our customers on their credit account balances.
Finance profit includes all associated costs including administrative costs, financing and bad debt. The
cost of funding our Finance business is calculated on the basis that the Group lends all funds to NEXT
Finance and charges an interest rate equivalent to the Group’s average cost of borrowing.

Classification of Lipsy Sales
In January 2018 the lipsy.co.uk website was closed and all Lipsy online sales are now made through
the next.co.uk website and reported through the NEXT Online business within LABEL. We have
restated last year’s sales and profit to show lipsy.co.uk sales in NEXT’s Online numbers so that
comparisons can be made on a like-for-like basis. If we did not do this NEXT’s Online reported sales
growth would be artificially inflated.
For a summary of all prior year sales and profit reclassifications refer to Appendix 1.

                                                                                                      7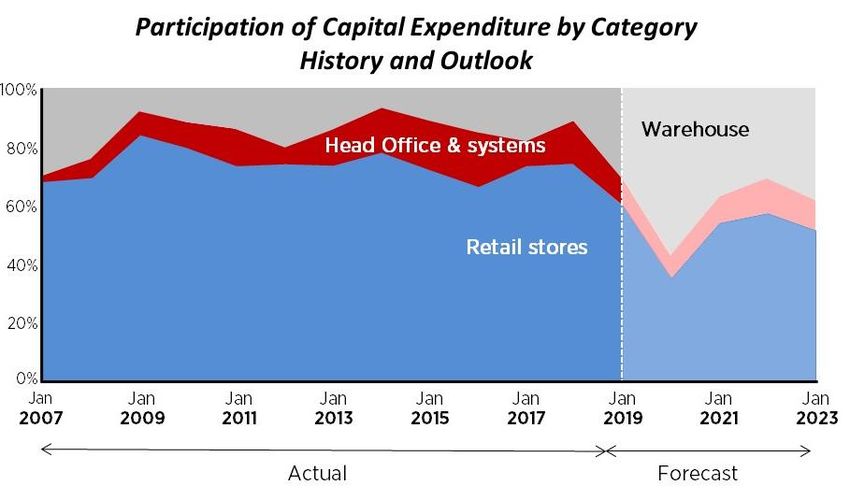
NEXT RETAIL
FIRST HALF PERFORMANCE - SALES AND PROFIT
Full price Retail sales were down -5.3%, this was +1.7% ahead of our initial budget for the first half.
Total sales, including markdown, reduced by -6.9%. Net new space contributed +0.7% to total sales
growth. Profits reduced by -23.0%, driven mainly by the dis-economies of scale caused by declining
like-for-like8 sales.

    £m                                                        July 2018                        July 20179
    Total sales                                                   925.1                            993.2                            - 6.9%
    Operating profit                                               73.2                             95.1                          - 23.0%
    Net margin                                                       7.9%                            9.6%

The table below sets out significant Retail margin movements by major heads of costs.

    Net margin on total sales to July 2017 - restated9                                                                                9.6%

    Bought-in gross margin                     Improved underlying bought-in gross margin added +0.2%                               +0.2%
                                               to margin.

    Markdown                                   Stock for Sale was down -23% with markdown sales down                                +1.1%
                                               -19%. The combination of improved clearance rates and
                                               the increase in the participation of full price sales
                                               increased margin by +1.1%.

    Store payroll                              Increased rates of pay reduced margin by -0.3% but this                              +0.1%
                                               was more than offset by productivity initiatives.

    Store occupancy                            Falling like-for-like sales increased occupancy costs as a                           - 1.7%
                                               percentage of sales. Underlying rental inflation was
                                               negligible at +0.4%.

    Warehousing &                              Falling sales increased costs as a percentage of sales.                              - 0.5%
    distribution

    Central costs                              Central costs have reduced margin due to (1) falling sales                           - 0.9%
                                               and (2) increased staff incentives.

    Net margin on total sales to July 2018                                                                                            7.9%

Based on our central guidance, we expect Retail net margins for the full year to reduce by a similar
amount to the first half, falling from 12.7% to around 11%.

8   Like-for-like sales is the change in sales from stores which have been open for at least one year.
9   July 2017 operating profit and net margin were restated in the second half of last year to more accurately reflect Online costs incurred by
    our Retail business. The result was an additional £5m recharge from Retail to our Online business, refer to Appendix 1.

                                                                                                                                            8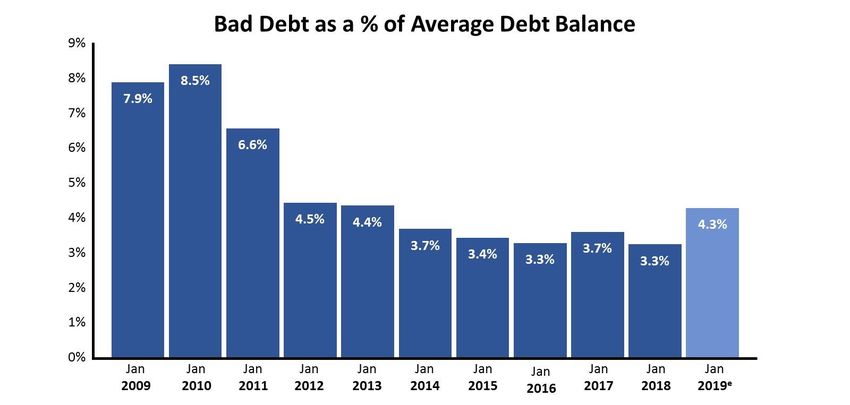
RETAIL SPACE
In March 2018 we forecast that NEXT Retail space would increase by a net 100,000 square feet in the
year. Since then we have decided to close seven of our Clearance stores at the end of their leases.
This decision is in response to (1) lower levels of Sale surpluses and (2) the success we are having
clearing surplus stock online. In addition, we will close one more mainline store than expected and
the opening of one large mainline store has been delayed to early next year. As a result, we now
expect our trading space to increase by 42,000 square feet in the year. The table below sets out the
forecast change in space for the full year. We anticipate that (subject to lease renewal negotiations)
we will marginally increase our trading space in 2019/20.
                                                                          NEXT                  Concessions                       Total
                                                                      Sq. ft. (k)                 Sq. ft. (k)                 Sq. ft. (k)
     January 2018                                                         8,029                         242                       8,271
     New mainline                                                          +154                         +64                        +218
     Mainline closures                                                     - 109                          -2                       - 111
     Clearance closures                                                      - 65                           -                        - 65
     January 2019 (e)                                                       8,009                         304                    8,313
     Change in square feet                                                    - 20                        +62                      +42
     Change                                                                - 0.2%                      +25.8%                    +0.5%

New space
Branch profitability10 of the portfolio opened or extended in the last 12 months is forecast to be 21%
of VAT inclusive sales. Payback on the net capital invested is expected to be 25.5 months, which is
marginally beyond our internal payback hurdle of 24 months and reflective of the difficulty in
predicting new store performance in the current environment.

Closures
The table below sets out the store closures in the current year with their annualised profit at the point
of closure.

                                                                 No. of stores           Branch profit £m               Branch profit %
     Mainline closures                                                      15                         3.2                        13%
     Clearance closures                                                           7                          2.2                   15%

The fifteen mainline stores which closed made an average branch profit of 13% (before central
overheads). We would not normally actively seek to close stores making a 13% net margin. However,
these stores were at the end of their lease and, in the current environment, we believed it was unwise
to make a new long-term commitment to these shops at this level of profitability.

Over the last 12 months, following most store closures, we have seen an encouraging amount of sales
transfer to nearby NEXT stores. On average this has been around 20% of the sales lost from the closing
stores. It is too early to tell whether this level of transfer will be sustained or if it is indicative of future
closures. If it is, it will mitigate much of the profit lost from store closures going forward.

10   Branch profit is defined as profit before central overheads and is expressed as a percentage of VAT inclusive sales.

                                                                                                                                        9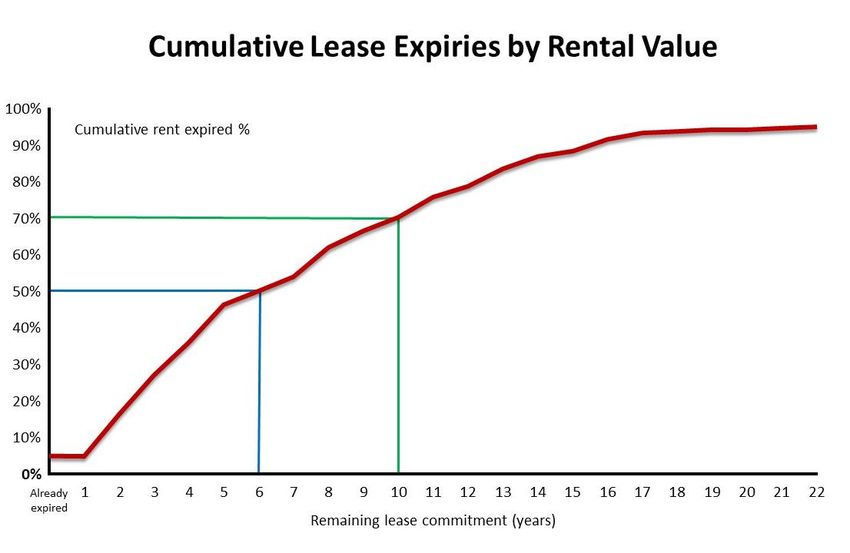
Lease Renewals
This year 33 stores reach their lease end and we have either renewed or are actively negotiating the
potential renewal of these stores. The table below summarises the reductions in occupancy costs we
expect to achieve where we are likely to renew our leases in the current year.
33 store renewals Before After
2018/19 (e) £m renewal renewal
Rental costs11 (before concession income) 10.0 7.2 - 28%
Concession income - - 0.4
Net rent 10.0 6.8 - 32%
Net rent/sales (VAT inc.) 9.1% 6.2%
Capital contribution to be spent on store upgrade £4.5m
Average lease term12 5 years
Average branch profitability (before central overheads) 26%
Future lease renewals
There are a further 25 stores reaching the end of their leases this year; these will either be held over
at the passing rent (pending negotiation) or will be closed.
Our general approach to lease renewals is that we would renew a lease in any of the three following
circumstances:
A store is highly profitable (e.g. making >20% branch profit) and the lease commitment is not
too onerous (i.e. up to 5 years)
Where store profitability is low (e.g. 5%-20%) but the renewal period is very short (i.e. 6 to 48
months)
Where store profitability is low (PORTFOLIO PROFITABILITY AND LONG TERM LEASE COMMITMENTS
Lease Commitment Profile
The average lease length remaining (to the nearest break clause) on our current portfolio of stores is
just over 6 years and 70% of our rental liabilities will have expired within the next 10 years. The expiry
profile of our store portfolio’s lease commitments is set out in the graph below.
In our last Full Year Statement we modelled the effect declining like-for-like sales might have if they
were to persist at -10% for the next fifteen years. So far this year our Retail sales decline has been
better than that scenario, so we see no reason to re-issue or revise that model which remains a worst-
case scenario.
Portfolio Profitability
Despite falling like-for-like sales, the vast majority of our stores remain very profitable.
The table below summarises our store portfolio in different profitability bandings; this summary
assumes we perform in line with our central guidance, which is for Retail full price sales to finish the
year down -6% (see sales guidance on page 41). As can be seen, by the end of the year 92% of our
stores, accounting for 95% of turnover, are forecast to make more than 10% branch profit (before
central overheads).
January 2019 (e)
Branch profitability % of stores % of turnover
>20% 64% 64%
>15% 82% 85%
>10% 92% 95%
>5% 96% 98%
>0% 98% 99%
11MANAGING RETAIL COSTS
The management of costs remains a huge focus for our Retail teams. In the first half we were able to
mitigate cost of living increases and the loss of economies of scale inherent in falling like-for-like sales
through efficiency measures. In the current year this is being achieved mainly through a combination
of the following:
Technology enabled improvements to in-store stock management processes
Right sizing of our management structure to account for today’s levels of sales (mainly
achieved through natural management turnover)
Savings to our delivery schedule to account for lower unit volumes
As usual, cost savings have come from a large number of small initiatives rather than any single project.
A good example is the introduction of RFID enabled hand held terminals which are expected to reduce
the cost of in-store stock file management by £800k in the year.
We anticipate that Retail will save around £5m in the current year as a result of these and other
endeavours. The management of costs and the search for innovative ways to operate more efficiently
remain priorities for our Retail teams.
DEVELOPING OUR STORES AS PART OF OUR ONLINE PLATFORM
For many years NEXT stores have been an important part of our delivery service. Currently, around
50% of our UK Online orders (by number of orders) are fulfilled through our shops. This represents
around 38% of our UK Online sales by £ value. Since January we have made further improvements to
the integration of our Retail and Online businesses. In our last Full Year Statement we talked about
some of these initiatives. The aim is to maximise the value of the stock we have within both businesses
and enhance the way our stores work with our Online business to create a more unified service
Platform for our customers and third-party brand partners.
Use of Retail Stock to Service Online Demand
We have made more of our Retail stock visible and available to order through our website, when those
items are not immediately available in our warehouses. We are now servicing 4% of our Online sales
from stock recalled from our Retail stores. We are looking to make more of our Retail stock available
in this way and increase the cost efficiency with which we can recall, consolidate and distribute these
items. As much as possible, we aim to pack and process these orders in our regional depots, alleviating
capacity pressures in our central warehouses.
Currently these items have a delivery promise of up to 4 days; by November we hope to improve this
promise to 48 hours.
Same Day Click-and-Collect
In selected stores we have launched a same day click-and-collect service for stock that is already
available in a customer’s local store. Customers can reserve and pay for stock online and get
confirmation that their stock is ready to collect within around fifteen minutes. We do not anticipate
that this will be a significant volume of sales, though it may be more important in the run up to
Christmas when customers are most enthusiastic to secure specific items as gifts.
12Transferring Best Selling Online Stock into Retail Stores
Until recently the vast majority of stock movements between our Retail and Online businesses have
involved taking stock from our shops to service Online demand. As the depth and breadth of our
Online ranges grow, a smaller percentage of our total offer is available in store. We are currently
trialling sending over-performing NEXT Online stock to stores that have a high probability of selling
that item. The potential downside is limited because, if required, the item can still be ordered Online
and serviced from store stock.
The aim is to bring some of the dynamism of an Online offer to our Retail stores. It will take some time
to understand whether the economics of this idea make sense. It will then take more time to master
the art of deciding what stock to send to which stores, so it is very early days for this concept.
Stores as Point of Collection for Third-Parties
Finally, we are investigating whether our stores can serve as delivery points for third-party non-
competing businesses. We expect to undertake a meaningful trial of this idea within the next six
months to see if the revenues involved are enough to make the exercise worthwhile. We will also
evaluate whether any increase in footfall contributes to our Retail sales.
The key to making the above initiatives successful will be our ability to deliver operational excellence
in our stores and regional depots. This will require a combination of reliability and cost effectiveness;
we are developing systems to improve performance on both fronts.
13NEXT ONLINE
This section starts by giving an update on the performance of our Online business in the first half of
the year, broken down by division (NEXT Brand UK, LABEL and Overseas). This is followed by four
FOCUS sections covering:
Online marketing
LABEL
Overseas
Warehousing, infrastructure and capex
FIRST HALF PERFORMANCE – SALES, PROFIT AND CUSTOMERS
Sales and Profit Summary
Full price sales grew by +16.0%, with total sales growth (including markdown) of +16.8%. (In our
August Trading Statement, we reported Online sales including Finance interest income, this gave the
slightly lower number for full price sales growth of +15.5%.) Net margin increased to 18.3%.
£m July 2018 July 201713
Total sales 892.3 764.3 +16.8%
Operating profit 163.3 134.8 +21.2%
Net margin 18.3% 17.6%
Sales by Division
To give a clearer picture of how our Online business is developing, it is helpful to think of the business
as being divided into three divisions: (1) The NEXT branded business in the UK, (2) the LABEL UK third-
party branded business and (3) Online Overseas. The table sets out the full price sales performance of
each of these three divisions.
Full price sales growth £m % var Q1 Q2
NEXT Brand UK +47 +11.5% +15.5% +7.1%
LABEL UK +30 +24.2% +27.7% +20.7%
Total UK +77 +14.4% +18.2% +10.4%
Overseas +32 +22.0% +21.7% +22.5%
Total full price sales +109 +16.0% +19.0% +12.6%
Total including NEXT Finance +120 +15.5% +18.1% +12.5%
We have included the quarterly performance as we believe that the second quarter provides a better
indication of likely future performance for the second half. In the first quarter, the NEXT UK figures
were flattered by ranging errors in the previous year.
13 July 2017 total sales, operating profit and net margin have been restated to separately report the Finance business, refer to Appendix 1.
14Profit by Division
The table below sets out profit and net margin by channel for the Online business in the first half.
Profit £m Increase £m14 Net margin %
NEXT Brand UK 105.4 14.2 19.6%
LABEL UK 27.9 8.9 16.0%
Overseas 30.0 5.4 16.7%
Total Online profit 163.3 28.5 18.3%
Reported net margins in LABEL and Overseas have, historically, been calculated including a deduction
for attributable fixed logistics costs and markdown costs but no account has been taken for indirect
central overheads. As these businesses have grown, they now meaningfully draw on our central
overheads (such as Systems, Finance and in the case of Overseas, Product teams). So we have decided
to allocate a proportionate share of all central overheads to both businesses. This reduces margins by
3% in Overseas and 1% in LABEL.
Margin Movement Analysis
The table below sets out significant Online margin movements by major heads of costs.
Net margin on total sales to July 2017 – restated14 17.6%
Bought-in Improved underlying NEXT bought-in gross margin added +0.2% to - 1.1%
gross margin margin. Third-party branded sales, which have a lower bought-in gross
margin, reduced margin by -1.3%.
Markdown Stock for Sale was down -12% but markdown sales only fell by -6%. The +0.9%
combination of improved clearance rates and the increase in the
participation of full price sales increased margin by +0.9%.
Warehousing Growth in overseas sales, which have a higher cost of distribution, - 0.9%
& distribution eroded margin by -0.4%. Reduced delivery income from nextunlimited
has reduced margin by a further -0.3%. Other operational costs have
increased as we have begun to experience capacity constraints in some
of our warehouses (see Focus on Warehousing, Infrastructure and Capex
on page 21), reducing margin by -0.2%.
Catalogues & Production of fewer catalogues has increased margin by +1.0%. +1.4%
photography Photography savings have increased margin by +0.4%.
Marketing & In the first half marketing and systems costs have increased on last year +0.5%
systems but both have risen less than sales growth, resulting in an improvement
in margin. We are accelerating marketing and systems investment in
the second half and expect the full year effect of these cost increases to
reduce margin by -0.3%.
Central costs Central costs have reduced margin due to increased staff incentives. - 0.1%
Net margin on total sales to July 2018 18.3%
Based on our central guidance we expect Online net margin for the full year to be around 18.5%, in
line with last year.
14 Operating profit and net margin for the prior year have been restated, refer to Appendix 1.
15Customer Base
Average active customers15 increased by +6% to 5.2 million, driven by the growth in Overseas and UK
Cash Customers (those who do not use our credit account, nextpay, when ordering). UK Credit
Customers increased by +1%. The table below sets out the growth in the respective parts of our
customer base.
Average active customers (m) July 2018 July 2017
UK Credit 2.52 2.49 +1%
UK Cash 1.58 1.50 +6%
Total UK 4.10 3.99 +3%
Overseas 1.08 0.90 +19%
Total 5.18 4.89 +6%
FOCUS ON MARKETING
Growth in the UK has been accelerated by the following:
(i) Improved and extended digital marketing
(ii) nextunlimited
(iii) Improved website performance and customer journey
Each is dealt with in the paragraphs below.
(i) Digital Marketing
In March we outlined some of the measures we are taking to improve our online marketing.
Improvements have centred on the adoption of new technologies that enable us to better target new
and existing customers with the products and services they are most likely to want. We are also
deepening our relationships with search engine and social media providers in order to maximise the
benefits their products can bring to our marketing campaigns. In addition, we have rebalanced our
digital spend to invest more in marketing on mobile devices.
Increase in Marketing Expenditure
The table below sets out our forecast investment in marketing spend for the full year compared to last
year. We plan to increase our overall marketing expenditure for our Online business by +13%. Within
this number, the budget for digital marketing has increased by £16m to £28m. We have added a line
showing expenditure on creating, printing and distributing catalogues which demonstrates that the
additional expenditure on marketing has been offset by catalogue savings.
Marketing spend £m Jan 2019 (e) Jan 2018
Digital marketing 28 12 +125%
Direct mail, print advertising & TV 11 23 - 51%
Personnel 11 9 +19%
Overseas marketing 8 7 +17%
Total marketing expenditure 58 51 +13%
Catalogue creation and printing spend 92 103 - 11%
Total marketing and catalogues 150 154 - 3%
15 Active customers are defined as those who have placed an Online order or received a standard account statement in the last 20 weeks.
16Online Marketing Internal Rates of Return (IRR)
For each of our marketing campaigns we estimate an Internal Rate of Return (IRR) on cash invested in
each programme. IRRs are calculated from the net cash flows resulting from each advertisement. The
outflows consist of the creative and media costs, the inflows are the profit from the incremental sales
generated from the advert. It is important to point out that there is a degree of uncertainty as to
whether sales prompted by an advert are genuinely incremental as some adverts might have merely
pulled forward a sale we would have made anyway. We generally assume that around 10% of sales
prompted by advertising to existing customers and 40% of sales to new customers are incremental.
Overall the returns to date have been excellent, with IRRs in the first half being in excess of 75%.
The graph below gives an example of the cash flows generated by one campaign. If the campaign
attracts new customers we estimate the lifetime value of the cash flows generated by that cohort of
customers. This is why the cash flows persist for more than one season in the example.
(ii) nextunlimited
We have been successful in promoting our nextunlimited service which allows customers to have
unlimited deliveries and collections to and from their home for £20 per annum. We currently have
around 380,000 nextunlimited customers and expect the number to continue to grow in the current
year. It is more expensive to service nextunlimited customers as they order more frequently in smaller
quantities and return a greater percentage of their orders. However, to date, these costs are more
than offset by the overall increase in sales to these customers.
(iii) UK Website Experience
Within the last six months we have continued to make many small improvements to the customer
journey on our website; with enhancements to our home pages, selling pages, search results,
registration and checkout. No individual improvement is particularly important on its own, with each
change only delivering small (but usually measurable) gains. However, we believe that the overall
effect has been to deliver a significantly better customer experience online.
We are currently rolling out a new search engine which uses Artificial Intelligence to select and rank
products, this is probably the most important change we will make in the current year. The next step
in developing the search function is to see if we can successfully personalise search results; we aim to
test this concept within the next six months.
We have further improvements planned for the rest of the year, including the introduction of
personalised home pages which we are currently trialling. If successful, this will be rolled out over the
coming months.
17FOCUS ON LABEL
Sales Performance
LABEL has had a strong first half with full price sales up +24.2%. Growth has been driven by:
Increasing sales with our existing partner brands, where we have successfully increased our
breadth of offer and improved stock availability
The introduction of new partner brands
We continue to add brands to our portfolio and will be launching a number of important new partners
during the second half of the year. We have also significantly increased the offer available from third-
party homeware brands and, during the second half of the year, we anticipate a step change in our
third-party Beauty offer.
Commission and Wholesale
More than half of our third-party branded business is now sold on a commission basis (we include Lipsy
sales as a commission brand). Although we make lower net margins on the commission model, we
encourage our brand partners to adopt it because we believe that it will generate higher sales growth.
This belief is reinforced by our sales performance as demonstrated in the table below; the growth rate
of commission brands is higher than the rate of those bought on a wholesale basis.
Full price sales £m July 2018 July 2017
Wholesale 74 63 +19%
Commission 78 59 +30%
LABEL full price sales 152 122 +24%
Our aim is to be our commission partners’ most profitable online route to market, and to this end we
are working to improve our operating model to make it easier and cheaper to move stock onto our
Platform. We have simplified the process for stock intake, photography, sales reporting and recall.
These developments to our stock and logistics systems will enable brand partners to more directly
manage their stock into our warehouses and onto our Platform.
We are planning to trial further enhancements to our Platform capabilities over the coming months,
including a trial to sell items that are only available in our partners’ warehouses. Our aim is that these
items will then be transferred from our partners’ warehouses and distributed through our Platform’s
network of couriers and stores. The key here will be to ensure that the process is cost effective and
that we can fulfil the orders in good time.
18LABEL Sales and Profit History
The table below sets out the last four years’ sales, profits and net margins for LABEL, along with our
estimate for the current year. In January 2018, the lipsy.co.uk website was closed and we now report
all Lipsy online sales via next.co.uk in LABEL. Historical sales and profit taken on the lipsy.co.uk website
have been included in this table for comparison.
Jan Jan Jan Jan Jan
£m 2015 2016 2017 2018 2019 (e)
Total sales 151 187 215 298 370
Operating profit 21 23 35 51 63
Net margin 14% 12% 16% 17% 17%
Net margin including all central 16%
overheads
For the full year, we expect full price sales to be up +23% and net margin to remain in line with the
previous year at 17%. Once we allocate LABEL its full share of central overheads, reported margin is
forecast to be 16%.
FOCUS ON OVERSEAS
Analysis of Overseas Online Sales
Full price sales for the first half were up +22% and up +19% on a constant currency basis. Total sales,
(including markdown sales) were up +24%. The vast majority of our sales Overseas are of NEXT
branded stock.
Overseas sales are achieved through our own website nextdirect.com and via third-party websites.
Growth by each channel is set out in the table below. Third-party website sales have been particularly
strong in the first half as we continue to enhance our product offer with existing partners.
July July
Full price sales £m 2018 2017
nextdirect.com 154.3 128.0 +21%
Third-party websites 21.2 15.8 +34%
Full price Overseas sales 175.5 143.8 +22%
For the full year, we expect full price sales on a constant currency basis to be up +20%, and in Pounds
up +20%.
19Online Overseas Profit History and Outlook
The table below sets out the last four years’ sales, profits and net margins in Pounds for Online
Overseas, along with an estimate for the current year.
Jan Jan Jan Jan Jan
£m 2015 2016 2017 2018 2019(e)
Total sales 163 197 234 295 355
Operating profit 30 31 46 65 69
Net margin 18% 16% 20% 22% 19%
Net margin including all central 16%
overheads
Profits have not grown as fast as sales for the following three reasons:
The fastest growing product areas have higher customer returns and so are expected to lower
net margin by around £3m; we expect this trend to continue
This year we incurred £1m closure costs for our China operation
The prior year benefited from a one-off duty provision release of £4m
As a result, our net margins are expected to reduce from 22% last year down to 19%. Once we allocate
Overseas its full share of central overheads, including Product teams, net margins are forecast to be
16%.
Drivers of Overseas Growth
The following paragraphs detail some of the improvements we have made to our Overseas business.
These paragraphs come with a caveat: we believe that some (if not much) of the improvement in sales
we have experienced has come organically as worldwide customers increase their use of the internet
and find our products through word of mouth.
Mobile development
Until May last year all of our Overseas websites were designed for the desktop, so customers who used
mobile devices to shop NEXT had to view it as a desktop site. This was far from ideal, particularly as in
many overseas territories the participation of mobile devices is high.
We have now developed mobile sites for 24 of the 70 overseas countries we trade in. Between them
they account for 90% of Overseas orders taken on our own websites. By the end of this year we plan
to make mobile sites available in 10 more countries which will mean that around 97% of Overseas sales
will be in countries with access to a mobile site.
Breadth of Offer
Traditionally many of our Overseas customers have limited their orders to only one of our product
categories. We are now seeing Overseas customers increase the breadth of product they are willing
to buy from NEXT. We believe that this trend has, to some extent, been encouraged by the addition
of a broader offer of our merchandise on third-party sites in overseas territories.
We are also seeing some benefit from the addition of warm weather ranges to our site in the UK’s
winter season. These ranges were introduced as a holiday shop offer for UK customers travelling
overseas in the winter but they have also served to boost sales in the Southern Hemisphere and other
warmer countries.
20Other Improvements to our Overseas Sites
We have also built a new Overseas team (based in the UK) to undertake a programme of constant
improvement to our Overseas sites. There are a huge amount of small improvements that can be
made to tailor the visibility (search engine optimisation), website layout, search results, registration,
checkout, payment options and delivery service in each country. As is the case in the UK, no individual
improvement has made more than a fractional contribution to growth, but we believe that the sum
total is contributing to the growth we are experiencing overseas.
FOCUS ON WAREHOUSING, INFRASTRUCTURE AND CAPEX
The recent acceleration in our Online sales has taken some of our warehouses close to some of their
capacity limits. Whilst we have been able to operate effectively and maintain service levels, the
operation of these warehouses at or near capacity has increased our operating costs.
In order to continue growing our Online business we plan to make a number of significant investments
in our warehousing and other online infrastructure over the next four years.
In the current year we will commence the following projects:
A £30m automated storage-and-retrieval-system (ASRS) for returns from customers
A £15m project expanding our forward picking areas for boxed stock
These investments form part of a four year £200m programme to upgrade our warehousing
infrastructure. We do not need to commit to all this capital expenditure at this time, so if sales growth
does not materialise we will be able to defer or cancel much of this planned investment. We are
currently committed to £70m (35%) of the programme.
Our warehousing is modular, spread over five major sites. So it can be extended piece by piece and
does not require any significant step change in annual capital expenditure.
Automated storage-and-retrieval
system - furniture
21The Gantt chart below sets out our expectations for major projects, costs and timescales. The
terminology needs a little explanation and the preceding table gives a brief glossary of terms.
Term Definition
Boxed stock Stock that is stored in a standard carton.
Hanging stock Stock that is stored on hangers.
Palletised stock Bulky, irregular items delivered and stored on wooden pallets.
Bulk storage Storage in dense, space efficient, automated crane systems from which
individual items cannot be picked. Stock can only be retrieved in whole
boxes or complete pallets and is moved into forward locations.
Forward locations Stock is stored in picking aisles that can be accessed by warehouse
operatives so that individual items can be picked for dispatch to customers.
Returns storage Storage and picking system for stock that is returned from customers, after
refurbishment.
Sortation Once items have been picked they are sorted to collate customer orders and
prepared for dispatch to the correct depot.
Cost
Project 2018 2019 2020 2021 £ (e)
Boxed returns storage (ASRS) 30m
Boxed forward storage (phase 1) 3m
Boxed forward storage (phase 2) 15m
Boxed bulk storage 38m
Boxed sortation (phase 1) 3m
Boxed sortation (phase 2) 6m
Boxed sortation (phase 3) 8m
Hanging storage and sortation 23m
Hanging bulk storage 3m
Palletised returns storage 2m
Palletised forward storage (phase 1) 8m
Palletised forward storage (phase 2) 5m
Regional depot throughput 5m
Ongoing vehicle fleet upgrades 7m
Other projects 44m
Total investment £ 40m 85m 45m 30m 200m
22Counting the Cost of Capital of Warehousing Investment
We estimate that our programme of warehouse investment will increase our Online unit sales capacity
by 75%. This would allow us to increase annual Online sales by around £1.5bn. We believe that this
will give plenty of headroom to service our most aggressive sales projections. It is important to stress
this is not our central forecast for sales growth to January 2022 (so analysts please do not plug this
number into your models!).
Likely Cost of Depreciation and Margin Impact of New Investment
The £200m investment gives a clear indication of the capital costs of future Online growth. The
numbers imply we will need to invest 13p (£200m ÷ £1.5bn) for every £1 of additional annual sales
capacity. The depreciation on warehouse equipment averages 12 years, so depreciation would be
around 1.1% (13p ÷ (£1 X 12 years)). Our current rate of warehouse depreciation is 0.8% so we do not
anticipate that the new investment will have a material impact on the net margins of the business.
In terms of the Group’s Return on Capital Employed, the investment in new warehousing capacity looks
set to provide a very high return. Average net cash16 margin Online is 19% (excluding interest income).
So every 13p spent on warehousing accommodates annual sales generating 19p of cash profit per
annum. Subject to the Group achieving its long term central sales scenario, we estimate the IRR on
this investment would be more than 75%. This is not quite the whole picture as we are likely to invest
in other capital items (such as systems and office space) to facilitate Online growth. Nonetheless, even
accounting for this ancillary capital, returns would remain high.
Warehouse Capex in the Context of Total Group Capex
The investment we plan in warehousing and logistics is likely to be offset by a reduction in the amount
we invest in opening new Retail space. The two graphs below put our expected future capex in the
context of the Group's capital investment history.
The first graph shows the participation of stores, systems and warehousing as a percentage of our total
capital expenditure. The second graph shows the same information in Pounds. The two graphs paint a
very clear picture: going forward, the capital consumption of the Group is likely to remain unchanged.
16 Net cash margin is defined as operating profit less the cost of depreciation.
2324
NEXT FINANCE
For the first time we are separating out the performance of our Finance business from our Online
business. It is an important business in its own right, with £1.1bn of outstanding consumer debt and
we anticipate that it will contribute around £123m profit to the Group in the current year.

NEXT FINANCE PROFIT AND LOSS ACCOUNT EXPLAINED
The performance of our Finance business is best understood by looking at a full year’s performance
and our estimate for the current year is set out in the table below. Each line is then explained beneath.

     £m                                                                  Jan 2019 (e)                     Jan 2018
     Note of nextpay credit sales                                             1,688                         1,563           +8.0%
     1) Interest income                                                         252                           223          +12.8%
     2) Bad debt charge                                                         (51)                           (37)        +36.0%
     3) Overheads                                                               (38)                           (33)        +13.0%
     Profit before cost of funding                                               163                         153            +7.0%
     4) Cost of funding                                                          (40)                        (41)           - 0.3%
     Net profit17                                                                123                         112            +9.7%
     5) Average debtor balance                                               £1,141m                     £1,014m           +12.6%
     6) ROCE (after cost of funding)                                           10.7%                       11.0%

     Term in P&L           Definition
     Interest income       Interest income is the gross interest billed to nextpay customers, before any
     Line 1                deduction for unpaid interest on bad debt. It is forecast to grow broadly in line with
                           the average debtor balances (line 5).

     Bad debt charge       A charge is taken against all our outstanding debt. This consists of a charge on the
     Line 2                debt owed by customers who have defaulted. In addition, a provision is made for
                           potential default against our good debt balance.
                           The bad debt charge is determined by (a) the size of our outstanding debtor balance
                           and (b) the default rate we anticipate in any given year. So any one of the following
                           three factors will increase the bad debt charge:
                           (i)    Growth in the closing balance driven by an increase in credit sales
                           (ii)   Growth in the closing balance driven by an increase in payment days (the time
                                  taken to pay down a balance)
                           (iii) Any change in the anticipated bad debt rate
                           In our central guidance we anticipate that all three will contribute to an increase in
                           this charge. Credit sales are forecast to rise by +8% (compared with +11% in the first
                           half), payment days are expected to rise by +3% (+6% in the first half) and we
                           anticipate an increase in the bad debt rate of +1.0% to 4.3% of the average debtor
                           balance. This is slightly higher than the exceptionally low levels of recent years (see
                           page 27), which mirrors the conditions in the wider credit environment18.

17 In March 2018 we noted that the Finance business made c.£119m in the year to January 2018. As part of the reclassifications referred to
   in Appendix 1, this figure is now £112m.
18 Bank of England Credit Conditions Survey 2018 Q2, 12th July 2018.

                                                                                                                                      25
Term in P&L Definition
Overheads Covers all the administrative costs associated with operating the Finance business
Line 3 including call centres and statements etc.
Cost of funding For the purpose of these accounts we have assumed that the entire debtor balance is
Line 4 funded by the NEXT Group, as if there were an inter-company loan in place. The
interest charged to the Finance business has been calculated by applying the average
Group interest rate (i.e. the borrowing rate of the NEXT Group) to the average
outstanding debtor balance.
It is important to note that the Group’s debt is less than our total debtor balance and
this gap means that the Group earns a profit on some of the money it lends to the
Finance business.
The average Group interest rate this year is 3.5% compared with 4.0% last year. This
is due to a larger proportion of this year’s debt being on a floating interest rate.
Next year we anticipate a rise in interest costs as base rates begin to impact on our
cost of borrowing. To account for this cost and the recent increase in bad debt rates
we will increase our APR from November 2018 by 1% to 23.9% for existing customers.
Average debtor The average amount of money owed by all nextpay customers less any provision for
balance bad debt (i.e. the sum total of balances we expect to be paid averaged across the
Line 5 year).
Return on The net profit divided by the average debtor balance (line 5).
Capital Employed
Line 6
Finance Half Year Sales and Profits
Finance profit in the first half has not grown in line with interest income due to an increase in the cost
of bad debt.
In the second half of last year we started to experience customers paying off their balances more
slowly and this continued into the current financial year. There is an interest income benefit resulting
from this behaviour but it is also a leading indicator for increasing bad debt rates. The effect of an
increased underlying bad debt rate gives rise to a £9m one-off increase in the bad debt charge in the
first half of the year. However, we believe this effect has now annualised and we do not expect the
same step change to occur in the second half (see forecast for full year Finance sales and profits above).
£m July 2018 July 2017
Note of nextpay credit sales 797.4 716.5 +11.3%
Interest income 122.0 108.5 +12.5%
Bad debt charge (25.8) (15.0) +71.5%
Overheads (18.5) (16.2) +14.5%
Profit before cost of funding 77.7 77.3 +0.5%
Cost of funding (19.8) (18.6) +6.5%
Net profit 57.9 58.7 - 1.3%
Average debtor balance £1,110m £971m +14.3%
26You can also read