Country Case Study: Development and Status of Freshwater Aquaculture in Henan Province, China
←
→
Page content transcription
If your browser does not render page correctly, please read the page content below
STUDIES & REVIEWS | 1873

             Recommendation Domains for Pond Aquaculture
             Country Case Study:
             Development and Status of
             Freshwater Aquaculture
             in Henan Province, China

Reducing poverty and hunger by improving fisheries and aquaculture   www.worldfishcenter.org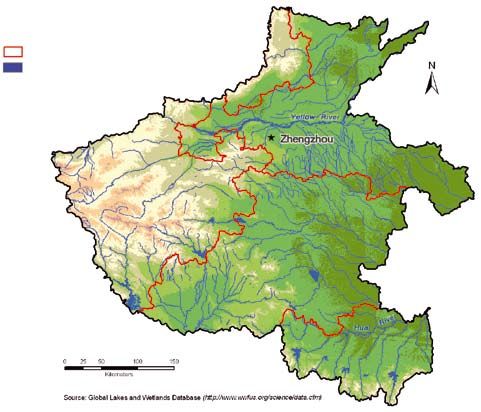
RECOMMENDATION DOMAINS FOR POND AQUACULTURE

Country Case Study:
Development and Status of
Freshwater Aquaculture in
Henan Province, China
Diemuth E. Pemsl
Manik L. Bose
This publication should be cited as:
Pemsl DE, Bose ML. 2008. Recommendation Domains for Pond Aquaculture. Country
Case Study: Development and Status of Freshwater Aquaculture in Henan Province, China.
WorldFish Center Studies and Reviews No. 1873. The WorldFish Center, Penang, Malaysia.
58 p.

Authors’ affiliations:
Diemuth E. Pemsl: The WorldFish Center, Penang, Malaysia
Manik L. Bose: The WorldFish Center, Penang, Malaysia

This publication is one of four country case studies conducted under the research project
“Determination of high-potential aquaculture development areas and impact in Africa and
Asia”. The full series includes the following titles:

Recommendation Domains for Pond Aquaculture. Country Case Study: Development and
Status of Freshwater Aquaculture in Bangladesh

Recommendation Domains for Pond Aquaculture. Country Case Study: Development and
Status of Freshwater Aquaculture in Cameroon

Recommendation Domains for Pond Aquaculture. Country Case Study: Development and
Status of Freshwater Aquaculture in Henan Province, China

Recommendation Domains for Pond Aquaculture. Country Case Study: Development and
Status of Freshwater Aquaculture in Malawi

All publications are available at: www.worldfishcenter.org/RDproject/

Cover photographs (front and rear): Dr Kam Suan Pheng

Published by The WorldFish Center,
PO Box 500 GPO, 10670 Penang, Malaysia

ISBN 978-983-2346-71-5

The WorldFish Center Contribution No. 1873
Printed by Delimax (M) Sdn. Bhd., Penang

This document has not been peer reviewed. The views presented in this publication are those
of the authors and do not necessarily represent those of the WorldFish Center, its partners or
the organizations that provided funding for the publication.

© 2008 The WorldFish Center. All rights reserved. This publication may be reproduced in whole
or in part and in any form for educational or nonprofit purposes without the permission of the
copyright holders provided that due acknowledgement of the source is given. This publication
may not be copied or distributed electronically for resale or other commercial purposes without
prior permission, in writing, from the WorldFish Center. To obtain permission, contact the
Business Development and Communications Division, worldfishcenter@cgiar.org.
Contents
List of Tables                                                               iv

List of Box                                                                  iv

List of Figures                                                               v

List of Annexes                                                               v

List of Abbreviations                                                        vi

Acknowledgements                                                            vii

Foreword                                                                    viii

1. Introduction                                                               1

2. Overview of the National Fishery Sector                                    2
   2.1 Role of aquaculture and capture fisheries in the national economy      2
    2.2 Aquaculture production trends                                         5
    2.3 Ecosystems for aquaculture and overview of farming systems            8
         Inland ecosystems                                                    9
         Brackish and marine ecosystems                                     10
         Farming systems                                                    10
    2.4 Policies and regulations for capture fisheries and aquaculture      12
    2.5 Capture fishery and aquaculture research, education and extension   15
         Fisheries education                                                16
         Fisheries research                                                 16
         Fisheries extension                                                16
    2.6 Marketing of aquaculture produce and consumer preferences           17
    2.7 Summary                                                             18

3. Overview of the Aquaculture Subsector in Henan Province                  20
   3.1 Profile of Henan Province                                            20
    3.2 Findings of the county-level survey in Henan                        23
         Key fishery indicators of Henan by zone                            24
         Major aquaculture species cultured                                 26
         Fish seed production and location of hatcheries                    28
         Status and trends of fish prices                                   30
         Fish farming-related training                                      33
    3.3 Case study of pond fish farming in Henan                            34
         Profile of respondents and of pond fish farmers                    34
         Freshwater pond aquaculture production                             37
         Factors determining adoption of freshwater pond aquaculture        42

4. Constraints and Opportunities for Aquaculture in China                   44

References                                                                  46

Annexes                                                                     48
iv Recommendation Domains for Pond Aquaculture. Country Case Study: china
List of Tables
Table 1: Number of fishers and fish farmers globally and in China 2
Table 2: Top ten exporters and importers of fish and fishery products 3
Table 3: China’s exports of major aquaculture products, 2003 4
Table 4: Production trends in the Chinese fishery sector, 1975-2005 6
Table 5: Area and aquatic production of freshwater environments, 2001 10
Table 6: Marine and brackish water environments in China (1,000 ha) 10
Table 7: Major species in Chinese freshwater and marine aquaculture, 2003 11
Table 8: Major aquatic products in Henan, 1990-2003 21
Table 9: Area of fish culture by ecosystem in Henan, 1990-2003 21
Table 10: Aquatic production in Henan by prefecture, 2003 22
Table 11: Key indicators of Henan by aquaculture zone, 2005 24
Table 12: Key fishery indicators in Henan by aquaculture zone, 2005 25
Table 13: Major species production and share of Henan fish production, 2005 28
Table 14: Indicators of fish seed production in Henan by zone, 2005 28
Table 15: Production of finfish spawn and fry in Henan by major species, 2005 29
Table 16: Number and area of hatcheries in Henan by major species, 2005 29
Table 17: Farm-gate price and intra-annual price changes of fish < 1 kg and
≥ 1 kg for selected species in Henan, 2005 31
Table 18: Retail price and intra-annual price changes of fish < 1 kg and
≥ 1 kg for selected species in Henan, 2005 31
Table 19: Farm-gate price for fish < 1 kg and intra-annual price changes of
major species in Henan by zone, 2005 32
Table 20: Changes in fish price in Henan comparing 2005 prices against
average prices of preceding 5 years by aquaculture zone 32
Table 21: Pond aquaculture experience in counties in Henan by aquaculture
zone, 2005 34
Table 22: Sample size for the 2006 household survey in Henan by prefecture 35
Table 23: Demographics of survey respondents in Henan by prefecture 36
Table 24: Total income and share of different income sources in Henan
by prefecture 36
Table 25: Key characteristics of fish farming in Henan by prefecture 37
Table 26: Input use and input costs of fish farming in Henan by prefecture 38
Table 27: Performance indicators of fish farming in Henan by prefecture 39
Table 28: Harvested size and market price of fish in Henan by prefecture 40
Table 29: Fish consumption of households in Henan by prefecture 41
Table 30: Factors determining the adoption of pond aquaculture in Henan 43
Table 31: Factors determining intensification of pond aquaculture in Henan 43
List of box
Box 1: Major laws and regulations for fisheries in China 13list of tables, figures and annexes v
List of Figures
Figure 1: Global aquaculture production by regional grouping, 2004 1
Figure 2: China’s imports and exports of fish and fish products 4
Figure 3: Contribution of aquaculture and capture fisheries to food fish supply,
world vs China, 2003 5
Figure 4: Output of aquatic products in China by environment, 1950-2006 6
Figure 5: Trends in aquaculture production in inland and marine waters 7
Figure 6: Share of different aquatic products in total output in China (%) 8
Figure 7: Total freshwater culture fish production in China by province 8
Figure 8: Share of ponds in total freshwater fish production in China by province 9
Figure 9: Administrative and technical linkages of fishery-related government
institutions in China 13
Figure 10: Distribution channels of aquaculture products in China, 2000 19
Figure 11: The provinces and autonomous regions of China 20
Figure 12: Aquaculture zones of Henan Province 22
Figure 13: Per capita income quartile of Henan counties distributed among the
zones, 2005 25
Figure 14: Total freshwater culture production in Henan by county, 2005 26
Figure 15: Share of ponds in total freshwater fish production in Henan by
county, 2005 27
Figure 16: Most-produced species in counties of Henan by zone, 2005 27
Figure 17: Total fish fry production in Henan by county, 2005 30
Figure 18: Changes in fish price in Henan comparing 2005 prices against
average prices of preceding 5 years by county 33
Figure 19: Sources of training for fishery officers and fish farmers in Henan 33
Figure 20: Henan, showing urban centres and sites for the household survey
in two prefectures 35
Figure 21: Major problems reported by fish farmers in the two prefectures 40
Figure 22: Share of major fish species consumed at household level by prefecture 42
List of Annexes
Annex 1: Major fish species cultured in China 48
Annex 2: English and scientific names of major fish species cultured in China 49
Annex 3: Output of aquatic products in China by environment (in 10,000 t) 49
Annex 4: Summary of the stages reached in artificial reproduction and nursing of
cultured freshwater species 50
Annex 5: Average yield of different types of aquaculture in China, 1980-2000 (in kg/ha) 50
Annex 6: The Chinese Academy of Fishery Sciences organizational structure 51
Annex 7: Institutes for fishery education in China 51
Annex 8: Production of animal protein in China, 1983-2006 (in 10,000 t) 52
Annex 9: Henan’s socioeconomic ranking in China 53
Annex 10: Freshwater fish culture – area, production and environment in China by
province, 2001 56vi Recommendation Domains for Pond Aquaculture. Country Case Study: china
List of Abbreviations
APR average annual percentage growth
BCE before the common era
CA cultivated area
CAFS Chinese Academy of Fishery Sciences
CAS Chinese Academy of Sciences
CCAP Center for Chinese Agricultural Policy
ESBF Extension Station of Bureau of Fisheries
FAO Food and Agriculture Organization of the United Nations
FFRC Freshwater Fisheries Research Center
GDP gross domestic product
GRP gross regional product
GIS geographic information system
ha hectare
HH household(s)
kg kilogram
km kilometre
na not available
NBSC National Bureau of Statistics of China
NFTEC National Fisheries Technical Extension Centre
R&D research and development
RD recommendation domain
RMB renminbi, the Chinese currency, also called yuan
s.e. standard error
t tonne (1,000 kg)
TVC total variable cost
WTO World Trade Organization
NOTES:
1. In this report, “$” refers to US dollars ($1 = RMB6.82 in July 2008).
2. References in Chinese statistics to “shellfish” include only molluscs, not shrimps or
crabs, so we convert those references to “molluscs”.acknowledgements vii Acknowledgements This case study is an output of the project “Determination of high-potential aquaculture development areas and impact in Africa and Asia” (RD project). We are grateful to the Federal Ministry for Economic Cooperation and Development, Germany, for the generous funding provided. The project was coordinated by the WorldFish Center, with the participation of the University of Kassel and the University of Hohenheim in Germany and national partner institutions including the Institut de Recherche Agricole pour le Développement in Cameroon, Department of Fisheries in Malawi, Department of Fisheries in Bangladesh, and Chinese Academy of Fisheries Sciences. The first part of this report is based on a review of existing literature and statistics. We thank Mr Jan Peter Butenhoff, Mr Terence Too, and Ms Meen Chee Hong for their support in sourcing, translating and summarizing relevant documents. The second part synthesizes the findings of primary data collected during the RD project. We owe special thanks to our project partners, the Chinese Academy of Fishery Sciences (CAFS) in Beijing and the Freshwater Fisheries Research Center (FFRC) in Wuxi. In particular we are grateful to Mr Yuan Yongming and Mrs Ouyang Haiying for their role in the fieldwork and data entry and cleaning, and to Prof Yang Ningsheng for his continued strong support for this project. Ms Du Ning, who conducted her MSc thesis with CAFS under the RD project, was instrumental in verifying some of the statistics as well as in communicating with provincial partners. Data collection for the two surveys was conducted by staff of the Bureau of Fisheries of Henan Province. Our thanks go to them for the hard work and all the support provided. We would further like to thank the RD project team, especially Dr Madan M. Dey for discussions on the scope and structure of the case study, Dr Kam Suan Pheng for valuable comments on earlier drafts, Mr Ferdinand J. Paraguas and Ms Chen Oai Li for data processing and analysis, and Ms Teoh Shwu Jiau for data applications and creating geographic information system maps. Last but not least thanks to Mr Peter Fredenburg for help in editing this manuscript and to the Business Development and Communication Department team in the WorldFish Center for seeing this report through the entire publication process.
viii   Recommendation Domains for Pond Aquaculture. Country Case Study: china

       Foreword
       This monograph is a result of a 3-year project to produce a decision-support toolkit with
       supporting databases and case studies to help researchers, planners and extension agents
       working on freshwater pond aquaculture. The purpose of the work was to provide tools and
       information to help practitioners identify places and conditions where pond aquaculture can
       benefit the poor, both as producers and as consumers of fish. By undertaking the project in
       four countries (Cameroon and Malawi in Africa, and Bangladesh and China in Asia), each at
       a different stage of aquaculture development, project researchers were better able to test
       the toolkit for wide applicability and utility.

       Applying such a toolkit requires a clear understanding of the existing state of pond aquaculture
       in each country, the circumstances underpinning its development, and the factors driving
       its adoption or discontinuation. To achieve this, country case studies were conducted by
       extensive literature review supplemented with analysis of primary and secondary data.

       This monograph is the case study for China, with a particular focus on Henan Province,
       the project location. Written in three parts, it first describes the historical background,
       production levels and trends, economic and institutional environment, policy issues, and
       market situation in China in general. The main part of the study presents findings from
       two different surveys conducted in Henan Province. County-level information is used to
       analyze the current situation of aquaculture, providing a more disaggregated picture than
       what is generally available from national statistics. Data collected in a survey of fish farmers
       in two locations in Henan are then analyzed with regard to the prevailing aquaculture
       technology and production practices, economic performance of pond fish farming, and the
       key reasons for aquaculture adoption. In the final chapter, constraints and opportunities for
       the aquaculture sector in China in general are discussed.

       I hope that this monograph will help development practitioners and researchers interested
       in aquaculture development in Henan Province and more broadly in China. The WorldFish
       Center and its research and national partners1 are grateful to the Federal Ministry for
       Economic Cooperation and Development, Germany, for funding the project. We also thank
       all other partners, including fish farmer respondents, who have contributed to this effort.

       Dr Stephen Hall
       Director-General
       The WorldFish Center

       1
           Research partners: University of Kassel and the University of Hohenheim, Germany; National partners: Institut de Recherche
           Agricole pour le Développement in Cameroon, Fisheries Department in Malawi, Department of Fisheries in Bangladesh and
           Chinese Academy of Fishery Sciences.
Introduction 1
1. Introduction
Aquaculture has been the fastest growing on describing the aquaculture sector in
food sector globally over the past several Henan Province, the study location for the
decades. Most of this growth has taken Recommendation Domains (RD) project.
place in developing countries, and a Henan was selected because it presents
large share of the increase in aquaculture a range of production systems from semi-
production is from the dramatic growth intensive smallholder aquaculture in the
of this sector in the People’s Republic of south to intensive commercial aquaculture
China. The Chinese aquaculture sector on the Yellow River floodplain. After a review
is large, accounting in 2004 for 70% of of the national situation in chapter 2, we
global aquaculture production in terms compile available secondary information
of quantity and 51% in terms of value of the aquaculture sector in Henan and
(Figure 1). Aquaculture in China is very subsequently present the results of two
diverse, spanning the full spectrum from primary surveys conducted under the RD
extensive small-scale pond production of project.
different finfish to the highly commercial and
intensive cultivation of such luxury seafood We analyze first a countywide survey of
items as sturgeon, soft-shelled turtles fisheries bureau staff conducted to elicit
and crabs, in both marine and freshwater key provincial indicators of aquaculture
environments. It is thus very challenging to production and then a survey of households
adequately capture this variety in a single engaged in aquaculture production in two
review. regions of Henan Province. This information
fills a gap in more detailed information of
For this case study, we will start by giving a aquaculture production in Henan, which
general overview of the national aquaculture we hope will be of use to practitioners and
sector in terms of development trends, policymakers working in this area. The
current production levels and importance study closes with a general review of the
to the national economy. However, to major constraints and opportunities for
avoid duplicating existing publications on aquaculture in China.
aquaculture in China in general, we focus
Figure 1: Global aquaculture production by regional grouping, 2004
Value Quantity
4.31% 2.26%
2.71%
7.47% 3.54%
7.72%
21.92% 69.57%
29.30% 51.20%
China Asia (excluding China) and the Pacific
Western Europe Latin America and the Caribbean
Rest of the world
Source: Adapted from FAO 2007.2 Recommendation Domains for Pond Aquaculture. Country Case Study: china
2. Overview of the National Fishery Sector
2.1 Role of aquaculture in 1985 to 12% in 2006, agriculture still
and capture fisheries in the employed 43% of the nation’s workforce in
national economy 2006, or 326 million people (NBSC 2007).
Among agricultural labourers, some 3.29
China is among the countries with the million full-time labourers were engaged in
longest history of fishing and fish culture aquaculture, mainly freshwater fish culture,
in the world. The country has a coastline in 1997, along with a huge number of part-
18,000 kilometres (km) long (almost double time labourers who participated for the
that if the coastlines of islands are included), most part in constructing, renovating and
fishable marine areas of around 1.5 million managing ponds, as well as in harvesting
km2, and 1.3 million hectares of shallow and marketing fish (FAO 1999). The total
seawaters and mudflats. It has inland water number of people in China engaged in
bodies amounting to 17.5 million hectares, fishing and fish farming in 2004 was an
both tropical to temperate (Zhong and impressive 13 million (FAO 2007). Women
Power 1997). Capture fisheries in the sea, account for more than one third of the
rivers, lakes and reservoirs have always labour force in aquaculture (FAO 1997). In
been important economically, as well as 2004, 28% of all the fishers in the world,
for food and nutritional security. The first and 40% of all fish farmers, were Chinese.
records of fish farming in China go back as The number of fish farmers in China grew
far as the Zhou dynasty (1066-256 BCE), by nearly threefold between 1990 and 2004,
when carp fisheries were established. A but the Chinese percentage of world fish
monograph entitled Treatise on Pisciculture, farmers nevertheless fell slightly, indicating
written by Fan Li in 473 BCE, is the earliest even faster fishery growth in other countries
known paper on aquaculture in the world (Li (Table 1).
and Mathias 1994). Despite this early start,
fish culture has developed rapidly only since According to the Food and Agriculture
1950, when success in artificially breeding Organization of the United Nations (FAO),
major carp species and the subsequent the average annual percentage growth rate
availability of hatchery-reared fry and of aquaculture between 2002 and 2004
fingerlings replaced the capture of fry from was 5% in China, while the top performers,
the wild and a range of improved culture Myanmar and Vietnam, realized average
technologies became available. In the annual percentage growth rates of 45% and
past 50 years, aquaculture production has 31%, respectively. However, Myanmar and
ballooned from only 20,000 metric tonnes (t) Vietnam grew from much smaller bases,
in 1949 to 34 million t in 2000, facilitated by with Myanmar producing 0.4 million t in
the introduction of a free market economy 2004 and Vietnam 1.2 million t (FAO 2007).
policy in 1978 (FAO 1999).
Despite the policy focus of the Chinese
Though the share of the primary sector in government to strengthen growth in rural
China’s gross domestic product (GDP) has areas and agriculture, a large difference in
steadily fallen in recent decades from 28% income persists between urban and rural
Table 1: Number of fishers and fish farmers globally and in China
1990 1995 2000 2003 2004
World
Fishers (million) 23.9 25.8 30.7 30.7 30.1
Fish farmers (million) 3.8 6.2 8.8 10.6 11.3
China
Fishers (million) 7.4 8.8 9.2 8.8 8.5
Fishers (% of world) 30.9 34.1 30.0 28.7 28.2
Number fish farmers (million) 1.7 2.7 3.7 4.3 4.5
Fish farmers (% of world) 44.7 43.5 42.0 40.6 39.8
Source: FAO 2007.Overview of the National Fishery Sector 3
households. In 2006, the average annual targets, and people in charge of reporting
per capita income for urban residents was try not to fall short. Meanwhile, figures may
RMB11,760 ($1,724), or more than triple the be underreported if the actual growth is
RMB3,587 ($526) figure for rural residents. higher than the target, to ensure the ability to
However, staffers employed in the fishery report further growth in the future (Watson
sector, both capture and culture, had and Pauly 2001).
incomes in 2006 averaging RMB12,415
($1,820), or nearly half again the RMB8,610 In addition to the fisheries sector’s important
($1,262) figure for farm wage-earners (NBSC role in generating employment and income
2007). and contributing to food security (see
below), the trade in fish — a relatively
The total productivity of the fisheries sector high-value commodity — is a significant
was estimated at 52.9 million t in 2006. source of foreign currency earnings for
The total value of the fisheries production producing countries. China is by far the
is estimated to be RMB443,300 million largest exporter of fish and fish products
($65,000 million), contributing about worldwide, with exports worth $6.637 billion
10% percent to the gross output value of in 2004, or 9.3% of the global total (Table
the primary sector in 2006. The share of 2). Fishery products accounted for 29% of
aquaculture in total fish production was China’s total agricultural exports, excluding
68% in 2006 (NBSC 2007). These statistics forestry products, in 2004, but only 1.1%
should, however, be read with caution. of the country’s total merchandise exports
There is strong pressure to meet production (FAO 2007).
Table 2: Top ten exporters and importers of fish and fishery products
1994 2004 Average annual growth
($ million) ($ million) (percentage)
Exporters
China 2,320 6,637 11.1
Norway 2,718 4,132 4.3
Thailand 4,190 4,034 -0.4
USA 3,230 3,851 1.8
Denmark 2,359 3,566 4.2
Canada 2,182 3,487 4.8
Spain 1,021 2,565 9.6
Chile 1,304 2,484 6.7
Netherlands 1,346 2,452 5.5
Vietnam 484 2,403 17.4
Top 10 subtotal 21,243 35,611 5.3
Rest of world subtotal 26,267 35,897 3.2
World total 47,511 71,508 4.2
Importers
Japan 16,140 14,560 -1.0
USA 7,043 11,967 5.4
Spain 2,639 5,222 7.1
France 2,797 4,176 4.1
Italy 2,257 3,904 5.6
China 856 3,126 13.8
United Kingdom 1,880 2,812 4.1
Germany 2,316 2,805 1.9
Denmark 1,415 2,286 4.9
Republic of Korea 718 2,233 12.0
Top 10 subtotal 38,063 53,090 3.4
Rest of world subtotal 13,104 22,202 5.4
World total 51,167 75,293 3.9
Source: FAO 2007.4 Recommendation Domains for Pond Aquaculture. Country Case Study: china
China’s fish and fish product exports have Trade Organization (WTO) in late 2001. The
increased significantly, with an average most commonly imported seafood products
annual percentage growth of 11% for the are fishmeal used as feed in the rapidly
period of 1994 to 2004. The major driver expanding aquaculture subsector, pollock,
behind this rapid increase in exports of medium- and high-grade salmon and trout,
aquatic products, apart from the growing crab, and lobster (Yang 2005).
production of the fisheries sector, is the
expansion of the fish-processing industry. The major exported aquaculture products
Processing is done not only of domestically in 2003 (Table 3) were frozen shrimp, either
sourced fish but also of imported raw processed or not, which accounted for
material, which is then re-exported after this 36% of total value and 21% of the volume
value-adding step (FAO 2007). According of all aquaculture exports; live or iced fish,
to FAO, China’s imports of fish and fish accounting for 17% of the value and 28%
products increased by 14% per annum from of volume; baked eel, accounting for 19%
1994 to 2004 (Table 2 and Figure 2), partly of value and over 8% of volume; and crab,
as a consequence of the reduced import accounting for 11% of value and 8% of
duties after the country joined the World volume.
Figure 2: China’s imports and exports of fish and fish products
US$ billions
Export value (free on board)
Import value (cost, insurance, freight)
Surplus
Year
Source: Adapted from FAO 2007.
Table 3: China’s exports of major aquaculture products, 2003
Value Volume
Products
($ million) (% of total) (‘000 t) (% of total)
Shrimp, frozen with head on, 880 35.9 132.6 20.6
headed and peeled, or breaded
Eel, baked 470 19.2 54.0 8.4
Tilapia, gutted and frozen or filleted 100 4.1 60.0 9.3
Yellow croaker, live or frozen whole 110 4.5 49.0 7.6
Crab, live, frozen or cut 270 11.0 49.0 7.6
Seaweed or derived products 100 4.1 50.0 7.8
Fish, live or iced 410 16.7 180.0 28.0
Mollusc 110 4.5 69.0 10.7
Total 2,450 100 643.6 100
t = tonne.
Source: Yang 2005.Overview of the National Fishery Sector 5
In addition to providing employment and aquatic products in urban households was
income and generating export earnings, 18.4 kg in the eastern region, 10.3 kg in the
China’s fishery sector, and especially centre, 7.6 kg in the west and 12.5 kg in the
aquaculture, plays an important role in northeast (NBSC 2007).
national food security. Aquatic products
provide a large share of animal protein 2.2 Aquaculture production
intake. According to the National Bureau of trends
Statistics, total fish production has exceeded
Aquaculture has been practised in China
pork production since 1997, making fish the
for millennia, and fish has always played an
most commonly available source of animal
important role in Chinese culture. However,
protein (Annex 8). In 2004, fish accounted
the rapid development of aquaculture and
for 29% of all animal protein produced in
fisheries did not start until the founding of
China, with the annual per capita supply of
the People’s Republic of China at the end of
fish approaching 30 kilograms (kg) (Figure
the 1940s. Since the 1980s, the sector has
3). Fishery production per capita is much
grown dramatically, becoming one of the
greater in China than the global average,
fastest growing primary sector industries
and the contribution of the aquaculture
in China. In 2005, aquaculture production
subsector is enormous. However, as
was 43.27 million t, a 23-fold increase
described above, large quantities of fish
over the 1.88 million t produced 3 decades
are exported, so the actual consumption of
earlier in 1975 (FAO FishStat Plus 2007).
fish in China is considerably lower than per
Despite the declining role of agriculture in
capita production would suggest.
China’s national economy, the fishery sector
keeps pace with overall economic growth,
Even taking into account the significant experiencing significant structural changes.
share of aquatic products that are exported, The proportion of aquaculture output in total
fish is still a major part of the Chinese diet. national fishery output increased from 35%
Annual per capita consumption of aquatic in 1975 to 71% in 2005 (Table 4). The share
products in rural households has increased of capture fishery production in total national
from 2.13 kg in 1990 to 5.01 kg in 2006. In fish production consequently declined over
2006, annual per capita consumption of this period (Li and Huang 2002).
Figure 3: Contribution of aquaculture and capture fisheries to food fish supply, world vs China,
2003
Fishery food supply (kg/capita)
Aquaculture
Capture
kg = kilogram.
Source: FAO 2007.6 Recommendation Domains for Pond Aquaculture. Country Case Study: china
Table 4: Production trends in the Chinese fishery sector, 1975-2005
1975 1980 2000 2005
Capture fisheries (‘000 t) 3,497 3,147 17,192 17,362
Aquaculture (‘000 t) 1,876 2,660 34,210 43,269
Aquaculture % of total production 34.9 45.8 66.5 71.4
t = tonne.
Source: FAO Fishstat Plus 2007.
Marine capture fisheries constituted the of the progress in artificial reproduction
most important fishery subsector in China and the nursing of cultured freshwater
until the end of the last century but have species. By 2003, complete artificial
since been stagnant. Starting in the 1990s, propagation (i.e., with the whole lifecycle
the emphasis shifted to aquaculture. The controlled artificially) had been successfully
most impressive growth has been realized accomplished for 45 of the 59 species of
in the area of freshwater aquaculture (Figure cultured freshwater finfish. For only six fish
4 and Annex 3). Remarkably, China is the species was there no success in artificial
only country among the world’s major fish propagation, and for the remaining eight the
producers whose aquaculture harvest brooders were still collected from the wild.
exceeds that of capture fisheries (Wang Artificial propagation was also achieved
2001, FAO 2005). Aquaculture production for the major crab, prawn, mollusc and
in China has grown at an average annual turtle species (Annex 4). This technological
growth rate of 11% over the past 3 decades, progress greatly improved the availability
far outpacing the global growth rate of fry and fingerlings. In addition to greater
(Figure 5). fingerling quantity and higher quality, there
were other improvements in the production
The dramatic increase, particularly in system, as aquafeeds became available
cultured fish production, results from both and were widely used and, with the general
area expansion and rising productivity. availability of electricity, powered aerators
Technological change is the primary engine were installed in many fishponds. This
for the rapid growth that has occurred since allowed the large increase in yields realized
the 1980s (CCAP and FFRC 2004, Li and in all aquaculture production environments
Huang 2002). Li (2003) gives an overview (Annex 5).
Figure 4: Output of aquatic products in China by environment, 1950-2006
Freshwater cultured
Marine cultured
Freshwater captured
Marine captured
t = tonne.
Source: NBSC 2007.Overview of the National Fishery Sector 7
Figure 5: Trends in aquaculture production in inland and marine waters
Inland waters
China
Rest of the world
Marine waters
China
Rest of the world
Note: Data exclude miscellaneous animal products.
Source: FAO Fisheries and Aquaculture Information and Statistics Service, available at www.fao.org/fishery/statistics/global-
aquaculture-production/query/en (accessed on 21/11/2008).
According to Zhong and Power (1997), the with the share of finned fish in total aquatic
increase in freshwater capture fisheries production falling from 78% in 1980 to 61%
(Annex 3) can be attributed to (1) the stocking in 2000 (Figure 6).
of natural water bodies, mainly with carps;
(2) more intensive exploitation of previously The major freshwater fish-producing
lightly fished lakes and reservoirs in remote provinces, each accounting for more than
areas; and (3) increased fishing effort in 1.2 million t of freshwater fish production,
general. However, Chinese capture fisheries are Guangdong, Hunan, Hubei, Anhui and
have not significantly increased production Jiangsu (Figures 7 and 11, the latter showing
since the late 1990s (Figure 4). province names). The same provinces
are the leaders with regard to freshwater
The lion’s share of the aquatic products fish production in ponds, each with more
produced in China is various species than 0.72 million t. But when considering
of finned fish. However, other products, the relative importance of freshwater fish
especially high-value species such as ponds — the share of pond production in
shrimp and molluscs, are catching up, total freshwater fish production (Figure 8)8 Recommendation Domains for Pond Aquaculture. Country Case Study: china
Figure 6: Share of different aquatic products in total output in China (%)
1980 1990 2000
5.8
5.8 12.5
10.5 25.4
9.4
60.9
77.9 75.0 9.0
Finfish Shrimps, prawns and crabs Molluscs Algae Others
Source: NBSC 2007.
Figure 7: Total freshwater culture fish production in China by province
Henan province boundary
TOTAL FRESHWATER CULTURE
FISH PRODUCTION (‘000 tonnes)
≤ 100
101-500
501-1,000
>1,000
Source: NBSC 2004.
— some other provinces, including Henan, China. With respect to location and water
the study area for the RD project (outlined in salinity, these ecosystems can be grouped
bold in Figures 7 and 11), reach more than into two broad categories: (1) inland and (2)
75% (Figure 8). brackish plus marine. Although rich in water
resources in absolute terms, China ranks
2.3 Ecosystems for only 85th in the world in terms of inland
aquaculture and overview water resource availability per capita (CCAP
of farming systems and FFRC 2004), indicating that freshwater
is a limiting factor for pond aquaculture
A number of different aquatic ecosystems nationwide. In 2001, the aquatic ecosystems
contribute to aquaculture production in that made the largest contribution toOverview of the National Fishery Sector 9
Figure 8: Share of ponds in total freshwater fish production in China by province
SHARE OF POND IN TOTAL
FRESHWATER FISH PRODUCTION (%)
≤ 25
25-50
50-75
>75
Source: NBSC 2004.
aquaculture production were inland ponds, seven provinces of Guangdong, Jiangsu,
with 41% of national production. The Hubei, Hunan, Anhui, Jiangxi and Shanghai,
second largest contributor was mudflats, which together account for 68% of the
accounting for 20%, followed by shallow country’s inland aquaculture output (FAO
sea ecosystems with 18%. Lakes, rivers, 2005). Freshwater aquaculture is also found
reservoirs and other inland open-water in open water bodies such as reservoirs,
ecosystems accounted for 11%. lakes and rivers. The first reservoir was
constructed about a thousand years ago
Inland ecosystems in Zhejiang Province for irrigation. Only 20
reservoirs existed a millennium later, when
China has a total inland water area of the People’s Republic of China was founded.
18,199,412 hectares (ha), including 2,286,079 Since then, many reservoirs have been built.
ha of fishponds in 2001 and accounting for Today, there are nearly 85,000 reservoirs
1.9% of Chinese territory (CCAP and FFRC with an estimated total water surface area
2004, Miao et al. undated). Of the various of 2 million ha and a storage capacity of 457
inland aquaculture systems, pond culture is billion cubic metres.
the most popular and important fish-farming
system in China, accounting for 72% of Other important inland water resources
total inland aquaculture output in 2001 are lakes, of which there are over 24,000
(Table 5). In that year, ponds occupied only of various sizes. The majority of lakes are
33% of the total inland aquaculture area. smaller than 50 km² and less than 10 m
This production environment has higher deep. The water surface area of all lakes
yield mainly because of the high intensity accounts for 42.2% of the total inland water
of production, with feeding, fertilizing and area. However, many of these open water
aeration of ponds (Annex 5). The majority of bodies have suffered from pollution over
the ponds are concentrated in the basins of the past four decades and thus lost a lot of
the Yangtze and Pearl rivers, covering the fishery potential (Miao et al. undated).10 Recommendation Domains for Pond Aquaculture. Country Case Study: china
Table 5: Area and aquatic production of freshwater environments, 2001
Cultured area % of Production % of
Types
(’000 ha) total areaa (’000 t) total production
Pond 2,220 33.4 10,876 71.7
Lake 895 13.5 933 6.2
Reservoir 1,621 24.4 1,494 9.8
River 378 5.6 664 4.4
Rice field 1,532 23.1 746 4.9
Other na na 456 3.0
China total 6,646 a 15,169
ha = hectare, na = not available, t = tonne.
a
The China Statistical Yearbook 2002 reports a total area “utilized” of 5,278,000 ha, which is lower than the sum of the cultured
area for the individual environments. We have thus added up the figures for the different cultured areas (reported as China total
cultured area) and based the percentage shares on this figure.
Source: NBSC 2002.
In addition to the areas reported as an overview of the extent of marine and
“cultured” in Table 5 under the various inland brackish water environments in China.
aquatic ecosystems, large areas that could Various marine fish species and molluscs
be used for aquaculture exist, especially have been developed for marine and
rice fields, with an estimated total area of brackish water farming during the past
28,812,420 ha. A number of documents 2 decades. Cultured area was 117,000 ha,
also point to “swamp“ waste areas, which with production of 415,900 t, in 1979 and
are estimated to cover 11 million ha (CCAP climbed to 1,530,000 ha in 2003, with
and FFRC 2004). However, the most production of 12,530,000 t (FAO 2005).
extensive wetlands are found in Tibet and
Qinghai, which are most likely unsuited for Farming systems
aquaculture because of their very long, cold
winters and their remoteness from markets in As stated above, the aquaculture subsector
major urban centres. An additional concern in China is extremely diverse, spanning the
with converting swamps or wetlands into full spectrum from extensive, small-scale
aquaculture production areas is the loss of production to very high-intensity commercial
the ecological and recreational services of firms. In addition to the modification
such “wastelands”. of traditional aquaculture techniques,
numerous new technologies have been
Brackish and marine ecosystems developed to improve the production and
quality of aquaculture products. Many
With its long coastline, China has abundant diverse aquaculture technologies are thus
marine and brackish water resources.The currently employed in China. They fall into
total marine area within the exclusive three categories: (1) freshwater aquaculture
economic zone of China is 472,700 km². in inland ecosystems, (2) marine and brackish
Statistically, marine and brackish eco- water culture, and (3) hatchery technologies.
systems are not clearly separated but The following paragraphs provide a brief
classified into three general types: mud- overview of the most common farming
flats, shallow sea (up to 10 m in depth) system in each of these categories.
and deep sea (over 10 m). Table 6 gives
Table 6: Marine and brackish water environments in China (1,000 ha)
Environments Bohai Sea Yellow Sea East China Sea South China Sea Total
Mudflat 507 549 493 369 1,918
Shallow sea 1,662 2,019 2,119 1,592 7,392
Deep sea 5,571 35,432 74,387 348,093 463,483
Total 7,700 38,000 77,000 350,000 472,700
ha = hectare.
Sources: Compiled from Miao et al. undated, CCAP and FFRC 2004.Overview of the National Fishery Sector 11
Inland aquaculture systems comprise systems. The intensity varies from extensive
mainly ponds but also reservoirs, rivers to intensive. Within marine aquaculture
and lakes with either stock enhancement or systems, various technologies are applied.
cage or pen culture. Traditionally, freshwater Monoculture systems use cages, rafts
aquaculture in China is polyculture, which with hanging nets, or indoor running water
makes the best use of available resources systems. Polyculture marine technologies
in terms of the habits and food requirements include sea bottom and mudflat culture
of the farmed aquatic species. The most methods. The major species produced in
commonly used traditional fish are various brackish water and marine environments are
carp species (Table 7). Expanding on molluscs such as oysters (31.0% of brackish
indigenous species, a large number of exotic water aquaculture production), clams
aquatic species have been introduced to (23.2%) and scallops (8.5%) (CCAP and
China. Ma et al. (2003) list around 70 exotic FFRC 2004), as well as seaweed. As with
species and 100 native species that have freshwater aquaculture systems, the inputs
been intentionally introduced or stocked in used vary with intensity and practice.
China’s inland waters. Among them, the Nile
tilapia, produced in 23 out of 30 provinces, In general, freshwater, marine and brackish
is the most commonly used species for fish water cultivation have all shifted toward
culture and among the major export species the production of high-value species such
(Zhong and Power 1997). Depending on the as mitten carp, prawn, eel, frog, crawfish,
technology and intensity, the aquaculture grouper, pearl oyster, abalone and sturgeon.
systems can be monocultures, and in many In 2003, high-value species accounted for
cases aerators and feeding machines are about 30% of total aquaculture production
used. Technologies vary from earthen by value, compared with only 1% in 1979.
ponds to cages and pen culture in open Table 7 shows the dominant aquaculture
water bodies, and on to indoor tanks with species in 2003.
running water systems. Fish in rice paddies
is an integrated system of aquaculture, and China also has a growing sector producing
earthen ponds can be integrated with other ornamental fish, mainly goldfish, for
agricultural pursuits such as livestock or aquariums and recreational ponds. The
vegetables. Of the various types of aquatic value of China’s exports of ornamental
animals, finfish are the most popular group. fish was estimated at $19 million in 2000,
Depending on farming practices, intensity accounting for 10% of global exports and
and the socioeconomic environment, 15% of the exports of Asian suppliers (Ling
the amount of inputs used in different and Lim 2005).
aquaculture systems varies greatly. Typical
inputs are formulated feed, seed, chemical Hatchery technologies play an important role
and mineral fertilizer, manpower, and in aquaculture development and resource
electrical power or fuel to run aerators or enhancement by making production
feeding machines. independent of wild-caught fry. This not only
takes pressure off natural ecosystems but
Brackish water aquaculture technologies are also provides much more flexibility in terms
primarily pond polyculture or monoculture of the location and timing of aquaculture
Table 7: Major species in Chinese freshwater and marine aquaculture, 2003
Freshwater aquaculture Marine aquaculture
Major species Share by value (%) Major species Share by value (%)
Silver carp and bighead carp 30.1 Finfish 4.1
Grass carp 20.2 Crustacean 5.3
Common carp 13.2 Mollusc 78.6
Crucian carp 10.0 Seaweed 11.0
Tilapia 4.2 Other 1.0
Other 22.3
Source: Yang 2005.12 Recommendation Domains for Pond Aquaculture. Country Case Study: china
production, as well as facilitating quality (see Yang [2005] for the organizational
control and strain enhancement. Hatcheries structure of the Bureau of Fisheries). Other
used to be operated by the government, but related institutions include the National
this has changed dramatically over recent Fisheries Technology Extension Center,
decades with economic liberalization. Today, with branches for each province, prefecture
there are two general types of hatcheries in and autonomous region, and fisheries
China. The first operates on a large scale research and education institutions, which
with small margins, culturing common are major players in the fisheries sector
species such as carps. The second operates (Figure 9). There are separate institutions for
on a smaller scale with higher margins, legal technical inspection of fishing vessels
culturing high-value species such as marine (Bureau of Fishing Vessel Inspection),
fish. A successful hatchery operation can fishery law enforcement in large inland
be highly profitable. As adopting hatchery water bodies and at major ports, and
technologies requires high investments, fishery environmental monitoring stations
skills and technological knowledge, small- (FAO 2008). Other government institutions
scale farmers hardly benefit directly from related to fisheries include the State Oceanic
these technologies. Hatchery technologies Administration, National Environmental
are an important support to the aquaculture Protection Agency and Ministry of Water
sector, as they provide the most essential Resources (FAO 1997).
input: fish seed (Miao et al. undated).
The strategies followed by the Chinese
government are very different for the
2.4 Policies and
capture fishery and aquaculture subsectors,
regulations for capture
though the overall goal of all agriculture and
fisheries and aquaculture
aquaculture policy is food self-sufficiency.
The major government institution for fishery The management objective for coastal
administration in China is the Bureau of marine capture fisheries became zero
Fisheries, under the Ministry of Agriculture. growth in 1999 and has been minus growth
Major functions of the Bureau of Fisheries since 2001 (FAO 2008), while the growth of
are to (1) formulate plans, strategies, policies aquaculture has been highly encouraged
and programmes for fisheries development; and promoted. The major reason for halting
(2) guide the economic reform of fisheries; the intensification of capture fisheries is
(3) implement, monitor and enforce the declining wild fish stocks, indicated by the
fishery laws, regulations, and international growing catch of small and immature fish.
and bilateral fisheries agreements; (4) To achieve a reduction of coastal capture
strengthen fishery management to properly fisheries, the government has since 2002
utilize fishery and aquatic resources and reduced the number of fishing vessels and
protect the fishery environment; (5) support moved fishermen out of marine capture
fishery education and scientific research; fisheries. Similarly, closed seasons, during
(6) supervise and administer fishing vessel which fishing is banned in major inland
safety and superintend fishing ports; and fishing areas such as the Yangtze River
(7) administer the building of fishing boats and a number of reservoirs and lakes, were
and the manufacture of fishery machinery introduced in 2003 (FAO 2008).
and gear (FAO 1997). Under the Bureau of
Fisheries, there are provincial and municipal The major laws and regulations with
fishery authorities for major fishery cities and implications for fisheries are listed in Box 1.
counties, which are under the supervision As our focus in this study is on the freshwater
of the local government and have similar aquaculture, we will concentrate on policies
functions as the Bureau of Fisheries in their and regulations of relevance for this field
respective areas. rather than try to cover capture fisheries as
well.
The Bureau of Fisheries has 10 divisions
since being reformed in 1998. Among them The development of aquaculture in China
is a division of aquaculture and a division can be divided into three phases based on
of resource and environment protection the prevailing policy environment: pre-1949,Overview of the National Fishery Sector 13
Figure 9: Administrative and technical linkages of fishery-related government institutions in China
National Bureau Provincial
Ministry of Agriculture
of Fisheries governments
National Fisheries Provincial fisheries
Chinese Academy Provincial fisheries
Technology technology extension
of Fishery Sciences research Institutions
Extension Center centers
National fisheries Fisheries educational
research institutions institutions
Ministry of Sciences
Ministry of Education
and Technology
Note: Boxes with grey background are national institutions.
Source: Adapted from Hishamunda and Subasinghe 2003.
Box 1: Major laws and regulations for fisheries in China
Fishery Law of the People’s Republic of China. As amended in October 2000,
it entered into force on 1 December 2000. Reflecting the changing international
regime of the sea and changing trends in fisheries resources, the new law adjusts
management scope and stipulates control systems to limit catches. In aquaculture,
the law stipulates that units or individuals who wish to use designated areas must
apply for an aquaculture permit through the competent fishery administration at
or above the county level and that the aquaculture permit will be granted by the
people’s government at the same level to allow use of the area for aquaculture.
Regulation for Living Resources Conservation in Bohai Bay. Entered into force
on 1 May 2004, the regulation clearly stipulates requirements for capture fisheries,
aquaculture, stock enhancement and the protection of the fishery environment in
Bohai Bay.
Regulation of Fishing Vessel Inspection, People’s Republic of China. Entered
into force on 1 August 2003, the regulation stipulates the inspection of fishing
vessels.
Notification of Implementing Closed Season for Fishing in the Yangtze River.
The notification establishes closed seasons for fishing in the Yangtze River from
2003.
Regulation of Capture Fisheries Permit Management. Entered into force on 23
August 2002.
Management Method of Fisheries Fry and Fingerling. Entered into force on 8
December 2001 and replacing an earlier act of the same name issued in June, the
new method stipulates wild fry and fingerling protection and methods of variety
selection, production, and the management of imports and exports.
Source: FAO 2008.14 Recommendation Domains for Pond Aquaculture. Country Case Study: china
1949-1978, and post-1978 (Hishamunda and The declared development goals of the
Subasinghe 2003). Before 1949, aquaculture Chinese government for the development of
was a household enterprise driven by home the fisheries sector, as listed by Yang (2005),
consumption needs and economic motives. are to
The 1949-1978 period was characterized by
the government’s primary goal of achieving • adhere to the guiding principle of “giving
food self-sufficiency and meeting the animal priority to aquaculture and develop
protein needs of the growing population. c a p t u re f i s h e r i e s a n d p ro c e s s i n g
At the same time, funds were invested in simultaneously” and to “take measures
marine aquaculture research to produce and lay emphasis in light of local
seaweed and kelp for export to earn foreign conditions”;
exchange (Hishamunda and Subasinghe • further improve the structure of the
2003). During this period, aquaculture fishery industry;
enterprises belonged to either the state or • speed the development of aquaculture;
collectives. • devote major efforts to spreading
healthy cultivation methods, with
In 1978, policy changes took place emphasis on developing efficient and
that stressed the household contract ecologically sound aquaculture;
responsibility system with remuneration • energetically develop where suitable the
linked to output, thus moving away from technology and capital needed for
collectives (FAO 1999). This liberalization of raceway fish farming;
the rights of land use and farm management • develop leisure fisheries;
was one major reform that facilitated the • increase the share of aquaculture to
development of aquaculture by leaving 67% of total fish production by 2005;
production decisions to farmers. Farmers • strictly control offshore fishing effort and
were actively encouraged to convert low- avoid increasing the marine capture
lying, saline-alkali land or other “wasteland” catch;
unsuitable for agriculture to aquaculture • develop an aquatic processing industry
and benefitted from preferential policies and enhance aquatic processing and
and privileged fiscal and investment comprehensive utilization levels;
measures (Wang 2001). With subsequent • increase the share of processed aquatic
changes in economic policies in the 1980s, products to 40% of total fish production
China created an enabling environment by 2005;
for the development of market-oriented • enhance the construction of fishery
aquaculture (FAO 2005). The liberalization infrastructure, establish service systems,
of government price controls, letting and improve aquatic product quality
fish prices be determined by prevailing and the safety inspection system;
market conditions, was a major incentive • increase the use of high-quality seed in
for aquaculture producers (Wang 2001). aquaculture to 70% by 2005;
This new policy environment — together • ensure that major aquaculture diseases
with some technological breakthroughs, are effectively prevented and treated;
especially artificial propagation — facilitated and
the fast growth of aquaculture, which took • strengthen the fisheries legal system
off earlier and proceeded faster than other and establish and improve new fishery
areas of the agricultural economy. Growth management regulations.
was indeed so fast that the fishery production
target set in the ninth 5-year agricultural The development objective over the next 5-
plan (1996-2000) was already met by 1997, 10 years is for China’s fisheries to encompass
allowing the fish production target to be a healthy capture fishery, advanced
raised from 28.5 million t to 35 million t, with aquaculture, newly developed leisure fishing
aquaculture accounting for more than 60% and a sound fishery ecological environment
(FAO 1999). The long-term tentative target (Yang 2005). The government strategy
for national fishery production to reach 51 recognizes that this will require increased
million t, worth RMB350 billion, by 2010 effort to protect fishery resources and the
(Wang 2001) was reached or exceeded by environment, the sustainable development
2006. of aquaculture, improved internationalOverview of the National Fishery Sector 15
communication and cooperation, increased 2.5 Capture fishery and
participation in international markets, aquaculture research,
the establishment of fishery information education and extension
systems for marketing, better enforcement
of laws and regulations, enhanced fishery As indicated above, research innovations,
infrastructure and support systems, and especially in hatchery technology and
continued focus on strategic research (Yang the artificial production of fish seed, have
2005). The strategy to achieve the goals set been crucial factors in the fast growth of
for aquaculture will be to sharpen the focus aquaculture in China in recent decades. The
on producing species with higher value, government invested in a comprehensive
improving pond management, intensifying research system mainly in the form of national
production, establishing standards for fish fishery research institutions (Hishamunda
seed and feed, and expanding the area and Subasinghe 2003). Related education
of rice-fish culture. The government has and extension efforts aiming to disseminate
identified six major areas of concern with the latest technologies and knowledge
regard to future aquaculture development have received similarly strong support from
that will receive prime support: (1) species the government. Only relatively recently
diversification including high-value products, has private sector aquaculture extension
(2) fishery science and standardization, (3) emerged, mainly in the form of information
fishery technology extension, (4) disease and training provided by seed and feed
control, (5) marketing, and (6) fishery manufacturers.
management and environmental protection
(Wang 2001). As part of larger attempts to reform public
institutions, according to CCAP and
China’s entry into WTO in 2001 required FFRC (2004), the “Chinese government is
that the average tariff on aquatic products currently trying to reduce the number of
be cut to 10-12% by 2004. As the average national aquaculture and fisheries research
tariff on aquatic products was only 14.3% institutions and the number of staff directly
before joining WTO, no major shock was engaged in research and development
expected (Li and Huang 2005). However, activities. Meanwhile, the per capita
for certain products such as live prawns investment for the [remaining] institutions
and fresh or chilled fish fillets, tariffs were … will be significantly increased. The major
significantly higher at 24%, and cutting purpose is to improve the efficiency of
them will result in a major price shock aquaculture and fisheries R&D in China.”
for the domestic market if large amounts
of cheaper imported products enter the At the same time, greater emphasis is
country. That said, prices for most aquatic placed on the more efficient and timely
products in China were lower than the world dissemination of research findings to narrow
market prices, so WTO accession is likely to the gap between the level of knowledge
further increase China’s fish exports (ibid). and technology available within research
At the same time, domestic prices are likely institutions and the actual practices used in
to increase as a consequence of opening production (CCAP and FFRC 2004).
up to the world market.
The following paragraphs discuss the
Mainly in response to the food quality and institutional framework, major actors and
safety concerns of countries importing their responsibilities, as well as government
aquatic products from China, and to rising priorities in the areas of fisheries education,
domestic concerns about food safety, the research and extension.
Ministry of Agriculture issued directives
in October 2004 to all relevant authorities Fisheries education
throughout the country to stop using banned
chemicals and drugs in the production of A number of Chinese institutions provide
aquaculture or related feed products (Agri- mid-level and higher education in the area of
Food Trade Service 2005). fisheries. All human resource development
for the sector currently takes place underYou can also read