ESSAYS IN APPLIED MICROECONOMICS - FUNDAÇÃO GETULIO VARGAS ESCOLA DE ECONOMIA DE SÃO PAULO VINICIUS GOMES DE LIMA
←
→
Page content transcription
If your browser does not render page correctly, please read the page content below
FUNDAÇÃO GETULIO VARGAS
 ESCOLA DE ECONOMIA DE SÃO PAULO

 VINICIUS GOMES DE LIMA

ESSAYS IN APPLIED MICROECONOMICS

 SÃO PAULO
 2021
VINICIUS GOMES DE LIMA

ESSAYS IN APPLIED MICROECONOMICS

 Tese apresentada à Escola de Economia de
 São Paulo da Fundação Getulio Vargas como
 requisito para a obtenção do título de Doutor
 em Economia. Campo de conhecimento: Mi-
 croeconomia Aplicada

 Supervisor: Vladimir Pinheiro Ponczek

 SÃO PAULO
 2021
Lima, Vinicius Gomes de.
 Essays in applied microeconomics / Vinicius Gomes de Lima. - 2021.
 89 f.

 Orientador: Vladimir Pinheiro Ponczek.
 Tese (doutorado CDEE) – Fundação Getulio Vargas, Escola de Economia de São
Paulo.

 1. Eleições - Brasil. 2. Coligações partidárias. 3. Administração pública - Brasil. 4.
Educação - Aspectos econômicos. I. Ponczek, Vladimir Pinheiro. II. Tese (doutorado)
– Escola de Economia de São Paulo. III. Fundação Getulio Vargas. IV. Título.

 CDU 324(81)

Ficha Catalográfica elaborada por: Isabele Oliveira dos Santos Garcia CRB SP-010191/O
Biblioteca Karl A. Boedecker da Fundação Getulio Vargas - SP
VINICIUS GOMES DE LIMA

ESSAYS IN APPLIED MICROECONOMICS

 Tese apresentada à Escola de Economia
 de São Paulo da Fundação Getulio Vargas
 como requisito para obtenção do título de
 Doutor em Economia de Empresas.

 Campo de Conhecimento:
 Microecoomia Aplicada

 Data de Aprovação:
 / /

 Banca examinadora:

 Prof. Dr. Vladimir Pinheiro Ponczek
 FGV-EESP

 Profa. Dr. Bruno Ferman
 FGV-EESP

 Prof. Dr. Daniel da Mata
 FGV-EESP

 Prof. Dr. Pedro Forquesato
 FEA-USP

 Prof. Dr. Raphael Corbi
 FEA-USP
Agradecimentos

 Agradeço à minha família por todo apoio no caminho que me trouxe até este
trabalho. Aos amigos dedico meu muito obrigado, em especial Eduardo e Lucas, que
sempre estiveram por perto pra tudo que viesse.
 Ju, a reta final não teria sido possível sem seu apoio incondicional, te amo. Tenho
que agradecer também ao Jeff por acordar cedo e dormir tarde comigo todos os dias dos
últimos meses (embora eu saiba que ele prefira a parte dele em petisco!).
 Agradeço ao meu orientador Vladimir pelas diversas formas de apoio durante todo
esse período. Agradeço a todas as pessoas da EESP que direta e indiretamente viabiliza-
ram esse trabalho, em especial, o professor Joelson Sampaio. Por fim, agradeço o apoio
financeiro do CNPq.
Resumo
Esta tese é composta por três ensaios em microeconomia aplicada.
O primeiro capítulo investiga o impacto de uma reforma eleitoral que limitou o tamanho de
coalizões formadas para eleições legislativas no Brasil. Com uma estratégia de diferença-
em-diferenças, o artigo mostra que houve aumento da competitividade eleitoral e uma
consequente reorganização dos agentes que resultou na eleição de candidatos mais ricos.
O segundo capítulo analisa o impacto de apoio legislativo sobre a qualidade da admi-
nistração pública no contexto de governos municipais do Brasil. O artigo propõe uma
definição de “disputa apertada” para eleições proporcionais e mostra que maior apoio
legislativo promove melhor governança quando há incentivos eleitorais ao prefeito. Do
contrário, mais apoia significa pior administração.
O terceiro capítulo em economia da educação estima efeito de pares não linear sobre
desempenho educacional. O artigo investiga o potencial de interação dos alunos como
canal de explicação do efeito. Estima-se a partir de formas reduzidas o efeito de pares
explorando a variação exógena no grupos de alunos. No entanto, leva-se em consideração
padrões de interação distinto entre alunos. De fato, os efeitos estimados são mais fortes
quando se consideram pares que participam dos mesmo grupos com mais frequência.

Palavras-chaves: coalizões eleitorais, coalizões governamentais, administração pública,
efeito de pares
Abstract
This thesis comprises three essays in applied microeconomics.
The first chapter investigates the impact of an electoral reform that limited the size
of electoral coalitions built to run in legislative elections in Brazil. With a diff-in-diff
strategy, the paper shows that the reform increased electoral competitiveness and the
reorganization of political players induced the election of richer candidates.
The second chapter analyzes the impact of stronger legislative support on the quality of
governments looking to Brazilian municipalities. The paper proposes a definition of what
is a slim margin of victory for proportional elections and shows that the greater legislative
support is beneficial to governance when mayors have electoral incentives. Otherwise, more
support means bad governance.
The third chapter deals with the economics of education. It is an article estimating non
linear peer effects by exploring the intensity of peer interaction as a possible explanation
for the effects. The effects come from reduced-form estimates exploring random variation
in students’ groups composition. Indeed, the strongest effects occur when peers meet more
frequently in different groups.

Key-words: electoral coalitions, government coalitions, public administration, peer ef-
fects
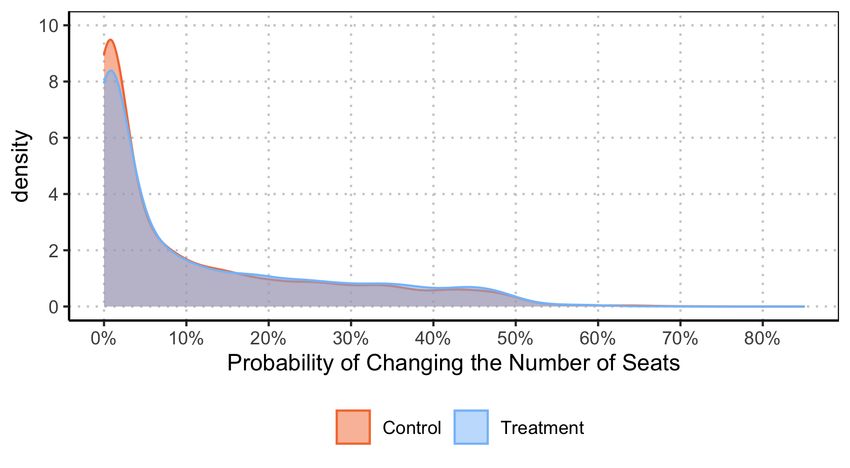
List of Figures

Figure 1.1 – Number of candidates registered by either coalitions or single parties
 in each election. Each dot is an electoral coalition or single party. In
 the 2016 election, coalitions in municipalities with more than 100,000
 registered voters could register candidates up to the limit of 150% the
 number of seats in the council. However, this difference did not exist in
 the 2012 election. . . . . . . . . . . . . . . . . . . . . . . . . . . . . . . 15
Figure 2.1 – Distribution of the variable budget flexibility, computed as the propor-
 tion of spending changes with legislative authorization relative to total
 spending in a given year. . . . . . . . . . . . . . . . . . . . . . . . . . . 35
Figure 2.2 – Each panel shows a different votes’ allocation. Panel (b) is obtained
 from panel (a) after 20 voters swung from coalition 3 to coalition 2.
 Entries in bold display the winner of the round. In each row the winning
 coalition is indicated in bold letters. The winner is the coalition with
 the highest ratio between number of votes and seats already taken plus
 one. Every coalition starts round 1 with zero seats. . . . . . . . . . . . 36
Figure 2.3 – Coalitions 1, 2, and 3 compete for a total of three seats. The value
 is the number of votes cast for coalition . In panel (a), we explicit
 the number of seats earned by coalition 1 as a function of 1 , 2 , and
 3 in the plane 1 / 3 × 2 / 3 . We set four original votes’ allocations,
 that we call elections , , , and . In panel (b), for each election,
 we simulate 500 counterfactuals using the procedure described in the
 text. A blue point is a counterfactual holding the same number of seats
 coalition 1 has in the original election. A red point is the analogous
 when the number of seats of coalition 1 changes. If these elections were
 in our dataset, election would be a control, election a treatment,
 and we would discard elections and . . . . . . . . . . . . . . . . . . 39
Figure 2.4 – Probability of the mayor’s coalition changing the number of seats . . . 44
Figure 3.1 – Random variation generated in terms of group composition. Each point
 represents a group and its place within the simplex is given by the
 proportions of each type in the group. . . . . . . . . . . . . . . . . . . 55
Figure A.1 – Municipality averages for total candidates, candidates per coalition,
 number of (effective) coalitions and number of (effective) parties. . . . 78
Figure A.2 – Municipality averages for candidates’ mean characteristics (age, gender
 and education) by status (all candidates, incumbents and elected). . . . 79
Figure A.3 – Municipality averages for (log) self-reported assets. . . . . . . . . . . . 80
Figure A.4 – Municipality averages for the average revenue per candidate (in R$1000).
 Plots by status (all candidates, incumbents and elected) and funding
 source (citizen donation, party resources and self-funding). . . . . . . . 81
Figure A.5 – Municipality averages for the total revenue (sum for all candidates in
 1000 R$). Plots by status (all candidates, incumbents and elected) and
 funding source (citizen donation, party resources and self-funding). . . 82
Figure B.1 – Coalitions 1, 2, and 3 compete for a total of three seats. The value
 is the number of votes cast for coalition . Each panel indicates the
 number of seats obtained by the mayor’s coalition as a function of 1 ,
 2 , and 3 under a specific assignment rule: the “false D’Hondt” rule
 √︁
 with ( ) = ( + 1)( + 2) in panel (a); the D’Hondt rule in panel
 √︁
 (b); and the “false D’Hondt” rule with ( ) = ( + 1) in panel
 (c). Panel (b) displays the thresholds for seats’ change in the mayor’s
 coalition under all the rules. . . . . . . . . . . . . . . . . . . . . . . . . 83
List of Tables

Table 1.1 – Descriptive Statistics (2012 Election) . . . . . . . . . . . . . . . . . . . 19
Table 1.2 – Effects on political competition . . . . . . . . . . . . . . . . . . . . . . . 21
Table 1.3 – Effects on candidates’ charachteristics . . . . . . . . . . . . . . . . . . . 22
Table 1.4 – Effects on candidates’ funding . . . . . . . . . . . . . . . . . . . . . . . 22
Table 1.5 – Effects on incumbents behavior . . . . . . . . . . . . . . . . . . . . . . . 23
Table 1.6 – Effects on incumbents’ charachteristics . . . . . . . . . . . . . . . . . . . 23
Table 1.7 – Effects on elected candidates . . . . . . . . . . . . . . . . . . . . . . . . 24
Table 1.8 – Effects on revenue and spending . . . . . . . . . . . . . . . . . . . . . . 24
Table 2.1 – Predictions of causal effects of a stronger support on . . . . . . . . . . . 34
Table 2.2 – Simulation: Example . . . . . . . . . . . . . . . . . . . . . . . . . . . . . 38
Table 2.3 – Descriptive Statistics . . . . . . . . . . . . . . . . . . . . . . . . . . . . 41
Table 2.4 – Mechanical Effects: Outcome Number of Seats of the Mayor’s Coalition 42
Table 2.5 – Placebo outcomes . . . . . . . . . . . . . . . . . . . . . . . . . . . . . . 43
Table 2.6 – Budget flexibility . . . . . . . . . . . . . . . . . . . . . . . . . . . . . . 44
Table 2.7 – Budget flexibility (II) . . . . . . . . . . . . . . . . . . . . . . . . . . . . 45
Table 2.8 – Public revenue and spending . . . . . . . . . . . . . . . . . . . . . . . . 46
Table 2.9 – Mayor’s party vote share in the next election . . . . . . . . . . . . . . . 47
Table 2.10–State courts of account recommending rejection of budget execution . . 47
Table 3.1 – Group Allocation 1 Semester . . . . . . . . . . . . . . . . . . . . . . . 54
Table 3.2 – Number of meetings by pair of students . . . . . . . . . . . . . . . . . . 56
Table 3.3 – Predetermined Ability on Group Composition . . . . . . . . . . . . . . . 58
Table 3.4 – Descriptive statistics . . . . . . . . . . . . . . . . . . . . . . . . . . . . . 59
Table 3.5 – Peer Effects on Standardized Exam Grade . . . . . . . . . . . . . . . . 61
Table 3.6 – Effect of repeated interaction on peer reporting . . . . . . . . . . . . . . 64
Table 3.7 – Peer Effects on Standardized Exam Grade . . . . . . . . . . . . . . . . . 65
Table 3.8 – Peer Effects on Time Allocation (Share by discipline) . . . . . . . . . . 67
Table A.1 – Correlation bewteen executive and legislative votes . . . . . . . . . . . . 74
Table A.2 – Effects on mayoral elections . . . . . . . . . . . . . . . . . . . . . . . . . 74
Table A.3 – Effects on political competition . . . . . . . . . . . . . . . . . . . . . . . 76
Table A.4 – Effects on candidates’ characteristics . . . . . . . . . . . . . . . . . . . . 76
Table A.5 – Effects on elected candidates . . . . . . . . . . . . . . . . . . . . . . . . 77
Table A.6 – Effects on on revenue and spending . . . . . . . . . . . . . . . . . . . . 77
Table B.1 – log number of faults (corrupt and total) . . . . . . . . . . . . . . . . . . 84
Table C.1 – Probability of responding to the survey . . . . . . . . . . . . . . . . . . 85
Table C.2 – Peer Effects on Group Perception . . . . . . . . . . . . . . . . . . . . . 86
Table C.3 – Peer Effects on Standardized Exam Grade . . . . . . . . . . . . . . . . . 87
Table C.4 – Peer Effects on Standardized Exam Grade . . . . . . . . . . . . . . . . . 88
Table C.5 – Peer Effects on Time Allocation (Share by discipline) . . . . . . . . . . 89
Contents

1 THE EFFECTS OF CONSTRAINING ELECTORAL COALITIONS
 ON POLITICAL OUTCOMES . . . . . . . . . . . . . . . . . . . . . 12
1.1 Introduction . . . . . . . . . . . . . . . . . . . . . . . . . . . . . . . . . 12
1.2 Institutional Background . . . . . . . . . . . . . . . . . . . . . . . . . 13
1.2.1 Local Elections in Brazil . . . . . . . . . . . . . . . . . . . . . . . . . . . 13
1.2.2 Electoral Reform . . . . . . . . . . . . . . . . . . . . . . . . . . . . . . . 14
1.2.3 Voters Registration . . . . . . . . . . . . . . . . . . . . . . . . . . . . . . 15
1.3 Disputing Legislative Seats . . . . . . . . . . . . . . . . . . . . . . . . 16
1.4 Data . . . . . . . . . . . . . . . . . . . . . . . . . . . . . . . . . . . . . 17
1.5 Empirical Strategy . . . . . . . . . . . . . . . . . . . . . . . . . . . . . 18
1.6 Results . . . . . . . . . . . . . . . . . . . . . . . . . . . . . . . . . . . . 20
1.6.1 Effects on Political Competition . . . . . . . . . . . . . . . . . . . . . . . 20
1.6.2 Entry of Candidates . . . . . . . . . . . . . . . . . . . . . . . . . . . . . . 21
1.6.3 Incumbents Behavior and Political Selection . . . . . . . . . . . . . . . . . 23
1.6.4 Effects on Policy . . . . . . . . . . . . . . . . . . . . . . . . . . . . . . . 24
1.6.5 Robustness Exercises . . . . . . . . . . . . . . . . . . . . . . . . . . . . . 25
1.7 Conclusion . . . . . . . . . . . . . . . . . . . . . . . . . . . . . . . . . . 25

2 TIT-FOR-TAT BETWEEN LEGISLATIVE AND EXECUTIVE . . . 26
2.1 Introduction . . . . . . . . . . . . . . . . . . . . . . . . . . . . . . . . . 26
2.2 Institutional Background . . . . . . . . . . . . . . . . . . . . . . . . . 28
2.2.1 Elections in municipalities . . . . . . . . . . . . . . . . . . . . . . . . . . 28
2.2.2 Local public budget . . . . . . . . . . . . . . . . . . . . . . . . . . . . . . 29
2.2.3 The Executive-Legislative bargain . . . . . . . . . . . . . . . . . . . . . . 30
2.3 Theoretical Framework . . . . . . . . . . . . . . . . . . . . . . . . . . 31
2.4 Data . . . . . . . . . . . . . . . . . . . . . . . . . . . . . . . . . . . . . 34
2.4.1 Electoral Data . . . . . . . . . . . . . . . . . . . . . . . . . . . . . . . . 34
2.4.2 Budget Data . . . . . . . . . . . . . . . . . . . . . . . . . . . . . . . . . 34
2.5 Research Design . . . . . . . . . . . . . . . . . . . . . . . . . . . . . . 35
2.5.1 Identification strategy . . . . . . . . . . . . . . . . . . . . . . . . . . . . . 36
2.5.2 Specification . . . . . . . . . . . . . . . . . . . . . . . . . . . . . . . . . 39
2.6 Results . . . . . . . . . . . . . . . . . . . . . . . . . . . . . . . . . . . . 41
2.6.1 Validating our identification strategy . . . . . . . . . . . . . . . . . . . . . 42
2.6.2 Main Results . . . . . . . . . . . . . . . . . . . . . . . . . . . . . . . . . 44
2.6.3 Discussion . . . . . . . . . . . . . . . . . . . . . . . . . . . . . . . . . . . 48
2.7 Conclusion . . . . . . . . . . . . . . . . . . . . . . . . . . . . . . . . . . 49

3 PEER EFFECTS IN ACTIVE LEARNING . . . . . . . . . . . . . . . 50
3.1 Introduction . . . . . . . . . . . . . . . . . . . . . . . . . . . . . . . . . 50
3.2 Organizational Framework . . . . . . . . . . . . . . . . . . . . . . . . . 52
3.3 The Assignment Mechanism . . . . . . . . . . . . . . . . . . . . . . . 53
3.4 Data . . . . . . . . . . . . . . . . . . . . . . . . . . . . . . . . . . . . . 56
3.4.1 Variables . . . . . . . . . . . . . . . . . . . . . . . . . . . . . . . . . . . 56
3.4.2 Balance checks and descriptive statistics . . . . . . . . . . . . . . . . . . . 58
3.5 Empirical Strategy . . . . . . . . . . . . . . . . . . . . . . . . . . . . . 59
3.6 Results . . . . . . . . . . . . . . . . . . . . . . . . . . . . . . . . . . . . 60
3.6.1 Nonlinear peer effects . . . . . . . . . . . . . . . . . . . . . . . . . . . . . 60
3.6.2 Effects of repeated interaction on actual interaction . . . . . . . . . . . . . 62
3.6.3 Effects of repeated interaction on performance . . . . . . . . . . . . . . . 63
3.7 Robustness checks . . . . . . . . . . . . . . . . . . . . . . . . . . . . . 66
3.8 Conclusion . . . . . . . . . . . . . . . . . . . . . . . . . . . . . . . . . . 68

 BIBLIOGRAPHY . . . . . . . . . . . . . . . . . . . . . . . . . . . . 69

 APPENDIX 73

 APPENDIX A - Appendix from First Chapter . . . . . . . . . . . . 74
A.1 Spillover on Executive Elections . . . . . . . . . . . . . . . . . . . . . 74
A.2 Robustness results and DID plots . . . . . . . . . . . . . . . . . . . . 76

 APPENDIX B - Appendix from Second Chapter . . . . . . . . . . . 83
B.1 Generating false D’Hondt rules . . . . . . . . . . . . . . . . . . . . . . 83
B.2 Results on corruption . . . . . . . . . . . . . . . . . . . . . . . . . . . 84

 APPENDIX C - Appendix from Third Chapter . . . . . . . . . . . . 85
C.1 Survey responses . . . . . . . . . . . . . . . . . . . . . . . . . . . . . . 85
C.2 Effects of repeated interaction on group functioning . . . . . . . . . 85
C.3 Robustness exercises . . . . . . . . . . . . . . . . . . . . . . . . . . . . 87
12

1 The Effects of Constraining Electoral
 Coalitions on Political Outcomes

1.1 Introduction
 Political competition can be a source of economic welfare if it promotes the selec-
tion of better politicians and the enhancement of electoral accountability. Since parties
are key players in politics, the consequences of competition for the economic develop-
ment can depend on what they do when facing competitive environments. When a large
number of parties compete for votes it is possible that they end up engaging in special-
interest politics leading to underprovision of public goods. Excessive competition in this
case can be detrimental to development (BESLEY; PERSSON; STURM, 2010; BESLEY;
PRESTON, 2002; LIZZERI; PERSICO, 2005). As elections are at the core of political
competition, electoral rules are important constraints on what strategies are available for
parties. Changing these rules can change parties’ decisions on whether and how they take
part in elections. This can have consequences for the incentives that potential candidates
might face and for the outcomes of an election.
 In this paper, we evaluate the impact of a reform that constrained the size of
electoral coalitions in Brazil. This reform limited the maximum number of candidates
that an electoral coalition could register to dispute seats for local legislative councils.
This change targeted municipalities above the threshold of 100,000 registered voters and
this is the exogenous shock we explore with a difference-in-differences strategy. The main
results are that the reform increased political competition and this led to the election of
substantially richer candidates and to a modest increase of spending in education.
 In Brazil, during the period we consider, it was the aggregation of votes cast
for parties within an electoral coalition that mattered for the distribution of legislative
seats. Thus, parties’ behavior changed in response to a change in a rule about coalitions.
The 25% decrease in the maximum number of candidates per coalition imposed by the
reform translated into a 23% decrease on the average number of candidates per coalition.
However, we do not reject the absence of effect on the total number of candidates entering
the dispute. Also, there was no impact in the number of parties entering the elections. This
resulted from parties circumventing the limit on coalition size. In treated municipalities
they formed 2 more coalitions, on average, what represents a 22.7% increase. Besides,
there was a 13.6% increase in the effective number of coalitions, a measure of political
competition.
 We find no significant effect on average education and age of candidates. There
13

was small increase of 3.8% on the proportion of women running for a seat that did not
translate into more women elected for the councils. A relevant results is that the more
competitive environment attracted richer candidates. Citizens entering the election were,
on average, 15.6% richer (measured by self-reported assets) compared to what would be
expected without the reform. Further, it translated into richer candidates (+19.3%) being
elected to the council. Importantly, although one of its goals was reducing the costs of
electoral campaigns, the reform did not have impact on the total money raised by candi-
dates. The tighter competition might have led parties and coalitions to a new equilibrium
with the same level of revenue/spending. Finally, we find a 5.3% increase in the aver-
age budget share allocated to education. We do not find increase in party fragmentation
within councils. Thus, we interpret that this could result from more electoral competition
translating into increased accountability. None of these results hold in robustness exer-
cises in which we do the analysis falsely considering the previous election as the time of
the reform or considering the 2016 election as the moment of implementation but using
a false threshold to define treatment.
 This paper contributes with empirical evidence to a literature discussing why elec-
toral coalitions form and what can be the consequences for policy.1 We also speak with
paper discussing the impact of political institutions, electoral rules in particular, on de-
velopment (CANTONI; PONS, 2019). On this side, the paper more relevant is Avis et al.
(2017), which explore the of limits on electoral campaign spending in the same context of
ours to show that this cap also increased political competition.
 In the sequence we explain institutional aspects to understand elections in Brazil
and the reform implemented. Then, we discuss the empirical strategy of the paper. Finally,
we present and discuss the results along with different robustness exercises.

1.2 Institutional Background
1.2.1 Local Elections in Brazil
 Local elections in Brazil take place every four years. In these elections voters
choose simultaneously a mayor and a local council in each municipality. Executive elections
happen under simple plurality in municipalities with population below 200,000 registered
voters. Above this threshold, either a candidate becomes mayor if she has more than
50% of votes or a runoff election takes place. Besides choosing a candidate for mayor,
voters also choose a candidate to the local council. The number of councilors elected in a
municipality is determined by its population one year before election. Candidates for the
local council are elected under an open-list proportional representation system. In this
system, voters choose either a party or a candidate. Votes cast for a candidate increase
 1
 Bandyopadhyay, Chatterjee e Sjostrom (2009), Golder (2005), Debus (2009)
14

his party’s total votes and also define the candidate’s position in the party’s ranking of
candidates. This is important because the seats that a party eventually gets are filled by
the highest ranked candidates according to their personal votes.
 Up to the 2016 elections, political parties could form electoral coalitions to dispute
legislative seats. It consists in an aggregation of parties formally announced before election
to the Brazilian Electoral Court (TSE). This possibility adds one more layer in the system
described before: votes cast for either a party or a candidate add up to the total coalition
votes and council seats are distributed according to coalitions’ total votes. Now, council
seats assigned to a coalition go to the highest ranked candidates from each coalition
irrespective of their party. For example, suppose parties A and B decide to run together
in an electoral coalition. Then votes cast for both parties count to define how many seats
this coalition will get. Suppose this coalition gets three seats. Then, from all candidates
running for either party A or B, the three most voted ones will be elected, irrespective of
their party.
 It is worth mentioning why local legislative elections matter. Brazilian Constitution
sets local governs as the responsible for the provision of many public services such as health
and education. To provide these services mayors must submit to the local council a budget
proposal describing the policies he wants to implement. In another paper, we discuss how
legislative support in this step matters for good governance.2 Also, Ferraz e Finan (2011b)
show suggestive results that provision of public goods increase with legislators’ effort since
this makes the mayor more accountable.

1.2.2 Electoral Reform
 An electoral reform was undertaken in 2015 with the explicit goal of reducing
the costs of electoral campaigns and simplifying political parties’ management.3 Among
several changes that would govern local elections held in October/2016, the reform set
new limits on the maximum number of candidates each party or coalition could register in
election for local legislative councils.4 The law containing modifications in electoral rule
was approved in September/2015 and resulted from different proposals, but the specific
change we explore in the paper first appeared in drafts released in July/2015.5
 The exogenous shock implied by the reform results from a statement saying that in
municipalities above the threshold of 100,000 registered voters, the number of candidates
 2
 The chapter “Tit-for-Tat between Legislative and Executive” of this thesis.
 3
 The reform was implemented by the law 13165/2015 available at . Another very important change in the context of these
reform was the introduction of campaing spending limits. This is analyzed by (AVIS et al., 2017).
 4
 Article no. 10 of the law 9504/1997. They are available at:
 5
 Proposals 2235/2015, 2259/2015, 5735/2013 can be found in a search at
15

presented by parties or coalitions was limited to 150% of the seats to be distributed in
the city’s council. In municipalities below this threshold, the limit also holds for parties,
but for coalitions the limit is 200% of the seats. Figure (1.1) illustrate the change.

 2012 2016

 2.0
 Candidates per Seat

 1.5

 1.0

 0.5

 0.0
 80 100 120 80 100 120

 Registered Voters (in thousands)

Figure 1.1 – Number of candidates registered by either coalitions or single parties in each election. Each
 dot is an electoral coalition or single party. In the 2016 election, coalitions in municipalities
 with more than 100,000 registered voters could register candidates up to the limit of 150%
 the number of seats in the council. However, this difference did not exist in the 2012 election.

 For example, in a city with 90,000 voters that elects 17 councilors, a single party
can register up to 26 candidates and a coalition can register up to 34 candidates. However,
in a city with 110,000 voters that also elects 17 councilors, both parties and coalitions are
limited to 26 candidates. This limit does not depend on the number of parties forming
the coalition. Thus, for municipalities above the threshold of 100,000 voters there were
a sharp decrease in the number of candidates per seat that an electoral coalitions could
register. A final remark is that no specific reason for the choice of 100,000 voters as the
threshold appears in the proposal’s drafts. Besides, we found no documented evidence
that local politicians somehow influenced this choice. Although we find this implausible,
we can not rule out this possibility since local politics are important for the election of
the congressmen that ultimately designed the law (FIRPO; PONCZEK; SANFELICE,
2015; VENTURA, 2021).

1.2.3 Voters Registration
 The number of registered voters is a key variable for our analysis since it determines
the rule change. So we present here some important issues with implications for our
empirical strategy. Voting is mandatory in Brazil for people aged between 18 and 70
years old. It is optional for (i) illiterate people (ii) people older than 16 and younger
than 18 years old, and (iii) people older than 70 years old. To be able to vote, a person
16

must go to an electoral office (cartório eleitoral) near his home to present an idetification
document and some proof of his place of residence. These electoral offices are managed by
a state electoral court (Tribunal Regional Eleitoral) and they are responsible for voters
registration as well as the organization of the elections at the local level. An electoral office
may be responsible for more than one municipality, but this only happens to aggregate
small cities. In the sample used in the paper, there is only one case of an electoral office
responsible for two different cities. In our sample, 69% of the cities have only one office,
in 29% of them there are two offices and only in 2% there are more than two offices.
 There are some issues regarding the number of registered voters: difficult in remov-
ing dead voters from the database as well as cases of duplicates and frauds (NICOLAU,
2004). Motivated by the problem of fraud, the Brazilian Electoral Court started in 2008 a
program to have a biometric identification of voters. Each year, TSE informed state courts
what municipalities should proceed with voters’ registration update. In practice, voters
in these municipalities had to show up in an electoral office to make their registration
again. One consequence of this program is that voters not showing up during the period
of re-registration had their register cancelled and so it impacted directly the number of
registered voters in that municipality. During the period considered in our sample, not all
municipalities updated their voters database and even some of those who did might have
done only a partial update, but we can observe what happend for each case.
 Two issues about this process of update in voters registration are worth mentioning.
It could have had different impacts across municipalities depending on voters demograph-
ics. For example, there are cases in which regular electoral register is a requirement for
signing formal job contracts and to obtain personal documents such as passports. Thus,
not showing up to make the update might have been correlated with age and/or school-
ing (FERRAZ; VARJAO, 2015). Besides, personel in charge of the registration task are
usually tenured employees from electoral courts working at electoral offices. However, the
electoral court can demand public employees from the municipal administration to help in
this task.6 Also, these public servers can apply voluntarily in order to help with this kind
of service. Unfortunately, there is no data on how frequently this actually happened. We
discuss implications of these points when presenting the empirical strategy of the paper.

1.3 Disputing Legislative Seats
 It is important to understand why the number of candidates registered in a coali-
tion should matter in our context. The process of distributing legislative seats consists in
mapping the (continuous) share of votes each coalition gets into a (discrete) number of
seats. In Brazil this is done through a combination of methods.7 For our purposes, the
 6
 Law 6.999/82 available at
 7
 D’Hondt method and Hare quota.
17

crucial aspects of the rule resulting from this combination are the following. Suppose a
municipality with 10 seats in a council counts a total of 10,000 votes. The assignment
rule adopted in Brazil states that coalitions must have at least 10, 000/10 = 1000 votes
to get a seat.8 Thus, if parties A, B, and C enter the dispute by themselves and get 900,
450 and 450 votes respectively, none of them would get a seat. However, if they formed
a coalition and had these same votes, the coalition would sum 1800 votes, ensuring one
seat in the council.
 But the design of the rule implies that there is a positive probability of getting one
more seat since coalition votes are close to the “next seat” (2000 votes). In such a scenario,
parties B and C would have incentives to make effort to get votes since they could get
a seat even without reaching 1000 votes. The number of candidates is important in this
effort. First, electoral campaigns are costly and more candidates in a party can bring
more money. Also, a greater number of candidates can mobilize more voters. And finally,
at least in Brazil, votes are somewhat personal (SAMUELS, 1999) and more candidates
means reaching more people through personal ties.
 To put it more concretely, suppose that the coalition formed by parties A, B and
C can achieve a certain number of votes V with 10, 5 and 5 candidates, respectively,
reaching the ceiling of 20 candidates allowed by law. A cap imposing a limit of 15 total
candidates for the coalition could affect parties’ probabilities of election in two ways. With
fewer number of candidates, the coalition could see a decrease in its share of votes and
thus in the probability of getting seats. In our simple example, it could be the case that
the coalition still passes the threshold, but with fewer votes. Suppose for a moment that
the distribution of candidates in the coalition remained fixed after the new cap, so the
share of votes of each party within the coalition was approximately constant. In this case,
while party A would still have a high probability of ending up with one seat, parties B
and C could face a strong decrease in the probability of electing some candidate.
 This would create incentives for parties B and C to seek for other coalitions’ ar-
rangements. But without parties B and C in A’s coalition, party A would see its probability
of getting a seat significantly reduced, so A would also look for new arrangements.

1.4 Data
 Here we present some remarks about the data we use. Table 1.1 shows that treat-
ment and control municipalities are not so different in terms of several variables measured
in the 2012 election. The important exception is the size of municipalities. It is the vari-
able registered voters that determine treatment. Descriptive statistics are shown to the
 8
 This was no longer valid for the 2020 election.
18

sample we consider in our main analysis, which comprises cities with 20,000 voters below
or above the 100,000 voters threshold.

Elections

 We use data of three municipal elections held in the period 2008-2016 provided
by the Brazilian Electoral Court. From this source we retrieve information on registered
voters and candidates socioeconomic characteristics (gender, age and education). Also,
this is the data from which we count the number of registered voters that determined the
cap on coalitions size for each municipality. It is possible to observe what parties joined
into electoral coalitions for both legislative and executive elections and this allows us to
compute variables related to the elections final results. Candidates data contains self-
reported assets before the election as well as the amount of money used in the campaign.
These monetary variables are expressed in Brazilian reais of December/2020. Finally,
there is a variable measuring the proportion of voters in the municipality with registered
biometric identification.
 All outcomes and most of the controls are municipality averages. One point worth
mentioning is that for the self-reported assets we excluded some outliers before computing
the averages. These observations were candidates reporting assets above one billion reais,
while the median was 19,500. Without excluding these observation, the estimated effects
on this outcome were substantially higher.

Public Finance

 Municipalities report to the National Treasury Department of Brazil balance sheets
containing detailed info about revenue and spending. We use this database (FINBRA) to
get info on money transfers from federal and state governments, which represent most of
the revenue available to municipalities, and variables for spending in education and health.
For these two areas specifically, Brazilian constitution mandates a minimum spending of
25% and 15%, respectively, calculated over a set of revenue sources. Every year, Brazilian
Health and Education Ministries check the compliance with these threshold and release the
audited proportion spending in each area. We use percentage points above the minimum
as a measure of discretionary spending in these areas. All variables are computed for each
municipality as the average over the four year of councilors/mayor term.

1.5 Empirical Strategy
 To estimate the effects of limiting electoral coalition size (our treatment) we explore
the exogenous change in the number of candidates per coalition valid for the 2016 election
19

 Table 1.1 – Descriptive Statistics (2012 Election)

 Control Treatment
 Mean diff. P-value
 Mean SD Mean SD
 Municipalities characteristics
 Registered voters 86,707.2 8,069.0 103,162.3 9,923.1 16,455.1 0.000
 Population 122,346.2 15,308.4 153,447.1 20,989.9 31,100.8 0.000
 Money transfers (million R$) 327.6 160.5 371.4 110.4 43.7 0.192
 Council seats 15.07 2.70 15.66 3.44 0.585 0.389
 Mayor in 1 term 0.54 0.50 0.66 0.48 0.111 0.328
 Number of parties 22.68 2.47 22.83 2.73 0.143 0.806
 Total candidates 209.95 57.95 220.17 45.62 10.225 0.410
 Municipalities 57 29

 Voters profile (proportion)
 Between 16 and 34 years old 0.41 0.04 0.43 0.04 0.015 0.107
 Between 35 and 59 years old 0.44 0.03 0.43 0.02 -0.002 0.769
 College degree 0.04 0.02 0.03 0.02 -0.005 0.343
 High school degree 0.19 0.05 0.18 0.05 -0.002 0.852
 Women 0.52 0.01 0.52 0.01 0.002 0.455

 Candidates profile
 College degree 0.26 0.07 0.25 0.08 -0.017 0.297
 High school degree 0.06 0.03 0.07 0.03 0.005 0.401
 Age 46.35 2.42 45.29 1.52 -1.058 0.035
 Women 0.30 0.02 0.30 0.02 -0.003 0.576
 Asset (in R$) 114,832 69,428 98,879 44,066 - 15,953 0.264

 Funding sources (in R$)
 Self-funding 6,058 2,493 6,886 2,955 828.19 0.175
 Citizen donation 8,864 4,767 9,326 5,955 461.36 0.698
 Party resource 5,365 17,519 3,833 3,691 - 1,531.38 0.644
 Notes: Descriptive statistics for the sample of municipalities with 20,000 voters below or above the 100,000 voters
 threshold. Monetary values expressed in prices of December/2020.

with a difference-in-differences strategy. As stated before, there is no documented evidence
that municipalities influenced the definition of voters threshold which defined maximum
coalition size. But we presented some issues that might arise from the voters registration
process. We address each of these points below.
 A simple regression of an outcome for the 2016 election on a treatment indicator
would confound any factor covarying with municipality size and sample size is not enough
to employ a regression discontinuity solution. Since we can observe a municipality for
more than just one election, results throughout the paper are obtained by a fixed-effects
regression described by the following equation of an outcome of interest for municipality
 in election :

 = + voters + updated + ′ x −4 + ′ z + + + (1.1)

 In equation (1.1), T = 1 for municipalities above the 100,000 voters threshold in
 = 2016 and voters is the number of registered voters in for election . As discussed
before, the update of voters’ biometric identification in some municipalities between 2008
and 2016 is correlated with voters registration and makes it correlated with voters . So
20

we include the variable updated , which consists in all voters registered in for the − 4
election that went to an electoral office to provide biometric info before the election in .
But as incentives for the voters to show up and update their registration might depend on
demographics, we include the vector x −4 which contains a profile of age, education and
gender of voters registered for the previous election. We further control for a vector z
containing federal money transfers to the municipality and the number of legislatives seats
in dispute. Finally, the equation contains a time-specific shock , municipality unobserved
heterogeneity and the error term .
 However, the update of biometric identification could still be affected by unob-
servables not captured by . As it started in different years across the cities there could
by time-varying unobservables correlated with the number of registerd voters. So instead
of maintaining a strict exogeneity assumption, we state the identification hypothesis as

 [ | , X , , ] = [ |X , , ] (1.2)

where all control variables are collapsed in X . Thus, after controlling for factors known to
determine treatment, we expect that remaining unobservables do not depend on whether
the municipality gets treated or not.
 To get the estimates we will restrict our sample to 86 municipalities (as shown
in table 1.1) and 29 of them are the treated units. To check whether the calculation of
robust standard errors in our setup is enough to perform valid tests, we proceeded with
the inference assessment proposed by (FERMAN, 2019). The assessment indicates that
the size of a test about our treatment coefficient is 6.5% when we expected the usual 5%.
Thus, over-rejection does not seem to be a major problem.

1.6 Results
1.6.1 Effects on Political Competition
 Results in this section shows that the reform implied a reorganizaton of parties
entering the electoral race. There were sizeable effects, in opposing directions, on the
average number of candidates per coalition and the number of coalitions. Total candidates
remained stable and thus there was an increase of political competition.
 Table 1.2 shows an estimate of -13.5 for the impact on total candidates, what
means a 6.2% decrease relative to the total 216 candidates predicted for treated munic-
ipalities had them not been treated. However, we do not reject the hypothesis of null
effect. By setting different limits on the maximum number of candidates in treatment
and control municipalities, the electoral reform implied a decrease on the average num-
ber of candidates per coalition. The estimated treatment coefficient of -5.56 represent a
21

 Table 1.2 – Effects on political competition

 Candidates Coalitions Parties
 Total Coalition average Coalitions Eff. Coalitions Parties Eff. Parties

 Treatment -13.466 -5.563* 2.070* 0.992* -0.053 0.886
 (10.216) (0.708) (0.497) (0.353) (0.516) (0.619)

 Observations 258 258 258 258 258 258
 Municipalities 86 86 86 86 86 86
 + p < 0.1, * p < 0.05. Notes: Robust standard errors in parentheses

-23.2% effect, significant at 5% and we must see this result together to what happened to
coalitions.
 The relative stability in total candidates with a decrease on the average candidates
per coalition was possible due to a 22.7% increase on the number of coalitions, which is the
estimated 2.07 coefficient compared to 9 coalitions expected in the absence of treatment.
Importantly, more coalitions meant more electoral competition. This is what we analyze
by regressing the “effective number” of coalitions (GOLOSOV, 2010), measured by the
inverse of the Hirschmann-Herfindal Index calculated from coalitions’ vote share in a given
municipality.9
 Results show an estimated impact of 0.922, what represents a 13.6% increase on
the number of effective coalitions. The same does not apply to parties. Point estimates
for the number of parties with some candidate in the legislative election represent a -0.2%
not significat effect. The effect on the number of effective parties (7.8%) suggest more
competition also in this dimension, but we do not reject the null of zero effect.

1.6.2 Entry of Candidates
 The reorganization of parties and the increased competition might have changed
incentives for candidacy. So we analyze if this impacted entry decision of candidates by
estimating the impact of the reform on a set of candidates’ characteristics. Looking to
municipality averages of these characteristics, there is no significant effect on average
education and age, there is a small increase in the proportion of women and a large effect
on self-reported wealth.
 The point estimate of 0.012 for the impact on the proportion of women means a
3.8% increase. About this effect it is worth noting that the Brazilian law requires that
women represent at least 30% of a coalition’s candidates. With more coalitions, this
 9
 Suppose that in different cities there are two and three coalitons with vote shares given by (0.50, 0.50)
and (0.49, 0.50, 0.01). The HHI’s are 0.50 and 0.4902, respectively. Although the actual number of coali-
tions are 2 and 3, the effective number of coalitions are 2 and 2.04. Thus, the level of poltical competition
is similar despite the different number of actual parties.
22

 Table 1.3 – Effects on candidates’ charachteristics

 High School College Age Woman Asset (log)

 Treatment -0.006 0.009 0.355 0.012* 0.145+
 (0.005) (0.011) (0.294) (0.006) (0.083)

 Observations 258 258 258 258 258
 Municipalities 86 86 86 86 86
 + p < 0.1, * p < 0.05. Notes: Robust standard errors in parentheses

estimate can reflect parties and coalitions adjusting their pool of candidates to comply
with this law and not exactly a behavioral response from women facing a more competitive
environment.10
 Besides, the estimated effect on self-reported assets (in log) means a 15.6% increase
on average wealth. This is a relevant result since an explicit goal of the reform was to
reduce the costs of electoral campaigns. We analyze this in conjunction with the effects
on the amount of money raised to finance the campaigns. We look separately funds from
citizens that supported candidates, money from party resources and self-funding.11

 Table 1.4 – Effects on candidates’ funding

 Average (in R$) Total (in R$ 1000)
 Citizen Party Self-funding Citizen Party Self-funding

 Treatment 470.727 712.385 -315.884 75.465 193.399 16.560
 (733.607) (1,629.513) (512.100) (60.441) (304.046) (42.440)

 Observations 258 258 258 258 258 258
 Municipalities 86 86 86 86 86 86
 + p < 0.1, * p < 0.05. Notes: Robust standard errors in parentheses

 Table 1.4 show estimates of the effect on average donations received per candidate
and the effect on the sum of all donations in the municipality. We do not reject the
hypothesis of no effect in all cases. Therefore, at least in subsample of municipalities we
use here, the reform did not reach an important outcome that it intended to. Together with
the result on the attraction of richer candidates, this suggests that tighter competition
demanded more resources and this moved municipalities to a new equilibrium with the
same level of revenue/spending.
 10
 It is possible a situation in which two parties form a coalition, only one party present women as
candidates and the coalition still complies with the law. If these parties decided to run alone, both should
have 30% of women. Thus, the overall number of women could increase if the first party did not adjust
completely.
 11
 As corporate donation were prohibited as of 2016, we aggreate it with party donations for the two
previous elections.
23

1.6.3 Incumbents Behavior and Political Selection
 A special case of candidates are those who run the election while in office. Here
we analyze how incumbents behave facing a more competitive environment. The reform
made incumbent councilors more likely to run for reelection as table 1.5 show. Expected
incumbency rate of councilors at treated municipalities in the absence of treatment was
0.83 (≈ 13 out of 16 seats on average). Thus, the 0.061 estimate means a 7.3% increase
in incumbency rate. However, the reduced form estimate for the reelection rate do not
indicate any effect. That is, although more incumbents become candidates, reelection
keeps at the same level.

 Table 1.5 – Effects on incumbents behavior

 Incumbency rate Reelection rate

 Treatment 0.061+ 0.023
 (0.036) (0.036)

 Observations 258 258
 Municipalities 86 86
 + p < 0.1, * p < 0.05. Notes: Robust standard errors in
 parentheses

 Table 1.6 – Effects on incumbents’ charachteristics

 High School College Age Woman Asset (log)

 Treatment -0.030 -0.014 3.195 -0.059* 0.217
 (0.022) (0.052) (3.043) (0.021) (0.135)

 Observations 258 258 258 258 258
 Municipalities 86 86 86 86 86
 + p < 0.1, * p < 0.05. Notes: Robust standard errors in parentheses

 There was also a qualitative impact on the pool of incumbents. Though we see no
effect on education and age, women in office are less likely to run for reelection in treated
municipalities. The -0.059 estimate means a 27.3% decrease relative to the expected pro-
portion of 0.21 women among incumbents without the reform. This means a potential
decrease in political experience of women candidates, despite more women on the dispute
according to previous result. Estimates are not statistically different from zero for results
on incumbents’ assets and funding sources (not reported).
 In table 1.7 we analyze impacts on the profile of elected councilors. Again, the
remarkable result is that they were substantially richer. The estimate of 0.177 on the log of
24

 Table 1.7 – Effects on elected candidates

 High School College Age Woman Asset (log)

 Treatment -0.026 -0.009 0.932 -0.002 0.177+
 (0.018) (0.033) (0.678) (0.017) (0.104)

 Observations 258 258 258 258 258
 Municipalities 86 86 86 86 86
 + p < 0.1, * p < 0.05. Notes: Robust standard errors in parentheses

self-reported asset means a 19.3% effect, higher than the estimated effect for the whole set
of candidates. There is no effect on other personal characteristics of elected councilors and,
again, estimates are not statistically different from zero for results on elected candidates’
funding sources (not reported). Thus, more women entering the election did not increase
their representation, but richer candidates succeeded in getting to office.

1.6.4 Effects on Policy
 Once legislative election became more competitive with the outcome that richer
candidates were chosen as councilors, we investigate a natural question on whether this
had effects on policy.

 Table 1.8 – Effects on revenue and spending

 Discretionary Spending Budget Share Revenue
 Elected Parties
 Education Health Education Health Total Transfers

 Treatment 0.017 0.128 -0.071 0.013+ -0.002 0.041 0.011
 (0.400) (0.529) (0.585) (0.007) (0.006) (0.028) (0.029)

 Observations 258 254 258 254 253 258 257
 Municipalities 86 86 86 85 86 86 86
 + p < 0.1, * p < 0.05. Notes: Robust standard errors in parentheses

 A possible mechanism for why competition should affect policy is through a poten-
tial impact on the number of parties represented in the council. However, the first result
on table 1.8 shows that the average number of elected parties did not change. If we look to
effects on revenues or spending in healthcare there is no significant effect. However, we see
a 5.3% increase on the proportion of the public budget allocated for education, which is
the 0.013 estimate compared to the expected 0.246 without the reform. It is unlikely that
this is a result from councilors reacting to different electoral incentives due to more or less
competition in the subsequent election. By 2017, all agents knew that electoral coalitions
would not be allowed for the 2020 election, thus the difference in the rule that lead to
25

different levels of competition would no longer exist.12 Thus, we conjecture that this could
have resulted from an increased responsiveness of councilors to voters that elected them
in a more competitive election.

1.6.5 Robustness Exercises
 We reproduced our main results by running regressions based on equation 1.1 in
different scenarios. First we used all elections, but restricted the sample to municipalities
within a window of 20,000 voters below or above a 80,000 voters threshold instead of
the actual 100,000 threshold. This excludes the treatment group from the data. Thus,
we set = 1 in = 2016 for municipalities above the 80,000 voters threshold in 2016.
This is the definition of fake treatment. Besides, we did the analysis falsely considering
the previous election as the time of the reform. That is, we discard observations from
the 2016 election and set = 1 in = 2012 for municipalities that would be above the
100,000 voters threshold in 2016. This is the definition of lead treatment. These results
are reported in the appendix. Overall, the coefficients of interest are close to zero and/or
not statistically significant.

1.7 Conclusion
 This paper investigated the impact of an institutional reform aimed at reducing
the costs of electoral campaigns that end up affecting elections through different channels.
By limiting the number of candidates allowed in electoral coalitions, the reform induced
parties to reorganize into more coalitions so that the total number of candidates did not
fall significantly. Furthermore, there were no significant change in the amount of monetary
resources mobilized for the election.
 However, the reform implied an increase in political competition. This led to an un-
expected outcome of the reform which was the attraction and election of richer candidates.
We discussed that the difference implied by the we explored here would no longer exist for
the subsequent election. Then, we conjecture that the positive impact on the budget share
allocated to education might be explained by the new candidates being more responsive
to voters that relied on them in a more competitive election. We think these results are
relevant to illustrate that institutional reforms can have unintended consequences.

 12
 Constitutional amendment no. 97 (2017).
26

2 Tit-for-Tat between Legislative and Exec-
 utive

2.1 Introduction
 Legislative and executive powers in the democratic world compose a system of
checks and balances aimed at improving the welfare of society. Along with periodical
elections, the interplay between legislative and executive bodies is essential for good gov-
ernance (PERSSON; ROLAND; TABELLINI, 1997). A documented example is party
fragmentation. The literature shows that the number of parties affects the bargain process
between executive and legislative and ultimately impact the policies to be implemented.1
More directly, the extent to which governments have legislative support is key to deter-
mine what kind of policies they will be able to choose and implement. Understanding the
effects of legislative support for governments is a task with two important challenges: it is
hard to measure the degree of support and even if it is possible it is difficult to disentangle
the degree of support from other important drivers such as political ability and voters’
preferences.
 In this paper we overcome these challenges by exploring elections and governance
in Brazilian municipalities. Parties form coalitions to run in the legislative elections, which
happen simultaneously to the executive election, allowing us to have a formal definition
of coalitions that support the elected mayor. Moreover, by leveraging the electoral rules
on seats’ allocation for the local council we have as good as random variation on the size
of such support. We propose a microfounded method to identify proportional elections
that were decided by a slim margin, that is, some parties were really close to lose or gain
seats. This method can be seen as a generalization of the discontinuity design largely
implemented in majority and plurality elections for elections under proportional rule.2
 Our results show that legislative support matters for good governance and the ef-
fect is heterogeneous with respect to the electoral incentives that mayors face. With budget
data we can measure the changes in planned spending that mayors do with legislative ap-
proval. We discuss that this variable can be interpreted as the degree of flexibility in the
budget management given to mayors by local councils. Moreover, it is likely to be asso-
ciated with budget mismanagement as it gives discretionary power to mayors. Stronger
legislative support implies a 25% increase in this flexibility relative to municipalities in
 1
 Ashworth e Heyndels (2005), Borge (2005), Schaltegger e Feld (2009), Maux, Rocaboy e Goodspeed
(2011)
 2
 Our method works in any system that assigns a continuum of vote shares to integers number of
seats.
27

which mayors have less support. But the effect is strongly heterogeneous depending on
the mayor’s term. For mayors in second term the effect can be as large as 69%. Consistent
with evidence of increased mismanagement by mayors in second term, point estimates
suggest that they are more prone to receive a negative evaluation of their budget manage-
ment from state courts of accounts, while the opposite happens for mayors in first term.
Further, we find that one more councilor increases revenue and spending of mayors in
second term. Finally, for mayors in first term there is a positive impact in mayor’s party
share of votes in the subsequent election, but a negative effect for mayors in second term.
 Results suggest that since mayors in first term still have electoral incentives, more
legislative support do not lead to worse governance outcomes. However, more support
to mayors with no chance of reelection translates into worse management. We interpret
our findings within the framework of a simple model in which the cost for the legal
protection the councilors are able to give to the mayor decreases with more support. This
increases the incentives that mayors in second term have for rent extraction. However,
these incentives are balanced against reelection incentives for mayors in first term.
 We contribute to a literature showing that political accountability is important
in shaping good governments (FERRAZ; FINAN, 2008; FERRAZ; FINAN, 2011a). Our
results show that different margins of accountability can interact to determine politicians
behavior. In particular, the existence of electoral accountability (reelection) balances a
potential loss in horizontal accountability (more legislative support). Another contribu-
tion is the method for defining slim margins in proportional elections. Our method is less
restrictive than Folke (2014) and Fiva, Folke e Sørensen (2018) propose. The margin of
the election in their method is defined by an aggregate shock in total votes needed to
change the allocation of seats. However, they implicitly assume that all parties have the
same probability of receiving one vote.3 Instead, we recognize that voters have different
preferences. Also, our method can be extended to identify not only the effect of increasing
seats of coalitions or parties, but also the effects of minorities or individuals. A final con-
tribution is gathering a new dataset constructed from information on budget management
that allows us to measure an outcome from the legislative-executive interaction.
 The paper is organized as follows. In the next section we provide the institutional
context of our analysis by describing local elections in Brazil and the role of legislative
and executive powers in local governance. Then, we explain the theoretical framework and
our data. We then discuss our identification strategy and how we implement it. Finally,
we present our results and final remarks.
 3
 They compute an 1 distance between vectors of votes resulting in different seat allocations.
You can also read