2013 Status report: Reef and nearshore fisheries and aquaculture
←
→
Page content transcription
If your browser does not render page correctly, please read the page content below
Status report:
Reef and nearshore fisheries
      and aquaculture
           2013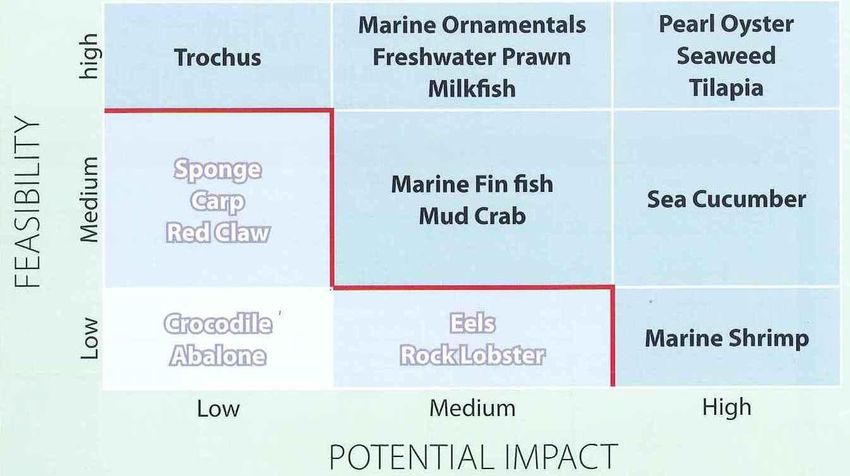

CONTENTS
SUMMARY                                                                         i
1. Introduction                                                                 1
     Collection of data                                                         2
     Climate change                                                             5
     Monitoring and reporting                                                   5
2. Reef fisheries                                                               5
     Fishing pressure on reef fisheries                                         6
     Status of reef finfish fisheries                                           7
     Status of invertebrate fisheries                                          10
     Status of live reef export fisheries                                      17
     Climate change: vulnerability of bottom-dwelling fish and invertebrates   24
3. Nearshore fisheries                                                         25
     Status of nearshore tuna fisheries                                        25
     Status of other nearshore pelagic fisheries                               27
     Climate change; vulnerability of nearshore pelagic fisheries              30
     Status of fisheries for deepwater snappers and other demersal species     30
     Other deepwater bottom fishing activities                                 32
4. Aquaculture                                                                 33
     Global aquaculture                                                        33
     Aquaculture in the Pacific                                                34
     Annual value and volume of aquaculture production in the Pacific          34
     Role of aquaculture in livelihoods and food security                      36
     The SPC Aquaculture Action Plan                                           38
     Climate change; projected effects on aquaculture                          39
5. Roles of women and men in fisheries                                         41
     Role of women and men in coastal fishing                                  41
     Role of women and men in fisheries management                             42
References                                                                     43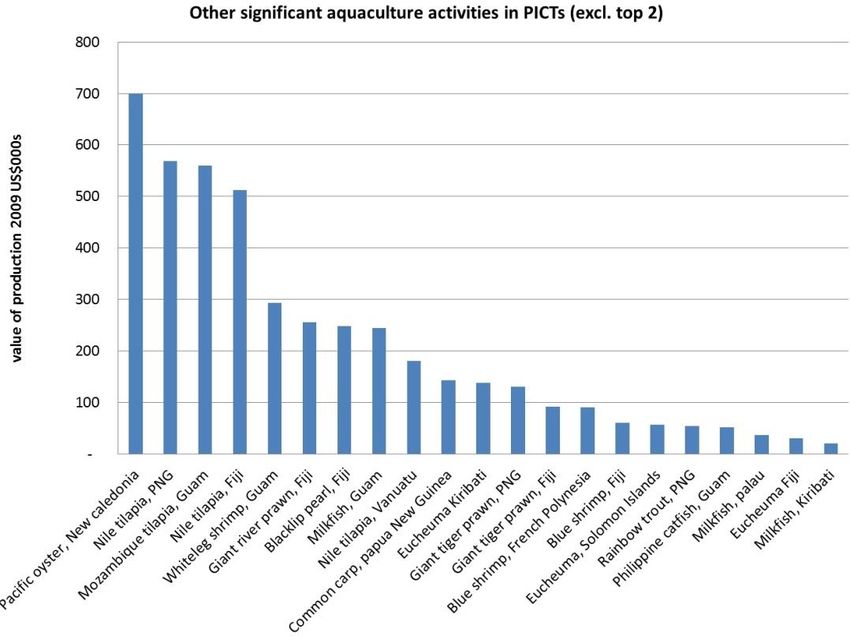

SUMMARY
This report addresses the status of reef fisheries for finfish and invertebrates, nearshore fisheries for
pelagic fish including tuna, fisheries for demersal fish including deepwater snappers and
aquaculture.

Strong fisheries management is needed to maximise the yields of demersal fish and invertebrates
and reduce the size of the “food gap” between available seafood and that required to meet the
needs of growing populations in Pacific islands. However, much of the additional seafood required
will need to come from nearshore pelagic fish, tuna in particular, as well as aquaculture

Climate change will have varying effects on countries and different fisheries. It is essential to develop
the necessary monitoring tools and implement long-term national and regional monitoring
programmes for climate change as soon as possible – the longer the time-series, the greater the
power to detect change and provide information needed for adaptive management.

SPC data suggests that many reef fisheries based on finish and invertebrates are exposed to
unsustainable fishing and sound management is urgently needed to maintain catches on a
sustainable basis.

Giant clams have been fished to local extinction in several areas. Trochus exports have declined
markedly and at least some of this decline has been due to uncontrolled fishing as well low
international prices for the commodity. Green snails have been heavily exploited in almost all
countries where they exist and many stock are at very low levels. One of the oldest of all commercial
fisheries, that on sea cucumbers, has suffered from over-fishing.

The status of several other invertebrates, including lobsters, crabs, and octopuses, is generally not
known. Even though these species are important in subsistence fisheries and local markets, there
are very few catch statistics.

In the face of depleted stocks, SPC is assisting many countries with the development and imposition
of management measures including size limits and short harvest seasons. In valuable and threatened
invertebrate stocks, some countries have taken the bold move to close their fisheries to allow stocks
to rebuild. But these ‘moratoria’ or resting periods must be long enough to ensure full recovery.
Many invertebrate species with limited movement require a large number of individuals to be in
close proximity to each other for reproduction to be successful.

The live reef food fish trade has declined as more authorities have become aware of the implications
and consequences of the trade, especially in trying to meet the large minimum quantities required
by buyers. Export of aquarium fish and invertebrates (including corals) from Pacific Island countries
and territories started in the 1970s. It has since expanded to become an important source of income
and employment for a number of communities in the region. And again management must ensure
that best practices are followed to avoid damage to fragile reef ecosystems.

Live coral exports from the Pacific region peaked in 2006 and have been in decline since. This may be
linked to the economic downturn and also the culturing of some corals within importing nations.

                  Status report: Reef and nearshore fisheries and aquaculture 2013                Page i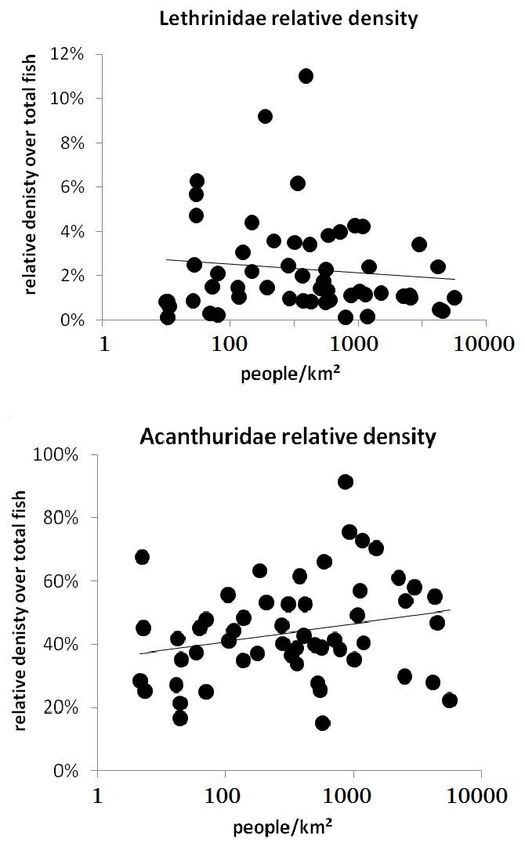
Nearshore fisheries include those for pelagic and demersal species. Commercial tuna fisheries are
believed to have some potential for further growth in the Pacific Island share in the catching and
processing sectors. At present over 30% of the total tuna catch is caught within the EEZs of Pacific
Island countries and territories.

Domestic longline vessels and small-scale boats, which fish near fish aggregating devices (FADs) and
troll close to the reefs, also target species such as wahoo, mahi mahi and rainbow runners. In some
countries, the catch of non-tuna species is higher than that for tuna.

Many member countries have been benefiting from FADs over the last 25 years. Tuna catch rates (kg
per hour) from trolling around FADs are often three times the catch rates of tunas taken when
chasing tuna and trolling in open water and around reefs. Nearshore pelagics and the use of FADs
are also important for the slowly expanding game-fishing operations in the Pacific. Many countries
now have charter fishing operations taking paying passengers to fish for marlin, wahoo, mahi mahi
and tunas.

There is a growing interest in fishing for squid in the region and SPC has been involved in exploratory
fishing trials for “giant” squids. Catches of large squids, including diamond squids with a mean
weight of 18 kg, have been encouraging and there is potential to develop fisheries in some countries.

Deepwater snapper fishing was the subject of an SPC international workshop in 2011. The gathering
recognised a need for well designed biological studies of deepwater demersal fish species across the
Pacific Islands region to gain a full understanding of the demography of harvested species. Most
species have extended lifespans (> 20 years), are generally slow-growing and late to mature, making
them vulnerable to overfishing.

Data obtained during SPC’s surveys on the deepwater snapper project revealed sizeable stocks of
bluenose and blue warehou on the seamounts of southern Tonga and in international waters
between Tonga and New Zealand. Catches of bluenose as far north as 19°S have been reported in Fiji
waters, suggesting this species has a wider distribution than previously thought. These finds suggest
that there may be some potential for the development of these fisheries in this region and other
locations at similar latitudes such as Fiji and New Caledonia.

Other surveys have been conducted for deepwater species including caridean shrimps, alfonsino and
deepwater crabs. However the economics of fishing in deep water and the lack of knowledge of the
stocks make commercial fishing unpromising.

Aquaculture systems introduced to the region in the early 1950s by SPC have only become
established within the past few decades. However, since 2007, production from the region has
dropped significantly as a result of the collapse in the value of pearl production from both French
Polynesia and Cook Islands. This decline was related to a reduction in value of pearl from French
Polynesia mainly from oversupply and poor market prices while Cook Island pearl production was
affected by market value, water quality and other environmental problems. By 2010, the value of
aquaculture in the region had reduced to about USD 100 million.

Excluding shrimp and pearl production from New Caledonia and French Polynesia respectively,
Pacific oysters in New Caledonia have the highest value followed by tilapia production in several

Page ii           Status report: Reef and nearshore fisheries and aquaculture 2013

countries including Papua New Guinea, Fiji and Vanuatu. Seaweed production is increasing, mainly in
Solomon Islands and Fiji.

Key commodities identified as most feasible and having the greatest potential are cultured pearl,
seaweed, giant clams and coral farming for the ornamental trade, marine shrimp, tilapia, freshwater
prawn, sea cucumber, and marine finfish. Species such as tilapia and milkfish, which have well
established fish farming methods, are amongst the most suitable species to help meet the food
security needs.

Pearl farming continues in countries such as Fiji and FSM where smaller and more specialist
producers target local tourism and local industry. New research is underway in neighboring
countries such as Tonga to produce round pearls from other pearl oyster species such as the winged
pearl oyster.

There is much interest from Pacific countries in adopting aquaculture techniques to restore stocks of
sea cucumbers. Although techniques to breed the valuable sandfish species have been developed, it
is unclear to what extent aquaculture can contribute to the restocking of depleted wild stock or form
the basis of profitable sea ranching or pond farming systems. One of the key challenges is to
demonstrate the effectiveness of sea cucumber restocking and sea ranching through larger scale
experimental releases and post release monitoring.

Knowledge of gender roles and their changes are an important input to effective fisheries
management, as it allows interventions to be tailored to the needs and abilities of specific target
groups of fishers. Although the general dominance of men still persists in fishers who exclusively
target finfish, the opposite is true for fishers who exclusively target invertebrates, which remains a
women’s domain.

In 2011, studies on the participation of women in fisheries science and management indicated that
women only represent 18% of the total number of staff working in the fisheries science and
management sector in government fisheries, environmental institutions and environmental NGOs. In
contrast, the number of women employed in administrative and clerical roles in government
fisheries divisions exceeds 60%. SPC’s FAME Division strongly believes that all fisheries careers are
equally acceptable to women as to men and focuses on “breaking down the barriers” to help women
moving into the fisheries area if they so choose.

The need for more reliable catch information and sensible management is now more important than
ever if our fisheries are to be more resilient to the future effects of climate change and increasing
fishing pressure.

                  Status report: Reef and nearshore fisheries and aquaculture 2013            Page iii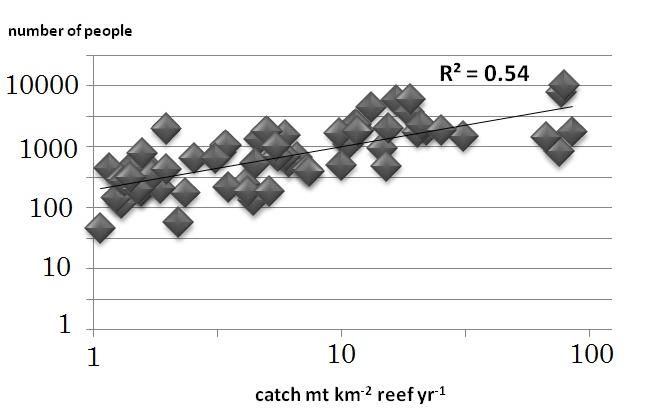
1. Introduction
This report addresses the status of reef fisheries for finfish and invertebrates, nearshore fisheries for
pelagic fish including tuna, deeper water fisheries for demersal fish including snappers, and
aquaculture.

Although commercial tuna fisheries contribute greatly to revenue and national economic
development, coastal fisheries are important in securing national food security and rural incomes. In
terms of benefits through import substitution and livelihoods, it is likely that oceanic fisheries and
coastal fisheries are approximately equally important in many island countries.

Coastal habitats such as coral reefs, mangroves, seagrass beds and intertidal flats have a limited
capacity to produce fish and invertebrates. Therefore, much of the additional seafood required to
meet the nutritional needs of growing populations in Pacific islands will need to come from
nearshore pelagic fish, tuna in particular, as well as aquaculture (Bell et al. 2011). Careful
management is needed to maximise the yields of demersal fish and invertebrates and reduce the
size of the “food gap” between available seafood and that required by growing populations
(Fig. 1).

                                      Poorly-managed fisheries
       a)                                           Fish needed by
                                                  growing population

                               Fish habitat

               fish/habitat

                                                           Fish available
                                                           Fish available from
                                                                           from
                                                              coastal stocks
                                                                  stocks
               Qua ntity of

                                                  Time                                  Gap in supply of fish to
                                                                                               be filled

        b)                              Well-managed fisheries
                                                    Fish needed by
                                                  growing population
                               Fish habitat

               fish/habitat
                                                            Fish available from
                                                                  stocks

                                                          Fish available from
               Qua ntity of
                                                             coastal stocks

                                                  Time

  Figure 1. In a poorly managed fishery (graph a) fish stocks and catches (red line) will decrease and marine
habitats (blue area) will deteriorate over time. In a well-managed fishery (graph b) fish stocks and catches will
  remain at a sustainable level. Well-managed fisheries will minimise the gap between seafood required by
     rapidly growing populations and sustainable harvests of demersal fish and invertebrates (SPC 2008,
                                                 Bell et al. 2011).

                              Status report: Reef and nearshore fisheries and aquaculture 2013                     Page 1
SPC is involved in providing support on several fronts, including the following:
developing a regional approach to aquatic biosecurity with a focus on introduced species for
aquaculture,
assessing the economic viability of projects and small-scale commercial activities,
supporting new and improved data collection systems,
developing technical and policy foundations for aquaculture and mariculture,
supporting effective fisheries management involving traditional governance, local knowledge,
community-based management and ecosystem approaches,
providing support for strong management actions in some coastal export fisheries, including
national bans on exports and short fishing seasons, to effectively promote stock recovery,
developing a framework for regional coastal export fisheries management and marketing
coordination,
assisting with the sustainable development of the aquarium live fish trade,
establishing pilot sites to detect the effects of climate change over time,
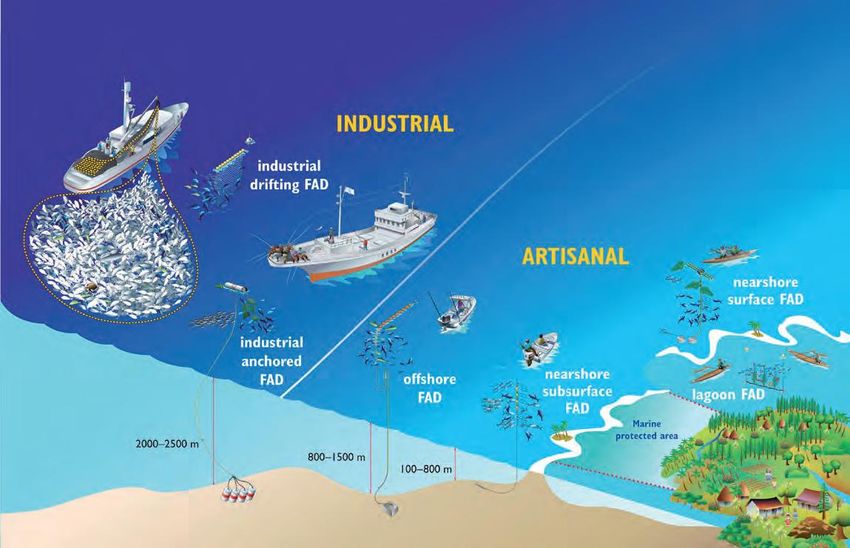
increasing the domestic catch from commercial tuna fisheries and developing artisanal tuna
fishing including that from coastal fish aggregating devices (FADs),
assisting competent authorities in meeting requirements for the export of fisheries products,
assisting with the development of tuna fishers’ associations to contribute to the management
of their fisheries, and,
promoting non-extractive activities such as sports fishing.
Fisheries managers require reliable, up to date information on the status of fisheries resources and
the ecosystems that support them to determine the success of measures and policies to (1) maintain
the catches of demersal fish and invertebrates and (2) increase the catches of nearshore pelagic fish.
The management and conservation of these fisheries benefit greatly from regional communication
and cooperation, access to shared regional support services, and by comparing experiences directly
in gatherings such as the SPC Heads of Fisheries meetings. Information contained in this status
report comes from national fisheries authorities, SPC in-country activities and SPC data collection
systems.
Collection of data
In most Pacific island countries there is an extremely weak factual basis for the estimates of coastal
commercial and coastal subsistence catches (Gillett, 2009). There appears to be three types of
situations, however, where good estimates are available:
Countries that have a dedicated on-going national fisheries statistical system supported for
many years by an overseas agency.
Countries that have carried out an intensive, well-planned survey of fisheries to obtain an
accurate snapshot.
Countries that use a household income and expenditure survey (HIES) for small-scale fisheries
production purposes.
Page 2 Status report: Reef and nearshore fisheries and aquaculture 2013At a minimum, basic information on total catch is needed for three broad categories of species
(1) demersal (bottom-dwelling) fish associated with corals reefs and other coastal habitats;
(2) nearshore pelagic fish including tuna, and (3) the invertebrates collected from coastal habitats.
Information should also be provided on the proportions of fish caught by subsistence and
commercial (artisanal) fishing in each category. The estimated catches for these categories given in
Table 1 is an example of the information required. Where possible, data should be collected on the
composition and size structure of indicator species within each category.
Information on fishing effort (the amount of fishing done) is more difficult to collect but allows the
calculation of catch rates and the quantity of fish caught per unit time spent fishing. Catch rates are
important indicators of the “health” of a fishery and falling catch rates may indicate that more or
different management measures are required.
The national household income and expenditure surveys (HIES) provide a reliable and regular way of
collecting the basic information on subsistence and commercial catches of the three categories of
coastal fisheries, provided the HIES has been modified to include suitable questions (Bell et al. 2008).
Data on the abundance and size frequency of demersal fish and invertebrates can be obtained by
sampling catches at central markets using methods that allow the data to be recorded, stored and
analysed easily.
Data on the abundance and size frequency of tuna and other large pelagic fish caught by nearshore
fisheries, including catches made around inshore fish aggregating devices (FADs), can be collected
using the SPC-FFA Regional Data Forms. These forms can be used to collect data on catch and effort,
vessel activity, biological indicators and economics. This information is best collected at the point of
unloading, but it is also possible for fishers to record the data with appropriate supervision. The
TUFART database has been set up to manage and report on the data. Training, equipment (calipers
and pocket-sized identification guides) are available from SPC.
The system used to monitor catches of tuna and other large pelagic species can also be used to
record catches of deepwater snappers and other demersal species.
Status report: Reef and nearshore fisheries and aquaculture 2013 Page 3Table 1. Preliminary estimates of annual catches in tonnes and as percentage of total catch for the three main
categories of coastal fisheries in Pacific Island countries and territories (PICTs). Based on catches for 2007
reported by Gillett (2009) and calculated using the method described by Pratchett et al. (2011). A breakdown
of the catches in each of the three categories into subsistence and commercial catches is available at
(http://cdn.spc.int/climate-change/fisheries/assessment/chapters/12-supp-tables.pdf) (source: Bell et al
2011).
Demersal fish Nearshore Invertebrates Total catch
pelagic fish
Tonnes % Tonnes % Tonnes % Tonnes
Melanesia
d a
Fiji 17,450 64.9 5270 19.6 4180 15.5 26,900
a e
New Caledonia 2670 55.1 560 11.5 1620 33.4 4850
a f
PNG 14,520 40.7 13,760 38.5 7420 20.7 35,700
ag
Solomon Islands 8925 48.9 5750 31.5 3575 19.6 18,250
a
Vanuatu 1730 51.4 753 22.4 885 26.3 3368
Micronesia
b
FSM 6290 49.9 3560 28.3 2750 21.8 12,600
b
Guam 33 28.9 77 67.5 4 3.5 114
c
Kiribati 15,075 72.8 4250 20.5 1375 6.7 20,700
a
Marshall Islands 2417 64.5 1080 28.8 253 6.8 3750
c
Nauru 310 47.7 310 47.7 30 4.6 650
a
Palau 950 44.9 680 32.2 485 22.9 2115
a
CNMI 260 57.6 161 35.7 20 4.4 451
Polynesia
a
American Samoa 92 59.4 47 30.3 16 10.3 155
c
Cook Islands 146 36.5 240 60 14 3.5 400
c
French Polynesia 3666 53.3 2582 37.5 634 9.2 6882
a
Niue 62 41.3 75 50 13 8.7 150
a
Pitcairn Islands 10 83.3 1 8.3 1 8.3 12
b
Samoa 4419 51.2 2550 29.6 1655 19.2 8624
c
Tokelau 182 48.5 150 40 43 11.5 375
h c
Tonga 5245 80.7 650 10 605 9.3 6500
b
Tuvalu 837 68.9 326 26.8 52 4.3 1215
a
Wallis & Futuna 718 74.7 106 11 137 14.3 961
Total 86,007 55.6 42,938 27.8 25777 16.7 154,722
a = Nearshore pelagic fishery dominated by non-tuna species; b = nearshore pelagic fishery comprised equally
of non-tuna and tuna species; c = nearshore pelagic fishery dominated by tuna; d = includes deep-water
snappers; e = includes mangrove crabs and spiny lobsters sold on local market; f = includes hundreds of tonnes
of penaeid shrimps; g = includes 800 t of baitfish; h = includes 700 t of deep-water snappers.
Page 4 Status report: Reef and nearshore fisheries and aquaculture 2013Climate change
Dedicated sampling programmes are also needed to monitor the effects of climate change on
demersal fish and invertebrates as well as their supporting habitats. These programmes require an
experimental design where the effects of other stressors such as pollution or fishing pressure are
either removed or controlled for, such as comparisons between ’impact’ (e.g. fished) and ‘control’
(e.g. unfished) areas. For fish habitats, simple methods for collecting remotely-sensed data and
ground-truthing this information have a role to play; measures of changes in coral cover, species
composition and topographic complexity will also be needed because of their importance in
determining the abundance of demersal fish and invertebrates. Fish and invertebrate resources
should be assessed using both fishery-dependent methods (e.g. market and creel surveys) and
fishery-independent methods (e.g. underwater visual census (UVC) methodologies). SPC’s CFP is
currently finalising a survey manual and database software to support the collection and storage of
market and creel survey data, while SPC’s existing Reef Fisheries Integrated Database (RFID) is
designed to facilitate storage of fisheries-independent survey information such as UVC data.
It is essential to develop the necessary monitoring tools and implement long-term national and
regional monitoring programmes for climate change as soon as possible – the longer the time-series,
the greater the power to detect change and provide information needed for adaptive management.
Monitoring and reporting
A uniform system is needed for PICTs to record key information on coastal fisheries and aquaculture
production. This system should provide for reporting (1) catches, and catch values, of the three basic
categories of coastal fisheries described above; and (2) key information on aquaculture, including
quantities or volumes of the main aquaculture commodities produced, number of farm units,
number and gender-balance of people employed part and full-time, and export value. The number
of cases of ciguatera in each country should also be reported and a data collection form is available
from SPC.
This system should also be designed to make it easier for countries to provide the information
required by the Food and Agriculture Organization of the United Nations (FAO). FAO (2012) noted
that 18 of 23 countries in Oceania did not report adequate catch data in 2009.
2. Reef fisheries
Reef fisheries refer to those based on organisms associated with tropical coral reefs and lagoons,
essentially in waters from 0-50m depth. These are the main food-fisheries of the Pacific and the
basis of the main non-tuna exports – they often include non-perishable invertebrate commodities
like trochus shell and bêche-de-mer (dried sea cucumber) but also finfish, including high-value fish
and invertebrates exported alive for food and aquarists. Pacific Island reef fisheries are
commercialized to different extents in different countries but they are mainly artisanal and
subsistence fisheries, without the full-time involvement of professional fishers.
Status report: Reef and nearshore fisheries and aquaculture 2013 Page 5Fishing pressure on reef fisheries
Socioeconomic data obtained under the Pacific Regional Oceanic and Coastal Fisheries Development
Programme (PROCFish) project assessed the degree to which Pacific Island countries are dependent
on coastal, and particularly reef and lagoon, resources, for food, income and livelihood. The degree
of exploitation is a proxy to estimate impact – fishing pressure – and knowledge on the kind of
dependence allowing identification of which possible alternatives may be needed to reduce current
fishing pressure. Analysis of the regional dataset has revealed the strongest correlation for finfish
fishing pressure between the total number of people and catch rate density (Fig. 2).
Figure 2. Regression between population and finfish catches across PICTs.
Fishing pressure and its possible impact vary between countries and sites due to a number of
different factors but the more people, the more pressure on reef and lagoon resources.
Fishing pressure is a function of extraction for food (subsistence), for social obligations (non-market
exchange, gifts) and income (sale). PICTs are quoted as having the highest seafood consumption rate
worldwide but there are significant differences amongst sites and countries studied. At the regional
scale, annual per capita consumption of finfish (edible parts only), invertebrates (edible meat only)
and canned fish (net weight of fish meat only) was found to vary between 16–139 kg, 2–16 kg, and
2–25 kg respectively (PROCfish data). Averaging the sum of per capita consumption of all seafood
categories per each site studied, on average seafood covers between 5–25% of the total annual
energy needs of an average adult Pacific Island person. The highest seafood consumption patterns
were in Micronesian and lowest in Melanesian countries. Overall, finfish is the most important
source everywhere; however, invertebrates and canned fish play an important role in certain
countries and regions.
Income dependency from fisheries is another important determinant of fishing pressure. Again, the
dependency of households earning first or second income from this sector was found to vary
substantially across all 63 sites in 17 countries studied, i.e. between 10-93%.
Page 6 Status report: Reef and nearshore fisheries and aquaculture 2013The combined effects of seafood needs, income dependency on fisheries, and the degree of
diversification of household income are important information for fisheries management planning as
they allow identification of the most urgent needs for intervention if fishing pressure must be
reduced. Communities that already have a much higher income diversification and hence access to
alternative income opportunities, offer a much greater potential for restrictive fisheries regulations
compared to communities that predominantly rely on fisheries with no access to other alternatives.
Effective fisheries management also needs to take into account target groups for adjusting
interventions to their needs and capacities. Countries and sites studied comprise a wide range of
tenure, reaching from the open access system often referred to as being subject to the tragedy of
the commons (Hardin, 1968) to customary tenure with clear and strict regulations concerning target
species, temporal or periodic closures, etc. Different tenure systems have often been quoted as
having a major impact on resource exploitation; however, differences between sites studied did not
generally show this. On the other hand, significant differences were found in gender participation
and its contribution to fishing pressure (see Section 5).
The PROCFish/C results, mainly based on socioeconomic surveys, corroborate other findings
regarding the existing high exploitation rate of reef and lagoon resources, including finfish and
invertebrates in PICTs. Results demonstrated that fishing pressure is closely associated with
population density and a set of socioeconomic variables that cover income, financial and other
aspects. Catch data extrapolated from fisher surveys suggest that the degree of both, finfish and
invertebrate exploitation levels are positively correlated. Hence, half of all sites studied appear to be
exposed to unsustainable fishing on both finfish and invertebrate populations. Findings also pinpoint
that cultural differences and gender participation are crucial to successful fisheries management.
Status of reef finfish fisheries
The preliminary regional analysis of the PROCFish/C data suggests that the average standing biomass
of commercial reef fish across the Pacific region is currently about 100 grams of fish per square
metre (100 t km-2) of reef but this figure is very variable by site, ranging from a high of more than
360 g m-2 to a low of less than 20 g m-2. Biomass reaches highest values near the equator (Fig. 3) and
decreases at increasing distance from it, in both hemispheres. The changes with longitude are much
more irregular.
Status report: Reef and nearshore fisheries and aquaculture 2013 Page 7Biomass
Equator
400
South Nort
350 h
300
250
g/m2
200
150
100
50
0
-25 -20 -15 -10 -5 0 5 10 15 20 25
degrees of latitude
Figure 3. Average biomass of reef fish (g per square metre) plotted against latitude of site.
The regional analysis also revealed a decrease of biodiversity with increasing distance from a centre
of biodiversity in the area north of Papua New Guinea (Fig. 4), as expected under ecological theory.
However, the decrease is not linear and not without a high variability. This variability is likely to be
due to the impact of fishing.
N sp Average number of species per transect
70
West East
60
50
40
30
20
10
0
Ngarchelong
Rarotonga
Ngatpang
Vailoa
Chubikopi
Halalo
Laura
Abaiang
Ouasse
Luengoni
Ailuk
Koulo2
Funafuti
Lakeba
Manono-uta
Aitutaki
Andra
Rarumana
Koror
Nggela
Marau
Moindou
Vailala
Vaitupu
Riiken
Maskelynes
Dromuna
Fakarava
Likiep
Manuka2
Niutao
All Niue
Christmas
Maatea
Airai
Sideia
Romanum
Oundjo
Nukufetau
Mali
Yyin
Arno
Kuria
Ha'atafu2
All Futuna
Tikehau
Tsoilaunung
Panapompom
Thio
Uri-Uripiv
Moso
Lofanga2
Mangaia
Paunagisu
Muaivuso
All Nauru
Vaisala
Mataiea
Raivavae
Abemama
Salelavalu
Palmerston
Piis-Panewu
Figure 4. Biodiversity of commercial finfish from west to east.
Without an indication of what constitutes a “healthy fish condition” and “normal” community
structure at different sites due to their varying conditions and productivity, and without reference of
Page 8 Status report: Reef and nearshore fisheries and aquaculture 2013time changes it is difficult to say anything absolute about the status of the system as a whole.
However, analyses strongly suggest a high influence of fishing on the state of finfish resources. Most
sites appeared to be impacted by different levels of fishing. Total numbers, and especially average
size and biomass of fish, were major indicators of an increasing level of fishing.
As expected, the relative density of carnivorous groups, such as emperors (Lethrinidae), decreased
with increasing fishing pressure. However, some herbivorous groups, such as surgeonfishes
(Acanthuridae), increased with increasing fishing pressure (Fig. 5). This is probably a response from a
group of opportunistic species that responds to a decrease of predators. These changes were
uncovered after extracting variations due to environmental characteristics (geographical position,
type of island, type of reef, composition of substrate, etc), therefore they are mostly due to pure
fishing impact.
Figure 5. (TOP) relative density of emperors over total commercial fish against number of people per square
kilometre of reef. (BOTTOM): relative density of surgeonfishes over the commercial fish against number of
people per square kilometre of reef.
Status report: Reef and nearshore fisheries and aquaculture 2013 Page 9Considering that people density is strongly correlated with fishing intensity, there is a strong
reduction in the mean size of piscivorous fish (Serranidae and Lutjanidae) with increasing fishing
pressure (Fig. 6).
Figure 6. Mean fork length of piscivores (Serranidae, Lutjanidae) against number of people per square
kilometre (used as a proxy for fishing pressure).
In terms of the health of reef food fisheries and their supporting ecosystems, one indicator that has
been suggested for general use in other parts of the world is the proportion of herbivorous fish to
carnivorous fish. A high proportion of carnivores is usually an indicator of good reef ecosystem
health. Some Pacific Islands however might have low fishing pressure but high proportions of
herbivores to carnivores, and some islands with apparently high fishing pressure have low
proportions of herbivores. Differences in these proportions could be due to differences in fish
targeting – some Pacific Island societies having more of a preference for herbivores such as
parrotfish. But mostly the differences in such proportions are due to environmental differences: for
example high volcanic islands appeared to have higher proportion of herbivores compared to
carnivores. Nonetheless, this ratio was useful in the regional assessment as it turned out to be a
significant signal of fishing intensity when environmental variability was extracted by the
calculations.
The data analysed showed that density, sizes and consequently biomass of fish decreased with
increasing fishing intensity; similarly, the higher the fishing intensity, the more the relative
importance of herbivores over carnivores and the stronger the dominance of small-sized
surgeonfishes.
Status of invertebrate fisheries
Invertebrate export fisheries in the Pacific have a history dating back to before European settlement.
These fisheries are primarily based on the sale of sea cucumbers (bêche-de-mer), trochus and pearl
Page 10 Status report: Reef and nearshore fisheries and aquaculture 2013oysters (mother of pearl shell or MOP) and, more recently, the export of dead coral products and
live molluscs, crustaceans and corals for the ornamental trade.
In the Western Pacific Region, most of these fisheries have exhibited boom-and-bust cycles
throughout their history. Increased demand from Asian markets and elevated export prices since the
1980s has been the catalyst for increased and more sustained fishing, and at many localities, high-
value species have been depleted and are now being replaced by previously unfished species of
lower value.
Invertebrate export fisheries have the potential to provide income (derived from foreign currency)
directly to remote village economies, where other opportunities to generate income can be difficult
to find. Declines in the sustainability of sea cucumber and MOP fisheries are thus of widespread
concern. As well as reducing foreign exchange earnings, damage to invertebrate export fisheries also
contributes to outer-island depopulation and urban drift.
Giant clams
As in the case of fish, the number of invertebrate species, including giant clams, increases with
environmental complexity of the area studied, and decreases in a cline from west to east across the
Pacific (Fig. 7).
Figure 7. Number of giant clam species recorded in recent SPC surveys by country.
The smaller, commoner clam species are found at most sites, while larger species like Tridacna gigas
and T. derasa are rare. In the case of the largest giant clam, T. gigas, individuals were only recorded
at 39% of survey sites within their geographical and ecological range, despite dead shells being
commonly noted onshore at many more sites. In Kiribati, Solomon Islands and Marshall Islands, T.
gigas was only present at one of the four sites surveyed in each country, with two of these countries
being represented in the database by a single individual clam.
More targeted assessments provide a clearer picture of stocks in specific shallow reef locations.
Biomass, a measure which incorporates both density and size information, is not always a useful
measure for invertebrates, as unlike in fish, invertebrate target species are often partly made of
Status report: Reef and nearshore fisheries and aquaculture 2013 Page 11shell, which complicates the comparison of weight measures between the large range of
invertebrate body forms.
Unlike fish, however, the density and size of samples can be reliably measured and re-measured in
known locations, as many important invertebrate stocks are relatively sessile. If one examines the
density of elongate giant clam (T. maxima) across countries in the Pacific, it is noticeable that there
is considerable variation across countries (Fig. 8). Results from atoll lagoon systems in the eastern
Pacific (where larvae of clams are entrained) will need to be compared with related systems, and
considered differently to results from more ‘open’ lagoon systems that are characteristic of reef
systems in Melanesia.
Figure 8. Density of T. maxima clams by country (bars, left axis)
and ‘coverage’ of T. maxima clams (points, right axis).
Trochus and other gastropods
Pacific Island mother-of-pearl (MOP) fisheries are mainly trochus, but also include pearl oysters and
other nacre species.
In the early 1900s records show large harvests of commercial topshell, Tectus (trochus) niloticus,
being taken from virgin fisheries in the Pacific; catch-rates of 4,000 shells per person per day were
known. Similar large harvests of pearl shell from atoll lagoons in the eastern Pacific have also been
documented, although many pearl oyster beds never recovered and today most pearl shell reaching
the markets is a by-product of spat collection technology and pearl farming.
Trochus have been subjected to over 150 transplantations within islands, between islands and
between countries since the 1920s. Introductions have been made to areas where stocks have been
depleted and to new areas where the species has not naturally existed. Introduction of wild adult
trochus has resulted in new fisheries in French Polynesia, Cook Islands, Federated States of
Micronesia, Marshall Islands and, recently, Tonga and Samoa.
Trochus exports have declined markedly and this may be primarily due to low international prices for
the commodity. Some countries declare short harvest seasons when stock levels are greater than
500–600 trochus per hectare. Minimum size limits of 3 inch (75mm) are imposed in some countries
and some countries have implemented minimum and maximum size limits.
Page 12 Status report: Reef and nearshore fisheries and aquaculture 2013A model example of the management of a trochus fishery
Trochus harvests in Aitutaki in the Cook Islands are announced after an underwater visual
assessment has been completed by Fisheries Department staff. A total allowable catch (TAC) is
set at between 30–40% of the biomass of trochus within the 80–110mm size window. The TAC is
divided amongst the community households. A harvest may last for a few weeks generally
toward the end of the year. Families collect, boil, clean and dry trochus shell ready for inspection
and grading by the Fisheries Department and Island Council. During grading, undersize and
oversize shell may be confiscated. Stocks of trochus remain healthy in Aitutaki.
In 2001, Aitutaki trochus shell reached a value of NZ$8500 per tonne and fishers harvested
37 tonnes (t). After 2001, prices to fishers dropped and expanding tourism provided alternative
employment. Consequently trochus were not harvested again until 2011 when the value per tonne
was NZ$4370 per tonne and about 19 tonnes of shells were collected at a value to fishers of almost
NZ$83000; in comparison fishers could receive NZ$8 per kg (NZ$8000 per tonne) for gilled, gutted
and iced tuna.
Results from PROCFish/C surveys indicate that, at most sites, trochus were harvested throughout the
year (mean of 33 trips per year) with fishers taking many small catches (mean of 17 trochus
harvested per trip) and slowly depleting stocks to levels where spawning success was compromised.
Interestingly, despite the large number of depleted sites, small pockets of trochus were present in
aggregations at high enough density to provide a source for successful reproduction and stock
recovery if management controls could be implemented. Trochus need to be in close proximity to
each other for reproduction (to induce broadcast spawning and ensure successful fertilisation of
gametes) and this will not occur effectively when they are fished to low densities.
To allow stocks and therefore fishery productivity to rebuild, closures of underperforming (and
declining) fisheries needs to be implemented, and in some cases trochus need to be aggregated to
kick-start a return to productivity.
In order to develop a model to describe productivity from well-managed fisheries, SPC examined
past harvests from trochus fisheries in Palau, Cook Islands and Wallis. By surveying the fishery, and
examining recordings from past harvests, preliminary calculations suggest that fishers should fish in
3–4 year rotations and harvest 180 shell per hectare per year.
The Coastal Fisheries Program has very few recent country data on exports of mother-of-pearl.
Green snails are found throughout the western Pacific and there have been some introductions to
the east (eg Tonga). The species has been heavily exploited in almost all countries where it exists and
stock levels have declined to very low levels. Some countries have taken firm action to allow stocks
to rebuild – Vanuatu has declared a moratorium on the harvest, sale and export of green snail.
Sea cucumbers (beche-de-mer)
The beche-de-mer trade in the Pacific is the oldest commercial fishery still active today and has been
valued at over US$50 million during peak production years. Sea cucumbers are not used as local
food in most islands but are exported to Asian markets, mainly Hong Kong, China and Singapore and
are second in value only to the significantly larger tuna trade.
Status report: Reef and nearshore fisheries and aquaculture 2013 Page 13The sale of beche-de-mer is an important source of income for many coastal communities. But years
of continued intensive fishing, rising market demand and lack of effective management by
authorities have led to the depletion of resources across the Pacific.
Of the 60 commercial sea cucumber species exploited worldwide, 35 species are present in the
Pacific Islands region. The Western Pacific Islands of Melanesia, Palau, FSM and Tonga have a higher
diversity than the rest of the Pacific (Fig. 9). The thick walled varieties such as the white teatfish
(Holothuria fuscogilva), black teatfish (H. whitmaei), and stonefish (Actinopyga miliaris), tend to be
slower growers, are present in lower densities, are reef dwellers and can be found down to 30m
(white teatfish somewhat deeper). Sea cucumbers spawn throughout the year with peak activity in
the warmer months.
30 26 26 26 25
24
25 22 22 21
species count
20 16
14 14 13
15 11 10 10
10 6 5 5
5
0
F.Polynesia
PNG
Nauru
Vanuatu
FSM
Niue
Tonga
Cook Is
Fiji
Kiribas
W/Futuna
Marshall Is
Palau
New Caledo
Samoa
Solomon Is
Tuvalu
Tokelau
Figure 9. Commercial sea cucumber species recorded by PICs and territories.
Sea cucumber fisheries most typically follow a “boom and bust” pattern of exploitation. They are
harvested traditionally by gleaning and snorkelling in shallower waters. Commercialisation of the
fishery has induced fishers, processors and exporters to invest in power boats, use of underwater
breathing apparatus (SCUBA and hookah) diving gear, drag nets, “bombs” (lines with lead weights
and hooks) or spear fishing, and night fishing using torchlight. UBA fishing has been the main cause
of over-fishing of white teatfish and has been outlawed in most Island countries. However, illegal
fishing is known to be a problem in several places.
Fishing and processing varies from simple household or individual fisher operations to large scale
operators using transport ships and electric driers. Products are salted, boiled, dried several times to
reach final product stage. These dried products are consolidated in-country by specialist bêche-de-
mer traders for exports. Quality has been a long standing problem contributing around 20–30% loss
of the product value. Monitoring and control systems and training are needed to improve quality.
Product prices vary greatly by product type, by distance to market and from different processors and
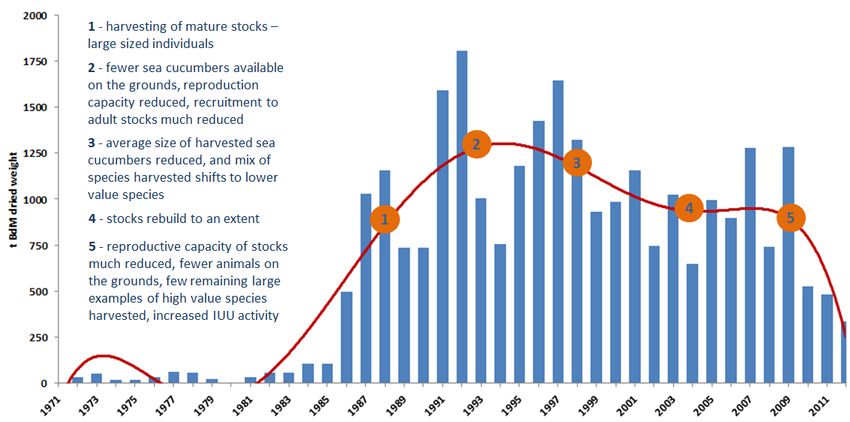
down the product chain. Boom production in the 1980s peaked in the 1990s and has declined since
that time. Figure 10 shows the combined exports of beche-de-mer (expressed in tonnes, dried
weight) for five countries included in an SPC study over the period 1971 to 2012 (Carleton 2013). The
graphic has been overlain with a polynomial trendline reflecting the broad changes in export across
this time series. In the broadest of terms, the recent evolution of the fisheries has been low-level
exploitation through the 1970’s, steady growth of exploitation in the 1980s reaching a peak in the
Page 14 Status report: Reef and nearshore fisheries and aquaculture 2013early 1990s. Harvests dropped off after this but a secondary, lower level, peak was reached in the
mid-2000s. Concerns about widespread over-fishing of stocks resulted in the subsequent closure of
fisheries in the Solomon Islands, Vanuatu and PNG (the Tongan fishery was closed from 1997). In the
late 2000s, with most fisheries subject to moratorium, regional production is being provided by Fiji
and Tonga only – and in both these countries stocks are now thought to be over-exploited and
reduced fishing pressure will be required in future years to allow for stock recovery.
Figure 10. The combined exports of beche-de-mer (expressed in tonnes, dried weight) for the five countries
under study over the period 1971 to 2012 (from Carlton 2013).
Peak production is not a very good indication of production capacity and a fifteen year average
(Table 2) is more representative. The table presents an indication of the general scale of production
across the last fifteen years, a typical breakdown of species composition and prices typically paid by
in-country traders for finished dried product (Carleton 2013).
Areas of prolonged fishing without any form of management not only results in low abundance but
loss of mature adults stocks and reproductive potential. Some countries have taken the bold move
to close their fisheries but these ‘moratoria’ or resting periods must be long enough to ensure full
recovery. Many countries do not have strong fishery management policies.
SPC is currently assisting countries with their national sea cucumber policies. Measures include;
moratoria, restricted fishing seasons, minimum harvest sizes, size limits and gear restrictions. In
addition, ensuring the right of local citizens to participate in the industry, providing avenues for
value adding and price improvements, and options for providing resource rent to the countries is
being addressed. Successful management policies depend on strong enforcement but this is often
under-resourced compared with those in offshore fisheries in most countries.
Status report: Reef and nearshore fisheries and aquaculture 2013 Page 15Table 2. 15 year average of beche-de-mer exports per country, by species, 1998 to 2012 – expressed in tonnes
of dried product; plus estimated current purchase value (from Carleton 2013).
15 year av. exports - t dried value at current purchase prices - US$M
PNG SOL VAN FIJ TON PNG SOL VAN FIJ TON
Sandfish 75 1 1 - 0 $3.59 $0.03 $0.03 $0.00 $0.01
White teatfish 96 30 1 22 4 $4.31 $1.37 $0.06 $0.98 $0.17
Golden sandfish - - - - - $0.00 $0.00 $0.00 $0.00 $0.00
Black teatfish 11 5 1 8 2 $0.27 $0.11 $0.02 $0.20 $0.04
Greenfish 10 0 1 5 1 $0.24 $0.01 $0.02 $0.13 $0.02
Prickly redfish 23 0 0 6 1 $0.48 $0.01 $0.00 $0.13 $0.02
Deepw. blackfish - 1 0 - - $0.00 $0.01 $0.00 $0.00 $0.00
Deepw redfish 0 3 0 3 0 $0.00 $0.07 $0.00 $0.06 $0.00
Surf redfish 23 - 3 6 6 $0.41 $0.00 $0.05 $0.10 $0.10
Blackfish 8 4 0 10 1 $0.07 $0.03 $0.00 $0.10 $0.01
Curryfish 36 4 - 14 1 $0.34 $0.03 $0.00 $0.13 $0.01
Stonefish - 4 - 5 3 $0.00 $0.04 $0.00 $0.05 $0.03
Tigerfish 34 5 1 25 5 $0.32 $0.05 $0.00 $0.23 $0.05
Snakefish 10 9 1 44 10 $0.07 $0.06 $0.01 $0.32 $0.07
Peanutfish - 5 - - 0 $0.00 $0.03 $0.00 $0.00 $0.00
Chalkfish 21 8 - 14 2 $0.13 $0.05 $0.00 $0.09 $0.01
Flowerfish 2 - 0 0 0 $0.01 $0.00 $0.00 $0.00 $0.00
Brown sandfish 36 23 4 19 4 $0.24 $0.15 $0.02 $0.13 $0.03
Amberfish 22 6 0 16 2 $0.15 $0.04 $0.00 $0.11 $0.01
Lollyfish 32 45 4 66 10 $0.17 $0.24 $0.02 $0.34 $0.05
Elephant trunkf. 21 7 0 8 2 $0.11 $0.04 $0.00 $0.04 $0.01
Pinkfish 8 5 0 3 0 $0.02 $0.01 $0.00 $0.01 $0.00
Total 467 164 18 274 54 $10.94 $2.38 $0.26 $3.15 $0.66
average unit value of exports - US$/kg dried $23/kg $15/kg $14/kg $12/kg $12/kg
Other invertebrates
There are very few catch statistics on other invertebrates even though they may be important in
subsistence fisheries and local markets. These species include lobsters, crabs, and octopuses.
Lobsters are often caught by hand or by free diving at night with underwater lights and are sold at
local markets. Many large-scale operations to catch lobsters in Pacific islands have failed because the
main species are generally present in low abundance and, except for the Hawaiian spiny lobster, do
not enter traps or pots readily. Management measures include minimum size limits on various
species, banning the taking of egg-bearing females, and banning the use of underwater breathing
apparatus.
Several species of crabs are caught and sold at local markets and the mangrove crab is the most
valuable. Mangrove crabs are caught by hand, sometimes with the aid of a hooked stick to remove
crabs from their burrows and by spears, nets, dillies and baited traps. Measures applicable to all
fishing for mangrove crabs include the application of minimum size limits (often between 120 mm
and 150 mm shell width), banning the taking of female crabs, banning the taking of berried female
Page 16 Status report: Reef and nearshore fisheries and aquaculture 2013crabs, and banning the use of certain fishing methods such as gill nets and spears. Traps are one of
the best ways of catching mangrove crabs as they do not damage the caught crabs which can
therefore be released if they are females or are too small.
Octopuses are fished locally throughout Pacific islands using a variety of fishing methods including
the use of lures, baited lines, traps and spears as well as by hand. Some fishing methods result in
considerable destruction of corals as the octopuses are removed from their nests. It appears that no
fisheries management regulations have been applied to octopuses even though their numbers have
decreased on many reefs.
The sea hare, Dollabella auricularia, is harvested and sold at local market; its mature egg masses and
flesh are eaten raw or cooked. A wide range of sea urchins are used and the collector urchin
Tripneustes gratilla is a common species. In Fiji, its density can reach 33,750 individuals per ha, or 3.4
individuals per m2 at main fishing locations.
Status of live reef export fisheries
Live reef food fish trade
The demand for live reef fish for restaurants in Hong Kong and southern China resulted in large
exports from PICTs during the late 1990s but this trade has dwindled.
The species targeted cause particular management concerns because their stocks are relatively
fragile. The most sought-after fish are found in two families – Serranids (groupers): Plectropomus
areolatus, Plectropomus leopardus, Cromileptes altivelis, Epinephelus fuscoguttatus, Epinephelus
polyphekadion, Epinephelus lanceolatus, Epinephelus coioides, Labrids (wrasses): Cheilinus undulatus
(this species, the humphead wrasse, is now red listed under CITES as an endangered species).
The decrease in the number of active exporting countries is a result of the improved awareness of
the public and fisheries departments of the consequences of the trade, especially in trying to meet
the minimum quantities, which may be up to 30 t of fish per shipment, required by buyers.
Some initiatives are planned for grouper aquaculture in some countries with the goal of exporting
plate sized animals to supply the live reef food fish industry in Southeast Asia based on local stocks
or imported broodstock. However, economic assessments are required to determine if such
initiatives will provide long term socio-economic benefits and be viable after initial project support is
no longer available. Moreover, the potential environmental consequences of supplying food for
growing fish that are to be exported should be examined.
Live reef ornamentals for the aquarium trade
This section covers the live marine ornamentals trade only; the curio trade (e.g., dead corals),
represents an important trade segment for some countries in the region but is not covered in this
report.
Export of aquarium fish and invertebrates (including corals) from Pacific Island countries and
territories started in the 1970s. It has since expanded to become an important source of income and
employment for a number of communities in the region. For example, in Fiji, the trade employs
Status report: Reef and nearshore fisheries and aquaculture 2013 Page 17around 600 people (Teitelbaum, Yeeting et al. 2010) and Fijian communities that derive a livelihood
from the aquarium trade tend to have a higher median income from this harvest when compared to
traditional fishery products (Lovell, McLardy 2008;Wabnitz, Taylor et al. 2003). In Tonga, the trade
was ranked as the country’s second highest income earner in 2008.
The trade currently operates out of 12 countries: Fiji, Papua New Guinea, Solomon Islands, Vanuatu,
New Caledonia, French Polynesia, Marshall Islands, Tonga, Cook Islands, Federated States of
Micronesia, Kiribati, and Palau. Commodities include coral reef fish, hard and soft corals, giant clams,
live rock and a number of reef invertebrates (e.g., sea stars, crabs, shrimp etc).
Analysis of CITES data – for corals, coral rock and giant clams
The Convention on Trade in Endangered Species of Wild Fauna and Flora (CITES) provides a means to
both monitor and regulate the trade in species listed. In the case of marine ornamentals and coral
rock, more than 2,000 species of hard corals and all species of giant clams are listed under Appendix
II. Parties to CITES, which include Fiji (1997), Vanuatu (1989), Palau (2004), Papua New Guinea
(1975), Samoa (2004), Solomon Islands (2007), all overseas territories, and the main importers of
marine ornamentals (i.e., USA and EU member countries) are required to submit trade figures
annually in accordance with CITES guidelines (CITES 2011). Analysis of importers’ data from the
CITIES Trade Database (managed by UNEP World Conservation Monitoring Centre) provides an
understanding of patterns in the trade of corals, coral rock and giant clams.
Live coral recorded in pieces
Live corals in the trade are typically transported in water. They vary in size and are identifiable to the
level of species or genus (CITES 2008). Trade reports submitted by importers from 1990–2010
indicate that live coral exports from the Pacific region peaked in 2006 and declined since (Fig. 11).
300
250
Quantity in 1000 pieces
200
150
100
50
-
Figure 11. Direct trade from the Pacific region between 1990 and 2010 in live pieces of coral.
The decline post-2006 may, in part, be linked to (i) the economic downturn, in which people spent
less on goods not considered essential and (ii) the increasing contribution of corals in trade within
importing nations (i.e., hobbyists sourcing corals from among their peers through so called
Page 18 Status report: Reef and nearshore fisheries and aquaculture 2013“fragging” or from local facilities successfully culturing corals). This latter point seems to be
underlined by the dramatic and significant decline in corals in the family Acroporidae, which are
some of the easiest to culture (Fig. 12).
120
100
Acroporidae
Quantity in 1000 pieces
Faviidae
80
Caryophylliidae
60 Pocilloporidae
Mussidae
40
Dendrophylliidae
20 Poritidae
Fungiidae
0
Figure 12. Trend in main coral families traded as live pieces for the marine ornamental trade.
Twenty genera, out of a total of 92, made up 86% of the trade from the region; with Acropora
accounting for 30% of total trade in live coral. The largest exporters were Fiji, the Solomon Islands,
and Tonga capturing over the years analyzed 52%, 23% and 22% of the trade respectively. The
United States was the leading importer (83% of all trade records) followed by the United Kingdom,
Singapore and Germany.
Most of the trade focused on specimens collected from the wild, with cultured corals amounting to a
maximum of 6% of traded specimens in 2009 and 2010. Most cultured specimens were exported
from the Federated States of Micronesia and Marshall Islands. The most commonly cultured corals
were species of the genus Acropora followed by Euphyllia, Montipora and Goniopora. Aquaculture is
likely to continue contributing to the marine ornamental trade providing a sustainable income for
local communities and a sustainable source of corals for aquarists. However, a large number of
species will be sourced from the wild for years to come as they do not lend themselves to culture,
generally due to slow growth and poor survival.
Coral rock traded as Scleractinia – by weight
According to its CITES definition, coral rock is hard consolidated material greater than 3cm in
diameter, formed of dead coral fragments and other sedimentary rocks, and that is characteristically
covered in coralline algae (CITES 2008). Hobbyists purchase coral rock to use as architectural
features and for its properties as biological filter and water chemistry stabiliser. Trade in coral rock
(also commonly traded as live rock and substrate), peaked in 2005 at 2180t dipping to 863 t in 2010
(Fig. 13). Fiji and Tonga exported the majority of coral rock from the region (75% and 18%
Status report: Reef and nearshore fisheries and aquaculture 2013 Page 19You can also read