TECHNICAL REPORT 2021 - Swico, SENS and SLRS News about electrical and electronics recycling
←
→
Page content transcription
If your browser does not render page correctly, please read the page content below
Swico, SENS and SLRS                        News about electrical
                                                and electronics recycling

    TECHNICAL REPORT
    2021

1   Technical report 2021 | Swico, SENS, SLRS
Contents

             1   Profile of the recycling systems		   4

             2   Swico/SENS Technical Commission      8

             3   Quantities			                        10

             4   Refrigerators                        14

             5   Recycling fluorescent tubes		        18

             6   New approach to batch testing        19

             7   Electronics in vehicles              22

             8   Swico innovation fund                26

             9   Flat-panel displays                  30

            10   Lithium battery fire risk            34

            11   Capacitor pollutants                 38

            12   PCBs in WEEE                         42

            13   International developments           44

            14   Farewell to Geri Hug                 46

           		Authors

           		Links

           		Contacts and publication information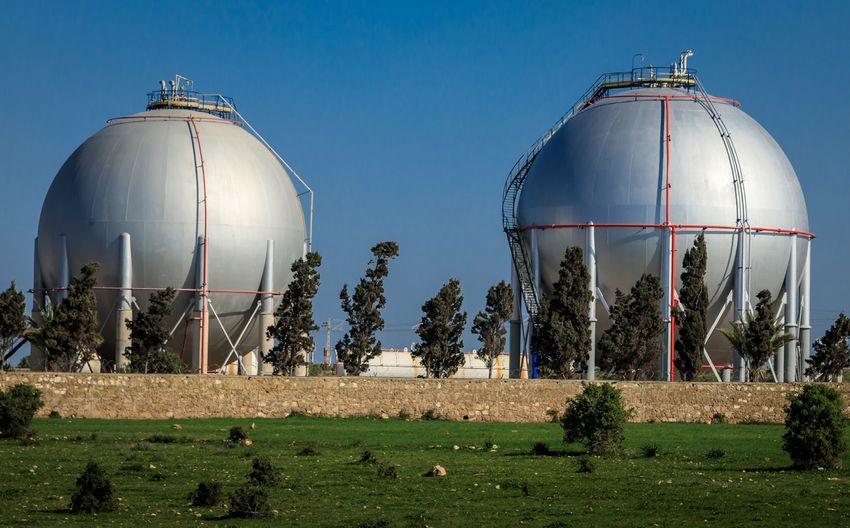
Foreword      1

Stress test passed

The recycling systems Swico, SENS and SLRS are        at all stages and, last but not least, consumers.
jointly presenting the technical and scientific       This has resulted in a fine balance dedicated
findings of the past year, as they do every spring.   to the sustainability and consumer friendliness
And, like every spring, we can say with satisfac-     of recycling. The robustness of these systems
tion that the recycling of waste electrical and       is demonstrated not least through their financial
electronic equipment is an ecological achieve-        endurance. Every single invoice was paid on time,
ment and is greatly increasing year on year.          index adjustments were implemented quickly,
                                                      innovations were financed easily and special
But the past year was unlike any before. It was       coronavirus-related compensation was even
characterised by lockdowns, uncertainties,            periodically given. Nevertheless, all the systems
alternating standstills and excessive backlogs.       ended 2020 with balanced results and without
The year of the COVID-19 pandemic was extremely       dipping into their reserves.
challenging and unstable for consumers, appli-
ance manufacturers, trading companies, recy-          The three systems are also confident in their
cling companies and collection points alike.          outlooks. Not only are we well positioned in
Systems demonstrate just how resilient they are       technical and financial terms; as this technical
in times of crisis – and we can proudly state that    report shows, we have the innovative strength
we passed the stress test.                            to cope with the future ecological challenges of
                                                      the electrical and electronics industry. We look
Swico, SENS and SLRS are characterised by their       forward to tirelessly continuing our contribution
tight-knit ecosystems of hundreds of contract         to sustainability and to maintaining Switzerland’s
and service partners, policies and management         position as a world leader in recycling.

                  Judith Bellaiche            Heidi Luck                Silvia Schaller
                  Swico                       SENS                      SLRS
1   Profile of the recycling systems

    Swico, SENS Foundation and SLRS:
    competent and sustainable
    For more than 20 years, Switzerland’s three take-back systems Swico, SENS
    eRecycling and the Swiss Lighting Recycling Foundation (SLRS) have been
    guaranteeing resource-efficient return, reuse and proper disposal of electrical and
    electronic equipment.

100%                                                                        95%
                    Manufacturers                                                             Collection points
                    Importers                      Consumers                                  Retail
                    Retail                                                                    Municipalities

                                   ARF included in sales price
                                                                                                    Monitoring

                                   Take-back systems SENS, Swico, SLRS

    Figure 1: Overview of the take-back systems

    There are historical reasons for the existence of       This means that Swico, SENS and SLRS have also
    three systems: in the early years of institutional-     made a significant contribution to the reintro-
    ised recycling, industry-specific systems were          duction of valuable resources into the production
    established. The aim of these was to guarantee          cycle. With the international networking of
    proximity to the relevant industry to answer to its     the three organisations at a European level –
    specific requirements. It also allowed initial reser-   for example, as members of the Forum for Waste
    vations about participation in a take-back system,      Electrical and Electronic Equipment (WEEE) –
    which remains voluntary to this day, to be broken       they also help to set cross-border standards
    down. Depending on the type of electrical or            for the recycling of electrical and electronic
    electronic equipment in question, Swico, SENS or        appliances.
    the Swiss Lighting Recycling Foundation (SLRS)
    is now responsible for recycling. In 2020, the          The Ordinance on the Return, Take-Back and
    three systems disposed of around 129,800 tonnes         Disposal of Electrical and Electronic Equipment
    of waste electrical and electronic equipment.           (ORDEE) obliges retailers, manufacturers and

4   Technical report 2021 | Swico, SENS, SLRS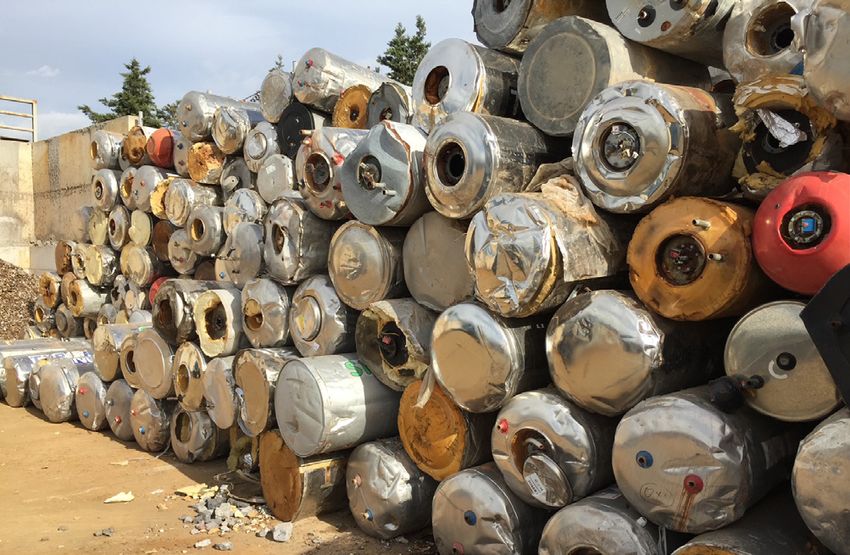
Preparation
                                                         of secondary
                                                         materials

                                                                                                  75%
    Transport                          Recycling                        Raw materials
    companies                          companies                        trade

                                                         Incineration

                                          ARF = Advance recycling fee     Financial flow   Material flow

importers to take back appliances they stock in
their product range free of charge. To be able to
competitively finance sustainable and environ-
mentally responsible recycling of electrical and
electronic appliances, an advance recycling
fee (ARF) is included in the sale price of these
appliances. The ARF is an efficient financing
instrument that guarantees that Swico, SENS
and SLRS can ensure proper processing of
the appliances in their respective area and con-
tinue to face challenges in the future.

                                                                                                           Ó

                                                                                                           5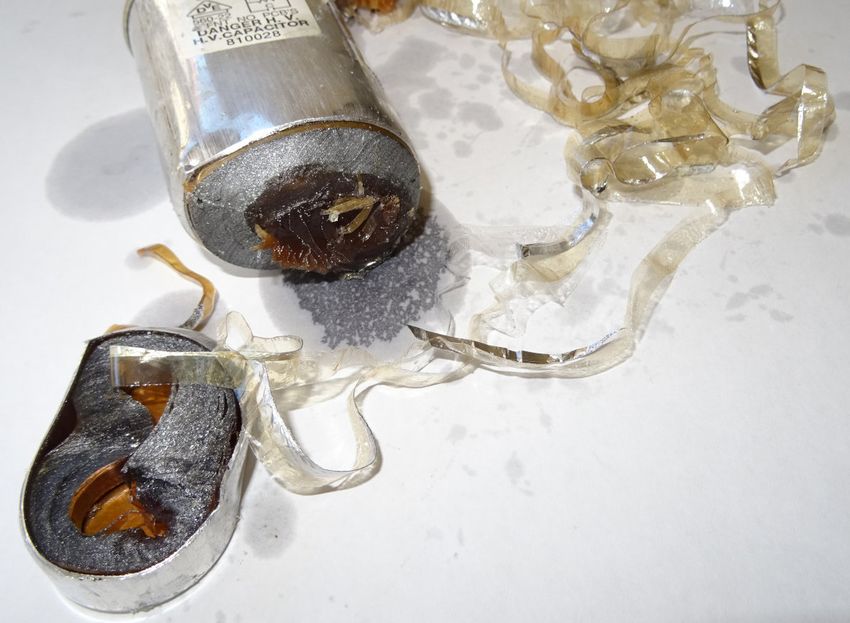
1   Profile of the recycling systems

    Swico
    Swico Recycling is a special fund within the Swiss Industrial Association
    Swico and deals exclusively with cost-covering recycling of waste electrical
    and electronic equipment. Swico aims to extract raw materials and dis-
    pose of pollutants in an environmentally friendly way. Swico’s focus is on
    equipment in the fields of computing, consumer electronics, office equip-
    ment, telecommunications, the printing industry, measuring and medical
    instruments - copiers, printers, televisions, MP3 players, mobile phones,
    cameras, etc. Close cooperation with the Swiss Federal Laboratories for
    Materials Testing and Research (Empa), a research and service institute for
    material sciences and technology development within ETH, plays a crucial
    role in ensuring that Swico can enforce high and uniform quality standards
    throughout Switzerland with all waste management services.

    SENS
    SENS eRecycling is an independent, neutral, non-profit organisation that
    operates under the SENS eRecycling brand. It focuses on the return, reuse
    and disposal of electrical and electronic appliances from the small and
    large domestic appliance sector, as well as construction, garden and hobby
    equipment and toys. To this end, SENS works in close conjunction with
    specialist networks in which the parties involved in the recycling of electri-
    cal and electronic appliances are represented. In cooperation with its
    partners, SENS is geared towards ensuring that the recycling of these
    appliances is compliant with economic and ecological principles.

    SLRS
    The SLRS bears basic responsibility for lamps and lighting equipment.
    SLRS deals with the organisation of comprehensive waste disposal sys-
    tems for lamps and lighting equipment across the whole of Switzerland.
    In order to finance these activities, SLRS administers a fund each for lamps
    and lighting equipment, which is fed from the relevant ARF. Training and
    sensitisation of market participants with respect to the recycling of lamps
    and lighting equipment and provision of information to all stakeholders also
    form part of SLRS’s remit. SLRS maintains a close partnership with the
    SENS Foundation across all areas. For example, as a contract partner to
    SLRS, the SENS Foundation provides not only collection and transport
    via its take-back and recycling system, but also recycling, monitoring and
    reporting with regard to lamps and lighting equipment on an ope-
    rational basis.

6   Technical report 2021 | Swico, SENS, SLRS
Ó

7
2   Swico/SENS TC

    Where is audit practice heading?
    Heinz Böni and Roman Eppenberger

    Many audit requirements have been expanded in recent years, making the audit
    processes longer and more laborious. The scope of the document review in the
    office has increased at the expense of the plant tour. The auditors agreed that they
    should go through the books on this. This is why the Swico/SENS Technical
    Commission held a closed meeting in mid-2020 and has made initial proposals.

    The audit system, according to which Swico and         What is changing?
    SENS recycling partners are regularly reviewed         Audit practice must be effective and efficient to
    based on technical and environmental require-          meet these requirements. ‘Effective’ means ‘doing
    ments, has continuously developed over the last        the right thing’ and ‘efficient’ means ‘doing things
    almost 30 years. Although the number of recy-          right’. In an audit process, this is always a balan-
    cling companies to be audited – currently 18 direct    cing act. Should documents primarily be checked
    recycling partners and 121 associated disman-          to identify potential errors, weak spots or insuffi-
    tling companies – has remained practically the         cient legal conformity? Or should the main focus
    same for years, the technical requirements have        be on operational practice to precisely identify
    been continuously expanded. The audit scope            what is perhaps well documented but inade-
    increased in particular with the introduction of the   quately implemented in practice? One thing is
    SN EN 50625 standard, which was defined by             clear: an audit provides a very limited view of
    Swico from 2017 and by SENS from 2019 as the           reality and the insight is limited to less than 0.5%
    technical basis for auditing. In some cases, this      of the annual working hours.
    led to very long, extensive document reviews and
    obligations to provide evidence together with          Against the backdrop of the still-unclear situation
    the plant management team, which significantly         regarding the upcoming ORDEE revision, the
    impaired the plant tour and thus the review of         Swico and SENS Technical Commission limited
    individual standard requirements on site. In numer-    itself to making only small adjustments to the
    ous cases, this frustrated both the auditors and       audit process for the time being. The key chan-
    the audited companies.                                 ges are that the document check should be
                                                           performed long before the actual visit to the plant
    The aim of the audit is to contribute towards the      and some of the points should no longer be
    recycling systems’ continuous improvement.             checked annually. This then allows for an extended
    This includes support in optimising operational        tour of the plant. Further changes will be ex-
    processes and an assessment of resource                plored once the ORDEE situation has been clari-
    efficiency when processing waste electrical and        fied and no significant changes are made to
    electronic equipment (WEEE). The latter focuses        the audit practice, e.g. by redefining the audit at
    on the target substances of recycling: the most        national level. So there is a small revision due
    complete separation possible and environmentally       to the current change. It may not be a huge stride,
    friendly disposal of the pollutants contained in       but it is certainly a step in the right direction.
    the devices, as well as a largely loss-free recovery
    of valuable secondary raw materials. With the
    auditors assessing the processes, the audits help
    to improve the state of the art in WEEE recycling.

8   Technical report 2021 | Swico, SENS, SLRS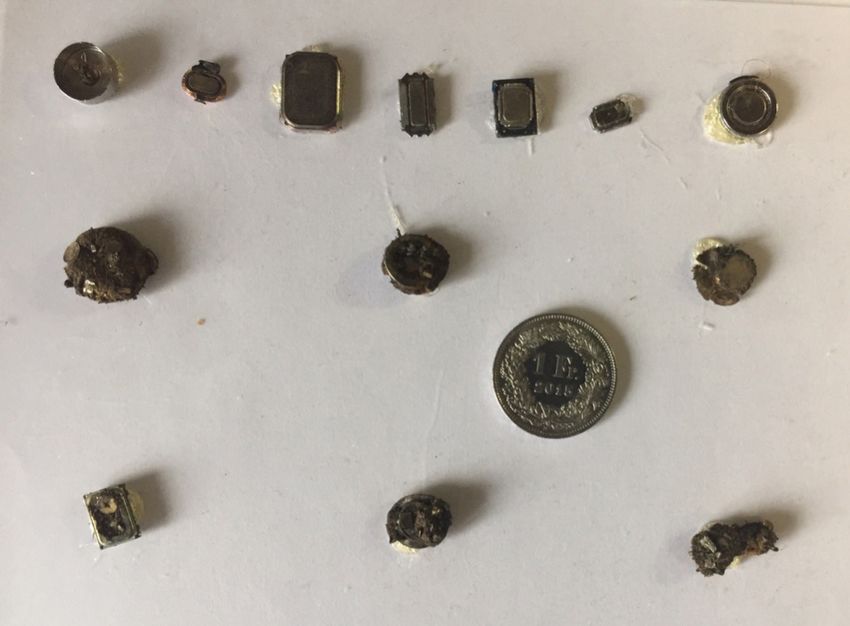
There have been some
changes among the auditors:
Michael Gasser left the Swico audit team in late
2019. He will be replaced by Charles Marmy,
who was introduced to auditing in 2020 and will
work as an auditor starting in 2021. Stefanie
Conrad joined the SENS audit team from Carbo-
tech AG. During an initial phase, she will primarily
be auditing dismantling plants. In addition,
Erhard Hug permanently stepped back from his
auditing activities as of late 2020. A special
article has been dedicated to him (see page 46).

Balls of plastic stored on the Thévenaz Leduc S.A. premises until processing.

                                                                                Ó

                                                                                9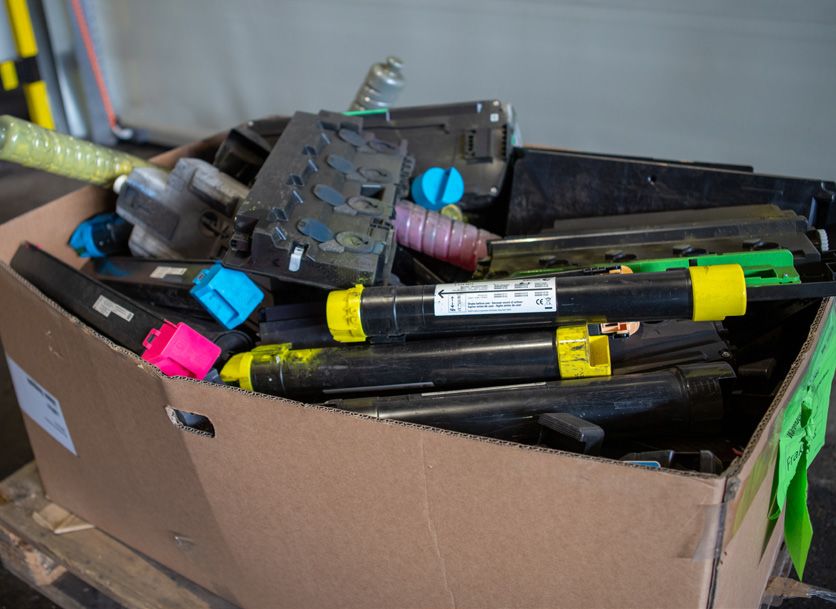
3    Quantities

     High collection quantities and
     composition continues to change
     Michael Gasser

     The processed quantities of waste electrical and electronic equipment remain in
     line with the long-term average. The composition according to individual categories
     is continuing to change. Quantities of electronic equipment continued to fall,
     which was offset by higher volumes of large household appliances and small house-
     hold appliances.

     In 2020, the Swico and SENS recyclers processed                             in line with the long-term trend (-1%) in part due to
     around 129,800 tonnes of electrical and electro-                            the decline in heavy CRT displays from computer
     nic equipment (Waste Electrical and Electronic                              monitors and televisions. With the almost com-
     Equipment), a figure up slightly on the previous                            plete disappearance of these types of screens,
     year, but still within the long-term average                                however, the decline appears to be slowing. In the
     (Table 1 and Figure 1). The various categories                              case of large electrical appliances, an upward
     continued to undergo long-term changes.                                     trend (+4%) is apparent again for the third year in
     The volume of non-ORDEE equipment that is not                               a row following a change to the recording meth-
     included in the lists provided in the Swiss Ordi-                           odology in 2017. A further rise (+4%) could was
     nance on the Return, Take-Back and Disposal                                 also observed in the quantities of small electrical
     of Electrical and Electronic Equipment (ORDEE)                              appliances, as was the case in the previous year.
     and the volume of refrigerators and lighting                                The volume of processed photovoltaic equipment
     equipment remained constant. The volume of                                  has declined slightly year on year, and its propor-
     electronic equipment processed is still dropping                            tion remains small at 200 tonnes in total.

     Year                     Large    Refrigerators,           Small        Electronic       Lighting    Photovoltaics      Non-ORDEE               Total
                         household     freezers & air      household        equipment       equipment                         appliances       tonnes/year
                         appliances     conditioners       appliances

     2009                    30,400           15,300           14,900           47,300            1,100                            1,200          110,200
     2010                    30,700           15,900           15,400           50,700            1,130                            3,500          117,400
     2011                    27,800           16,800           16,300           51,300            1,110                            5,200          118,500
     2012                    30,300           17,500           18,800           55,500             960                             6,000          129,100
     2013                    30,600           16,700           22,300           53,200            1,100                            4,000          127,900
     2014                    29,400           17,200           23,900           52,000            1,100                            3,000          126,600
     2015                    32,900           18,100            2,000           51,900            1,100             100            3,000          132,100
     2016                    32,500           19,200           27,900           49,000            1,100             100            1,900          131,800
     2017                    28,100           19,400           26,700           46,000             970              300            1,300          122,800
     2018                    34,200           19,900           27,600           41,900            1,100             300            1,000          125,900
     2019                    35,800           19,900           28,700           41,000            1,000             300            1,000          127,600
     2020                    37,100           20,100           29,800           40,600            1,000             200            1,000          129,800

     Change on                   4%               1%               4%              -1%              0%             -33%               0%               2%
     previous year

     Table 1: Total volume of processed electrical and electronic equipment in Switzerland in tonnes from the material flow recording system

10   Technical report 2021 | Swico, SENS, SLRS
140,000
120,000
100,000
Volumes in tonnes
80,000
60,000
40,000
20,000
Year 2000 2001 2002 2003 2004 2005 2006 2007 2008 2009 2010 2011 2012 2013 2014 2015 2016 2017 2018 2019 2020
L
arge household appliances S
mall household appliances S
mall household appliances and N
on-ORDEE appliances
R
efrigerators, freezers & air E
lectronic equipment electronic equipment together1
conditioners L
ighting equipment
Figure 1: Total volume of processed electrical and electronic equipment in Switzerland in tonnes from the material flow recording system. Source: Toocy
Recovering recyclables The fractions of recyclables from SENS and
Recyclables are recovered from the processed Swico recyclers are sent for further processing.
waste electrical equipment and pollutants are The SENS and Swico recyclers have to provide
separated by means of manual and mechanical evidence of material flows to prove and docu-
processing (Figure 2). Metals make up the ment the further processing of these fractions.
largest fraction of recyclable materials (62%). Ferrous fractions are processed in Swiss steel-
Plastic/metal mixtures (17%) and plastics (9%) works, while non-ferrous metals are handled in
are the next two largest fractions. The proportion European smelting works. Plastic/metal mixtures
of glass from cathode ray tube processing are separated further; depending on the separa-
decreased by another 17% year on year and still tion process and composition, the metals and, in
amounts to 0.8%. The particularly valuable some cases, the plastics too are recovered.
printed circuit boards account for only 1.4% of the Certain mixed fractions are still directly used for
total quantity. It is often worthwhile to remove energy recovery, although this proportion has
these components manually before mechanical fallen sharply in recent years thanks to new
processing, so the precious metals they contain processing options for toner cartridges and
can be recovered in as complete a condition as sorting systems for plastics/metal mixtures.
possible. The fractions of recyclables are further Glass fractions (screen glass, flat glass and
processed in downstream plants and recycled or recycled glass from illuminants), cables, printed
used to generate heat. circuit boards and batteries are also fed into
special recycling operations.
Ó
113 Quantities
Pollutant removal Take-back and composition
The share of pollutants produced accounts for of electronic equipment
around 1% of the total quantity (Figure 2). In Swico Recycling regularly inspects the quantities
addition to returning recyclables to the material taken back and the composition of electronic
cycle, pollutant removal is one of the main tasks equipment. To this end, it conducts shopping
undertaken by Swiss recycling companies. basket analyses and performs product group
Most of the pollutants are removed manually in processing tests (Table 2). In 2020, Swico Recy-
dismantling plants. Capacitors, for example, are cling took back 46,800 tonnes1 of electronic
removed from larger household appliances, equipment, the same as in the previous year.
batteries are taken out of electronic appliances The weights and quantities of CRT monitors and
and the mercury-containing backlights of flat-panel televisions taken back are still in decline,
displays, scanners and photocopiers are disas- thus continuing the long-term trend. The average
sembled. Pollutant removal and handling must be weights and quantities of FPD monitors and
adapted to changing technologies and the latest televisions continued to rise. While the number
findings. Companies must also remain capable of of mobile phones remains on the rise, the total
properly removing and disposing of pollutants volume increased only slightly due to the further
from older generations of equipment. This places decline in average weight.
high demands on the work undertaken by recy-
cling companies and calls for high-calibre quality A similar but less distinctive trend was also ob-
assurance systems. served in the ‘Consumer electronics, mixed’
category, where the average weight can vary
greatly year on year.
The composition of the individual equipment
categories is determined by processing tests
carried out by Swico recyclers and attended
by Empa. During this process, a predetermined
volume of equipment is collected and the
fractions resulting from the processing activities
are documented.
The detailed take-back quantities of electronic
equipment and its composition are listed in
Table 2.
1
This figure is greater than the 40,600 tonnes of electronic equipment in
Table 1, as it also includes equipment disposed of by A signatories
under direct contracts.
12 Technical report 2021 | Swico, SENS, SLRSRecyclable materials Hazardous substances
62% metals 0.580% batteries
17% plastic/metal mixture 0.149% capacitors
9% plastics .026% components containing
0
mercury
2% cables
0.003% broken glass
1% toner cartridges
0.031% phosphor
1.4% circuit boards
0
.000% getter pills
0% LCD
0.000% photoconductor drums
0.8% cathode ray tubes
with selenium coating
2% glass
0.018% appliance components
4% other materials containing asbestos
1% hazardous substances 0.070% CFCs
0.106% oil
0.003% ammonia (NH3)
ther residues containing
O
hazardous substances
Figure 2: Composition of produced fractions in % in 2020. Hazardous substance breakdown, which make up around 1% of the
total composition, are shown in the pie chart on the right (pollutants breakdown).
Appliance type Quantity 4 Average Metals Plastics Metal/ Cables Glass Printed Haz- Others 5 Total Increase/
weight plastic and/or circuit ardous decrease
mixtures LCD boards sub- compared to
modules stances 2019
in thousands in kg in tonnes in tonnes in tonnes in tonnes in tonnes in tonnes in tonnes in tonnes in tonnes
PC monitors, CRT 12 17.7 31 42 20 5 93 19 0 1 212 -65% 7
PC monitors, FPD 1
580 7.4 1,682 1,357 82 53 669 303 39 106 4,292 6%
PCs/servers 360 11.9 3,524 248 11 131 357 13 4,284 -9%
Laptops 480 2.5 353 349 123 6 106 174 83 5 1,200 -3%
Printers 460 11.5 1,874 2,846 326 29 36 92 2 86 5,290 2%
Large scale 48 128.8 3,365 231 2,210 112 4 50 53 158 6,182 -2%
copiers and
equipment
IT, mixed 2 820 3.1 1,383 91 915 46 1 19 22 64 2,542 14%
CRT TVs 51 27.7 139 289 47 5 913 17 1 1 1,413 -50% 7
LCD TVs 331 25.2 4,031 1,500 879 115 732 701 93 291 8,341 38%
Consumer elec- 3,525 3.0 5,632 380 3,791 191 5 82 91 265 10,434 -5%
tronics, mixed 3¨
Mobile phones 904 23 48 – – 7 30 27 – 136 10%
Remaining 1,303 1,205 79 797 40 1 17 19 55 2,215 -9%
phones, rest
Photo/video 219 90 6 58 3 0 1 1 4 164 -2%
Dental 61 -3%
Total in tonnes 23,333 7,468 9,259 734 2,568 1,864 445 1,037 46,7666 2.4%
Total in pct. 50% 16% 20% 2% 5% 4% 1% 2% 100%
1
FPD: flat-screen displays, different technologies (LCD, plasma, OLED, etc.) 5
Packaging and other waste, toner cartridges
2
IT equipment, mixed, not including monitors, PCs/servers, laptops, printers, 6
This figure is greater than the 41,000 tonnes of electronic equipment in
large-scale copiers and equipment Table 1, as it also includes equipment disposed of by A signatories under
3
Consumer electronics, mixed, not including televisions direct contracts
4
Projection 7
One-off correction: CRT monitors and televisions
Table 2: Swico volumes collected and composition by type of appliance (2020)
Source: Michael Gasser, Empa, based on Swico processing and market basket analyses (2020) Ó
134 Refrigerators
Highly developed processes for
recovering refrigerants and propellants –
a key contribution to climate protection
Geri Hug and Niklaus Renner
The recycling of disused temperature exchange equipment, i.e. compressor appli-
ances such as domestic and commercial refrigerators and freezers, is essential
for protecting the climate and the ozone layer. Tonnes of CO2 in the single and double
digits are saved with every kilogram of refrigerant and propellant recovered and
rendered harmless in a controlled manner. Sceptics of the complex processes should
note that the climate-related significance of recycling refrigerators decreases slightly
year on year, as more and more appliances are produced with climate-friendly
agents. However, until the last appliance with R-11, R-12 or R-134a (subsumed
under the term ‘VFC’1 defined in the standard SN EN 50625-2-3) goes into reverse
production, a timescale of 2030 is insufficient, and state-of-the-art processing
together with newer appliances without climate-harming substances is the only
ecologically acceptable way. SENS also recommends disposal via refrigerator recy-
cling systems for the insulation foams from boilers.
Proportion of climate-friendly VHC2 appliances HCFC, as in the case of the refrigerants). In the
practically unchanged current survey year, 75% of all recycled refrigera-
The long-standing trend towards ever-higher tors were already insulated with cyclopentane-
proportions of climate-friendly, VHC-operated foamed polyurethane (PU) – a moderate year-on-
compressors remains stable. In 2020, 66% of the year increase of + 2%.
appliances processed at stage 1 were the type
with a VHC compressor (dark green line in Fig. 1), Overall, the number of appliances processed in
so there was practically no year-on-year change. both processing stages by Kühlteg AG, Immark
However, 32% of the appliances still had a com- Schattdorf AG (formerly Ruag Environment AG)
pressor filled with VFC. Absorber systems con- and Oeko-Service Schweiz AG dropped by 5%
taining ammonia made up 2% of all processed (from 390,000 appliances or 19,900 tonnes to
appliances (this figure is also unchanged). around 370,000 appliances or 18,900 tonnes at
present). See Fig. 1.
When it comes to insulation foams treated at
stage 2, the data continues showing an analo-
gous trend. However, this was noticeable earlier,
since the VFC R-11 was replaced by the VHC
cyclopentane directly (without an intermediate
1
V
FCs: volatile fluorocarbons (e.g. R-11, R-12, R-134a, R-22, etc.)
2
V
HCs: volatile hydrocarbons (e.g. R-600a or cyclopentane)
14 Technical report 2021 | Swico, SENS, SLRSTemperature exchange equipment
100% Compressor with VFCs
90% Compressor with VHCs
80% Absorber with NH3
PU insulation with VFCs
Percent: appliance types
70%
PU insulation with VHCs
60%
50%
40%
30%
20% Figure 1: Development of appliance types processed
at stage 1 (compressors containing VFCs/VHCs,
10%
absorption systems containing ammonia) and stage 2
0% (PU insulation foam containing VFCs/VHCs).
2000
2001
2002
2003
2004
2005
2006
2007
2008
2009
2010
2011
2012
2013
2014
2015
2016
2017
2018
2019
2020
Recovery volumes slightly so the recovered quantities can be divided be-
higher than expected tween the two fractions of processed appliances
The recovery volumes have not changed much in only with a degree of ambiguity. With such uncer-
the long-term trend. The volumes of recovered tainties in the evaluation method on the one hand
refrigerant and propellant mixtures continue to and certain incoming goods reporting challenges
decrease as the ratio of the processed appliances on the other, the slight rise in refrigerant and
shifts towards the VHC types, since their com- propellant recovery compared to the previous
pressor filling quantities and the concentration in year can likely be interpreted as: 63 g per appli-
the PU foam are considerably lower than in the ance or 37 g per kg of PU foam (2019: 61 g/
VFC appliances. The data concerning the as- compressor or 34 g/kg PU 3). This has little to do
sumed values for VFC and VHC filling quantities with the plant performance in and of itself. During
for domestic and commercial refrigerators going performance tests, carried out exclusively with
through both processing stages was collected domestic refrigerators, constant recovery rates
from a wide range of sources and is, accordingly, are also determined over the years.
reliable. In the case of appliances that are only See Fig. 2.
processed only at the first stage (e.g. tumble
dryers, mobile air conditioners, dehumidifiers),
such assumptions exist to an imprecise degree,
Refrigerant/ oil/ propellant recovery
300
Grams of refrigerant/oil/ propellant per appliance
First stage: g of oil per appliance
First stage: g of refrigerant per appliance
250
Second stage: g of propellant per kg insulation foam
200
150
100
50
Figure 2: Development of recovery volumes at stage 1
(g refrigerant and oil per appliance) and stage 2
0 (g propellant per kg insulation foam)
2000
2001
2002
2003
2004
2005
2006
2007
2008
2009
2010
2011
2012
2013
2014
2015
2016
2017
2018
2019
2020
3
In last year’s technical report, this value was incorrectly
stated as 54 g/compressor. Ó
154 Refrigerators
CO 2 savings equivalent to several thousand gas In the current survey year, the volume of emis-
storage tanks sions avoided through controlled recovery of
The technically demanding target of 90% refriger- climate-changing gases was around 280,000
ant and propellant recovery set out in the CENE- tonnes of CO2 equivalents, which can be illustrat-
LEC standard is doubly relevant when it comes to ed with the contents (compressed at 6 bar) of
environmental protection. On the one hand, the 5,600 typical spherical gas tanks measuring
CFCs contained in older compressors and PU 20 m in diameter – the ones we all know from
insulation foams have to be removed from the natural gas storage facilities (Fig. 3).
flow of old appliances due to their ozone deple-
tion potential (ODP). At the same time, these Taking a broader view: insulation
substances have a global warming potential foams from boilers
(GWP) that is 1,000 to 10,000 times greater than Refrigerators are not the only appliances that
CO2 (see Table 1). This is why recovering them contain climate-changing gases; the foam insula-
and subsequently converting them into CO2 as tion found in boilers and hot water tanks does
well as water, acids and salts (which have far too. Although this category does not include
less of an impact on the climate) in a controlled appliances returned as part of the SENS system,
manner makes a key contribution to environmen- it is worth exploring at this point due to
tal protection. its climate impact and relevance to disposal.
Substance Ozone depletion Global warming potential
potential (ODP) (GWP) with a timescale of
R-11 equivalents 100 years
CO 2 equivalents
Refrigerant (first stage)
CFC-12 (R-12) 1 10,200
HFC-134a (R-134a) – 1,300
Isobutane (R-600a) – 3
Propellant (second stage)
CFC-11 (R-11) 1 4,660
Cyclopentane (CP) – < 25
Table 1: Ozone depletion potential (ODP) and global warming potential
(GWP) of refrigerants and propellants used in refrigerators.
Sources: FOEN (2013), EPA (2016), IPCC (2014).
16 Technical report 2021 | Swico, SENS, SLRSFigure 3: Typical spherical gas tank for storing natural gas (source: Adobe Stock).
Exploratory analyses performed by SENS and a foams (at least those containing CFCs) – or, for
study conducted by the Öko-Institut Darmstadt example, sandwich element insulation panels –
(Darmstadt Institute for Applied Ecology) on is through stage 2 in refrigerator recycling plants.
behalf of the RAL Quality Assurance Association The people returning the appliances, the dis-
for the Demanufacture of Refrigeration Equip- mantling companies, the disposal companies and
ment (2020) revealed that VFCs/VHCs are still the cantonal offices frequently know far too little
present in insulation foams found in boilers in about this. Kühlteg AG and Oeko-Service Schweiz
concentrations comparable to refrigerators, even AG have been processing PU foam from supplied
after use. Boilers built before the mid-1990s are boilers in their stage 2 plants for many years.
generally considered to contain CFCs. The insulation is manually removed and then
processed together with the refrigerator casing.
The conclusion from the studies mentioned We hope that this best-practice approach to
above is that from an ecological standpoint, the disposal will catch on!
only correct disposal route for boiler insulation
Figure 4: Boilers for manual PU foam removal and processing in refrig-
erator recycling plants (picture used with the kind permission of the RAL
Quality Assurance Association for the Demanufacture of Refrigeration
Equipment, 2020). Ó
175 Recycling fluorescent tubes
Recycling fluorescent tubes:
opportunities and challenges
Flora Conte
Around 800 tonnes of fluorescent tubes are processed in Switzerland every year.
Compliance with the mercury limitsmust be strictly monitored, since the top priority
is to protect both people and the environment. Thanks to conscientious work and
efficient recycling processes, recycling is at over 90% despite the challenge posed
by this volatile and toxic heavy metal.
SENS, SLRS and Swico promote the circular from the aluminium fraction. However, glass is
economy by recycling Waste Electrical and the material that contributes most to the high
Electronic Equipment (WEEE). Protecting people recycling rate. Almost 100% of the glass fraction,
and the environment from pollutants is a vital (i.e. most of the output volume) can be recycled.
part of this. In Switzerland, numerous recycling In the past, the glass was used to manufacture
companies specialise in the recovery of lighting new fluorescent tubes. Demand for this applica-
equipment, particularly rod-shaped gas discharge tion is decreasing with the transition to LED
lamps, also known as fluorescent tubes. Around lamps. The glass is now used in, for example,
800 tonnes of fluorescent tubes are processed glass wool production.
every year. Unlike most WEEE categories, pollut-
ants in fluorescent lamps cannot be removed
before mechanical processing. Mercury (Hg) that
adheres to the components proves to be prob-
lematic during recycling. There is a health risk as
soon as lighting equipment is damaged due to
being handled incorrectly during the recycling
process. Toxic mercury vapours form and escape
even at room temperature, which is why mercury
must be technically separated so that the limits
and benchmarks are always adhered to. Hg
values must be strictly monitored.
Almost 100% of the glass fraction,
(i.e. most of the output volume) can be recycled.
Four fractions are created when recycling fluores-
cent tubes: glass, aluminium end caps, magnetic
metals and fluorescent powder. Although avoid- When recycling fluorescent tubes, it’s fair to say
ance of mercury contamination is the top priority, that the amount of usable material is very high,
the targeted 90% recycling rate is easily achieved but it must be handled with great care. This starts
in the recycling plants. The magnetic metals’ and even when private individuals return fluorescent
the fluorescent powder’s mercury mass ratios are tubes at the collection point.
above the limits, so they can barely be used if at
all. The fluorescent powder is disposed of in an
underground waste site in the EU. For the glass
and aluminium fractions, the limits of 5 or
10 ppm Hg are generally adhered to without any
issues. So aluminium can be produced again
18 Technical report 2021 | Swico, SENS, SLRSNew approach to batch testing 7
Batch tests:
which indicators are relevant?
Anahide Bondolfi and Andreas Bill
One of the key indicators used by the EN 50625 series of standards to assess the
performance of a WEEE recycler is the recycling rate. However, since the recycling
rate is influenced by the composition of the processed material and does not take
the ecological value of the recovered or lost materials into account, this indicator
is no longer satisfactory from today's perspective. With the new ‘SENS and Swico
supplementary technical regulations for the SN EN 50625 series’, SENS and Swico
have started the process of revising the recycling performance indicators.
In 2020, batch tests were carried out as pilots to test new approaches such as
the consideration of potential base metals and recyclable plastic losses.
Flaws of the recycling rate indicator Recycling rate: benchmark instead of limit
Swico and SENS monitor compliance with With this in mind, the Swico/SENS Technical
legislation and environmental regulations and Commission (TC) adapted the specifications for
assess recyclers’ performance using various batch tests and assessing them in the ‘SENS
methods such as company audits, material flow and Swico supplementary technical regulations
checks and batch tests. One use of the batch for the SN EN 50625 series’ that have been
test is to uniformly determine the recycling rate applicable to Swiss recyclers since 1 Janu-
(i.e. the material recovery rate) for each recycler ary 2020. The recycling rates per appliance
according to the treatment stream. But this category are no longer set as a limit, but as
indicator has two major flaws: a benchmark. This enables greater flexibility
when interpreting the results of a batch test,
– The achievable recycling rate depends on the particularly by taking the quality of the input
composition of the material processed in the material into account, and it also considers the
batch test. This is variable and does not depend technology’s constant further development.
on the recycling performance. For small appliances without any screens and
– While the recycling rate provides volume- heat exchangers, the benchmarks for the recy-
related information about the recovery rate of cling rate to be achieved have also been harmo-
the most important materials, such as iron, nised with Annex V of the European Directive
aluminium, copper and plastics, it does not take on waste electrical and electronic equipment
their ecological value into account. In the case (WEEE Directive). European recyclers’ targets
of technical metals, this value can be very high, were last adjusted there on 15 August 2018, so
even with smaller contents. the recycling rate to be achieved for Swico small
appliances was reduced from 65% to 55% and
rose from 50% to 55% for SENS small appliances.
Ó
196 New approach to batch testing
Benchmarks for large household appliances Uncertainties in input-based
The benchmark for large household appliances recycling rates
was adjusted in Switzerland after it came to light While the new benchmarks for large household
that numerous recyclers found meeting the appliances, which are determined based on the
requirements set out in the European Directive mix of appliances processed, are more realistic,
difficult. Instead of the 75% benchmark for all there are still considerable uncertainties. The
large household appliances that was valid metal content, which was calculated during the
previously, a quota was introduced for each of special batch tests to determine the four appli-
the four key appliance types in this category. ance types’ recycling potential, varied between
The recycling rates per appliance type were the individual batch tests with a 6% average
calculated based on specific batch tests carried standard deviation. The standard deviation was
out at four Swiss recyclers between 2018 and as high as 10% for washing machines and just
2020. The composition of each initial fraction 3% for ovens. This shows that the appliances’
was estimated through further separation steps composition can vary a great deal, even within
or analyses, and the metal content was deter- the same appliance type. A study on the material
mined in order to calculate the recycling rate flow conducted by Swico Mix1 in 2019 led to
that could potentially be achieved. This was then similar findings. Determining the recycling
introduced as a new benchmark for the appli- potential by extensively characterising the batch
ance type in question. The benchmark for ovens, input material’s composition is not sufficiently
which contain large amounts of metals, has robust (degree of uncertainty surrounding the
been increased to 86%. But lower benchmarks target substance balances > 50%) and the work
were set for washing machines (69%), dishwash- required for this type of investigation is exces-
ers (68%) and tumble dryers (73%, once any sively high for regular implementation.
compressors have been removed), since these
appliances are increasingly made with ever more A new indicator: metal and plastic losses
plastic. Although the recyclers’ technologies In addition to the adjustments to the recycling
tend to become more efficient and thus enable rate benchmarks, the ‘2020 supplementary
improved reusable material recovery, the recy- technical regulations’ introduced a new indicator
cling quota targets do not necessarily increase for assessing recycling performance: the amount
because the appliances’ composition does not of non-recycled metal (ferrous metals, copper
always develop in a manner that is beneficial to and aluminium) and recyclable plastics – i.e.
recycling. losses in the process chain. These losses usually
arise in shredder light fractions or in mixed metal
fractions that go to final processing where only
one metal is recovered. Examples of such losses
are copper contents in an iron scrap fractions
used in steelworks, or ferrous metals in engines
used in a copper smelter. These losses are
estimated in kg per t total processed material, not
according to the relative metal content per frac-
tion, to take the total quantity of lost resources into
account. For the new indicator, target values were
proposed in the document for batch tests, but they
have not been made binding yet.
1
The Swico Mix is made up of Swico small appliances without Visual
Display Unit and screens > 100 cm2 (i.e. removable notebook screens,
for example, are also diverted from the treatment stream).
20 Technical report 2021 | Swico, SENS, SLRSPilot phase: 2020 and 2021 Further information
The analysis of material losses seems to be Quoted studies from earlier technical reports:
more promising than adjusted recycling rates
based on the relevant input composition, but ÖT
echnical Report 2019, p. 43 - 44, Recycling
experience is still needed. A Swico/SENS TC rate of large household appliances, Geri Hug
working group is therefore continuously working and Anahide Bondolfi
on further developing these indicators. During
a pilot phase in 2020, additional analyses were ÖT
echnical Report 2020, p. 32 - 33, Recycling
carried out in the batch tests to determine metal quota of large household appliances – an
losses in various fractions from mechanical update, Geri Hug and Anahide Bondolfi
processing. To this end, fractions in which the
presence of a certain metal is expected but it is ÖT
echnical Report 2020, S. 24 - 29, Are extended
not recovered in a downstream process were batch tests suitable for determining the
selected. In addition to the base metals (Fe, Al recycling potential?, Roger Gnos, Rolf Widmer
and Cu), gold, silver and palladium were also and Lorena Toledo Reyes
sometimes analysed in these fractions, since loss
of these precious metals is also a major loss in ÖT
echnical Report 2020, S. 40 - 41, A circular
terms of ecological value. The results of this pilot economy for WEEE recycling: Are we heading
phase revealed that the metal contents in the in the right direction?, Heinz Böni and Rolf
finest non-metal mechanical processing fractions, Widmer
including the shredder light fraction (SLF), dust
and filter fractions, varies greatly between recy-
clers and can sometimes be very high.
Benchmarks for recycling rates valid in Switzerland in 2021
For large appliances, these rates include only the recycling target for metals.
Treatment stream Recycling rate benchmark
Temperature exchange equipment 80%
Visual Display Units 65%
Rod-shaped gas discharge lamps 90%
SENS large appliances: washing machines 69%
SENS large appliances: dishwashers 68%
SENS large appliances: tumble dryers 73%
SENS large appliances: cookers/ovens 86%
Swico large appliances 75%
SENS small appliances 55%
Swico small appliances (Swico Mix) 55%
Ó
217 Electronics in vehicles
Electronics in vehicles:
an undiscovered gold mine?
Charles Marmy
Over the past few decades, there has been a spike in the number of electronic
components in our cars and the boom in electromobility is only adding to this
momentum. Just like smartphones, laptops, monitors and similar devices, these
components contain rare and precious metals. But unlike domestic appliances,
they are generally not recycled separately.
Have you driven a car today? If you have, then you In recent years, the number of such components
will already have used countless electronic has risen rapidly. Just like consumer electronics
components: the smartphone-to-multimedia (computers, telephones, printers, monitors, etc.),
display connection, the GPS, the inside tempera- they contain a number of rare or precious metals,
ture controller, the automatic headlights, the including gold, neodymium, copper and cobalt,
electric windows, the cruise control, the rear view that are essential for new technologies. Altogeth-
cameras, the obstacle detection sensors – the er, there are considerable amounts of metals like
list goes on. these in vehicles (see Fig. 1). In Switzerland,
these quantities are roughly the same as those
found in consumer electronics. But unlike con-
sumer electronics, most vehicle electronics are
not divided and recycled separately once the car
has reached the end of its service life. The main
aim of processes commonly used in the recycling
of wrecked cars is to recover industrial metals
such as iron, copper or aluminium. So rare and
precious metals that are mainly found in electron-
ic components are lost.
22 Technical report 2021 | Swico, SENS, SLRS900,000
800,000
700,000
600,000
500,000
kg
400,000
300,000
200,000
100,000
0
2005 2006 2007 2008 2009 2010 2011 2012 2013 2014 2015 2016 2017 2018 2019 2020 2021 2022
Ag Au Dy La Nd Pd Pt Rh
Figure 1: Annual total quantity of rare and precious metals in the car fleet in EU countries, the UK, Norway and Switzerland that
potentially could be recycled, including a forecast for 2021 and 2022. (preliminary results, RMIS project, JRC)
What’s more, the automotive industry has all Swiss vehicles in 2020, and this figure is likely
been undergoing profound changes in recent to continue rising rapidly in the coming years.
years. Electric vehicles’ share of the market In the next decade or two, fully or partly electric
is booming. In 2020, one in four vehicles sold cars will make up a significant share of end-of-life
in Switzerland was partly electric at least vehicles to be recycled.
(i.e. hybrid, plug-in hybrid or fully electric) and
approximately one in 10 vehicles was fully
electric. These drive types made up 3.8% of
Ó
237 Electronics in vehicles
This development has implications for the
vehicles’ composition and the materials they
contain. Electric vehicles contain electronic
components not found in vehicles with internal
combustion engines, including lithium-ion
batteries, electric motors and battery manage-
ment systems (BMSs). And they weigh a fair bit
to say the least. A fully electric car battery
weighs around 500 kg, a great deal more than the
engine’s roughly 40 to 50 kg. What’s more, these
components contain raw materials rarely found
in the electronic parts of conventional vehicles.
Most lithium-ion batteries contain cobalt. Neo-
dymium and dysprosium are needed to manufac-
ture high-performance permanent magnets like
those used in most electric engines, and copious
quantities of copper are used to make their
solenoids (see Figs. 2 and 3).
40 Cast iron
High-strength steel
30 Construction steel
Cast aluminium
Power electronics
20
kg
Forged aluminium
Permanent magnet motor
10 Induction motor
BMS
0 BSA system
Petrol
Diesel
Hybrid
Hybrid
Plug-in
Fully
electric
Vehicle type
Figure 2: Average amount of copper per component and vehicle type (2020)
(preliminary results, RMIS project, JRC)
24 Technical report 2021 | Swico, SENS, SLRSNd in end-of-life and damaged vehicles
50 Lithium-ion battery
ABS and ESP actuator
40 Engine control
NiMH battery
Speakers
30 Electric drive motor
kg
20
10
0
2010
2011
2012
2013
2014
2015
2016
2017
2018
2019
2020
2021
2022
2023
2024
2025
2026
2027
2028
2029
2030
2031
2032
2033
2034
2035
2036
2037
2038
2039
2040
Figure 3: Amount of neodymium contained in end-of-life and wrecked vehicles in Switzerland (preliminary results,
EVA II project, Empa)
Several scientific studies, including the EVA II Further information
study conducted by Empa across Switzerland
and the RMIS study by JRC at European level, ÖR aw Material Information System (RMIS) pro-
incorporate this development to make estimates ject, Joint Research Centre (JRC) of the EU
and predictions about the amount of raw materi- Science Hub
als available in current and future end-of-life Ö Recycling of electric components from passen-
vehicles. Both studies aim to show that there is ger vehicles (EVA) project, Empa
an interest in recycling these previously neglected
electronic components; they also want to encour-
age the development of industrial recycling
projects and support political measures. Society
has become more dependent than ever on new
electronic technologies, be it for convenience or
security. This much is also true of various produc-
tion and storage technologies in the field of
renewable energy, which are crucial for a fast and
efficient energy transition. In addition to their
considerable economic value, these raw materi-
als that are a vital part of modern-day technolo-
gies are also strategically important. Closing this
recycling cycle, particularly through efficient and
targeted recycling, must be a top priority. Switzer-
land is already doing a stellar job in this respect,
largely thanks to organisations such as Swico,
SENS and BATREC. However, electronic compo-
nents from the automotive industry are still
slipping through the cracks in this system.
Ó
258 Swico innovation fund
Swico supports innovations
in e-recycling
Roger Gnos
The Swico innovation fund was launched in 2019 and had invested CHF 384,000 in
innovative projects by the end of 2020. Funding was provided for the construction
of a toner recycling plant, for trials to improve cobalt and neodymium recovery and
for a ‘reuse before recycling’ project. Other projects are in the pipeline.
The Swico innovation fund was launched by The projects submitted must be innovative,
Swico Recycling and supports projects that provide relevant benefits for the Swico ecosys-
boost the innovation of Swico Recycling’s eco- tem, have good chances of success in terms
system. The projects can take place throughout of feasibility and be supported by applicants
the entire recycling chain, from WEEE collection with the required qualifications.
to the removal of hazardous and valuable sub-
stances. Swico’s contractual partners can also The first funded project received a great deal of
enter into collaborative relationships with attention from professional circles: Swico
start-ups or research institutes to kick-start supported the construction of a toner recycling
projects that do not fall under the usual guiding plant to the tune of CHF 240,000. After all, over
principles. 1,700 tonnes of toner cartridges and refill
containers are accumulated across Switzerland
Recycling companies, manufacturers and also every year; at present, they are exported abroad
other participants in the Swico ecosystem and their transport negatively impacts the car-
that have a contractual relationship with Swico bon footprint.
can submit applications for funding projects.
Recycling toner in Switzerland –
from project to full capacity
Submitted by Solenthaler Recycling AG based in
Gossau, this project’s original goal of commis-
sioning a plant capable of safely removing and
stabilising toner dust to ensure eco-friendly and
sustainable processing by early 2021 could not
be fully met due to the delays in the approval
process, construction and test operation caused
by the coronavirus. In December, Empa examined
the plant in test mode, coming to the positive
conclusion that the plant is running continuously
and safely, and the output products are clean
and sortable.
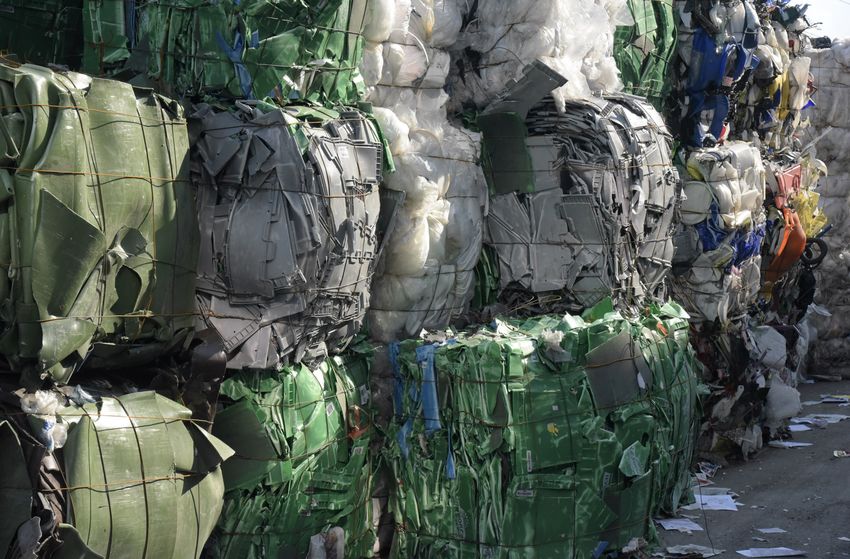
26 2021 technical report | Swico, SENS, SLRSThe members of the innovation fund’s advisory board in front of the new toner plant; from left to right:
Heinz Böni, Empa; Marius Schlegel, Swisscom; Roger Gnos, Swico, Chairman of the Advisory Board
Since April 2021, the plant has run with a annual means signatories of the Swico Recycling Con-
capacity of 1,500 tonnes in a single-shift opera- vention, retailers and end consumers can rest
tion. This is 1.5 times the amount originally assured that their components containing toner
planned, equating to a volume of four and a half will be sustainably and efficiently disposed of in
Olympic swimming pools and saving around 150 Switzerland.
tonnes of CO2 per year. This innovative project
Toner cartridges and refill containers can now
be recycled in Switzerland.
The toner dust can
be processed safely when securely bound.
Ó
278 Swico innovation fund
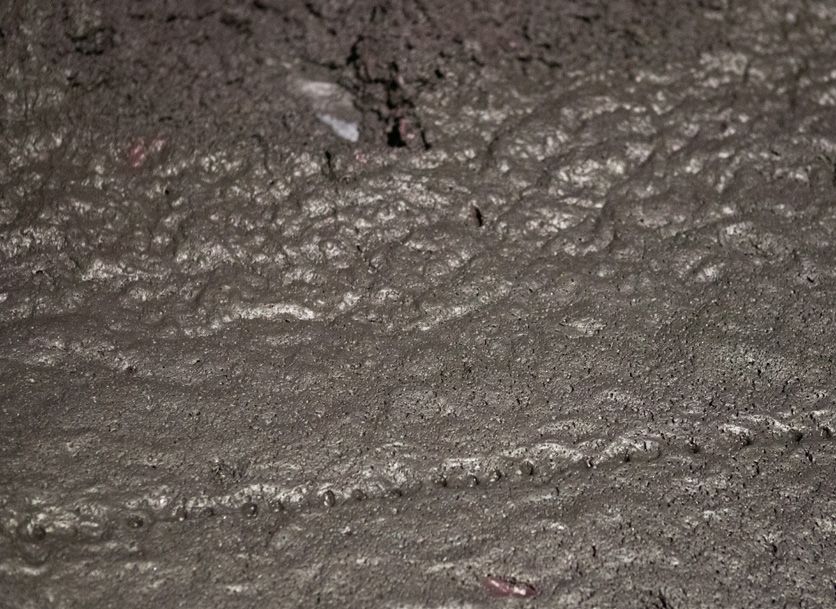
Funding neodymium and cobalt recovery Reusing before recycling
Two other projects funded by the Swico innova- The best recycling is recycling that takes place
tion fund explore the increasing miniaturisation of as late as possible. That’s why the Swico innova-
lithium batteries and the related consequences tion fund supported a project by leBird Sàrl with
for recycling. Safety-related aspects are the main funding of CHF 75,000 in 2020. The study evalu-
focus, since many of these batteries are defective ates the potential for reusing laptops, flat-screen
or stuck to the surrounding materials. But cobalt TVs, mobile phones and other devices where
recovery is another focal point too. The feasibility applicable. The first step involved identifying the
study illustrated that this recovery is fundamen- industry’s needs, as well as the risks and opportu-
tally feasible. Fortunately, it was also demonstra- nities.
ted that magnets containing neodymium are
accessible in the resulting ground material. The background to this study is an investigation
Neodymium is one of the rare-earth elements by Empa that assessed the reuse of electronic
that is top of the list according to a FOEN study devices, where most environmental pollution
from 2011. To clarify in more detail whether and occurs during production, to be ecologically
how the recovery of both raw materials is eco- sound. However, the economic viability – i.e. how
nomically and ecologically viable, the Swico willing a buyer is to purchase a second-hand
innovation fund made an additional CHF 24,000 device – very much depends on its quality and
contribution in autumn 2020. The first results the sales price, and too little is known about this
were announced in early 2021. at present.
Encouraging results
Based on leBird Sàrl’s first test, a second step
is now clarifying how reusable devices can be
randomly identified, categorised and documented
in a dismantling company. The focus then shifts
to the aspects of functionality, data security and
the development of a second-hand online shop
with the corresponding specifications. Devices
are not sold during this clarification and test
phase, because the necessary guidelines are not
currently available and the contracts with Swico
Recycling exclude resale. Two experts from Empa
Neodymium magnets
are providing project support.
As Markus Stengele, a project manager at SOREC,
explained, the selected test set-up achieved
positive results and encouraged SOREC
to apply for implementation as part of the lithium
battery project.
28 Technical report 2021 | Swico, SENS, SLRSConclusion after the Swico innovation fund’s first manufacturers and other participants in the
18 months recycling ecosystem that have a contractual
We are very satisfied with the projects submitted relationship with Swico to submit innovative
so far. They prove that Switzerland’s recycling projects to the Swico innovation fund. You will
industry is both innovative and proactive. There find everything you need to know about the
is high level awareness of greater sustainability submission deadlines and the related process at
and an improved circular economy – and compa- Ö www.swico.ch/innovationsfonds
nies are extremely willing to carry out preliminary
work. The fund is designed to push boundaries
and, by doing so, turn visions into a reality.
Swico encourages all recycling companies,
‘The Swico innovation fund supports promising recycling pro-
jects with financial support of up to CHF 300,000. Recycling is
defined in the broad sense of the circular economy: logistics,
monitoring and the life-time extension of devices are included
too. Projects from areas such as of applied research and devel-
opment or pilot tests are also awarded funding. Participants in
the ecosystem that have a contractual relationship with Swico
are eligible to apply. Cooperation and alliances with third parties
(i.e. start-ups) are welcomed. We look forward to receiving your
application by 15 February or 15 August every year.‘’
Judith Bellaiche, Swico Managing Director
Ó
299 Flat-panel displays
Quantitative and technology
development and recycling
requirements for flat-panel displays
Heinz Böni and Andreas Bill
Flat-panel displays have become an integral part of our everyday lives. The techno-
logy incorporated in these devices has seen significant development over the last
decade. The trend is moving more in the direction of OLED, following a sharp drop in
prices. How the devices develop in technological terms also influences the environ-
mentally sound recycling requirements.
In 2019, around 1.4 million Visual Display Units and businesses has remained largely constant
(i.e. PC monitors, TVs and laptops) weighing and quantities are no longer increasing –
13,900 tonnes in total were disposed of in Swit- showing a typical picture of a saturated market
zerland. This figure corresponds to 30% of all (see Fig. 1).
devices collected and processed by Swico this
year, with 5,830 devices processed per working The number of appliances containing CRTs has
day, and around 650 devices processed per hour. decreased from a peak of around 22,000 tonnes
After the number rose sharply from around (2011/12) to around 3,500 tonnes (2019), while in
900,000 devices to 1.5 million between 2006 and the same period the amount of flat-panel displays
2009, this figure has fluctuated surprisingly increased from 4,000 tonnes to around
little since 2010, averaging at around 1.5 million 10,000 tonnes (see Fig. 2). The share of screens in
devices from 2010 to 2019. In other words, the the total number of devices recycled by Swico has
number of devices in use in private households dropped from 44% to 30%.
4,756
4,039
2,000,000 30,000
3,418
1,800,000
5,821
25,000
5,103
1,600,000
5,694
3,416
1,400,000
1,057
7,854
20,000
2,093
606
7,990
10,353
1,200,000
7,849
1,000,000 15,000
22,183
800,000
20,929
10,000
16,380
22,056
15,702
15,550
600,000
15,428
14,162
14,412
13,692
400,000
8,888
5,000
6,737
4,536
200,000
2019 3,438
– –
2006
2007
2008
2009
2010
2011
2012
2013
2014
2015
2016
2017
2018
2019
2006
2007
2008
2009
2010
2011
2012
2013
2014
2015
2016
2017
2018
CRT TVs CRT PC monitors LCD TVs CRT devices Flat-screen devices
LCD PC monitors Laptop screens
Figure 1: Development of the number of returned Visual Display Figure 2: Development of the distribution of flat-panel and CRT
Units from 2006 to 2019. Since 2013, the annual display weights in tonnes (2006 – 2019). The volumes
number has levelled off at around 1.4 – 1.5 million. are currently approx. 14,000 t, almost 30% of the total recycled
number of electronic devices from Swico.
30 Technical report 2021 | Swico, SENS, SLRSYou can also read