Reactive nitrogen in Germany - Causes and effects - measures and recommendations - Umweltbundesamt
←
→
Page content transcription
If your browser does not render page correctly, please read the page content below
Reactive nitrogen
in Germany
Causes and effects – measures and recommendations
Summary
    ▸▸ Nitrogen and its compounds behave very differently in the environment. While atmospheric ni-
       trogen is practically inert, the oxidised compounds (e.g. nitrogen oxide or nitrous oxide) and re-
       duced compounds (e.g. ammonia) are reactive. Depending on the nature of the compound and the
       concentration, they can either be life-supporting nutrients or harmful pollutants. Therefore, these
       compounds are also referred to as reactive nitrogen in the environmental discussion.

    ▸▸ Human activity has led to massive changes to the natural nitrogen cycle over the past century
       and a drastic increase has been seen in the amounts of reactive nitrogen in the environment.
       However, the levels vary considerably worldwide, e.g. in tropical Africa, nutrient-poor soils rep-
       resent a serious problem which leads to agricultural yields remaining well below the potential
       levels.

    ▸▸ In Germany, some 4.2 million tonnes of reactive nitrogen enter into the nitrogen cycle annually, cor-
       responding to some 50 kg per person. About 6 kg per person per year is consumed in food. The re-
       mainder is contained in products, or finds it way unused into the environment.

    ▸▸ The excessive release of reactive nitrogen compounds into the environment leads to a series of
       problems which must be urgently addressed. These include the loss of aquatic and terrestrial bi-
       odiversity, the impairment of air quality, the increased release of greenhouse gases, and con-
       straints on the use of groundwater as drinking water.

    ▸▸ In Germany, considerable reductions have been achieved in nitrogen emissions from the man-
       ufacturing sector, the energy industry, traffic and transport, and also from wastewater manage-
       ment.

    ▸▸ However, reductions have been much less successful in the agricultural sector, which meanwhile
       accounts for more than 60 per cent of Germany’s nitrogen emissions.

    ▸▸ In order to stimulate a significant improvement for the environment, the levels set in the German
       government’s sustainability strategy for the nitrogen surplus should be revised. UBA recommends
       setting a target for the nitrogen surplus of 50 kg per hectare per year by 2040.

    ▸▸ The Fertiliser Ordinance (DüV) is a key instrument for the reduction of nitrogen losses from farm-
       ing into the environment. It is currently being reformulated in order to meet ecological require-
       ments. By means of additional measures in the agricultural sector, further reductions are pos-
       sible.

    ▸▸ An important contribution to achieve a balance in the nitrogen cycle can be made by changes in
       consumer behaviour, e.g. by reducing consumption of animal protein, or by avoiding the waste
       of food.

2
Contents
1. Reactive nitrogen – too much of a good thing?                                             4

2. Negative impacts of the intensified nitrogen cycle                                        7
    2.1 Threats to biological diversity                                                      7
    2.2 Threats to air quality                                                               8
    2.3 Threats to water quality                                                             9
    2.4 Climate change                                                                       10
    2.5 Effects on materials                                                                 12
    2.6 Economic effects                                                                     13

3. Needs for action and policy strategies                                                    14

4. Germany’s nitrogen cycle                                                                  19

   4.1 Budgeting nitrogen flows in Germany (2005 – 2010)                                     19
   4.2 Comparing the German cycle with European and global levels                            22
   4.3 Emissions of reactive nitrogen                                                        22
   4.4 Changes over time of key emissions                                                    23

5. Measures and recommendations for action                                                   26

   5.1 Agricultural policies                                                                 26
   5.2 Clean air policies                                                                    33
   5.3 Surface waters                                                                        33
   5.4 Energy sector and small combustion units                                              34
   5.5 Industry                                                                              35
   5.6 Transport                                                                             35
   5.7 Municipal water management                                                            36
   5.8 The influence of consumers                                                            36

6. The global dimension                                                                      39

7. Conclusions and outlook                                                                   40

Annex 1:
Amounts of nitrogen, reference periods and data source for the nitrogen flows in Chapter 4   42

Annex 2:
New target values for the nitrogen surplus                                                   44

References                                                                                   46

                                                                                                  3
1. Reactive nitrogen – too much of a good thing?
Nitrogen (N) can take various forms. Mostly it occurs in                                            In addition to the desirable effect of increasing agricul-
its molecular form as a relatively inactive gas in the at-                                          tural production, the intensified nitrogen cycle today
mosphere. However, it also occurs as reactive nitrogen                                              leads to many negative environmental impacts (Galloway
in various compounds. Paradoxically, these reactive ni-                                             et al., 2003). According to Rockström et al. (2009), the
trogen compounds can be both essential nutrients and                                                global boundaries of ecosystems have been exceeded
harmful pollutants (Box 1).                                                                         by anthropogenous impacts on these cycles (Fig. 1b).
                                                                                                    International scientists therefore recommend a marked
Over the past century, human activities have more than                                              reduction in the conversion of atmospheric nitrogen into
doubled the amounts of inactive atmospheric nitrogen                                                reactive nitrogen (Rockström et al., 2009, Fowler et al.,
being converted every year into reactive nitrogen (Fig.                                             2013). Discussions are ongoing to establish a target value
1a), and in Europe the amount has quadrupled. This was                                              which would ensure nutrition and at the same time re-
either intentional, e.g. in order to produce artificial fer-                                        main within environmental boundaries. Recent contri-
tilisers and thus ensure the food production for the grow-                                          butions state that the global conversion of atmospheric
ing world population, or was an unintended by-product                                               nitrogen to reactive nitrogen should be limited to about
from the combustion of fuels.                                                                       half the current level (De Vries et al., 2013). In its final

Figure 1a

Global trends in the production of reactive nitrogen by human activities
(as fertiliser, biological fixation or in the form of nitrogen oxides from combustion processes)

                              7000                                                                                                                         200

                                                                                                                                                           180
                              6000
                                                                                                                                                           160

                                                                                                                                                                    Nitrogen release (terragram, Tg)
World population (millions)

                              5000                                                                                                                         140

                                                                                                                                                           120
                              4000
                                                                                                                                                           100
                              3000
                                                                                                                                                           80

                              2000                                                                                                                         60

                                                                                                                                                           40
                              1000
                                                                                                                                                           20

                                 0                                                                                                                         0
                                  1900                   1920                    1940                    1960             1980               2000

                                         World population        NOx-emissions (Tg N)        Chemical fertiliser (Tg N)
                                         Total anthropogenic Nr (Tg N)     Biological N fixation in farming (Tg N)

                                                                                                                                              after Galloway et al., 2003

4
report, the Commission of Enquiry of the German Parlia- the final reports on the international assessment of the
ment on “Growth, Welfare, Quality of Life” names a sus- nitrogen cycle at European and global levels (Sutton et
tainable, less-intensive nitrogen cycle as an essential ob- al., 2011, Sutton et al., 2013).
jective (Deutscher Bundestag, 2013).
In the following chapters, the nitrogen cycle in Germany
is analysed. On the basis of the results, options are out-
lined for reducing the negative effects.
A comprehensive overview of the nitrogen flows in Ger-
many, their effects, and possible reduction measures is
provided in the report of the German Federal Environ-
ment Agency (UBA) “Integrated Strategy for the reduc-
tion of nitrogen emissions” (UBA, 2009a and b), on which
this publication is based. Further important sources are
Figure 1b
Planetary boundaries in nine sectors
For loss of biodiversity, climate change, and the nitrogen cycle (which also impacts on the other sectors) the authors find that the
boundaries have been exceeded beyond the level of uncertainty (Azote Images/Stockholm Resilience Centre)
on Climate change
uti ) Oce
p oll tified an
al an ac
c qu id
t if
ty i
(no em
e
ica
Ch
tio
n
)
ified
ozo
(not yet quant g
Stra epletion
ric
in
aerosol load
ne d
Atmosphe
tospheric
oss
(
flow oche cyc oro
Nitro
b
c
i
y
o
ty l
c
ge
l
b
e
rsi
ge
oun ica e
e
n
iv
da l)
od
m
ry
P
Bi
ho
s
l
ph
se fre
du shw
lan a us
Change
in Glo ter use
bal
Rockström et al. (2009)
5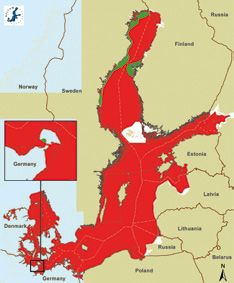
Box 1

Reactive nitrogen and the nitrogen cascade

    Reactive nitrogen includes the following compounds:
    Oxidised inorganic nitrogen compounds: Nitrates (NO3-), nitrites (NO2-) and nitrous oxide (N2O)
    Reduced inorganic nitrogen compounds: Ammonia (NH3) and ammonium (NH4+)
    Organic compounds containing nitrogen (Norg): Mainly in proteins (amino acids) in organisms
                                                     and their remains.

    Once nitrogen is in a reactive form, it can lead to effects in a variety of further chemical forms (NOx,NHy, Norg )
    in various places and with differing environmental impacts (air, soil, water, vegetation, fauna including humans).
    This is called the nitrogen cascade (Galloway et al., 2003).

     Human                                                                                                   Atmosphere
     activities
                                                 Effects on and of                 Effects of               Stratospheric effects
     Energy production                         ozone concentrations            particulate matter

                                NOx
                                                                       NH3                  NHx                              N2O

                                                                                                            Greenhouse effects
                                                              NOx                           NOy
     Food produciton
                                          NOx                                                                                N2O

                                                 Effects on agro-                 Effetcs on
                                                   ecosystems                     terrestrial
                                                                                                    NHx
                                                                                 ecosystems
                                           Crops              Animal               Plants           NOy                      N2O
                                                                                                                         (terrestrial)
                               Noganic                Soils             NO3         Soils
                                                                                                      Terrestrial ecosystems
     Human (food, fibres)
                                         NO3                                                          Effects on
                                                          Effects on surface                        coastal water
                                                                water
                                                                                                                     N2O
                                                                                                                    (aquatic)
                                                                                                                                Effects on
                                                                                                                                 oceans

                                                                                                          Aquatic ecosystems

         Indicates                         Effects on
         denitrification                  groundwater
         potential

                                                                                                                       after Galloway et al., 2003

6
2. Negative impacts of the intensified nitrogen cycle
The intensified nitrogen cycle leads to negative impacts Figure 2
in various sectors of the environment (UBA, 2011). This
Exceeding critical loads for eutrophication
chapter gives a short overview of these threats and im-
by nitrogen depositions in rural ecosystems
pacts. (More detailed information about the individual
for 2009
aspects is provided in the the corresponding references) According to current knowledge no long-term negative effects are
In addition, an outlook is provided, showing the situation expected for terrestrial biodiversity below these values
that is expected to develop by 2020 or 2030 if no further
measures are introduced.
2.1
Threats to biological diversity
The increased deposition of reactive nitrogen can lead
to the destabilisation of ecosystems and the displacement
of sensitive species. Rapidly growing, nitrophilous plant
species may out-compete other plant species. In many
cases, such changes are not immediate, but can only be
observed over time. Nearly half the species on the “Red
List” are threatened by increased nutrient depositions
(Federal Agency for Nature Conservation [BfN], 2004
and 2012). In addition, increased availability of nitro-
gen can make many plant species more susceptible to
other stress factors, e.g. frost, drought or herbivory (Bob-
bink et al., 2010).
Worldwide, nitrogen depositions represent one of the five
main threats to biological diversity (Sala et al., 2000). A
negative impact can only be excluded with certainty if
the depositions remain below ecological limit values (criti-
cal loads) for eutrophication (Fig. 2). Furthermore, acidi-
0 50 100 200
fication of ecosystems in Europe is meanwhile caused pri- km
marily by the deposition of reactive nitrogen compounds.
Under the German Government’s National Strategy on Exceeding CLoutN [kg N ha-1 yr-1]
Biological Diversity (BMU, 2007) it was therefore agreed No exceedance:52.4% ≤ 10: 41.0% 10–20: 6.0% > 20: 0.6%
that, by 2020, the deposition levels of nutrients should be
below the critical loads for all sensitive areas. This is cur- UBA-Projekt PINETI-2, FKZ 3712 63 240
rently only the case for about half of these sites.
Reactive nitrogen compounds are also responsible for considerable stress factor for plants, leading to decreased
the development of ground-level ozone. In Germany and crop yields (Mills and Harmens, 2011) and the possible
large parts of Europe, ground-level ozone represents a impairment of biological diversity.
7Figure 3
Mean-annual trends of NO2 in Germany for rural background, urban background, and traffic-
related measuring stations
For the period 1990 to 2013 (for stations that have measured over at least 9 years)
70
60
50
NO2 in µg/m-3
40
30
20
10
0
1990 1992 1994 1996 1998 2000 2002 2004 2006 2008 2010 2012
Traffic-related Urban background Rural background
Outlook: Without further measures, the exceedance of problems when trying to comply with this (Fig. 3). In ad-
critical loads for eutrophying nitrogen in Germany will dition, reactive nitrogen compounds contribute to the
only decline by about 25 per cent by 2030 in comparison formation of secondary particulate matter, which can
with the levels for 2005 (International Institute for Applied also be harmful to human health. Models show that ag-
Systems Analysis (IIASA), 2014). ricultural emissions in Germany (in particular of ammo-
nia) are related to about a quarter of PM10 particulate
matter depositions (Stern, 2013a). Nitrogen oxides play
2.2 a part in the formation of ground-level ozone, which is
Threats to air quality harmful not only for ecosystems but also for human
Nitrogen dioxide (NO2), which finds its way into the atmos- health. Ozone concentrations are still exceeding the target
phere mainly as a result of combustion processes, has value for the protection of human health at about 10 per
negative effects for human health. It can lead to inflamma- cent of the measuring stations in Germany (UBA, 2014c).
tion of the airways, among other things, and can also
increase the harmful effects of other atmospheric pol- Outlook: The emission reductions anticipated by 2020 will
lutants. In the European Union the limit value is 40 µg lead to a further reduction in air pollution levels. Never-
m-3 (annual mean), but many cities have considerable theless, without additional measures the current target
8levels for NO2, ozone, and Figure 4
particulate matter concentra-
Frequency distribution of the mean nitrate levels in groundwater
tions will still not be met at
as reported to the European Environment Agency
all stations (Jörss et al., 2014, For the periods 2008–2010 and 2004–2006
Stern, 2013b).
[%]
70 67.9% 67.9%
60
2.3
Threats to water 50
quality 40
Pure water is vital for life,
30
but nitrogen surpluses which
are not used productively by 20
14.3% 14.9%
12.3% 11.5%
plants can find their way into 10 5.4% 5.7%
groundwater, and most of our
0
drinking water is extracted ≤ 25 mg/l > 25 to ≤ 40 mg/l > 40 to ≤ 50 mg/l > 50 mg/l
from groundwater sources.
A considerable proportion of 2008–2010
groundwater reserves in Ger- 2004–2006
many have excessive levels
EEA Network: 739 joint measuring stations BMU & BMELV, 2012
of nitrates. This is a cause for
concern, because groundwa-
ter only reacts to changes very
slowly, and current levels are Figure 5
the result of inputs over past
Changes in nitrate levels in groundwater for network stations
years and decades. For the period 2008–2010 in comparison with 2004–2006
The Nitrates Report of the Ger-
[%]
man Government (Federal 30
Ministries for the Environ- 25.9%
24.7%
ment, Nature Conservation 25 23.5%
and Nuclear Safety (BMU)
and of Food, Agriculture and 20
Consumer Protection (BMELV),
15.4%
2012) shows that at some 14 15
per cent of the measuring sta-
10.5%
tions of the national measur- 10
ing network for reporting to
the European Environment 5
Agency still have concentra-
tions above the nitrate criti- 0
Marked decrease Slight decrease Stable Slight increase Marked increase
cal load of 50 mg l-1 (Fig. 4) (< –5 mg/l) (≥ –5 to < –1 mg/l) (≥ –1 bis ≤ +1 mg/l) (> +1 to ≤ +5 mg/l) (> +5 mg/l)
and that the concentrations
at 40 per cent of the measur- Total number of measuring stations: 162 BMU & BMELV, 2012
ing stations of the network
have increased (Fig. 5).
9Figure 6 ings against the Federal Republic of Germany, which could
lead to the imposition of penalties.
Eutrophication status of the Baltic Sea
Red areas have a poor eutrophication status (SubGES), green are-
as have a good status (GES). Data was analysed using the HELCOM Currently, excessive levels of phosphates and nitrates
“Eutrophication Assessment Tool” HEAT 3.0 and data for 2007– in marine waters represent – in addition to overfishing
2011. For coastal waters, the WRRL evaluation was used – the greatest ecological problem faced by the German
areas of the North Sea and the Baltic Sea. Eutrophica-
tion leads to various negative impacts on marine eco-
systems (UBA, 2013c). This is the main reason why the
coastal waters currently fail to qualify for the “good eco-
logical status” in accordance with the Framework Water
Directive and “good environmental status” in accord-
ance with the Marine Strategy Framework Directive
(Fig. 6). The Nitrate Report of the German Government
(BMU & BMELV, 2012) shows that many measuring sta-
tions near the coast have reported higher nitrate con-
centrations in comparison with the previous reporting
period (2003–2006).
In addition, high nutrient loads are one of the reasons
why many surface water bodies have no “good ecological
status”. This is mostly caused by phosphorous levels,
which are the decisive factor for surface water bodies, but
nitrogen limitation is also possible, in particular for lakes
(Dolman et al., 2012).
Outlook: Germany will not meet the requirement of the
Framework Water Directive to achieve good groundwa-
ter status for bodies of groundwater and good surface
GES SubGES Exclusive Economic Zone water status for all bodies of surface water by 2015. The
requirement under the Marine Strategy Framework Di-
Eutrophication status of the Baltic Sea HELCOM (2014)
2007–2011 – A concise thematic assess- rective to achieve a good environmental status for ma-
ment. Baltic Sea Environment Proceedings
No. 143 rine waters by 2020 will also not be met. The nitrate lev-
els in some bodies of groundwater have meanwhile
ceased to decline, and in some cases are even showing
As a consequence of high nitrate levels, water utilities an upward trend.
have already had to abandon some groundwater extrac-
tion points and access new, deeper-lying groundwater
reserves. This strategy not only leads to additional costs 2.4
but also faces limitations due to the finite groundwater Climate change
reserves and the possibility of cross-contamination be- Nitrous oxide is a reactive nitrogen compound (Fig. 7).
tween pure and tainted aquifers. It is therefore urgently It is produced as a by-product of microbial activity in
necessary to reduce inputs. Pro-active groundwater pro- soil, in particular nitrification and denitrification. Ni-
tection is much more cost-effective than a subsequent trous oxide (dinitrogen monoxide, N2O) is 265-times
drinking-water treatment (UBA, 2014f and g). The Euro- more effective as a greenhouse gas (per kilogram emis-
pean Commission has already noted the inadequate im- sion) than carbon dioxide (Stocker et al., 2013). In 2011,
plementation of the measures of the Nitrates Directive in the radiative forcing of nitrous oxide (which is a meas-
Germany and has initiated formal infringement proceed- ure of the climate impact of a greenhouse gas) account-
10Nitrous oxide is released as a by-product
of microbial processing of nitrogen in soil
11Figure 7
Monthly mean concentrations of nitrous oxide (N2O) in the atmosphere
Measuring data of UBA (Schauinsland, Zugspitze) and from Ireland (Mace Head)
with the global trend from the World Data Centre for Greenhouse Gases (WDCGG, Tokyo)
328
326
324
Nitrous oxide, N2O in ppbV
322
320
318
316
314
2001 2002 2003 2004 2005 2006 2007 2008 2009 2010 2011 2012
Schauinsland Zugspitze ZSF corr. MaceHead AGAGE World trend WMO
ed for about 30 per cent of the overall anthropogenic impacts should therefore always be taken into consider-
radiative forcing. Reactive nitrogen contributes to the ation when assessing measures to reduce nitrogen emis-
formation of ground-level ozone, which is also a green- sions (Sutton et al., 2011).
house gas. On the other hand the intensified nitrogen
cycle also has a cooling effect on the climate. The in-
creased binding of carbon compounds, the formation 2.5
of atmospheric particles that reflect incoming solar radi- Effects on materials
ation back into space, as well as the shortening of meth- Every year, the weathering and corrosion of building
ane’s lifetime in the atmosphere are key processes for materials and historical monuments makes costly re-
the cooling effect. It is currently estimated that the warm- pair and restoration work necessary. Nitrogen compounds
ing and cooling effects more or less balance out, and play a large role in this, in particular nitric acid (HNO3)
that at present the intensified nitrogen cycle has a slight and also particles consisting to varying degrees of nitro-
overall cooling effect. gen compounds.
Outlook: Since the cooling effects typically act over a much Nitrogen oxide emissions lead to increased concentra-
shorter time scale than the warming effects, the intensi- tions of atmospheric ozone which contributes to material
fied nitrogen cycle will probably contribute to global warm- damage. Ozone oxidises organic materials (polymer
ing in the long term (Sutton et al., 2013). Possible climate plastics, rubber, surface coatings) and makes these
12brittle; it also accelerate the ageing of euros (see Fig. 8; van Grinsven et al., 2013). This order of magnitude
and weathering of metals. The in- has since been confirmed by other studies (Stokstad, 2014). Research findings
creased risk of material damage by indicate that the macroeconomic costs of the increased use of nitrogen consider-
atmospheric pollutants (e.g. reactive ably exceed the benefits (Sutton et al., 2011, van Grinsven et al., 2013).
nitrogen compounds) can be deduced
from comparisons of the corrosion Outlook: In future it would also make economic sense to reduce the use of
rates in regions with low and high lev- reactive nitrogen compounds, and to consider the benefits of necessary uti-
els of pollution (urban and industrial lisation more carefully. A sustainable nitrogen cycle not only offers envi-
areas). In recent decades, overall rates ronmental benefits, but is also economically advantageous, not least be-
of material damage in Germany have cause the agricultural sector still offers considerable potential for effective
declined considerably, above all due and relatively inexpensive measures for the avoidance of emissions of re-
to reductions in sulphur emissions. active nitrogen (in particular ammonia and nitrates).
However, no comparable success has
so far been achieved for emissions of
nitrogen compounds. In the year
2000, the corrosion rates were still
1.5 to 5 times greater than the back-
ground corrosion rates, with the af-
fected areas covering large parts of
Germany. There has been no funda-
mental change in this situation since
the year 2000.
Outlook: Due to the reduced levels Figure 8
of atmospheric pollution by 2020
Maximum and minimum estimates of costs and benefits
(see 2.2), the weathering and corro-
(here negative values) associated with the use of reactive
sion rates of materials will decline
nitrogen (values for 2008) in four sectors in the EU-27
further, but will remain well above
background rates. As a result, soci-
ety will continue to face high costs
350
in future.
300
250
2.6
Costs in EU27 [€ bn. p.a.]
Economic effects 200
The use of reactive nitrogen com-
150
pounds helps to increase crop yields.
It is estimated that the benefit in the 100
form of higher crop yields in the EU is
between 20 and 80 billion euros per 50
year (see Fig. 8). On the other hand, 0
there are also societal costs, which
arise due to harmful effect on human -50
health and to damage to ecosystems. -100
While it is not possible to quantify the Human health Ecosystems Climate Farming
damage precisely, van Grinsven et al.
(2013) estimate that the intensified max min
nitrogen cycle leads to societal costs
of several tens or hundreds of billions van Grinsven et al., 2013; ES&T; 47, 3571−3579
133. Needs for action and policy strategies
Since the 1980s, the negative environmental impacts of 1997). In 2009, UBA produced an integrated strategy for
the intensified nitrogen cycle have been a topic of discus- the reduction of nitrogen emissions which was based on
sion. The sustainable reduction of nitrogen pollution be- updated values for nitrogen flows and which included fur-
came an important objective in environmental policies. ther measures (UBA, 2009b).
A key role was played by international marine conserva-
tion conferences and the Convention on Long-Range Trans- In the past, effective measures have been implemented to
boundary Air Pollution (see Box 3). In 1987, the 2nd In- reduce losses of reactive nitrogen into the environment, in
ternational North Sea Conservation Conference introduced particular in the field of wastewater treatment and through
one of the first quantitative nitrogen reduction targets – the reduction of emissions of nitrogen oxides in the manu-
namely to halve the anthropogenous nitrogen depositions facturing and transport sectors. However, there have not
by 1995 in comparison with the 1985 levels. This target been comparably effective measures in the agricultural
was only reached in Germany a few years ago. The draft sector.
environmental policy programme of the Federal Environ-
ment Ministry in 1998 gives prominence to the problems Despite some successes, important reduction targets have
caused by nitrogen and proposes a reduction of the nitro- either not been met or it is already clear that it will not be
gen surplus in agriculture to 50 kilograms of nitrogen per possible to meet the targets set for future years unless ad-
hectare per year (kg N ha-1 yr--1) as a strategic target. ditional measures are implemented. For example, the
mean value for agricultural nitrogen surpluses for recent
As a central indicator for the sustainability of farming, years has been about 97 kg N ha-1 yr-1 (see Box 2) – well
the nitrogen surplus (farm-gate balance; cf. Box 2) was above the 80 kg N ha -1 yr-1 which should have been
included in the indicator set of the Sustainability Strat- achieved by 2010. Other examples of important policy
egy (2002) and the National Strategy for Biological Di- targets and critical loads which will probably not be met
versity (2007). As an interim goal, the German Govern- are summarised in Chapter 2, such as achieving good
ment specified that by 2010 the surplus for agricultural groundwater quality by 2015.
land should be limited to 80 kg N ha-1 yr--1. Thereafter,
the quantitative target was to be further reduced, which The failure to meet targets is due in part to the fact that a
has not yet been done. This step would require a broad comprehensive solution to the problems posed by nitro-
public discussion. UBA proposes as an ambitious but gen is hardly possible by implementing separate technical
achievable target that the nitrogen surplus in the farm- measures in individual areas. Rather, it is necessary to
gate balance should be reduced to 50 kg N ha-1 yr--1 by adopt an integrated approach to the various problems in
2040 (cf. Annex 2). all relevant policy areas (policy integration). In addition it
is also important that we all change our behaviour (UBA,
Regionally, the nitrogen surpluses in Germany show con- 2013a). A solution would be well worth while, because if
siderable differences, with very high values in regions with it were possible to achieve an effective reduction in the
high livestock numbers (Fig. 9). amounts of reactive nitrogen released into the environ-
ment this would lead to positive effects regarding various
However, nitrogen emissions are not restricted to the agri- other environmental problems (cf. Nitrogen cascade, Box
cultural sector. Reactive nitrogen is also introduced into 1). The issue of nitrogen should therefore be tackled with
the environment by modes of transport, wastewater treat- a coordinated and efficient combination of complementa-
ment plant and industrial plant. In 1993, a combined ry instruments. The 7th Environmental Action Programme
working group of the German government and the laender of the EU, which came into force in January 2014, and
carried out the first quantification of Germany’s nitrogen which has a binding character for EU institutions (Council,
cycle and began the development of a nitrogen reduction Commission and Parliament) specifies the main aspects of
strategy. The Nitrogen Reduction Programme eventually the EU environmental policy until 2020. One such objec-
published in 1997 proposed measures for all relevant sec- tive is a sustainable und resource-efficient control of nu-
tors (Alfred Töpfer Academy for Nature Conservation (NNA), trient cycles (nitrogen and phosphorous). The closer
14Figure 9
Distribution of the surpluses of the nitrogen field balance (in kg N ha-1 yr-1) in the
administrative districts and towns in Germany (mean for 2009 to 2011)
The mean value of the surpluses of the nitrogen balance for Germany fo 2009–2011
is 65 kg N ha-1 yr -1; the corresponding mean value of the gross nutrient (farm-gate) nitrogen balance is 96 kg N ha-1 yr -1 (Box 2)
bis 50 51–70 71–90 91–110 110–151
bis 50 51–70 71–90 91–110 110–151
(Bach, 2010, Bach, 2014).
harmonisation at national and European levels could project started in 2012: “Analysis and evaluation of the
be supported by an explicit nitrogen strategy of the Ger- nitrogen budget in Baden-Württemberg”1.
man government which included demanding quantitative
targets (indicators) and place demands on all sectors. In-
itiatives in Germany at the laender level are also tack-
ling the problems raised by nitrogen, for example the
1
Cf.: http://www.lubw.baden-wuerttemberg.de/servlet/is/56176/
15Box 2
The nitrogen surplus in the agricultural sector
The nitrogen surplus, calculated as gross nutrient balance (or farm-gate balance), is an indicator of the nitrogen loss-
es from agriculture; calculated from the difference between the mass flow of nitrogen into agriculture (e.g. chemical
fertiliser, animal feed imports, biological nitrogen fixation, and atmospheric deposition of oxidised nitrogen) and the
mass flow of nitrogen in products out of agriculture (marketed animal and plant produces). The farm-gate balance is
usually expressed in kg nitrogen per hectare farmland per year (kg N ha-1 yr-1).
The surplus is a calculated value that cannot be measured directly, because it involves large losses to the environ-
ment. The most important loss path is denitrification (i.e. the conversion of reactive nitrogen into atmospheric ni-
trogen; cf. Box 4), followed in equal parts by the emission of reactive nitrogen into the atmosphere and the loss of
nitrates into groundwater and surface waters. The smaller the surplus, the lower are the nitrogen losses to the en-
vironment and therefore the lower are the harmful impacts. A sustainable and productive farming sector will always
lead to a nitrogen surplus, because it operates in an open system; the objective is to minimise this. The following
policy goals were determined for the nitrogen surplus (gross-nutrient or farm-gate balance):
Sustainability strategy: Reduction to 80 kg N ha-1 agricultural land by 2010, further reduction by 2020.
National Strategy for Biological Diversity: By 2010 the nitrogen surpluses in the gross nutrient balance should be
reduced to 80 kg N ha-1 yr-1, with a further reduction by 2015.
Figure B 2.1 (top) shows the progress of the moving three-year mean since 1990; the value for 2010 is 96 kg N ha-1
yr-1, which is 16 kg N ha-1 yr-1 above the target value. The marked initial decrease is primarily due to reduction in
livestock levels in the early 1990s following German unification; the relatively slight reduction over the past ten
years can be explained by an increase in yields while the use of chemical fertiliser remained roughly constant. In a
European comparison, the German value is in the upper third of the surpluses; the EU27 average is about 50 kg
N ha-1 yr-1 (Eurostat, 2011). The lower graph shows the nitrogen efficiency (or nitrogen productivity) over time. This
expresses the ratio of nitrogen outputs in agricultural products over nitrogen inputs. The nitrogen efficiency of the
German agricultural sector has increased steadily over the past 20 years from less than 40 per cent to about 50
per cent.
In contrast to the farm-gate balance, the field balance (as currently required in the Fertiliser Ordinance) does not
take atmospheric losses into account. It therefore only represents a part of the farm-gate balance. Depending on the
method used, the value for the field balance in Germany is usually 10 to 30 kg N ha-1 yr-1 lower than the corresponding
farm-gate balance (UBA, 2009a, Bach, 2010, Osterburg and Techen, 2012).
Figure B 2.1 (right): Top: Nitrogen surplus (farm-gate balance); the green line shows the moving three-year mean;
the red bar show the indicator values for 1950 and 1980 (not directly comparable with later values due to a change
in methodology); Bottom: Nitrogen efficiency. Data: http://www.bmelv-statistik.de/index.php?id=139 (as of:
04/2014), (UBA, 2011); own diagram
16180
160
140
N-balance surplus [kg N ha-1 yr-1]
120
100
80
60
40
20
0
1950 1990 1992 1994 1996 1998 2000 2002 2004 2006 2008 2010 2012
0.6
0.5
0.4
N-Efficiency
0.3
0.2
0.1
0
1990 1992 1994 1996 1998 2000 2002 2004 2006 2008 2010 2012 2014
17Box 3
Environmental targets for reactive nitrogen compounds in international conventions and
agreements
Baltic Marine Environment Protection Commission – Helsinki Commission, HELCOM
In order to restore the good ecological status of the Baltic marine environment by 2021, HELCOM agreed on
the Baltic Sea Action Plan in 2007, which contains quantitative reduction targets for nutrient inputs. These
targets were subjected to a scientific review and revised targets were agreed at the HELCOM Ministers meet-
ing in October 2013. The goal of the Baltic Sea Action Plan is to limit the inputs of reactive nitrogen into the
Baltic Sea by water and by air to some 800,000 t N yr-1 by 2021.
Based on best available scientific knowledge, at or below this value there would be no more significant eu-
trophication of the Baltic Sea. Under the Baltic Sea Action Plan, Germany is required to reduce its nitrogen
loads from water and air by a total of 7,670 t N yr-1 by 2021 in comparison to the period 1997 to 2003 – cor-
responding to some 10 per cent of the current levels.
Further information: www.helcom.fi
Convention on Long-range Transboundary Air Pollution, CLRTAP
A fundamental objective of the Convention on Long-range Transboundary Air Pollution initiated in 1979 was to
limit and, as far as possible, gradually reduce and prevent air pollution. In 2012, a revised Gothenburg Proto-
col included national emission reduction commitments to be achieved in 2020 and beyond (UBA, 2014b).
Germany committed itself to reductions of national emissions of nitrogen oxides (NOx) and ammonia (NH3) of
39 % and 5 %, respectively, by 2020, relative to the levels in 2005. In the case of ammonia this only represents
a minor reduction.
Further information: www.unece.org/env/lrtap/lrtap_h1.html
Convention on Biological Diversity, CBD
The Convention, agreed on in Rio de Janeiro in 1992, has as its main objectives the conservation of biodiversity
and the sustainable use of its components, and fair and equitable sharing of benefits arising from genetic re-
sources. In 2010, a strategic plan was formulated with twenty biodiversity targets (Aichi Targets) to be achieved
by 2020. Target 8 is that, pollution, including from excess nutrients, should have been brought to levels that
are not detrimental to ecosystem function and biodiversity by 2020.
Further information: www.cbd.int
184. Germany’s nitrogen cycle
A budget of the emission sources and flows of reactive ni- ▸▸ Emissions of reactive nitrogen from the power indus-
trogen compounds in the environment is the basis for the try, manufacturing, households, and the transport
development, assessment and selection of measures and sector, approx. 440 Gg N yr-1 (UBA, 2012),
instruments in terms of their emission reduction poten-
tials and possible side-effects in other environmental me- ▸▸ Biological N-fixation in agriculture (BMEL, 2013) and
dia. In order to ensure comparability of national budgets, in terrestrial ecosystems (own estimate), totalling ap-
methodology guidelines were developed under the Con- prox. 275 Gg N yr-1
vention on Long-Range Transboundary Air Pollution (CL-
RTAP, 2013), on the basis of which the budget for Germa- ▸▸ The transboundary import of nitrogen in rivers, ap-
ny was drawn up and continues for the year 2009 (UBA, prox. 320 Gg N yr-1 (Fuchs et al., 2010, UBA, 2014a),
2009a). Wherever it was possible the budget was updated and in the atmosphere, approx. 250 Gg N yr-1 (Fagerli,
and refers to the reference period 2005–2010. The key 2012).
data sources are listed in Annex 1.
Important flows within the budget are the 890 Gg N ap-
In December 2013, legislative proposals for the revision plied to agricultural areas every year as manure and
of the EU clean air policies were presented (Environment the national sale of chemical fertiliser of 1640 Gg N yr-1
Directorate General of the European Commission [DG En- (BMEL, 2013), which corresponds to most of the indus-
vironment], 2013). Amongst these the EU Commission trially fixed nitrogen. 665 Gg N is available in agricul-
recommends the generation of such a budget (described tural products for food consumption or for the produc-
above) in order to make it possible to adopt targeted meas- tion of food products.
ures. Other European countries are also drawing up regu-
lar national nitrogen budgets (Heldstab et al., 2013, Held- The removal of reactive nitrogen from the cycle has not
stab et al., 2010). been sufficiently recorded. Some 900 Gg of dissolved
nitrogen compounds are introduced annually into ma-
rine and coastal ecosystems via rivers (without taking
4.1 retention in surface water bodies into account), either
Budgeting nitrogen flows in Germany directly or through neighbouring countries (Fuchs et al.,
(2005–2010) 2010). The atmosphere transports some 560 Gg reactive
The most important (anthropogenous) nitrogen flows nitrogen every year into other countries (Fagerli, 2012).
in Germany are shown in Figure 10. About 4200 Gg of Denitrification also accounts for a significant removal
reactive nitrogen2 find their way into the national ni- of reactive nitrogen (cf. Box 4). From wastewater treat-
trogen cycle in Germany every year, either because mo- ment, 340 Gg N yr-1 are released into the atmosphere as
lecular nitrogen is converted into a reactive form or be- molecular N2 (German Association for Water, Wastewater
cause reactive nitrogen is imported. The most important and Waste (DWA), 2011). Denitrification in surface wa-
inputs into the national cycle are: ters, in agro-ecosystems, in natural and semi-natural
ecosystems and in groundwater can only be approxi-
▸▸ The industrial production of ammonia from atmos- mately specified based on current data3 Finally, a num-
pheric nitrogen for chemical production, accounting for ber of industrial products (e.g. building materials, paints)
approx. 2700 Gg N yr-1 (Verband der Chemischen Indus- also contain reactive nitrogen. According to first estimates
trie e. V. (VCI), 2012), about 10 kg reactive nitrogen per person per year are
used for the production of these products (Sutton et al.,
▸▸ The import of animal feed, approx. 370 Gg N yr-1 (Fed- 2011, Gu et al., 2013)4. However, the material flows of
eral Minister of Food and Agriculture (BMEL), 2013), the reactive nitrogen contained in these products (interna-
2
Gg = gigagram, correspond- 3
There is a difference of approx. 750 Gg N yr-1 between the nitrogen surplus in the agricultural 4
4 In Germany, every year approx. 2700 Gg N is in-
ing to 1000 tonnes sector and semi-natural terrestrial ecosystems and the determined inputs into the atmosphere dustrially fixed and 1640 Gg N of this is marketed as
and surface waters. A large part of this is denitrified. However, this estimate represents only a chemical fertiliser. The remaining 1000 Gg N yr-1 (or
first approximation because (i) data from various sources are being combined, and (ii) the pos- 12.5 kg N per person per annum) is used for further
sible accumulation of reactive nitrogen and the time-delay for the passage into the groundwater industrial processing.
has not been taken into account.
19tional trade, product storage, waste disposal, recy-
cling) have so far hardly been documented, so that
there are considerably gaps in the budget in this case.
Box 4
Denitrification
Nitrates are broken down in the environment (as part of the nitrogen cascade), generating molecular nitrogen
and traces of nitrous oxide. This denitrification takes place in surface waters, in soils (unsaturated zone) and in
aquifers (saturated zone), as well as in wastewater treatment plant. The nitrate reduction takes place under an-
aerobic conditions, mostly through the action of micro-organisms. Reduction agents may be:
▸▸ organic compounds (heterotrophic reduction) or
▸▸ inorganic compounds, in particular iron sulphides (autolithotrophic reduction).
In soils and surface waters, only the reaction with organic compounds plays a role. Due to the conditions
(presence of oxygen and a surplus of nitrates), the reduction process is rarely complete. There is a regular
supply of more organic compounds due to the decomposition of biomass. The situation is different in aq-
uifers. Here there are usually only low levels of organic carbon, which limits the scope for reduction con-
siderably. And if nitrates are degraded by the oxidation of iron sulphides, then the reduction capacity will
gradually be lost (because no new mineral can be formed or supplied from elsewhere). The result is that within
a relatively short period there can be a permanent increase in the nitrate concentration (Bergmann et al.,
2014, Hansen et al., 2011).
Denitrification makes a significant contribution to decreasing the burden of reactive nitrogen. But it must
also be taken into account that the reduction of nitrates is also linked with undesirable consequences (e.g.
the release of nitrous oxide or the depletion of non-regenerative reduction potential), and that the agricultural
sector is losing valuable fertiliser.
A regional quantification of denitrification remains very difficult and this is currently one of the main uncer-
tainties in drawing up nitrogen budgets (Groffman, 2012, Schlesinger, 2009, Bach, 2010).
20Figure 10
The key flows of reactive nitrogen in Germany (in Gg N yr-1)
Imports Exports
250 Atmosphere Lightning N tot 5
560
!
2680
230
570
270
715
205
302)
35
55
5
5
Goods4)
!
! ! !
Transport
Power industry and
industry 5) Mineral
fertiliser
1640 !
Resources
2651)
Feed imports 365
!
Agricultural soils Livestock (semi-)
husbandry natural
Farm fertiliser 890 ecosystem
Agricult. Feed from Germany 1685
products
6653) !
Consumers Hydrosphere
Built-up area
Terrestrial Marine and
ecosystems coastal ecosystems
Export with rivers6) 420
!
Import with rivers6) 320
4806)
425
30
Organic
fertiliser !
60 460
Surface water bodies
Wastewater/ Waste
80
Groundwater
30
Atmospheric emissions Nitrogen fixation Deposition Transport with/in water bodies Other material flows
All values are rounded to 5 Gg N yr-1. Where data are available, means are given for 2008-2010. Otherwise the value for 2010 was used or the last available value. The data for surface
waters are for the period 2006-2011, and the data for atmospheric depositions for 2005-2007. For details cf. Annex 1.
The import of manure (mainly liquid manure and dry poultry manure) and the import of biomass as fermentation substrate (as well as possible exports) are not contained in the
budget. Over the observation period this probably represents an omission of at least 20 Gg N yr-1. Flows of plant fermentation residues within the agricultural sector are also not
taken into account (ca. 100-150 Gg N yr-1).
The triangles indicated indicate important opportunities for measures in Germany (cf. Chapter 5).
1) Includes industrial crops (sugar beet, tobacco, fibre plants, etc.) and a first estimate for the nitrogen flow due to harvested wood (70 Gg N yr-1).
2) Only the Baltic Sea.
3) Includes all animal and plant products with the exception of animal feed and industrial crops. Losses from further processing, marketing and consumption are still included.
4) The nitrogen flow in industrial products cannot be quantified at present.
5) Includes small domestic heating units in households.
6) Allowance cannot be made for retention in bodies of surface water due to lack of data for the observation period. Older evaluations show that, depending on the distance flowed
and other factors, retention (and in particular denitrification) can account for up to 50 per cent (Fuchs et al., 2010).
214.2
Comparing the German N-cycle with
European and global levels
Quantifications of the nitrogen cycle are also available natural processes make a much greater contribution to
for the global and the European levels (Fowler et al., 2013, the nitrogen cycle at a global level, due to the large areas
Sutton et al., 2011). A comparison of the estimates for covered by oceans, than they do in Europe and Germany,
the entry of reactive nitrogen into the cycle in Germany, where anthropogenous effects are more intensive.
with the European and global levels (Tab. 1) shows that
Table 1
Rate of input of reactive nitrogen into the environment (in 1000 Gg N yr-1)
Global Europe Germany
Biological N-fixing 58.0 (14.0 %) 0.3 (1.5 %) 0.1 ( 2.0 %)
Lightning 5.0 (1.0 %)
N-fixing in oceans 140.0 (34.0 %) 0.5 (2.5 %)
Sub-total 203.0 (49.0 %) 0.8 (4.0 %) 0.1 ( 2.0 %)
Haber-Bosch 120.0 (29 %) 16.6 (74 %) 2.7 (74 %)
Biological N-fixing in farming 60.0 (15 %) 1.0 (4 %) 0.2 (6 %)
Fodder imports 0.5 (2 %) 0.4 (10%)
Combustion processes 30.0 (7 %) 3.7 (16 %) 0.4 (10 %)
Sub-total 210.0 (51 %) 21.8 (96 %) 3.6 (98 %)
Total 413.0 (100 %) 22.6 (100 %) 3.7 (100 %)
Area-related [ kg ha-1 ] 8 53 103
Global: Fowler et al. (2013), Europe: Sutton et al. (2011), Germany: this study
4.3
Emissions of reactive nitrogen
In addition to the intensity of the nitrogen cycle (i.e. the the past 20 years, despite the fact that measures adopt-
total amount of nitrogen in the cycle), the emissions of ed to reduce agricultural emissions have shown some
reactive nitrogen are an important parameter in view of effects. In the 1990s, less than half the total emissions
the direct relationship to the effects. Table 2 presents the of reactive nitrogen compounds were from agriculture
mean annual emissions in Germany for the most impor- (Eichler and Schulz, 1998). This highlights how impor-
tant nitrogen compounds and the key emitting groups. tant it is to use existing reduction potential, particular
in agriculture, and to adopt appropriate measures.
The figures show that agriculture has meanwhile become
the most important sector for the release of reactive ni-
trogen into the environment. Due to the greater reduc-
tions achieved in other sectors, the relative share of re-
maining emissions caused by agriculture increased over
22Table 2
Proportions of the main N-compounds and emitting groups in the mean annual emissions
affecting air and surface waters in the current budget period
Air Water
Total
NOx NH3 N2O NO3–/NH4+ %
[Gg N yr-1]
Agriculture 33 435 88 424 980 63
Traffic 192 13 2 207 13
Industry/ Energy sector 166 15 27 10 218 14
Households/ Wastewater
treatment plants/ Surface 21 1 6 135 163 10
run-off*
Total
412 464 123 569 1568 100
[Gg N yr-1]
% 26 30 8 36 100
* Includes urban systems and the entire surface run-off, because currently no distinction can be made between agricultural and other areas. The atmospheric emissions include
small domestic combustion units.
4.4
Changes over time of key emissions
Since 1990, the emissions of reactive nitrogen into the the transport sector. In particular, the introduction of
air have decreased considerably (Fig. 11). The greatest increasingly stringent emission controls for road vehi-
reduction, of more than 50 per cent, was achieved in cles (cf. Box 4) led to a significant reduction in exhaust
Figure 11
Changes over time of NOx-emissions from transport and the energy sector and of NH3-emissions
from agriculture into the air
600
500
Emissions [in Gg N yr-1]
400
300
200
100
0
1990 1995 2000 2005 2010
Agriculture (only NH3) Traffic and transport Energy sector
UBA, 2014d
23emissions – despite an increase of 61 per cent in goods The ammonia emissions from agriculture showed a sharp
transport and 31 per cent in private transport between decline in the early 1990s, which is due primarily to the
1991 and 2013. reductions in livestock numbers. Subsequently, the aver-
age decrease has been less than one per cent per year.
The emissions in the energy sector also showed a marked
decline until the early 2000s, but there was then a level- The inputs of nitrogen into surface water bodies have also
ling out or even a slight increase, attributable to the in- been reduced considerably since the mid-1980s (UBA,
creased introduction of biogas-fired combined heat and 2009a). However, in recent observation periods the levels
power systems and of biomass-fired power stations, among have flattened out (Fig. 12). In view of the greater reduc-
other factors. Biogas experienced a boom, especially be- tions achieved in other sectors, the relative contribution
tween 2007 and 2012. However, for each kilowatt-hour of agriculture to nitrogen inputs into surface waters in-
of power generated by a combustion engine in a biogas-co- creased continually from 1983 to 2011 – from 54 per cent
generation unit, more NOx-emissions are released than to 79 per cent (Fuchs et al., 2010, UBA, 2014a und g).
in a large power station, which is one of the main reasons
for the rise in emissions from industrial energy generation.
Figure 12
Changes over time of nitrogen inputs into bodies of surface water
1200
1000
800
Gg N yr-1
600
400
200
0
1983–1987 1988–1992 1993–1997 1998–2002 2003–2005 2006–2011
Fuchs et al., 2010, UBA, 2014a
24Box 5
Formation of reactive nitrogen by combustion
Burning fuel in small and large combustion plants, in gas turbines and engines, or the incineration of waste
can generate reactive nitrogen (as nitrogen oxides, NO x ), and depending on the nature of the processes
involved, three types are distinguished:
▸▸ Fuel NOx: Nitrogen oxides generated as a result of the nitrogen contained in the fuel. If low-nitrogen fuels
are used, then the observed level of NOx emissions depends on the extent to which the other two formation
processes are effective.
▸▸ Thermal NOx: With rising combustion temperatures, an increasing proportion of the molecular nitrogen (N2)
from the combustion air is converted to NOx. Thermal NOx dominates the emissions at high combustion tem-
peratures, with local temperature peaks being particularly relevant. Since the energy efficiency of systems
(energy consumed in useful work/total energy input) increases with the mean combustion temperature,
there is a conflict of goals. This can be resolved by measures to avoid local temperature peaks in combination
with effective end-of-pipe systems to reduce the emission of nitrogen oxides.
▸▸ Prompt NOx: Fuel radicals formed by the combustion process cause molecular nitrogen (N2) from the com-
bustion air to be converted to NOx. Prompt NOx is generally only of relatively minor importance.
The emissions of NOx can therefore be reduced by the use of low-nitrogen fuels, by optimisation of the com-
bustion processes, and by exhaust gas treatment (reduction of nitrogen oxides).
EU emission control standards for road vehicles:
Table B 5.1: Overview of NOx-emission limit values in accordance with EU emission standards.
Units Private vehicles / LGV HGV
Euro 4 Euro 5 Euro 6 Euro IV Euro V Euro VI
Petrol g/km 0.08 0.06 0.06
Diesel g/km 0.25 0.18 0.08
Diesel g/kWh 3.5 2.0 0.4
However, in some cases the values determined in the idealised test procedures can be much lower than real
driving emissions. This difference is to be reduced by new, adapted test cycles. As a further improvement,
portable emissions measurement systems (PEMS) should be employed.
255. Measures and recommendations for action
The negative environmental impacts of reactive nitrogen ▸▸ In addition, international cooperation is necessary to
depositions and the failure to meet environmental targets further reduce transboundary transport of reactive ni-
highlight the urgent need for further measures to reduce trogen compounds in rivers and in the atmosphere.
losses of reactive nitrogen to the environment.
The problem of reactive nitrogen calls for a consistent 5.1
combination of a range of instruments and will involve Agricultural policies
changes to regulatory systems, together with the intro- The budget in Chapter 4 show that about two-thirds of
duction of economic incentives, and the provision of im- the losses of reactive nitrogen into the environment come
proved information and advice at all levels of society. from agriculture. The realignment of agricultural pol-
Some climate change mitigation measures can lead to icies is therefore essential for the reduction of the nitro-
positive synergy effects. For example, improved energy gen burden. The most cost-efficient measures in Germany
efficiency or changes to mobility systems may also help to and in many other European countries are meanwhile
improve the nitrogen situation. However, in other cases to be found in the agricultural sector (International In-
conflicts can arise, as described earlier with the increased stitute for Applied Systems Analysis (IIASA), 2014, UBA,
use of biomass as a source of energy. 2009a).
The national budget (Fig. 10) shows points in the cycles In order to tackle the challenges raised by reactive nitro-
where additional measures should be adopted in Germa- gen and achieve sustainable, competitive and productive
ny in order to achieve significant reductions in environ- agriculture, the existing regulatory provisions and subsi-
mental impacts caused by reactive nitrogen: dy policies need to be adapted and harmonised (Möckel
et al., 2014). The Agriculture Commission at the Federal
▸▸ The largest reduction potential in absolute terms is in Environment Agency (KLU) has made significant propos-
the agricultural sector and in the consumption of farm als in this respect (KLU, 2013b). These include limits to
produce. The proposed reduction of the nitrogen sur- livestock densities, maximum nitrogen surpluses, a min-
plus in the farm-gate balance from 95 kg N ha-1 yr-1 at imum proportion of legumes in the crop sequence as a
present to 50 kg N ha-1 yr-1 in 2040 corresponds to a necessary requirement for entitlements to subsidy pay-
reduction of the total surplus by some 700 Gg N yr-1. A ments, and the introduction of grazing premiums. De-
key contribution to increasing the nitrogen efficiency spite some improvements and the paradigm shift that
could be made by avoiding unproductive losses and has been initiated, the agreed reforms of the EU Common
reducing levels of animal protein-feed, e.g. if the general Agricultural Policy on their own will hardly ease the ni-
public adopted a more plant-based diet with and over- trogen situation. In some regions, growing energy maize
all reduction in meat consumption (UBA, 2013a). The will add to the problems, in particular because of the re-
more efficient fertilisation with manure and a reduc- active nitrogen contained in the vegetable part of fer-
tion in the demand for fodder would also make it pos- mentation residues and in many cases the increased po-
sible to reduce the use of chemical fertilisers. tential for nitrate leaching after maize planting in autumn.
Finally, ploughing up grassland leads to the loss of most
▸▸ Emissions from industry, the energy and transport sec- of the assimilated nitrogen to the groundwater or to the
tors, and households could also be reduced by 2030 if atmosphere. It is therefore essential to avoid the plough-
appropriate measures are introduced. ing up of pastures as far as possible. Policy changes are
also needed in these sectors. The proposals of the Agri-
▸▸ The levels of reactive nitrogen in industrial products are culture Commission at UBA should therefore be taken
still inadequately documented (cf. Chapter 4). However, into account by the German Government and the laender
it is clear that more efficient use and increased reuse when implementing the measures nationally and when
could lead to a reduction in the overall demand for in- formulating further reforms (KLU, 2013a and b).
dustrial nitrogen (Gu et al., 2013).
26The example of Denmark shows that the introduction of ▸▸ The inclusion of all organic fertilisers (including fer-
binding measures coupled with detailed surveys and ef- mentation residues) in the upper application limit of
fective implementation makes it possible to achieve con- 170 kg N ha-1;
siderable improvements in the nitrogen situation. With-
out impairing the competitive situation of farmers, it has ▸▸ Determining standard storage capacity so that liquid
been possible to reduce ammonia emissions in Denmark manure can be held for a minimum storage period of
by 40 per cent since 1990. The nitrogen surplus also went nine months.
down by some 40 per cent over the same period. Mean-
while, the improvements are also being reflected in low- In view of the fact the groundwater nitrate levels in Ger-
er levels of nitrate leaching and nitrogen depositions. many are still frequently above critical levels, giving rise
to the prospect of EU infringement proceedings, al the
In the following, some important fields of action are out- recommendation should be considered in the discussion.
lined where steps can be taken to tackle the challenges.
The important objective is to increase nitrogen efficiency. In a joint statement, the scientific advisory boards for
agricultural policies (WBA) and for fertilisation matters
Amendment to the Fertiliser Ordinance (WBD) together with the Council of Experts for Environ-
The Fertiliser Ordinance is a central control instrument mental Matters (SRU) recommended a revision of the Fer-
for dealing with nitrogen in the agricultural sector, and tiliser Ordinance along the lines of the basic principles
therefore for reducing nitrogen surpluses. Currently, a already developed; they also made further additional pro-
new version of this Ordinance is being prepared. The posals (WBA, WBD & SRU, 2013). For example, in the Fer-
Federal Minister of Food and Agriculture has set up an tiliser Act (Article 3, para. 2), the requirement for good
evaluation group, organised by the Thünen Institute, with agricultural practice should explicitly include the avoid-
representatives of the Federal State ministries of agricul- ance of threats to natural ecosystems (WBA, WBD & SRU,
ture, the Federal Ministry for the Environment, Nature 2013).
Conservation, Building and Nuclear Safety, and UBA
(Osterburg and Techen, 2012). The key proposals cover By implementing these recommendations it would be
the following aspects: possible to reduce the overall surplus in the agricultural
sector by 20 per cent or some 300 Gg N yr-1 (Fig. 13). This
▸▸ Improved fertilisation planning and nutrient balances, would make it possible to achieve the national target of
in order to allow the optimisation of the nutrient cycle limiting the nitrogen surplus to 80 kg N ha-1 yr-1 (cf. Box 2).
(including a plausibility check for the N-removal in In order to further reduce impacts on ecosystems, the
basic fodder); Fertiliser Ordinance should be amended to include regu-
lations for the following requirements:
▸▸ An obligation to receive advice after repeatedly exceed-
ing maximum nutrient levels; ▸▸ Reducing maximum limit levels
Limits for fertiliser should be based to a greater extent
▸▸ Limitation of the period in which manure can be spread; on the actual nutrient needs of the crop, and a reduction
of the upper limit for the application of nitrogen in ma-
▸▸ Requirements for immediately working manure into nure in order to ensure its efficient utilisation (Gutser
untilled land and the use of suitable application equip- et al., 2010).
ment, i.e. the ground-level, low-emission application
of liquid manure;
27You can also read